science mapping at the interface between the science citation
TRANSCRIPT
Mapping Interdisciplinarity at the Interfaces between
the Science Citation Index and the Social Science Citation Index
Loet Leydesdorff
University of Amsterdam, Amsterdam School of Communications Research (ASCoR),
Kloveniersburgwel 48, 1012 CX Amsterdam, The Netherlands
[email protected] ; http://www.leydesdorff.net
Abstract
The two Journal Citation Reports of the Science Citation Index 2004 and the Social
Science Citation Index 2004 were combined in order to analyze and map journals and
specialties at the edges and in the overlap between the two databases. For journals which
belong to the overlap (e.g., Scientometrics), the merger mainly enriches our insight into
the structure which can be obtained from the two databases separately; but in the case of
scientific journals which are more marginal in either database, the combination can
provide a new perspective on the position and function of these journals (e.g.,
Environment and Planning B—Planning and Design). The combined database
additionally enables us to map citation environments in terms of the various specialties
comprehensively. Using the vector-space model, visualizations are provided for
specialties that are parts of the overlap (information science, science & technology
studies). On the basis of the resulting visualizations, “betweenness”—a measure from
social network analysis—is suggested as an indicator for measuring the interdisciplinarity
of journals.
Keywords: journal, visualization, vector space, interdisciplinarity, citation.
1. Introduction
In another context I was recently asked to contribute to a special issue of Environment
and Planning B—Planning and Design about information visualization as a potential
companion of geo-visualization (Leydesdorff, in preparation). The journal Environment
1
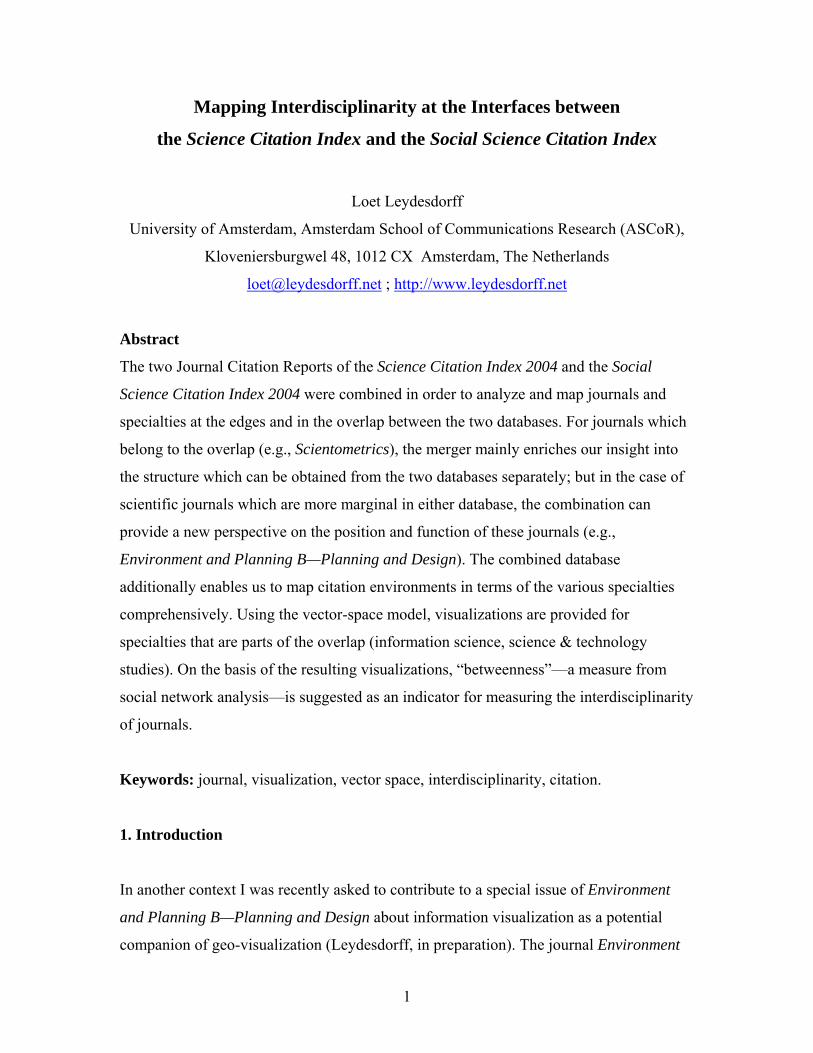
and Planning B is included in the Social Science Citation Report, and using the Journal
Citation Report 2004 of this index, one can construct a matrix of journals citing the
journal within this domain (Table 1).1
→ citing
Cities 38 16 7 0 10 0 0 0 2 28 101
Environ Plann A 11 228 15 8 32 0 0 13 5 111 423
Environ Plann B 2 25 102 34 24 0 0 3 0 22 212
Int J Geogr Inf Sci 0 14 13 82 0 0 0 2 0 0 111
J Am Plann Assoc 2 6 8 0 60 3 0 4 0 18 101
J Archit Plan Res 0 0 7 0 6 9 0 0 0 0 22
J Urban Plan D-Asce 2 7 10 3 15 0 3 0 0 5 45
Prof Geogr 3 16 6 13 10 0 0 69 2 14 133
Prog Plann 13 34 7 21 13 0 0 3 7 33 131
Urban Stud 23 73 14 2 35 2 0 7 5 250 411
↓ cited 94 419 189 163 205 14 3 101 21 481 1690
Table 1: citation matrix of ten journals citing Environment and Plannning B within the
Social Science Citation Index 2004.
On the basis of this matrix, the following map can be generated using the vector-space
model for the computation (Salton & McGill, 1983; Ahlgren et al., 2003; Leydesdorff,
forthcoming):2
1 The ISI aggregates all single citation relations under the category “All others.” These missing values are not considered in this analysis. 2 The visualization program Pajek can be downloaded at http://vlado.fmf.uni-lj.si/pub/networks/pajek/ (Batagelj and Mrvar, 2003; De Nooy et al., 2005; Mrvar and Batagelj, s.d.).
2
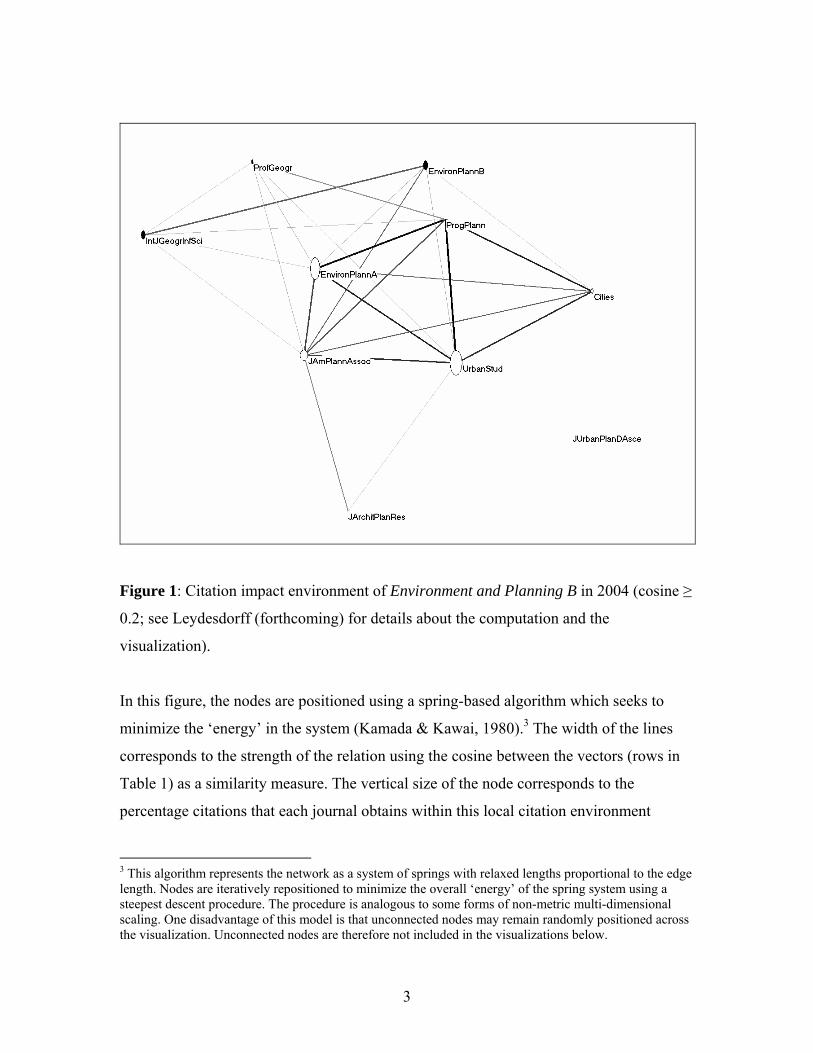
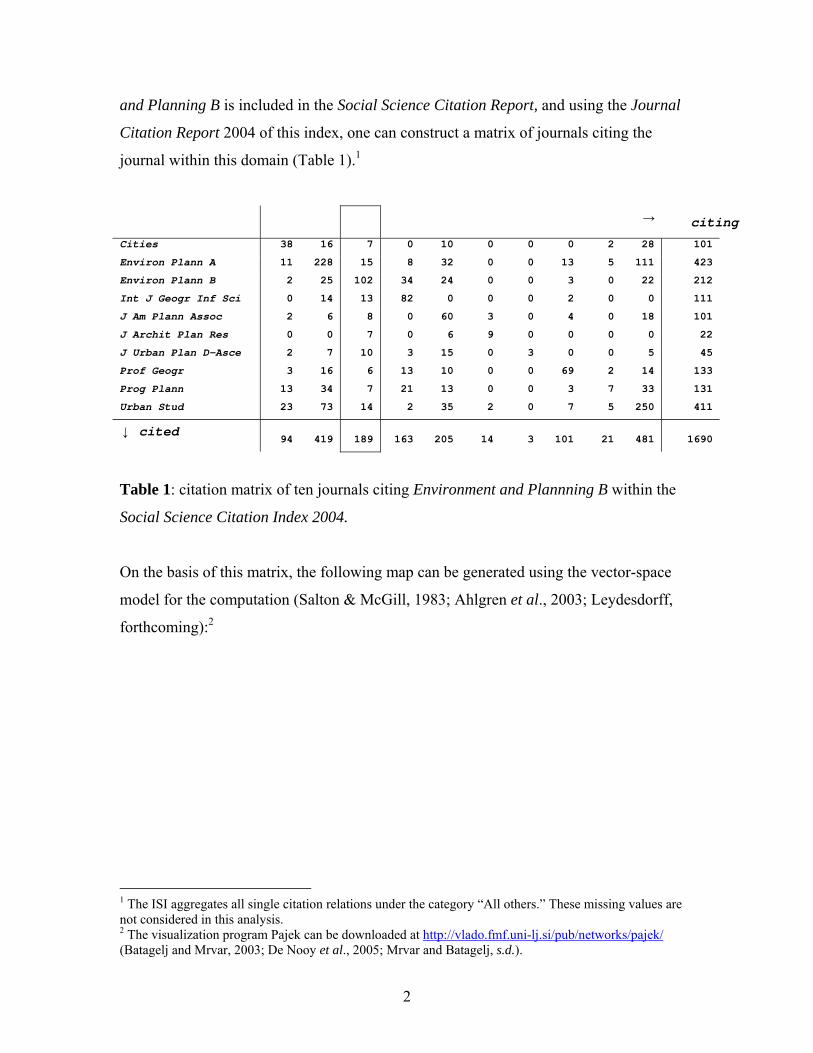
Figure 1: Citation impact environment of Environment and Planning B in 2004 (cosine ≥
0.2; see Leydesdorff (forthcoming) for details about the computation and the
visualization).
In this figure, the nodes are positioned using a spring-based algorithm which seeks to
minimize the ‘energy’ in the system (Kamada & Kawai, 1980).3 The width of the lines
corresponds to the strength of the relation using the cosine between the vectors (rows in
Table 1) as a similarity measure. The vertical size of the node corresponds to the
percentage citations that each journal obtains within this local citation environment
3 This algorithm represents the network as a system of springs with relaxed lengths proportional to the edge length. Nodes are iteratively repositioned to minimize the overall ‘energy’ of the spring system using a steepest descent procedure. The procedure is analogous to some forms of non-metric multi-dimensional scaling. One disadvantage of this model is that unconnected nodes may remain randomly positioned across the visualization. Unconnected nodes are therefore not included in the visualizations below.
3

before correction for within-journal (‘self’-)citations, and the horizontal size to this same
percentage after correction. Thus, the shapes of the nodes can be considered as indicators
of local impacts in the citation environment of Environment & Planning B.
Using the valued core partition algorithm as an option available in Pajek,4 the position of
Environment and Planning B in the figure is made visible as more peripheral than the
core set of five journals in the area of planning. Together with the International Journal
of Geographical Information and the Professional Geographer, Environment and
Planning B forms a subset at the margin of the specialty. (The division is indicated in this
figure by using black versus white vertices.) However, this subset could precisely be of
interest given our research question of the possible relations between geographical
information and information visualization.
The citation environment of journals about visualization techniques includes journals
from the computer sciences which are not covered by the Social Science Citation Index,
but by the Science Citation Index. The Social Science Citation Index 2004 covers 1,712
journals; the Science Citation Index 2004 includes 5,968 journals. Some journals in
information science and the study of science and technology (STS) are included in both
databases, but in other cases the divide at the interface seems arbitrary.
For example, Research Policy, which can be considered a leading journal in technology
studies (Leydesdorff & Van den Besselaar, 1997), is covered by the Social Science
Citation Index, while Technology Analysis & Strategic Management which belongs
substantively to the same specialty, is included in the Science Citation Index. While
journals with “information” in their titles are usually included in both indices, journals in
library and information sciences (LIS) that do not have the term “information” in their
title are contained only in the Social Science Citation Index.
4 This algorithm computes a generalized k-core: instead of counting the number of lines, the value of the lines is summed. In accordance with the methodology used in this study, the threshold was set at cosine ≥ 0.2 and the aggregation was stepwise with steps equal to 0.1.
4
Given the above results, I wondered whether something similar might be the case for
Environment and Planning B, and hence decided to merge the two databases. The
resulting map (Figure 2) was illuminating about the central position of the journal under
study. The citation pattern of this journal provides an articulation point between a strong
graph of environmental-planning journals and a graph of computer-science journals.5 The
k-core algorithm, however, attributes the relatively marginal cluster in the previous figure
as belonging to the computer-science component in this configuration.
Figure 2 Local citation impacts of journals in the citation environment of Environment
and Planning B in 2004. (Social Science Citation Index and Science Citation Index
combined; cosine ≥ 0.2.) 6
5 “Articulation points” or “cut-points” are defined in graph theory as vertices that are shared between two bi-connected components (Scott, 1991). 6 The size of the node for Lecture Notes in Computer Sciences has been reset to one percent because this journal has a citation rate of 32,739 citations (among which 18,005 within-journal citations), but these citations are not provided in this environment.
5
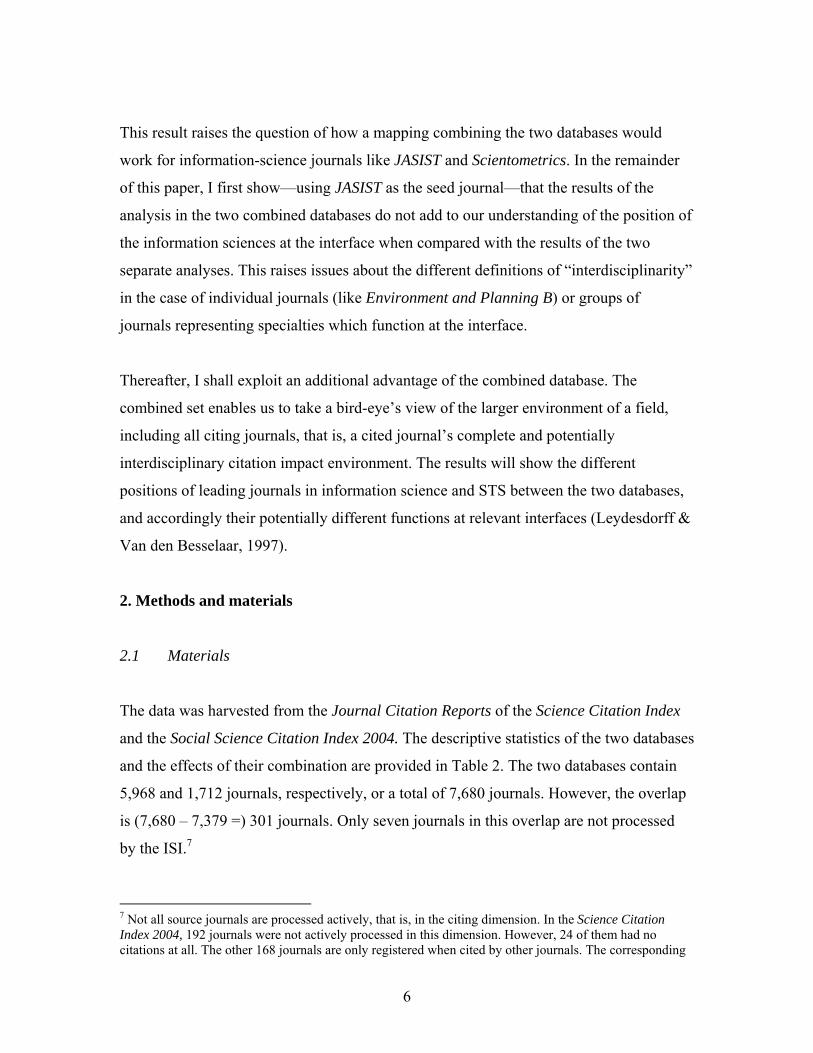
This result raises the question of how a mapping combining the two databases would
work for information-science journals like JASIST and Scientometrics. In the remainder
of this paper, I first show—using JASIST as the seed journal—that the results of the
analysis in the two combined databases do not add to our understanding of the position of
the information sciences at the interface when compared with the results of the two
separate analyses. This raises issues about the different definitions of “interdisciplinarity”
in the case of individual journals (like Environment and Planning B) or groups of
journals representing specialties which function at the interface.
Thereafter, I shall exploit an additional advantage of the combined database. The
combined set enables us to take a bird-eye’s view of the larger environment of a field,
including all citing journals, that is, a cited journal’s complete and potentially
interdisciplinary citation impact environment. The results will show the different
positions of leading journals in information science and STS between the two databases,
and accordingly their potentially different functions at relevant interfaces (Leydesdorff &
Van den Besselaar, 1997).
2. Methods and materials
2.1 Materials
The data was harvested from the Journal Citation Reports of the Science Citation Index
and the Social Science Citation Index 2004. The descriptive statistics of the two databases
and the effects of their combination are provided in Table 2. The two databases contain
5,968 and 1,712 journals, respectively, or a total of 7,680 journals. However, the overlap
is (7,680 – 7,379 =) 301 journals. Only seven journals in this overlap are not processed
by the ISI.7
7 Not all source journals are processed actively, that is, in the citing dimension. In the Science Citation Index 2004, 192 journals were not actively processed in this dimension. However, 24 of them had no citations at all. The other 168 journals are only registered when cited by other journals. The corresponding
6

SCI 2004 SoSCI 2004 Combined Effect
Number of source
journals
5968 1712 7379 +28.6%
unique journal-
journal relations
1,038,268 96,207 1,195,158
+15.1%
sum of journal-
journal relations
18,943,827 966,619 20,326,793 +7.3%
average cell value 18.25 10.05 17.01 -6.7%
total ‘citing’ 25,798,965 2,909,219 27,961,981 +8.4%
total ‘cited’ 20,909,401 1,453,397 21,810,032 +4.3%
within-journal
citations’
2,016,500 137,269 2,107,885 +4.5%
Table 2: Descriptive statistics of the JCRs of the Science Citation Index, the Social
Science Citation Index, and the two databases combined.
The overal impression from the figures in Table 2 is that the extension of the Science
Citation Index by the Social Science Citation Index with 28.6% (= 1,712/5,968) more
source journals has an effect on the citation characteristics of the set of less than ten
percent. Thus, the database is changed, but one would expect the structures of the Science
Citation Index to persist in the combined set.
2.2 Methods
A citation index contains all information for the construction of a huge matrix in which
the cited journals provide information for the row vectors and citing journals for the
column vectors (or vice versa); the cell values are equal to the number of unique citation
relations at the article level. The matrix is asymmetrical, and the main diagonal—
numbers of inactive journals were 40 in the Social Science Citation Index, and 199 in the combined database.
7
representing “within-journal” citations—provides an outlier in the otherwise skewed
distributions.8
As the similarity measure between the distributions for the various journals included in a
citation environment, I use the cosine between the two vectors or, in other words,
normalization to the geometrical mean. Unlike the Pearson correlation coefficient, the
cosine does not presume normality of the distribution (Ahlgren et al., 2003). A further
advantage of this measure is its further development into the so-called vector-space
model for the visualization (Salton & McGill, 1983).
A citation environment is defined as all journals which cite or are cited by a specific
journal above a given threshold. The value of this threshold can be varied, but the default
value is set at one percent of the total references or citations in the citing and cited
dimensions of the matrix (He & Pao, 1986; Leydesdorff & Cozzens, 1993). When the
threshold is set equal to zero, one is able to map the complete citation context of a journal.
The cosine matrices (with the default value for the threshold) of all journals included in
the Science Citation Index and the Social Science Citation Index combined are brought
online at http://www.leydesdorff.net/jcr04/cited and
http://www.leydesdorff.net/jcr04/citing, respectively, in a format which allows a user to
generate maps as in Figure 2 above by using Pajek or to export this data for statistical
analysis from Pajek into UCINET and SPSS.9
3. Results
3.1 Information science & technology
Figures 3, 4, and 5 show the citation impact environments of the Journal of the American
Society of Information Science and Technology (JASIST) in the Social Science Citation
8 Within-journal citation traffic accounts for about 10% of the total citation traffic (Leydesdorff, forthcoming). 9 Pajek is freely available for non-commercial usage at http://vlado.fmf.uni-lj.si/pub/networks/pajek/ .
8
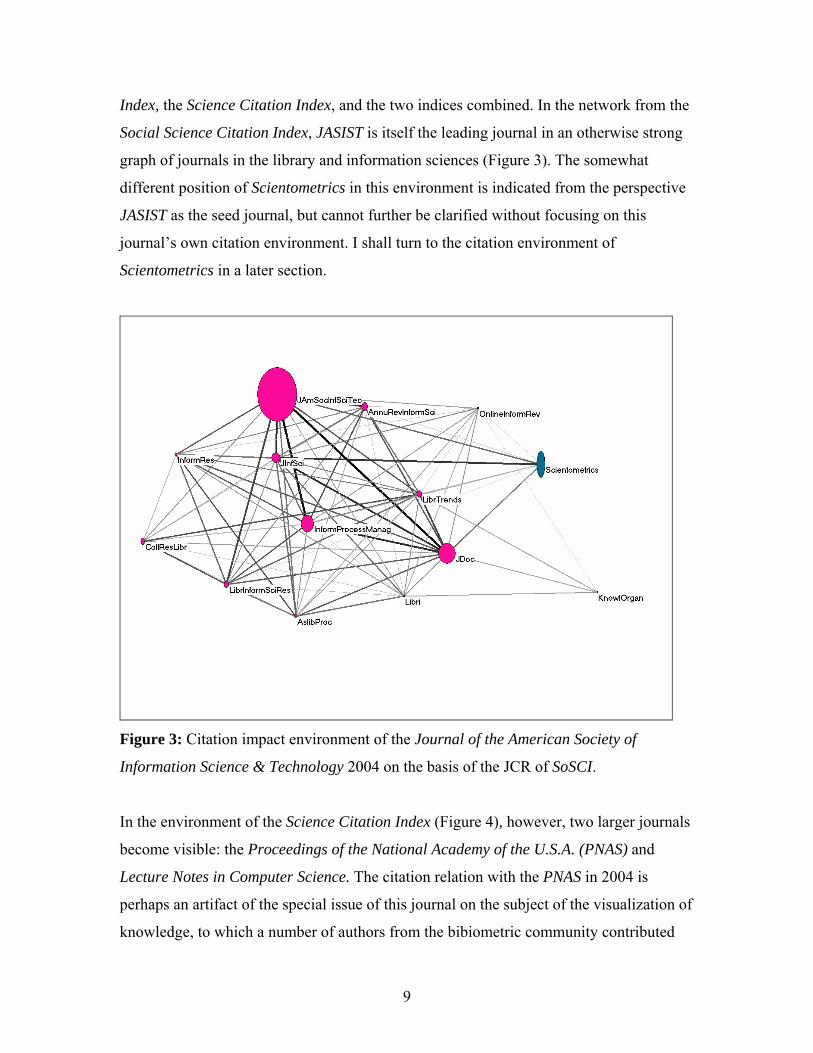
Index, the Science Citation Index, and the two indices combined. In the network from the
Social Science Citation Index, JASIST is itself the leading journal in an otherwise strong
graph of journals in the library and information sciences (Figure 3). The somewhat
different position of Scientometrics in this environment is indicated from the perspective
JASIST as the seed journal, but cannot further be clarified without focusing on this
journal’s own citation environment. I shall turn to the citation environment of
Scientometrics in a later section.
Figure 3: Citation impact environment of the Journal of the American Society of
Information Science & Technology 2004 on the basis of the JCR of SoSCI.
In the environment of the Science Citation Index (Figure 4), however, two larger journals
become visible: the Proceedings of the National Academy of the U.S.A. (PNAS) and
Lecture Notes in Computer Science. The citation relation with the PNAS in 2004 is
perhaps an artifact of the special issue of this journal on the subject of the visualization of
knowledge, to which a number of authors from the bibiometric community contributed
9
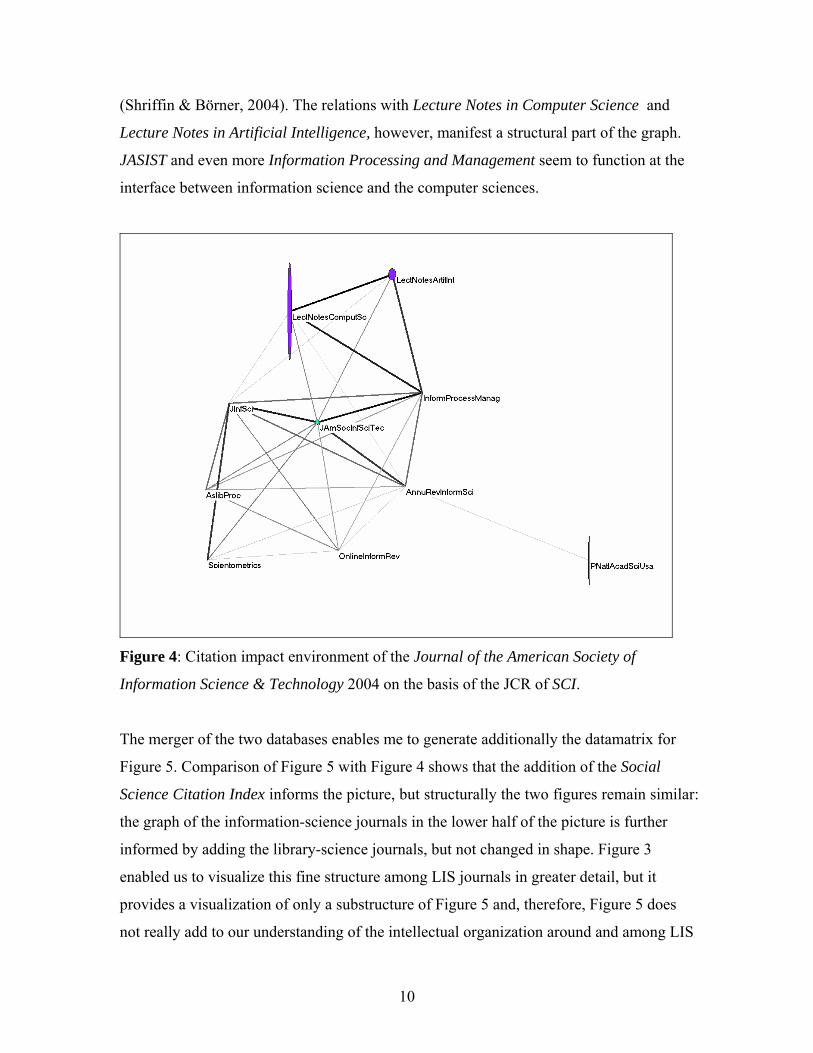
(Shriffin & Börner, 2004). The relations with Lecture Notes in Computer Science and
Lecture Notes in Artificial Intelligence, however, manifest a structural part of the graph.
JASIST and even more Information Processing and Management seem to function at the
interface between information science and the computer sciences.
Figure 4: Citation impact environment of the Journal of the American Society of
Information Science & Technology 2004 on the basis of the JCR of SCI.
The merger of the two databases enables me to generate additionally the datamatrix for
Figure 5. Comparison of Figure 5 with Figure 4 shows that the addition of the Social
Science Citation Index informs the picture, but structurally the two figures remain similar:
the graph of the information-science journals in the lower half of the picture is further
informed by adding the library-science journals, but not changed in shape. Figure 3
enabled us to visualize this fine structure among LIS journals in greater detail, but it
provides a visualization of only a substructure of Figure 5 and, therefore, Figure 5 does
not really add to our understanding of the intellectual organization around and among LIS
10
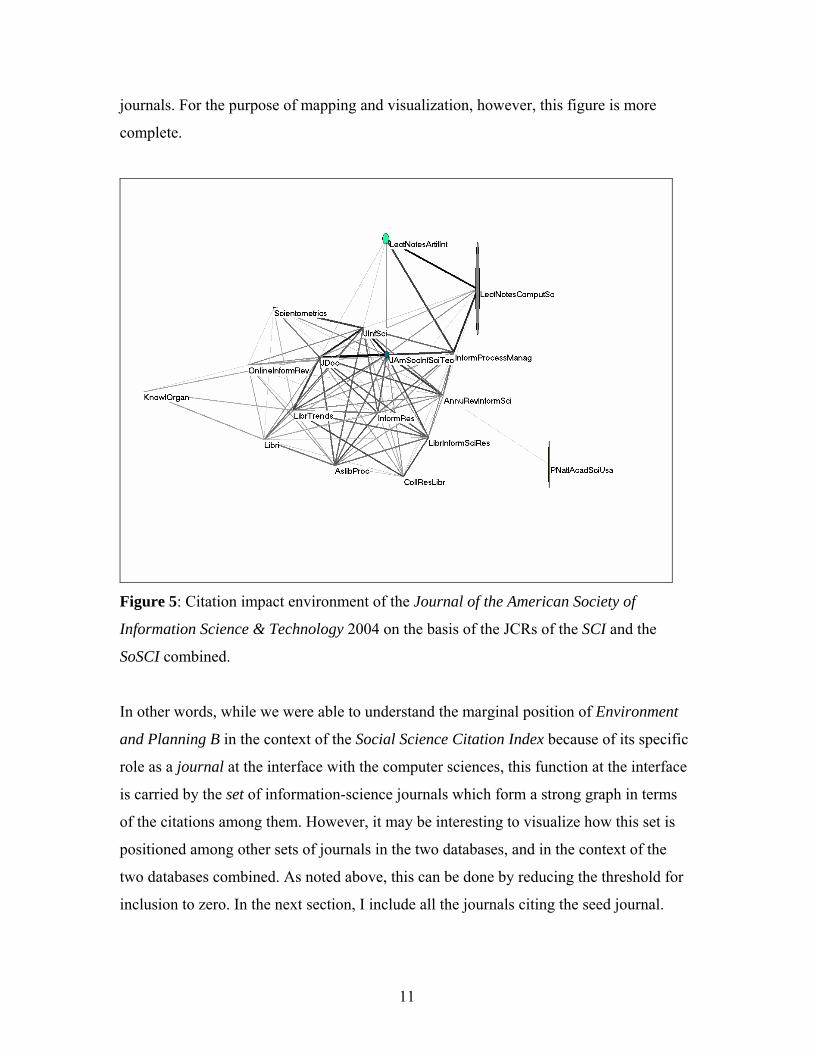
journals. For the purpose of mapping and visualization, however, this figure is more
complete.
Figure 5: Citation impact environment of the Journal of the American Society of
Information Science & Technology 2004 on the basis of the JCRs of the SCI and the
SoSCI combined.
In other words, while we were able to understand the marginal position of Environment
and Planning B in the context of the Social Science Citation Index because of its specific
role as a journal at the interface with the computer sciences, this function at the interface
is carried by the set of information-science journals which form a strong graph in terms
of the citations among them. However, it may be interesting to visualize how this set is
positioned among other sets of journals in the two databases, and in the context of the
two databases combined. As noted above, this can be done by reducing the threshold for
inclusion to zero. In the next section, I include all the journals citing the seed journal.
11
3.2 The larger environments
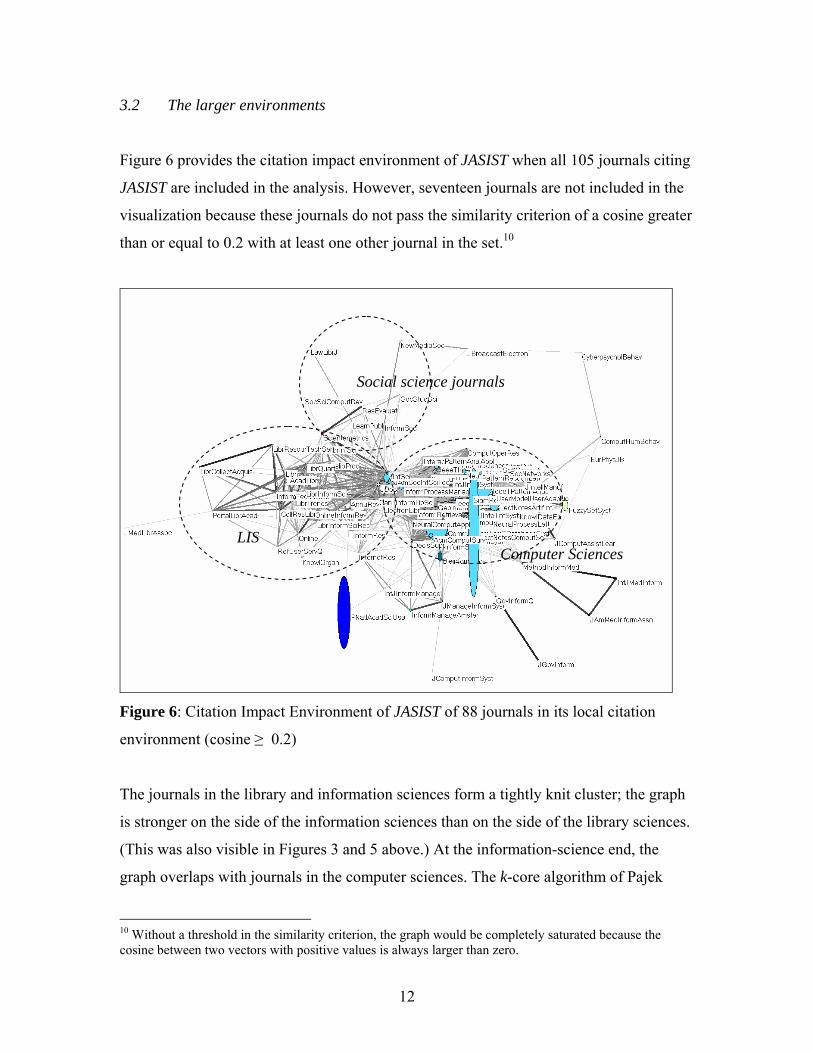
Figure 6 provides the citation impact environment of JASIST when all 105 journals citing
JASIST are included in the analysis. However, seventeen journals are not included in the
visualization because these journals do not pass the similarity criterion of a cosine greater
than or equal to 0.2 with at least one other journal in the set.10
Social science journals
Computer Sciences LIS
Figure 6: Citation Impact Environment of JASIST of 88 journals in its local citation
environment (cosine ≥ 0.2)
The journals in the library and information sciences form a tightly knit cluster; the graph
is stronger on the side of the information sciences than on the side of the library sciences.
(This was also visible in Figures 3 and 5 above.) At the information-science end, the
graph overlaps with journals in the computer sciences. The k-core algorithm of Pajek
10 Without a threshold in the similarity criterion, the graph would be completely saturated because the cosine between two vectors with positive values is always larger than zero.
12
even indicates JASIST and Information Processing and Management as belonging to the
graph of the computer sciences more than library and information science.
A strong group of approximately one hundred journals can be retrieved by using any
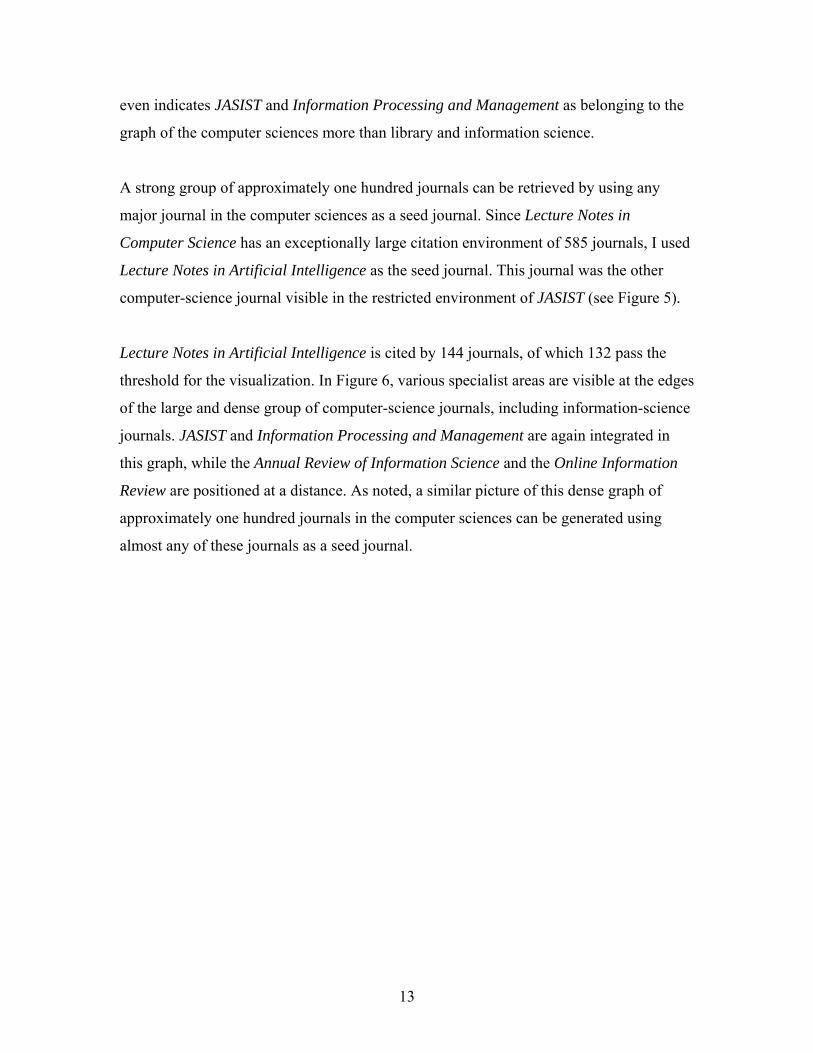
major journal in the computer sciences as a seed journal. Since Lecture Notes in
Computer Science has an exceptionally large citation environment of 585 journals, I used
Lecture Notes in Artificial Intelligence as the seed journal. This journal was the other
computer-science journal visible in the restricted environment of JASIST (see Figure 5).
Lecture Notes in Artificial Intelligence is cited by 144 journals, of which 132 pass the
threshold for the visualization. In Figure 6, various specialist areas are visible at the edges
of the large and dense group of computer-science journals, including information-science
journals. JASIST and Information Processing and Management are again integrated in
this graph, while the Annual Review of Information Science and the Online Information
Review are positioned at a distance. As noted, a similar picture of this dense graph of
approximately one hundred journals in the computer sciences can be generated using
almost any of these journals as a seed journal.
13
Figure 7: Citation Impact Environment of Lecture Notes in Artificial Intelligence on 132
journals in its local citation environment (cosine ≥ 0.2).11
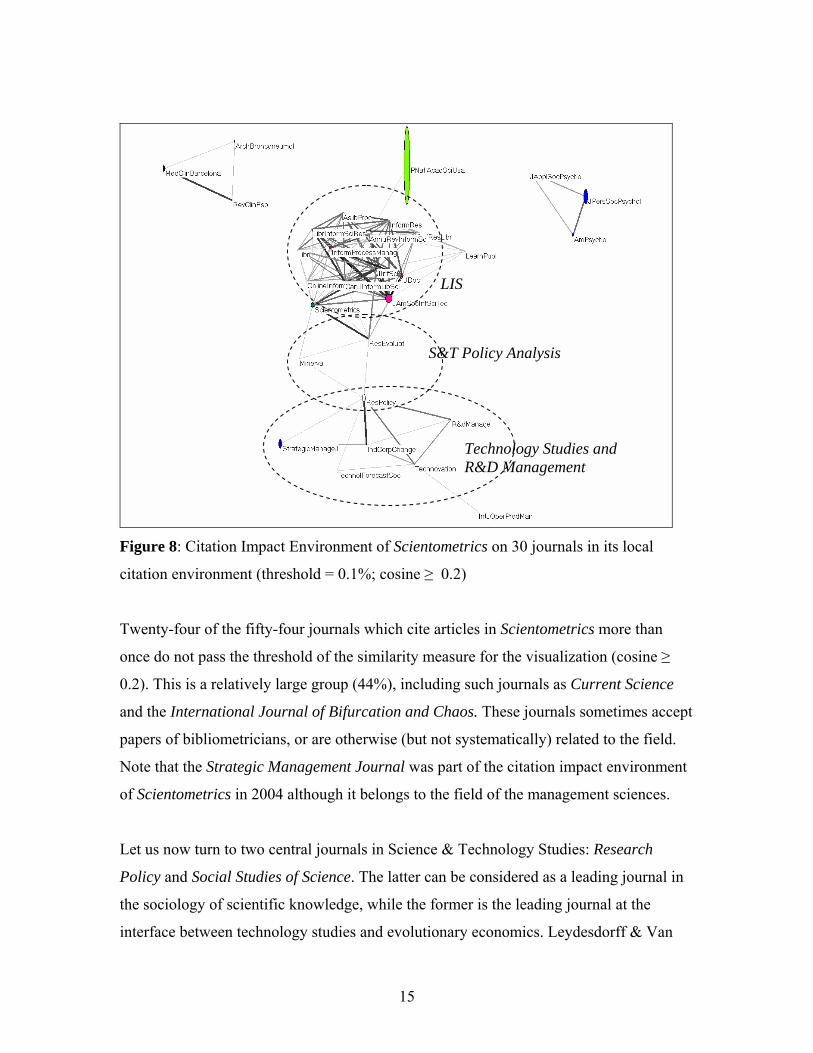
Scientometrics is not part of the last figure, nor of the LIS-graph in Figure 6. In the LIS
environment, Scientometrics functions as an articulation point with a group of social
science journals, among them Social Studies of Science. However, if we use
Scientometrics itself as a seed journal (Figure 8), these journals are not drawn into its
citation impact environment. Scientometrics has a citation impact in the information
sciences and in a group of journals oriented towards S&T policy issues and R&D
management. Authors in these journals use S&T-indicators in their studies and for this
reason provide references to Scientometrics and Research Evaluation. JASIST, however,
has citation impact in journals like Information Society and Social Studies of Science,
which also consider the social aspects of information and communication technologies.
11 Eleven more journals play a role in this citation environment, but are not connected to the graph at the level of cosine ≥ 0.2.
14
Technology Studies and R&D Management
S&T Policy Analysis
LIS
Figure 8: Citation Impact Environment of Scientometrics on 30 journals in its local
citation environment (threshold = 0.1%; cosine ≥ 0.2)
Twenty-four of the fifty-four journals which cite articles in Scientometrics more than
once do not pass the threshold of the similarity measure for the visualization (cosine ≥
0.2). This is a relatively large group (44%), including such journals as Current Science
and the International Journal of Bifurcation and Chaos. These journals sometimes accept
papers of bibliometricians, or are otherwise (but not systematically) related to the field.
Note that the Strategic Management Journal was part of the citation impact environment
of Scientometrics in 2004 although it belongs to the field of the management sciences.
Let us now turn to two central journals in Science & Technology Studies: Research
Policy and Social Studies of Science. The latter can be considered as a leading journal in
the sociology of scientific knowledge, while the former is the leading journal at the
interface between technology studies and evolutionary economics. Leydesdorff & Van
15
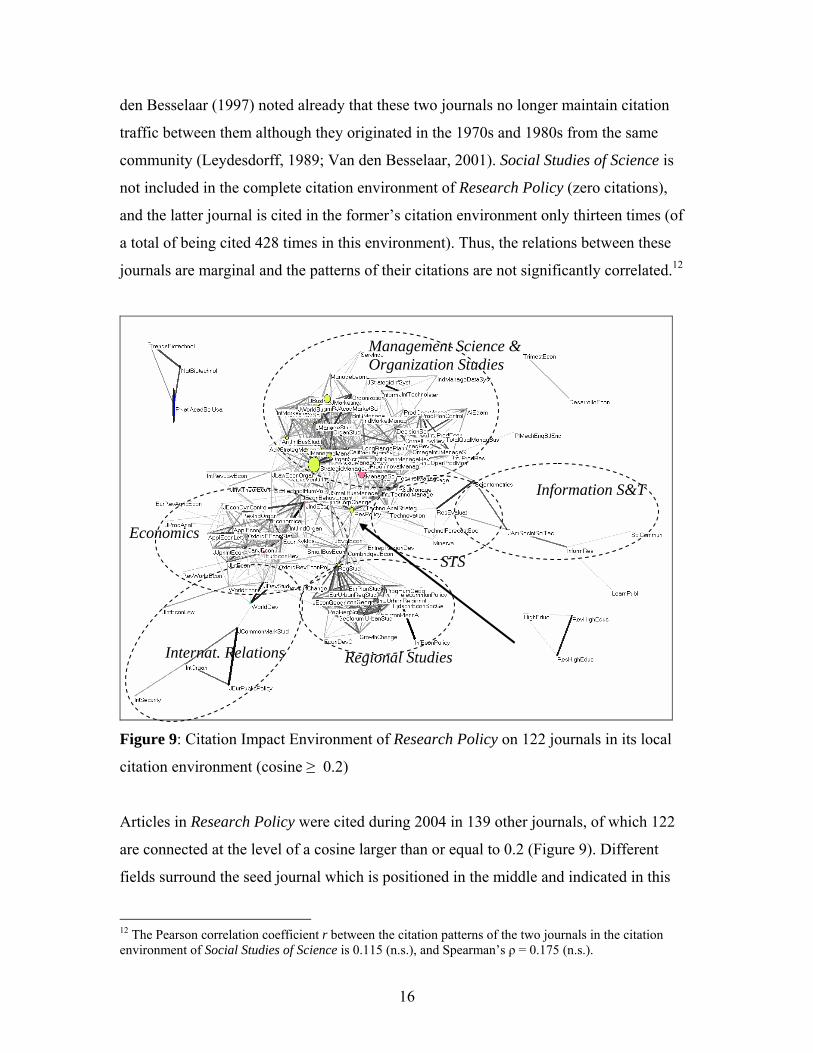
den Besselaar (1997) noted already that these two journals no longer maintain citation
traffic between them although they originated in the 1970s and 1980s from the same
community (Leydesdorff, 1989; Van den Besselaar, 2001). Social Studies of Science is
not included in the complete citation environment of Research Policy (zero citations),
and the latter journal is cited in the former’s citation environment only thirteen times (of
a total of being cited 428 times in this environment). Thus, the relations between these
journals are marginal and the patterns of their citations are not significantly correlated.12
Figure 9: Citation Impact Environment of Research Policy on 122 journals in its local
citation environment (cosine ≥ 0.2)
Regional Studies
Information S&T
Management Science & Organization Studies
STS
Internat. Relations
Economics
Articles in Research Policy were cited during 2004 in 139 other journals, of which 122
are connected at the level of a cosine larger than or equal to 0.2 (Figure 9). Different
fields surround the seed journal which is positioned in the middle and indicated in this
12 The Pearson correlation coefficient r between the citation patterns of the two journals in the citation environment of Social Studies of Science is 0.115 (n.s.), and Spearman’s ρ = 0.175 (n.s.).
16

figure with an arrow. Together with certain other journals (like Industry and Corporate
Change and the Journal of Evolutionary Economics), Research Policy functions at a
crossroads between institutional economics, STS, regional studies, and management
studies. Journals with a focus on information science and technology at the one end, and
international relations at the other, are more weakly related to the seed journal.
Sociology
Information S&T
History of Science
Phil. of Science
STS
Figure 10: Citation Impact Environment of Social Studies of Science on 66 journals in its
local citation environment (cosine ≥ 0.2)
Similarly—in graph-theoretical terms—Social Studies of Science occupies a structural
position in the center of Figure 10 between the history and philosophy of science, STS,
sociology, and the information sciences. Research Evaluation and Scientometrics again
mediate the latter relation. Of the 81 journals citing Social Studies of Science in the two
databases, 66 are connected among themselves in terms of their citation patterns above
the threshold value of cosine ≥ 0.2.
17
The star-shaped position of the seed journals among various specialties in the last two
analyses (Figures 9 and 10) raises the question of whether a graph-theoretical indicator of
interdisciplinarity can be formulated on the basis of this pattern. JASIST, Lecture Notes in
Artificial Intelligence, and Scientometrics did not show this specific pattern in the
respresentations of their local citation environments. Research Policy and Social Studies
of Science remain with their citation impact largely within the domain of the Social
Science Citation Index. Lecture Notes in Artificial Intelligence integrates journals which
typically belong to the social sciences (e.g., JASSS—Journal of Artificial Societies and
Social Simulation) into the strong graph of computer-science journals. The combination
of the two databases did not affect this cluster structurally.
4. Conclusion
The merger of the two Journal Citation Reports of the Science Citation Index and Social
Science Citation Index offers an opportunity to map scientific specialties and disciplines
across this interface. The evaluation of a social science journal which is linked to or
integrated into the Science Citation Index may change dramatically by using this different
context. If a journal is rather marginal in one set—as in the case of Environment and
Planning B—the addition of the other database can provide interesting perspectives on its
position in the field and its function in the network. In the case of the information
sciences, however, the resulting insight into the position of this group of journals was not
very different from the results of the two databases separately. The evaluation of STS
journals was not much affected because they belong structurally to the domain of the
social sciences.
The merger enables us to generate a bird-eye’s view of the position of interdisciplinary
groups of journals in the two databases because the mapping can be extended to the
complete citation environment. The complete citation environments for most specialist
journals are of the order of one hundred journals. Local citation impact can be
comprehensively visualized in such relatively small environments. I envisage bringing
the citation impact environments online in 2005 without setting a citation threshold.
18
Furthermore, these results suggest that measures from social network analysis like
“betweenness” or one of its derivates can be used as a quantifiable indicator of the
interdisciplinarity of journals (Freeman, 1978/1979; Wasserman & Faust, 1994;
Hanneman & Riddle, 2005). However, whether such an indicator should be applied to the
citation matrix itself or to the cosine matrix representing the vector space requires further
analysis. It might well be that different centrality measures have to be used for measuring
“interdisciplinarity” or “multidisciplinarity” (e.g., Nature). Additionally,
“interdisciplinarity” needs to be defined differently for the cited and the citing
dimensions (Leydesdorff, 1993).
Acknowledgement
I am grateful to Caroline S. Wagner for useful comments on a previous draft.
References:
Ahlgren, P., B. Jarneving, & R. Rousseau. (2003). Requirement for a Cocitation Similarity Measure, with Special Reference to Pearson's Correlation Coefficient. Journal of the American Society for Information Science and Technology, 54(6), 550-560.
Batagelj, V., & A. Mrvar. (2003). Pajek - Analysis and Visualization of Large Networks. In M. Jünger & P. Mutzel (Eds.), Graph Drawing Software (pp. 77-103). Berlin: Springer.
De Nooy, W., A. Mrvar, & V. Batagelj, Exploratory Social Network Analysis with Pajek. Cambridge, NY: Cambridge University Press.
Freeman, L. C. (1978/1979). Centrality in Social Networks. Conceptual Clarification. Social Networks, 1, 215-239.
Hanneman, R. A., & M. Riddle. (2005). Introduction to Social Network Methods. Riverside, CA: University of California, Riverside; at http://faculty.ucr.edu/~hanneman/.
Jones, W. P., & G. W. Furnas. (1987). Pictures of Relevance: A Geometric Analysis of Similarity Measures. Journal of the American Society for Information Science, 36(6), 420-442.
Kamada, T., & S. Kawai. (1989). An Algorithm for Drawing General Undirected Graphs. Information Processing Letters, 31(1), 7-15.
Leydesdorff, L. (1989). The Relations between Qualitative Theory and Scientometric Methods in S&T Studies. Introduction to the Topical Issue. Scientometrics, 15, 333-347.
Leydesdorff, L. (1993). The Impact of Citation Behaviour on Citation Structure. In A. F. J. van Raan, R. E. de Bruin, H. F. Moed, A. J. Nederhof & R. W. J. Tijssen (Eds.),
19
Science and Technology in a Policy Context (pp. 289-300). Leiden: DSWO/ Leiden University Press.
Leydesdorff, L. (forthcoming). Visualization of the Citation Impact Environments of Scientific Journals: An Online Mapping Exercise. Journal of the American Society of Information Science and Technology.
Leydesdorff, L. (in preparation). Environment and Planning B as a Journal: The Interdisciplinarity of its Environment and the Citation Impact.
Leydesdorff, L., & S. E. Cozzens. (1993). The Delineation of Specialties in Terms of Journals using the Dynamic Journal Set of the Science Citation Index. Scientometrics, 26, 133-154.
Leydesdorff, L., & P. Van den Besselaar. (1997). Scientometrics and Communication Theory: Towards Theoretically Informed Indicators. Scientometrics, 38, 155-174.
Mrvar, A., & V. Bagatelj. (s.d.). Network Analysis Using Pajek; at http://vlado.fmf.uni-lj.si/pub/networks/pajek/doc/pajekman.htm. Retrieved April 5, 2003.
Salton, G., & M. J. McGill. (1983). Introduction to Modern Information Retrieval. Auckland, etc.: McGraw-Hill.
Shriffin, R. M., & K. Börner. (2004). Mapping Knowledge Domains. Proceedings of the National Academy of the United States of America, 101 (Suppl. 1)(April 6), 5183-5310.
Van den Besselaar, P. (2001). The Cognitive and the Social Structure of Science & Technology Studies. Scientometrics, 51, 441-460.
Wasserman, S., & K. Faust. (1994). Social Network Analysis: Methods and Applications. New York: Cambridge University Press.
20