schroders 2017 half-year results · page asset under management and administration (auma) 2...
TRANSCRIPT

Data PackSchroders 2017 Half-year Results
27 July 2017

Page
Asset under management and administration (AUMA) 2
Regional diversification of AUM 3
Gross sales and net flows 4-5
Currency profile of AUM 6-7
AUM diversification 8-10
Asset Management AUM – detailed asset class analysis 11-13
Asset Management AUM flows 14-15
Net operating revenue and margins – Asset Management 16
Income statement progression 17-19
Cost and return metrics 20
Group capital 21
Contents
1
Nothing in this presentation should be construed as a forecast, estimate or projection of future financial performance.

Assets under management and administration (AUMA)£418.2 billion at 30 June 2017
2
1 Wealth Management flows exclude income drawdowns which are now included within investment returns.2 Assets under management and administration comprise assets managed or advised on behalf of clients (Assets Under Management) and assets where Schroders solely provides administrative support through the Benchmark Capital business (assets under administration or AUA).3 Wealth Management acquisition relates to the purchase of the wealth management business of C. Hoare & Co.
£bn Institutional IntermediaryAsset
ManagementWealth
Management1 Total AUM AUA AUMA2
1 January 2017 226.3 120.1 346.4 39.6 386.0 11.1 397.1
Net flows 1.4 (1.2) 0.2 0.6 0.8
Acquisitions3 - - - 2.5 2.5
Investment returns 10.9 5.8 16.7 0.9 17.6
30 June 2017 238.6 124.7 363.3 43.6 406.9 11.3 418.2

Regional diversification of AUM*65% of net operating revenues earned outside UK
3
* By client domicile.**A further £11.3bn of assets under administration are located in the UK.
Continental Europe£76.2bn
UK**£163.6bn
North America£48.1bn
Middle East and Africa£10.4bn
Asia Pacific£100.0bn
South America£8.6bn

Gross salesHalf-yearly
4
48.6
35.5 38.9
41.9
52.4
0.0
10.0
20.0
30.0
40.0
50.0
60.0
H1 2015 H2 2015 H1 2016 H2 2016 H1 2017
£bn
Equities Fixed Income Multi-asset Emerging Market Debt, Commodities & Real Estate Wealth Management
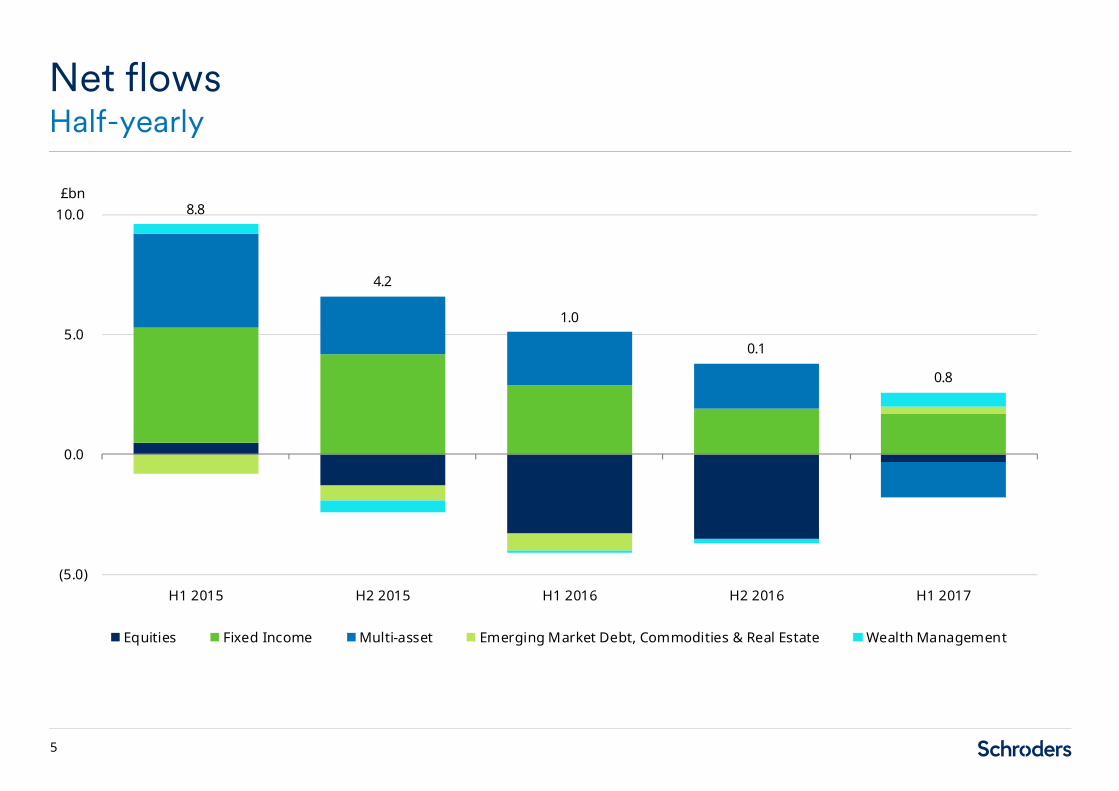
Net flowsHalf-yearly
5
8.8
4.2
1.0
0.1
0.8
(5.0)
0.0
5.0
10.0
H1 2015 H2 2015 H1 2016 H2 2016 H1 2017
£bn
Equities Fixed Income Multi-asset Emerging Market Debt, Commodities & Real Estate Wealth Management

Currency profile of AUMAssets under management £406.9 billion
6
* USD includes other currencies pegged to USD, including HKD.** Includes the following currencies which individually constitute 1% of AUM: IDR, INR, SGD, BRL, CAD, SEK, RUB
30%
28%
12%
5%
5%
4%
2%2%
2%
10%
USD* GBP EUR JPY AUD CNY KRW TWD CHF Other**

Institutional £238.6bn Intermediary £124.7bn
Currency profile of Asset Management AUMAssets Management AUM £363.3 billion
7
* USD includes other currencies pegged to USD, including HKD.
USD*GBPEURAUDCNYJPYKRWTWDCHFOther
33%24%10%
6%5%5%3%2%2%
10%
USD*EURGBPJPYCNYAUDIDRTWDSGDKRWCHFOther
32%18%16%
7%5%4%2%2%2%2%2%8%
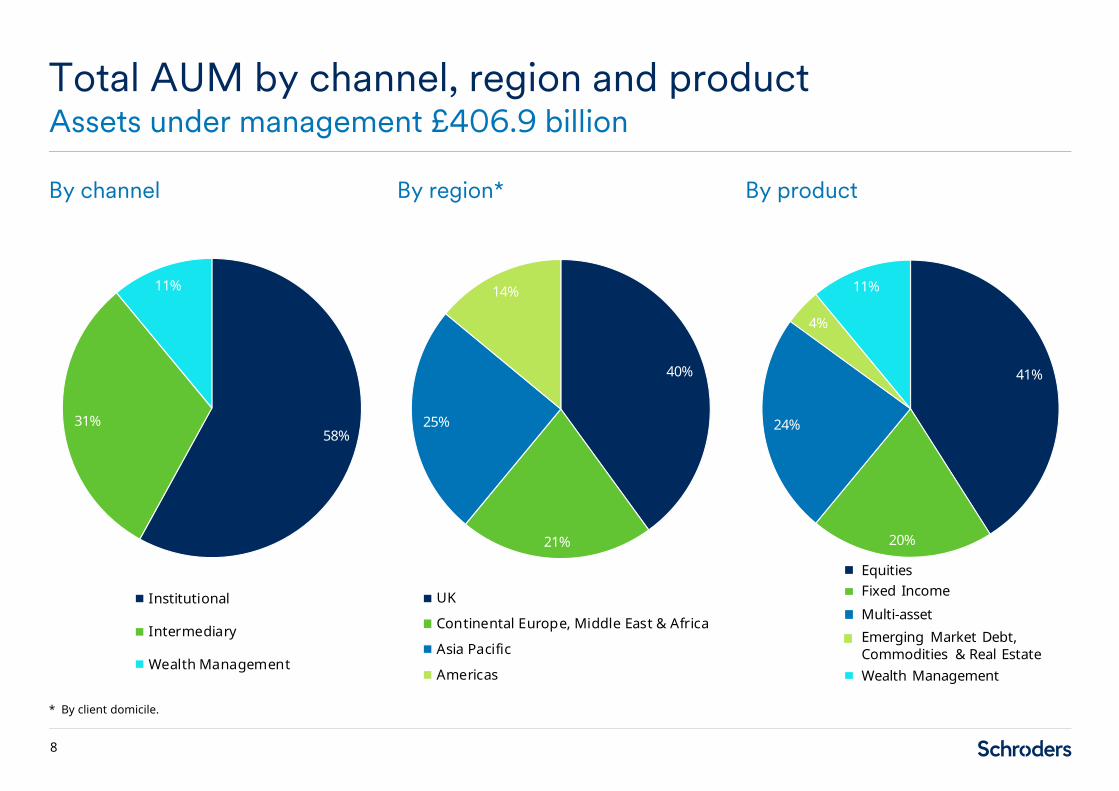
By channel By region* By product
Total AUM by channel, region and productAssets under management £406.9 billion
8
* By client domicile.
58%31%
11%
Institutional
Intermediary
Wealth Management
40%
21%
25%
14%
UK
Continental Europe, Middle East & Africa
Asia Pacific
Americas
41%
20%
24%
4%
11%
EquitiesFixed Income
Multi-assetEmerging Market Debt, Commodities & Real EstateWealth Management

Institutional AUM £238.6bn Intermediary AUM £124.7bn
Asset Management AUM by channel and productAssets under management £363.3 billion
9
41%
22%
32%
5%
Equities Fixed Income
56%
25%
17%
2%
Multi-asset Emerging Market Debt, Commodities & Real Estate

Institutional AUM £238.6bn Intermediary AUM £124.7bn
Asset Management AUM by channel and region*Assets under management £363.3 billion
10
* By client domicile.
39%
15%
27%
19%
UK Continental Europe, Middle East & Africa
26%
37%
27%
10%
Asia Pacific Americas

Asset Management AUM – detailed asset class analysisAssets under management £363.3 billion
11
Equities £166.8bn
Asia PacificQuantitative equitiesGlobalEmerging marketsEuropeUKJapanUSAustraliaOther
19%15%
1%4%
6%5%
12%
14%13%
11%
USEuropeGlobalAsia PacificUKSecuritised CreditAustraliaInsurance-linkedConvertiblesEmerging market bondsInfrastructure Finance
30%21%
2%2%
7%
4%
6%
19%
Fixed Income £84.0bn
1%2%
6%
Risk controlled growthLDIUK traditional balancedIncomeInflation protectionRisk mitigationGAIAWealth preservation
25%35%
1%
16%10%
Multi-asset £97.4bn
5%
3%5%
Real estateEmerging market debtAgriculture and commoditiesPrivate equity
74%16%
3%
7%
Emerging Market Debt, Commodities and Real Estate £15.1bn

Institutional AUM – detailed asset class analysisAssets under management £238.6 billion
12
Equities £97.7bn
Quantitative equitiesEmerging marketsGlobalAsia PacificUKEuropeAustraliaJapanUS
22%18%
2%
4%8%9%
16%18%
3%
USGlobalEuropeUKAsia PacificSecuritised CreditAustraliaInfrastructure FinanceInsurance-linkedEmerging market bondsConvertibles
45%17%
1%
1%
6%
3%
12%8%
Fixed Income £52.7bn
2%
1%
4%
Risk controlled growthLDIUK traditional balancedInflation protectionRisk mitigationWealth preservation
33%36%
5%
20%
Multi-asset £76.0bn
5%
1%
Real estateEmerging market debtAgriculture and commoditiesPrivate equity
79%
6%4%
11%
Emerging Market Debt, Commodities and Real Estate £12.2bn

Intermediary AUM – detailed asset class analysisAssets under management £124.7 billion
13
Equities £69.1bn
Asia PacificEuropeUKJapanUSGlobalEmerging marketsQuantitative equitiesAustraliaOther
24%
14%
3%3%5%
9%9%
8%9%
16%
EuropeGlobalSecuritised CreditAsia PacificAustraliaUSConvertiblesInsurance-linkedUKEmerging market bonds
36%22%
3%3%
3%
8%
6%6%
Fixed Income £31.3bn
3%
10%
IncomeRisk controlled growthGAIARisk mitigationInflation protection
31%14%
44%
Multi-asset £21.4bn
5%6%
Real estateEmerging market debtAgriculture and commoditiesPrivate equity
51%
34%
1%
14%
Emerging Market Debt, Commodities and Real Estate £2.9bn
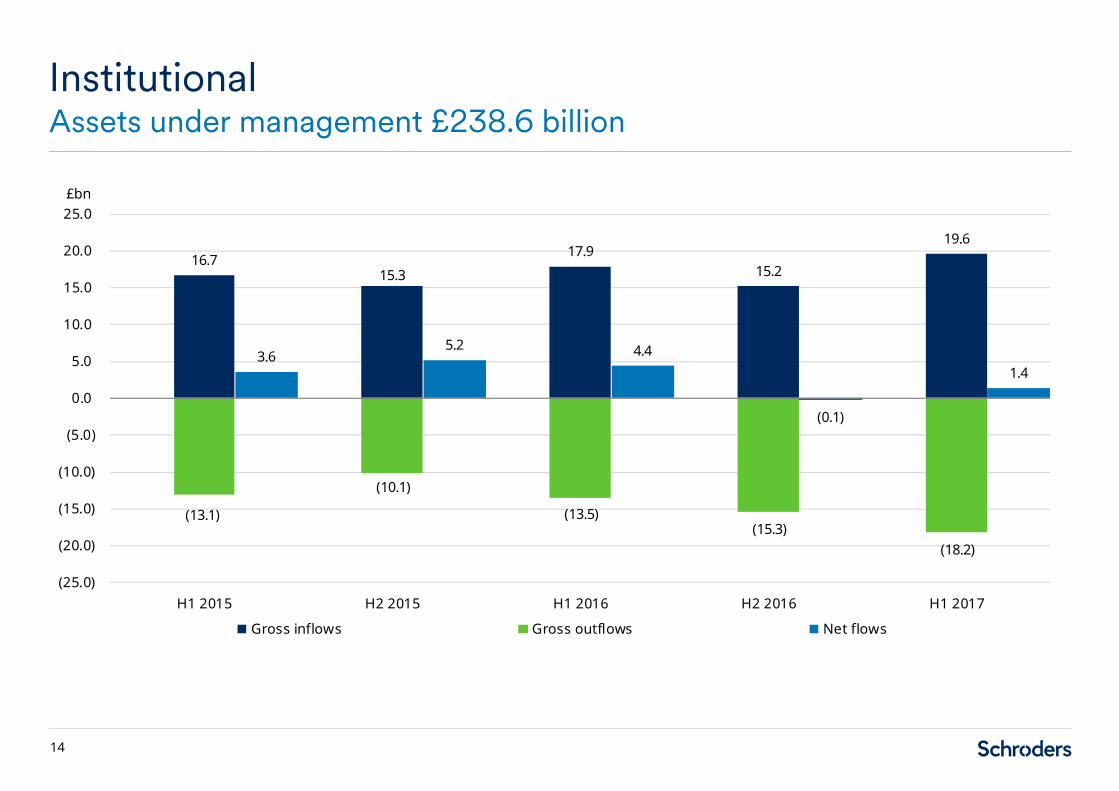
InstitutionalAssets under management £238.6 billion
14
16.7 15.3
17.9 15.2
19.6
(13.1)
(10.1)
(13.5)(15.3)
(18.2)
3.6 5.2 4.4
(0.1)
1.4
(25.0)
(20.0)
(15.0)
(10.0)
(5.0)
0.0
5.0
10.0
15.0
20.0
25.0
H1 2015 H2 2015 H1 2016 H2 2016 H1 2017
£bn
Gross inflows Gross outflows Net flows

IntermediaryAssets under management £124.7 billion
15
28.6
18.0 18.8
24.6
29.0
(23.8)
(18.5)(22.1)
(24.2)
(30.2)
4.8
(0.5)(3.3)
0.4
(1.2)
(40.0)
(30.0)
(20.0)
(10.0)
0.0
10.0
20.0
30.0
40.0
H1 2015 H2 2015 H1 2016 H2 2016 H1 2017
£bn
Gross inflows Gross outflows Net flows

Net operating revenue and margins – Asset ManagementAsset Management net operating revenue £809.3 million
16
* Excludes exceptional items.
Performance fees - £m
Performance fees on average AUM
Net operating revenue (ex performance fees) - £m
Net operating revenue (ex performance fees) on average AUM
Net income* - £m
Operating expenses* - £m
Profit before tax* - £m
13.2 38.8 6.4
H1 2017FY 2016 H1 2016
796.1 1,450.7 681.4
1 bps1 bps 0 bps
45 bps46 bps 47 bps
1,534.4 708.9 820.0
310.6 572.4 257.6
509.4 962.0 451.3

Income statement progressionAsset Management profit before tax
17
£m
Institutional
Intermediary
Net operating revenue
Net gains/(losses) on financial instruments and other income
Share of profit of associates and joint ventures
Net income
Operating expenses
Asset Management profit before exceptional items
Exceptional items
Asset Management profit after exceptional items
309.0 316.1
371.7
687.8
12.6
8.5
708.9
(451.3)
257.6
(8.5)
249.1
383.9
692.9
2.5
6.7
702.1
(431.1)
271.0
H2 2015 H1 2016
319.7
380.8
700.5
3.8
6.1
265.0
H2 2016
376.4
425.3
801.7
15.6
8.2
825.5
(510.7)
301.0
H1 2017
372.8
436.5
314.8
(10.0)
304.8
H1 2015
809.3
(509.4)
310.6
(9.6)
12.0
820.0
(1.3)
(6.1)
263.4
710.4
(440.9)
269.5
(6.0)

Income statement progressionWealth Management profit before tax
18
£m
Net operating revenue
Net (losses)/gains on financial instruments and other income
Net income
Operating expenses
Wealth Management profit before exceptional items
Exceptional items
Wealth Management profit after exceptional items
(70.4)
31.3
3.2
34.5
116.2
0.6
116.8
(82.8)
34.0
(6.1)
27.9
101.6
0.1
101.7 133.7
130.8
(88.2)
(9.1)
H1 2016H2 2015
105.7
(75.5)
30.0
H1 2015
(0.2)
(4.0)
105.5
(4.0)
26.0 36.428.4
H2 2016
107.1
0.1
107.2
(74.8)
32.4
2.9
45.5
H1 2017

Income statement progressionGroup segment (loss)/profit before tax
19
* Comprises RWC Partners Limited and Schroder Ventures Investments Limited associates.
£m
Net gains on financial instruments and other income
Share of profit of associates*
Net income
Operating expenses
Group profit before exceptional items
Exceptional items
Group (loss)/profit after exceptional items
18.6
H1 2017
(15.3)
2.1
(14.2)
3.2
(16.8)
18.2
1.8
H2 2016H1 2016H2 2015H1 2015
20.7
15.6
1.2
16.820.0
11.9
6.9
18.8
14.3
3.6
17.9
1.1
4.8
4.7
(5.4)
(0.7)
(14.1)
5.4
-(2.4) 0.9
5.40.8 3.1
3.7
(14.6)
2.2
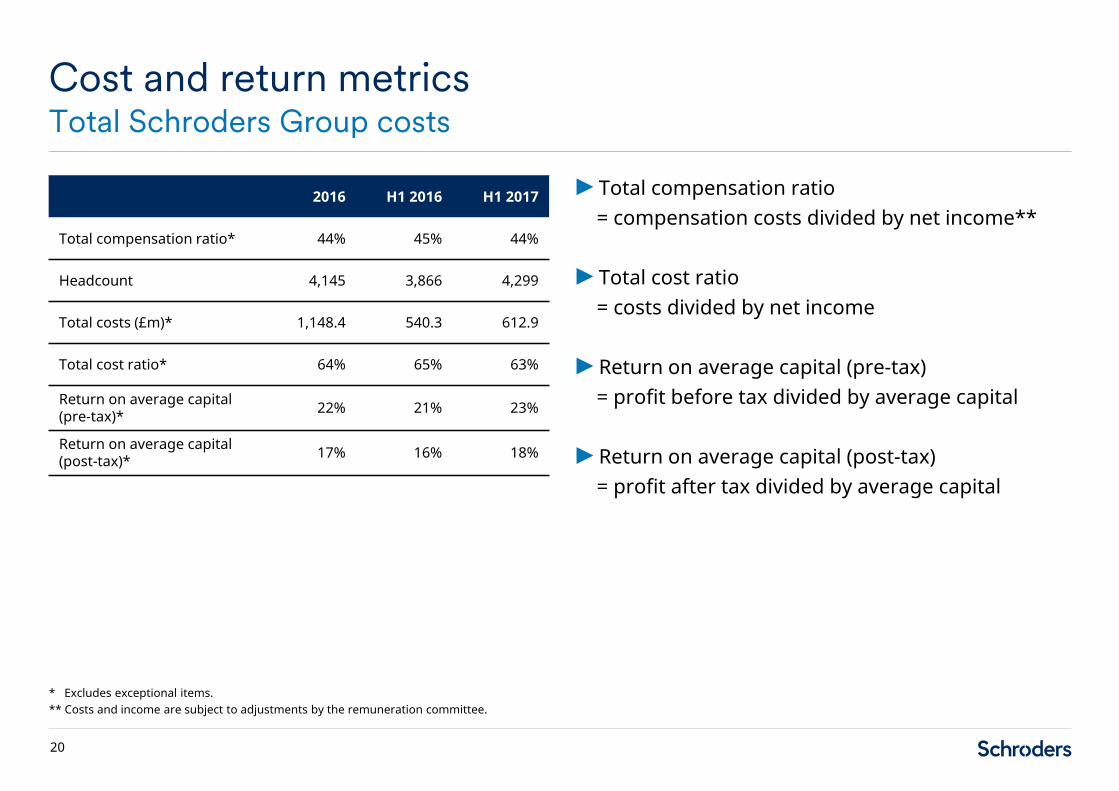
2016 H1 2016 H1 2017
Total compensation ratio* 44% 45% 44%
Headcount 4,145 3,866 4,299
Total costs (£m)* 1,148.4 540.3 612.9
Total cost ratio* 64% 65% 63%
Return on average capital (pre-tax)* 22% 21% 23%
Return on average capital (post-tax)* 17% 16% 18%
►Total compensation ratio= compensation costs divided by net income**
►Total cost ratio= costs divided by net income
►Return on average capital (pre-tax)= profit before tax divided by average capital
►Return on average capital (post-tax)= profit after tax divided by average capital
Cost and return metricsTotal Schroders Group costs
20
* Excludes exceptional items.** Costs and income are subject to adjustments by the remuneration committee.

890 967
814850
20421393
1,2451,087
0
500
1,000
1,500
2,000
2,500
3,000
3,500
2016 H1 2017Surplus Capital
Capital Surplus
Interim Dividend
Capital Buffer
Regulatory Capital
Other Items**
890 967
879 863
325 409
144 151
915 820
0
500
1,000
1,500
2,000
2,500
3,000
3,500
2016 H1 2017Capital Allocation
Investment Capital - Liquid
Investment Capital -Illiquid*Working Capital - SeedCapitalWorking Capital - Other
Other Items**
Group Capital (£m)Increase of £57m in the six months ended 30 June 2017
21
* Comprises co-investment funds and private equity.**Comprises goodwill, intangible assets, pension scheme surplus, other associates and joint ventures and deferred tax.
3,153 3,1533,210 3,210