school finance 101 by ben irwin business manager parkview school district
TRANSCRIPT

School Finance 101
by Ben IrwinBusiness Manager
Parkview School District

2
Components of School Finance
• The WUFAR• Revenue Limits• Equalization Aid• Tax Levy• Equalized Value of Property• Membership• Debt

3
The WUFAR
• School districts in Wisconsin use the Wisconsin Uniform Financial Accounting Requirements (WUFAR) to categorize all of their finances.
• The WUFAR is fund accounting, which separates each revenue and expenditure into a specific fund.
• A majority of school finances are held in the General Fund (Fund 10), but there are also other funds for areas like food service and special education.

4
The WUFAR

5
Revenue Limits
Overview• School districts have a limit
on their revenues they are able to collect each year.
• Money calculated in the revenue limit formula comprises about 85% of a district’s revenue.
• The revenue limit is Equalization Aid plus Property Taxes.
Revenue Limit
Revenue85%
Other Operat-
ing Rev-enue15%

6
Revenue Limits
Tax Levy
Equalization Aid
Revenue Limit

7
Revenue Limits
Key Components• Prior-year aid.• Three-year history of
student membership.• Property values.• Prior-year base revenue per
member.• Allowable per pupil change.

8
Revenue Limits
Year Per Pupil
2005-06 $ 248.48
2006-07 $ 256.93
2007-08 $ 264.12
2008-09 $ 274.68
2009-10 $ 200.00
2010-11 $200.00
2011-12 $ -561.28
2012-13 $ 50.00
Allowable Per Pupil Change• Each year, districts are
allowed to add in a per-pupil increase.
• Traditionally this number was indexed for inflation.
• However, with the recent changes to the law, this number has been limited in recent years.

9
Equalization Aid
Overview• School districts receive
money from the state each year called equalization aid.
• Similar to revenue limits, many factors are involved when calculating equalization aid.
• For most school districts, this is their largest source of revenue.

10
Equalization Aid
Key Components• Property values (more aid
will go to “Property Poor Districts”).
• Prior-year spending.• Membership from
September and January counts.
SpendingEligible costs
MembershipEqualized
Valuation of Property

11
Tax Levy
Revenue Limit Equalization Aid Tax Levy

12
Tax Levy
Overview• Limits are set from the state on how much a district can
tax.• School districts can seek additional taxes through non-
referendum debt and community activities.

13
Mill Rate
• The mill rate is a calculation of taxes per $1,000 of equalized values.
• Useful for comparing school districts, but a poor reflection of what taxpayers will see on their bill.
• Individual tax levies are separated by municipality and then by individual property values.

14
Equalized Value of Property
Overview• Determined by the state
Department of Revenue.• Used to divide property taxes
between municipalities in the district.
• Once we tell each municipality how much they owe the district in taxes, they divide that number among property owners based on assessed values.
2010-2011 Equalized Value
Percent of District Value
2010-2011Avon 18,439,620 4.4%Center 24,115,682 5.8%Magnolia 4,913,144 1.2%Newark 123,226,900 29.5%Plymouth 97,926,100 23.4%Rock 12,652,617 3.0%Spring Valley 34,561,067 8.3%Footville 33,988,300 8.1%Orfordville 68,189,900 16.3%Total District 418,013,330 100.00%

15
Membership
Overview• Outside of state factors, membership will have the largest impact on
school finances.• The revenue limit will use a three-year average of membership from
student counts in September.• Equalization Aid will use September and January counts from last year.
16
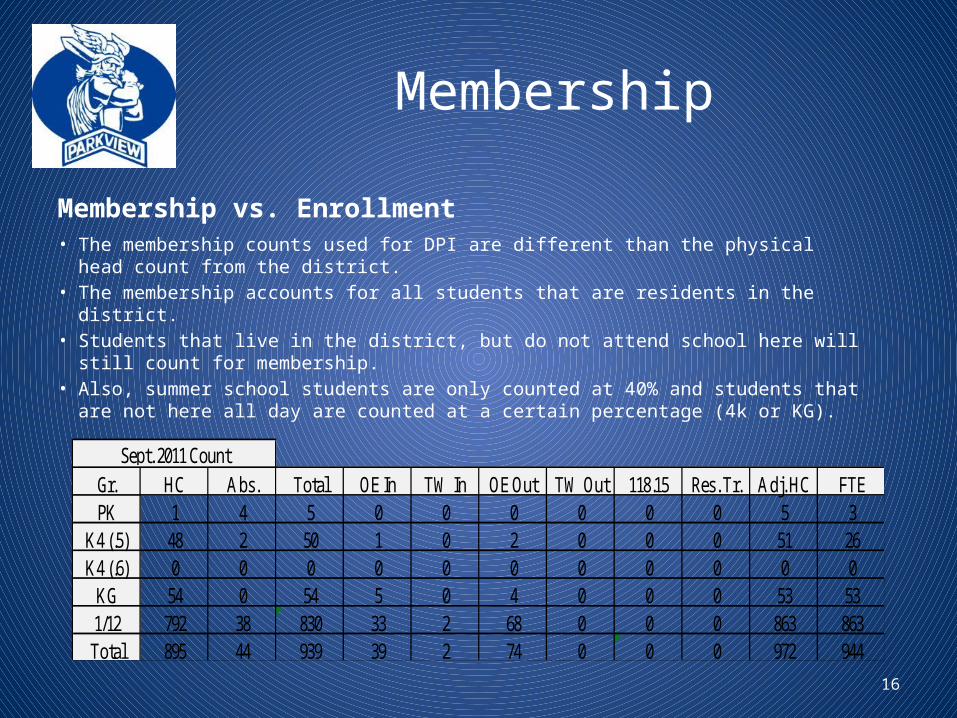
Membership
Membership vs. Enrollment• The membership counts used for DPI are different than the physical head count from
the district.• The membership accounts for all students that are residents in the district.• Students that live in the district, but do not attend school here will still count for
membership.• Also, summer school students are only counted at 40% and students that are not
here all day are counted at a certain percentage (4k or KG).
Gr. HC Abs. Total OE In TW In OE Out TW Out 118.15 Res. Tr. Adj. HC FTEPK 1 4 5 0 0 0 0 0 0 5 3
K4 (.5) 48 2 50 1 0 2 0 0 0 51 26K4 (.6) 0 0 0 0 0 0 0 0 0 0 0
KG 54 0 54 5 0 4 0 0 0 53 531/12 792 38 830 33 2 68 0 0 0 863 863Total 895 44 939 39 2 74 0 0 0 972 944
Sept. 2011 Count

17
Membership
Open Enrollment• Students are allowed to attend a
different school from their resident district if they choose to.
• School districts are still able to count the open enrolled student in their revenue limit and equalization aid count numbers.
• However, districts will pay a large portion of the open enrolled student’s tuition to the district they are attending.
Base Revenue per Member 2011-12 (amount received for each resident
student)$9,643.73
Open Enrollment Tuition 2011-12 (amount that we must pay for each
resident student that attends a different school)
$6,867.00

18
Debt
• School districts can burrow up to $1,000,000 without elector approval (Fund 38) and all of this debt must be repaid within the revenue limit.
• Beyond that, school districts must get voter approval through a referendum (Fund 39).
• When referendum is passed, a school district has the authority to go beyond the revenue limit.

19
Debt
Short-Term Borrowing• Due to the variances in school revenues and expenditures, a lot
of school districts in Wisconsin will short-term borrow each year. • While expenditures are fairly consistent each month, revenues
come in lump sums, which can impact a school district’s cash flow situation.
Jul Aug Sep Oct Nov Dec Jan Feb Mar Apr May Jun $-
$500,000.00
$1,000,000.00
$1,500,000.00
$2,000,000.00
Revenues
