school board proposed operating budget
TRANSCRIPT
School Board Proposed Operating Budget
FY 2021/22
V I R G I N I A B E A C H C I T Y P U B L I C S C H O O L S
VIRGINIA BEACH CITY PUBLIC SCHOOLS SCHOOL BOARD PROPOSED OPERATING BUDGET
FY 2021/22 School Board
Carolyn T. Rye, Chair District 5 – Lynnhaven
Kimberly A. Melnyk, Vice Chair District 7 – Princess Anne
Beverly M. Anderson At-Large
Sharon R. Felton District 6 – Beach
Jennifer S. Franklin District 2 – Kempsville
Dorothy M. Holtz At-Large
Laura K. Hughes At-Large
Victoria C. Manning At-Large
Jessica L. Owens District 3 – Rose Hall
Trenace B. Riggs District 1 – Centerville
Carolyn D. Weems District 4 – Bayside
Administration
Aaron C. Spence, Ed.D. Superintendent
Natalie N. Allen Chief Communications and Community Engagement Officer
Marc A. Bergin, Ed.D. Chief of Staff
David N. Din Chief Information Officer
John D. “Jack” Freeman Chief Operations Officer
Farrell E. Hanzaker Chief Financial Officer
John A. Mirra Chief Human Resources Officer
Donald E. Robertson, Jr., Ph.D. Chief Schools Officer
Kipp D. Rogers, Ph.D. Chief Academic Officer

This page intentionally left blank

TABLE OF CONTENTS GUIDE TO UNDERSTANDING THE BUDGET .......................................................................................................................................... 3
Budget Organization........................................................................................................................................................................... 3 Budget Basics .................................................................................................................................................................................... 3 Staff and Citizens in the Budget Process ........................................................................................................................................... 4
SCHOOL BOARD CHAIR’S MESSAGE TO MAYOR AND CITY COUNCIL .................................................................................................... 5 PROPOSED BUDGET RESOLUTIONS .................................................................................................................................................. 7
School Operating Budget Resolution.................................................................................................................................................. 7 Capital Improvement Program Budget Resolution .............................................................................................................................. 9
SUPERINTENDENT’S BUDGET MESSAGE .......................................................................................................................................... 12 DIVISION ORGANIZATION ............................................................................................................................................................... 16
School Board Members .................................................................................................................................................................... 16 Administration .................................................................................................................................................................................. 17 Organizational Chart ........................................................................................................................................................................ 17
SCHOOL BOARD STRATEGIC FRAMEWORK ...................................................................................................................................... 18 Mission ............................................................................................................................................................................................. 18 Vision ............................................................................................................................................................................................... 18 Core Values ..................................................................................................................................................................................... 18 Goals ................................................................................................................................................................................................ 19
BUDGET DEVELOPMENT PROCESS ................................................................................................................................................. 20 Budget Planning ............................................................................................................................................................................... 20 Budget Development Overview ........................................................................................................................................................ 20 Capital Improvement Program Budget ............................................................................................................................................. 21 Budget Adoption ............................................................................................................................................................................... 22 Budget Amendments ........................................................................................................................................................................ 22 Budget Calendar .............................................................................................................................................................................. 23
SCHOOL BOARD FUNDS ................................................................................................................................................................ 24 Budgetary Basis ............................................................................................................................................................................... 24 Fund Descriptions ............................................................................................................................................................................ 26
FY 2021/22 BUDGET AT A GLANCE ............................................................................................................................................... 27 Budget Summary ............................................................................................................................................................................. 27 Budgetary Priorities/Challenges ....................................................................................................................................................... 28 School Operating Budget Highlights ................................................................................................................................................. 30 Unmet Needs ................................................................................................................................................................................... 32
GENERAL FUND ............................................................................................................................................................................ 33 School Operating Fund Revenue Sources ....................................................................................................................................... 33 School Operating Fund by Major Category Classification ................................................................................................................. 34 School Operating Fund Expenditures by Type ................................................................................................................................. 35 General Fund Revenue Budget Comparison .................................................................................................................................... 36 General Fund Expenditures Budget Comparison ............................................................................................................................. 37 Expenditures by Major Category Classification and Type ................................................................................................................. 38
SPECIAL REVENUE FUNDS ............................................................................................................................................................. 39 Categorical Grants ........................................................................................................................................................................... 39 Other Funds ..................................................................................................................................................................................... 40 Categorical Grants and Other Funds Revenue ................................................................................................................................. 41 Categorical Grants and Other Funds Expenditures .......................................................................................................................... 42
OPERATING COSTS OF AVERAGE DAILY MEMBERSHIP ..................................................................................................................... 43 Student Enrollment ........................................................................................................................................................................... 43 Budgeted Expenditures Per Pupil ..................................................................................................................................................... 44
PERSONNEL RESOURCE ALLOCATIONS ........................................................................................................................................... 46 Staffing Process and Timeline .......................................................................................................................................................... 46 Staffing Allocation Summary ............................................................................................................................................................ 46
CAPITAL IMPROVEMENT PROGRAM BUDGET SUMMARY .................................................................................................................... 49 Project Costs .................................................................................................................................................................................... 49 Means of Financing .......................................................................................................................................................................... 49
APPENDIX .................................................................................................................................................................................... 51 The Strategic Framework ................................................................................................................................................................. 53 Schools and Centers ........................................................................................................................................................................ 55 Staffing Standards and Guidelines ................................................................................................................................................... 57 Revenue Sharing Policy ................................................................................................................................................................... 69 Budget Manager and Signature Authority ......................................................................................................................................... 74
2
This page intentionally left blank

3
GUIDE TO UNDERSTANDING THE BUDGET BUDGET ORGANIZATION Virginia Beach City Public Schools (VBCPS) plans and develops a budget on an annual basis. The Code of Virginia requires each superintendent to prepare a budget reflective of the needs of the school division. It is the responsibility of the School Board to balance the needs of the school division against the available resources. VBCPS’ budget is developed using a variety of standards and practices that reflect federal laws, state codes, local policies and School Board regulations. Management is responsible for establishing and maintaining an internal control structure designed to ensure that the assets of the School Board are protected from loss, theft or misuse and to ensure that adequate accounting data is compiled to allow for the preparation of financial statements in conformity with Generally Accepted Accounting Principles (GAAP). For accounting purposes, the fiscal year (FY) for VBCPS encompasses the 12 months beginning July 1 and ending June 30. The FY 2021/22 School Board Proposed Operating Budget is presented as a communications document that provides information required for making policy and budgetary decisions. The Proposed Operating Budget details projected revenues and expenditures and outlines proposed changes compared to budgets from prior fiscal years. In this document, the total School Operating budget is presented first by fund; then within each fund, revenue and expenditures are shown in detail. The FY 2021/22 Proposed Operating Budget presents financial summaries and comparisons expanded to report up to five years of data. This document is a record of past decisions, a spending plan for the future, and serves as a resource for students, employees and citizens interested in learning about the operation of VBCPS. BUDGET BASICS Where do my tax dollars go? Nearly 85.0 percent of the School Operating fund budget goes to personnel costs. The remaining 15.0 percent must address needs such as utility bills for schools and gasoline for school buses. Annually, there is typically less than 2.0 percent of this 15.0 percent available for discretionary spending. How are revenue and expenditures projected? There are many unpredictable factors affecting the projection of revenue and expenditures. It is, therefore, important that VBCPS develops and utilizes budget assumptions that are current and based on data and information available at the time the budget is formulated. VBCPS continuously monitors revenue and expenditures throughout the year, which is an essential step to maintain a balanced budget and prevent a deficit. How are budgets developed each year? The baseline budgets for schools and centers are determined primarily by application of ratio-based formulas that meet or exceed state requirements and have been approved by the School Board. Each year, school-based positions are recalculated based on the projected enrollment for the next year using the School Board approved staffing formulas. Staffing formulas and examples of how staffing is calculated and allocated to schools are included in the Appendix. How are revenue and expenditures classified? The primary elements used to classify revenue and expenditures are fund, major category and account type. Funds represent the highest level of the classification structure. Major category refers to the classification of expenditures pursuant to §22.1-115, Code of Virginia. Account type denotes revenue or expenditures. Does VBCPS end each year with money that is unspent? Each year state and local governments typically end the year with an available ending balance to ensure that they meet revenue projections and do not exceed expenditure appropriations. As a result, VBCPS has historically ended each fiscal year with a positive ending balance. This is a responsible budgeting practice considering that the division is required by law to have a balanced budget. Included in the ending balance is carryover funding for outstanding encumbered obligations, accounting for orders of goods or services that have not been received or performed as of June 30.
4
VBCPS is a component unit of the city of Virginia Beach. Appropriations of the division’s budget are authorized by the City Council as part of the city’s budget adoption process. VBCPS fund balances at year-end lapse into the fund balance of the city’s General fund. The School Board may request, by resolution to the City Council, the re-appropriation of fund balances to the subsequent fiscal year through the reversion process. As a result of changing conditions, available ending balances vary year-to-year and typically represent a small fraction of the overall budget. For example, when fuel prices are low, there are one-time savings that are included in the available ending balance. Since these conditions fluctuate, it is most prudent to use those monies for one-time needs, rather than ongoing expenditures. What is a “structurally balanced budget?” To address serious economic circumstances in recent years, VBCPS has had to rely on one-time reversion funds to augment the School Operating budget and pay for recurring expenses. While the use of one-time funding has helped bridge the gap between the revenue available and expenditures, the use of these funds to pay for ongoing costs has created a structural imbalance that requires recurring revenue to resolve. A structurally balanced budget is one that supports financial sustainability for multiple years into the future. For a variety of reasons, a structurally balanced budget may not be possible at a given time. In such a case, using reserves to balance the budget may be considered, but only in the context of a plan to return to structural balance, replenish fund balance, and ultimately remediate the negative impacts of any other short-term balancing actions that may be taken. STAFF AND CITIZENS IN THE BUDGET PROCESS The budget process includes strategies to inform staff, parents and the community and provides opportunities for all participants to offer input and engage with VBCPS. This is accomplished through strategically held public hearings, meetings and forums with various stakeholder groups. The budget development process enables a broad spectrum of individuals and organizations to bring their ideas to the School Board and provide input on how money will be spent. Throughout the budget development season, staff and citizens may visit VBCPS’ website to view the latest updates and access important reference materials.

VIRGINIA BEACH CITY PUBLIC SCHOOLS CHARTING THE COURSE
School Board Services
Carolyn T. Rye, Chair
District 5 - Lynnhaven
Kimberly A. Melnyk, Vice Chair
District 7 - Princess Anne
Beverly M. Anderson
At-Large
Dorothy M. Holtz
At-Large
Jessica L. Owens
District 3 _: Rose Hall
March 2, 2021
Sharon R. Felton
District 6 - Beach
Laura K. Hughes
At-Large
Trenace B. Riggs
District 1 - Centerville
Aaron C. Spence, Ed.D., Superintendent
The Honorable Robert M. Dyer, Mayor
Members of City Council
City of Virginia Beach
Building 1
Municipal Center
Virginia Beach, VA 23456
Dear Mayor Dyer, Vice Mayor Wood and Members of City Council,
Jennifer S. Franklin
District 2 - Kempsville
Victoria C. Manning
At-Large
Carolyn D. Weems
District 4 - Bayside
On behalf of the School Board of the City of Virginia Beach, I am pleased to present to you the Virginia
Beach City Public Schools' (VBCPS) fiscal year 2021-22 budget document. This is a representation of
what we prioritize as a school board and as a school division. We believe the initiatives outlined in this
plan are essential to providing VBCPS students and staff with the supports they need to succeed during
the ongoing health pandemic and beyond.
In this $828.8 million spending plan, the School Board has prioritized the following:
• Employee compensation - Given that Virginia continues to lag most of the country in teacher
pay and what our educators and support staff have endured this last year, we have proposed a
4.5% increase for a cost of living adjustment (COLA) for all staff and a 0.5% step increase for
those reaching or below top of scale. Custodians will be moved up a pay grade. And for the first
tim� in more than 20 years, we've budgeted an increased allowance for employees with
advanced degrees.
Put Students First • Seek Growth • Be Open to Change • Do Great Work Together • Value Differences
2512 George Mason Drive I P.O. Box 6038 I Virginia Beach. Virginia 23456-0038 www vbschools.com
5
VIRCINIA BEACH CITY PUBLIC SCHOOLS CHARTING THE COURSE
• Student mental health - We are increasing the number of guidance counselors for elementaryand middle schools by 16 in order to meet new SQQ requirements, thus allowing us to build onthe progress in our understanding and implementation of Social and Emotional Learning (SEL)competencies in our schools. We have also budgeted an increase for our school counselingchairs, another long-term unmet need.
• Continued focus on special education needs.• Additional positions and supports for our English Learner (EL) population.• Additional positions and supports for our Spanish Immersion program.• Continuing support for the Environmental Studies Program at Brock Center.
The proposed Capital Improvement Program (CIP) includes funding in the six-year appropriationtotaling $619,653, 047. Included in this CIP are funds to complete three projects currently underway: thePrincess Anne Middle School Replacement, the Plaza Annex Addition, and An Achievable DreamAcademy at Lynnhaven Middle School. We also plan to begin the replacement of Princess Anne HighSchool, which is now fully funded in the six-year CIP, as is the Bettie F. Williams ElementarySchool/Bayside 6th Grade Campus project. This CIP also includes initial funding to plan for the BaysideHigh School· Replacement project in years five and six of the program.
Despite the COVID-19 obstacles we continue to face, as well as the fiscal challenges we've wrestledwith as a result, VBCPS has thrived. I am proud to say that all schools are accredited for the fourth yearin a row. For the 12th consecutive year, VBCPS reached a record on-time graduation rate whilecontinuing to lower its dropout rate. The division was a first-place winner of the National School BoardAssociation's 2020 Magna Award, for removing barriers for students through JumpStart, a partnershipbetween local nonprofit AidNow and the division's school social work services. The State Board ofEducation awarded VBCPS with nine 2020 Highest Achievement Exemplar Awards, more than anyother school division in the state. And VBCPS was the only school division in the Commonwealth to bedesignated a Virginia Environmental Excellence Program Sustainability Partner by the VirginiaDepartment of Environmental Quality. These accomplishments and so many others are a testament tothe great work that goes on in our schools each day.
I want to personally thank the Mayor and City Council for their ongoing, steadfast support of VBCPS.The Board looks forward to continuing our collaboration as we navigate a post-pandemic world andmaintain Virginia Beach's renown as a world-class destination for families.
Sincerely,
10 /1 11 f'v . �
Lll�';-1�� ,, CarolynT. fje '
(J School Board Chair
Put Students First • Seek Growth • Be Open to Change • Do Great Work Together • Value Differences
2512 George Mason Drive I P.O. Box 6038 I Virginia Beach. Virginia 23456-0038 www.vbschools.com
6

VIRGINIA BEACH CITY PUBLIC SCHOOLS CHARTING THE COURSE
School Board Services
Carolyn T. Rye, Chair
District 5 - Lynnhaven
Kimberly A. Melnyk, Vice Chair
District 7 - Princess Anne
Beverly M. Anderson
At-Large
Dorothy M. Holtz
At-Large
Jessica L. Owens
District 3 - Rose Hall
Sharon R. Felton
District 6 - Beach
Laura K. Hughes
At-Large
Trenace B. Riggs
District 1- Centerville
Aaron C. Spence, Ed.D., Superintendent
Budget Resolution - FY 2021/22
Jennifer S. Franklin
District 2 - Kempsville
Victoria C. Manning
At-Large
Carolyn D. Weems
District 4 - Bayside
WHEREAS, the mission of Virginia Beach City Public Schools (VBCPS), in partnership with the entire community, is to empower every student to become a life-long learner who is a responsible, productive, and engaged citizen within the global community; and
WHEREAS, the School Board of the City of Virginia Beach has adopted a comprehensive strategic plan and school improvement priorities to guide budgetary decisions; and
WHEREAS, the School Board has studied the recommended FY 2021/22 Operating Budget in view of state and federal requirements, the strategic plan, priorities, community expectations, competitive compensation for employees and the best educational interests of its students; and
WHEREAS, the City/School Revenue Sharing Policy provides 46. 75% of certain general fund revenues to meet obligations of the School Board of the City of Virginia Beach; and
WHEREAS, the proposed Operating Budget moves all eligible employees up an experience step (0.5 percent) not to exceed the "top of scale" and provides a 4.5 percent cost of living adjustment (COLA) for all employees; and
WHEREAS, the total funds requested for FY 2021/22 from the City of Virginia Beach to the School Board of the City of Virginia Beach are $467,760,752, and
WHEREAS, the debt service payment is estimated to be $49,442,812 leaving a balance of $418,317,940 to allocate between the Operating Budget and the Capital Improvement Program (CIP); and
WHEREAS, $5,300,000 of the School Reserve Special Revenue Fund, which would have normally been used for major one-time purchases, will now be budgeted to use for the FY 2021/22 Operating Budget.
NOW, THEREFORE, BE IT
Put Students First • Seek Growth • Be Open to Change • Do Great Work Together • Value Differences
2512 George Mason Drive I P.O. Box 6038 I Virginia Beach, Virginia 23456-0038 www vbschools.com
7
VIRCINIA BEACH CITY PUBLIC SCHOOLS CHARTING THE COURSE
School Board Services
Carolyn T. Rye, Chair
District 5 - Lynnhaven
Kimberly A. Melnyk, Vice Chair
District 7 - Princess Anne
Beverly M. Anderson
At-Large
Dorothy M. Holtz
At-Large
Jessica L. Owens
District 3 - Rose Hall
Sharon R. Felton
District 6 - Beach
Laura K. Hughes
At-Large
Trenace B. Riggs
District 1 - Centerville
Aaron C. Spence, Ed.O., Superintendent
Budget Resolution - FY 2021/22 (continued)
Jennifer S. Franklin
District 2 - Kempsville
Victoria C. Manning
At-Large
Carolyn D. Weems
District 4 - Bayside
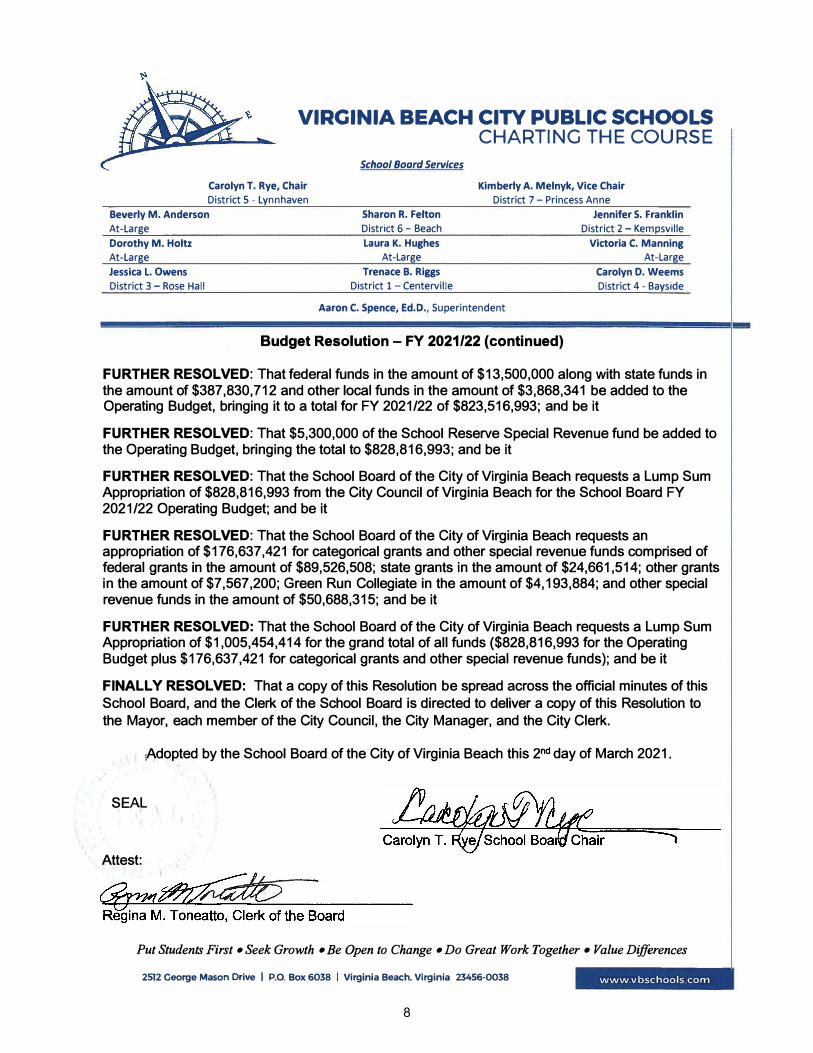
FURTHER RESOLVED: That federal funds in the amount of $13,500,000 along with state funds in the amount of $387,830,712 and other local funds in the amount of $3,868,341 be added to the Operating Budget, bringing it to a total for FY 2021/22 of $823,516,993; and be it
FURTHER RESOLVED: That $5,300,000 of the School Reserve Special Revenue fund be added to the Operating Budget, bringing the total to $828,816,993; and be it
FURTHER RESOLVED: That the School Board of the City of Virginia Beach requests a Lump Sum Appropriation of $828,816,993 from the City Council of Virginia Beach for the School Board FY 2021/22 Operating Budget; and be it
FURTHER RESOLVED: That the School Board of the City of Virginia Beach requests an appropriation of $176,637,421 for categorical grants and other special revenue funds comprised of federal grants in the amount of $89,526,508; state grants in the amount of $24,661,514; other grants in the amount of $7,567,200; Green Run Collegiate in the amount of $4,193,884; and other special revenue funds in the amount of $50,688,315; and be it
FURTHER RESOLVED: That the School Board of the City of Virginia Beach requests a Lump Sum Appropriation of $1,005,454,414 for the grand total of all funds ($828,816,993 for the Operating Budget plus $176,637,421 for categorical grants and other special revenue funds); and be it
FINALLY RESOLVED: That a copy of this Resolution be spread across the official minutes of this School Board, and the Clerk of the School Board is directed to deliver a copy of this Resolution to the Mayor, each member of the City Council, the City Manager, and the City Clerk.
iAdopted by the School Board of the City of Virginia Beach this 2nd day of March 2021.
SEAL
Attest:
Put Students First • Seek Growth • Be Open to Change • Do Great Work Together • Value Differences
2512 George Mason Drive I P.O. Box 6038 I Virginia Beach. Virginia 23456-0038 www.vbschools com
8

VIRCINIA BEACH CITY PUBLIC SCHOOLS CHARTING THE COURSE
School Board Services
Carolyn T. Rye, Chair
District 5 · Lynnhaven
Kimberly A. Melnyk, Vice Chair
District 7 - Princess Anne
Beverly M. Anderson
At-Large
Dorothy M. Holtz
At-Large
Jessica L. Owens
District 3 - Rose Hall
Sharon R. Felton
District 6 - Beach
Laura K. Hughes
At-Large
Trenace B. Riggs
District 1 - Centerville
Aaron C. Spence, Ed.D., Superintendent
FY 2021/22 - FY 2026/27 Capital Improvement Program BUDGET RESOLUTION
Jennifer S. Franklin
District 2 - Kempsville
Victoria C. Manning
At-Large
Carolyn D. Weems
District 4 - Bayside
WHEREAS, the mission of Virginia Beach City Public Schools, in partnership with the entire community, is to empower every student to become a life-long learner who is a responsible, productive, and engaged citizen within the global community; and
WHEREAS, the School Board of the City of Virginia Beach has adopted a comprehensive strategic plan and school improvement priorities to guide budgetary decisions; and
WHEREAS, the primary funding sources for the Capital Improvement Program (CIP) are charter bonds, public facility revenue bonds, and reversion funding; and
WHEREAS, the City/School Revenue Sharing Policy provides 46. 75% of certain general fund revenues to meet obligations of the School Board of the City of Virginia Beach; and
WHEREAS, the City/School Revenue Sharing Policy allocates funds first to Debt Service, while the balance is used for the Operating Budget; and
WHEREAS, the School Board has comprehensively reviewed all sources of funding, projected various scenarios and prioritized the needs of the Operating and CIP budgets.
NOW, THEREFORE, BE IT
RESOLVED: That the School Board of the City of Virginia Beach adopts a CIP program of $619,653,047 (as shown on the attached School Board Funding Summary and Project Summary dated March 2, 2021 ), and be it
FINALLY RESOLVED: That a copy of this Resolution be spread across the official minutes of this School Board, and the Clerk of the School Board is directed to deliver a copy of this Resolution to the Mayor, each member of the City Council, the City Manager, and the City Clerk.
' 1.t>!dopted by the School Board of the City of Virginia Beach this 2nd day of March 2021.
SEAL
Attest:
Put Students First • Seek Growth • Be Open to Change • Do Great Work Together • Value Differences
2512 George Mason Drive I P.O. Box 6038 I Virginia Beach. Virginia 23456-0038 www.vbschools com
9

Fund
ing
Sour
ces
2021
/22
2022
/23
2023
/24
2024
/25
2025
/26
2026
/27
Cha
rter B
onds
32,3
00,0
0032
,300
,000
32,3
00,0
0032
,300
,000
32,3
00,0
0032
,300
,000
Sand
brid
ge0
00
00
0
Publ
ic F
acili
ty R
even
ue
Bon
ds15
,000
,000
15,0
00,0
0015
,000
,000
15,0
00,0
0012
,000
,000
12,0
00,0
00
PayG
o0
500,
000
1,00
0,00
01,
500,
000
2,00
0,00
02,
500,
000
Inte
rest
/Sal
e of
Pro
perty
¹7,
500,
000
00
00
0
Ener
gy P
erfo
rman
ce
Con
tract
s Fun
ding
5,00
0,00
03,
000,
000
3,00
0,00
03,
000,
000
3,00
0,00
03,
000,
000
Stat
e C
onst
ruct
ion
Gra
nts
00
00
00
Lotte
ry F
unds
00
00
00
Scho
ol S
peci
al R
eser
ve
Fund
Bal
ance
/Rev
ersi
on10
,000
,000
11,0
00,0
0011
,000
,000
12,0
00,0
0012
,000
,000
12,0
00,0
00
Tota
l69
,800
,000
$
61
,800
,000
$
62
,300
,000
$
63
,800
,000
$
61
,300
,000
$
61
,800
,000
¹Pro
ject
ed p
roce
eds
from
sal
e of
Las
kin
Roa
d An
nex
Vir
gini
a B
each
City
Pub
lic S
choo
lsFY
202
1/22
- FY
202
6/27
Cap
ital I
mpr
ovem
ent P
rogr
am (C
IP)
Mar
ch 2
, 202
1
10

Scho
ol B
oard
Fun
ding
Sum
mar
yVi
rgin
ia B
each
City
Pub
lic S
choo
lsFY
202
1/22
- FY
202
6/27
Cap
ital I
mpr
ovem
ent P
rogr
am (C
IP)
Mar
ch 2
, 202
1
Tota
l Pro
ject
Six
Year
Appr
opria
tions
Year
1Ye
ar 2
Year
3Ye
ar 4
Year
5Ye
ar 6
CIP
#Pr
ojec
t Cat
egor
yC
ost
Appr
opria
tions
to D
ate
2021
-202
220
22-2
023
2023
-202
420
24-2
025
2025
-202
620
26-2
027
1-00
1R
enov
atio
ns a
nd R
epla
cem
ents
-
Ener
gy M
anag
emen
t/Sus
tain
abili
ty24
,125
,000
24,1
25,0
009,
475,
000
1,80
0,00
01,
900,
000
2,15
0,00
02,
500,
000
2,90
0,00
03,
400,
000
1-00
2Te
nnis
Cou
rt R
enov
atio
ns -
Pha
se II
2,60
0,00
02,
600,
000
1,40
0,00
020
0,00
020
0,00
020
0,00
020
0,00
020
0,00
020
0,00
0
1-00
7Pr
ince
ss A
nne
Mid
dle
Scho
ol
Rep
lace
men
t77
,238
,759
77,2
38,7
5977
,238
,759
00
00
00
1-01
5Pr
ince
ss A
nne
Hig
h Sc
hool
R
epla
cem
ent
162,
650,
000
162,
650,
000
43,4
62,2
7745
,550
,000
36,0
50,0
0032
,800
,000
4,78
7,72
30
0
1-01
6En
ergy
Per
form
ance
Con
trac
ts -
Phas
e II
45,0
00,0
0045
,000
,000
25,0
00,0
005,
000,
000
3,00
0,00
03,
000,
000
3,00
0,00
03,
000,
000
3,00
0,00
0
1-01
7R
enov
atio
ns a
nd R
epla
cem
ents
-
Gro
unds
- P
hase
III
20,6
79,5
1020
,679
,510
9,07
9,51
01,
600,
000
1,80
0,00
01,
900,
000
2,00
0,00
02,
100,
000
2,20
0,00
0
1-01
8R
enov
atio
ns a
nd R
epla
cem
ents
-
HVA
C -
Pha
se II
I78
,721
,541
78,7
21,5
4120
,371
,541
7,85
0,00
08,
500,
000
9,20
0,00
010
,000
,000
10,9
00,0
0011
,900
,000
1-01
9R
enov
atio
ns a
nd R
epla
cem
ents
-
Rer
oofin
g -
Pha
se II
I50
,000
,000
50,0
00,0
0011
,550
,000
5,10
0,00
05,
500,
000
6,00
0,00
06,
600,
000
7,25
0,00
08,
000,
000
1-02
0R
enov
atio
ns a
nd R
epla
cem
ents
-
Vario
us -
Pha
se II
I30
,391
,223
30,3
91,2
2313
,491
,223
2,25
0,00
02,
400,
000
2,60
0,00
02,
850,
000
3,20
0,00
03,
600,
000
1-02
1Pl
aza
Anne
x/La
skin
Roa
d O
ffice
Ad
ditio
n13
,750
,000
13,7
50,0
0013
,750
,000
00
00
00
1-02
2El
emen
tary
Sch
ool P
layg
roun
d Eq
uipm
ent R
epla
cem
ent
2,58
4,73
72,
584,
737
1,08
4,73
725
0,00
025
0,00
025
0,00
025
0,00
025
0,00
025
0,00
0
1-02
6Ac
hiev
able
Dre
am a
t Lyn
nhav
en
Mid
dle
Scho
ol12
,750
,000
12,7
50,0
0012
,750
,000
00
00
00
1-02
7R
enov
atio
ns a
nd R
epla
cem
ents
- Sa
fe
Scho
ol Im
prov
emen
ts1,
400,
000
1,40
0,00
020
0,00
020
0,00
020
0,00
020
0,00
020
0,00
020
0,00
020
0,00
0
1-02
8B
.F. W
illia
ms/
Bay
side
6th
(Gra
des
4-6)
R
epla
cem
ent
68,3
87,5
0068
,387
,500
00
2,00
0,00
04,
000,
000
31,4
12,2
7721
,300
,000
9,67
5,22
3
1-02
9B
aysi
de H
igh
Scho
ol R
epla
cem
ent
197,
700,
000
29,3
74,7
770
00
00
10,0
00,0
0019
,374
,777
Tota
l Pro
ject
Six
Year
Appr
opria
tions
Year
1Ye
ar 2
Year
3Ye
ar 4
Year
5Ye
ar 6
Cos
tAp
prop
riatio
nsto
Dat
e20
21-2
022
2022
-202
320
23-2
024
2024
-202
520
25-2
026
2065
-202
7G
RAN
D T
OTA
L (a
ll pr
ojec
ts)
787,
978,
270
619,
653,
047
238,
853,
047
69,8
00,0
0061
,800
,000
62,3
00,0
0063
,800
,000
61,3
00,0
0061
,800
,000
TAR
GET
S69
,800
,000
61,8
00,0
0062
,300
,000
63,8
00,0
0061
,300
,000
61,8
00,0
00D
IFFE
REN
CE
00
00
00
11
Aaron C. Spence, Ed.D. Superintendent
February 2, 2021
Chairwoman Rye, Vice-Chair Melnyk and School Board Members,
This Superintendent’s Estimate of Needs (SEON) is often considered to be the unofficial “kick off” to the Board’s budget development process, acknowledging months of discussions and presentations we have had throughout the year about priorities as a school division. However, as I present you this document, the world is a very different place from where we were a year ago at this time, so it may read a little differently than previous SEONs.
Since March of 2020, we’ve navigated the uncharted territory of managing education while in the throes of a worldwide health pandemic. From the moment the governor shut down schools last Spring, the need to build essentially two new school divisions – one all virtual, one face-to-face – emerged, and we hardly missed a beat. We kept our staff employed and paid throughout, taking care of our workforce and bolstering our local and state economies in a time of economic crisis. We created our Continuity of Learning Plan and then shifted to our Emergency Learning Plan, providing some synchronous learning and a more robust asynchronous experience. We tackled the challenges of ending the last school year with minimal learning loss and providing our staff, students and families with the supports they needed. Then we developed and implemented our Fall 2020 Plan, which gave families a choice of virtual or in-person learning and provided a blueprint for a successful first half of the school year. And now, elements of that plan are serving as the foundation for the rest of the 20-21 academic year as we continue to progress in our knowledge both of the virus and of the needs of our school division.
While our $828.8 million operating budget encompasses the wide range of requirements that it takes to run our school system every day, we have always made sure to not only provide the bare essentials to our students and staff, but also the resources and compensation they and our community expect. For the School Board and for this administration, teacher compensation remains a top priority for fiscal year 2021-22. We have heard and we understand how imperative it is for our school staff to be paid what they deserve, and we want to continue making a significant impact in that regard. Given what our teachers have endured this last year, it seems more important than ever that we make good on that request, which is why we have proposed a 4.5% increase in cost of living adjustment (COLA) and a 0.5% step increase for those reaching or below top of scale. For the first time in more than 20 years, we’ve also budgeted for an increased allowance for those employees with advanced degrees, which will make us more competitive in the local market.
While compensation increases are our top priority, we’ve also addressed other division needs in this Estimate of Needs. We’ve continued to put an emphasis on the mental health of our students, for example, by increasing the number of guidance counselors for elementary and middle schools by 16 to meet new SOQ requirements. This will allow us to build on some remarkable progress in our understanding and implementation of Social and Emotional Learning (SEL) competencies in our schools. And, we also intend to continue providing the necessary supports for our growing English as a Second Language (ESL) and special education populations. Finally, we’re very excited to
12

Chairwoman Rye, Vice-Chair Melnyk and School Board Members Page 2 February 2, 2021
provide funding to expand the Spanish Immersion Program and further support the Environmental Studies Program at the Brock Center.
The reason we are on such firm financial ground today—and why we were able to provide our students and staff with the remarkable amount of support we did during an extraordinary time financially and otherwise—is thanks to our chief financial officer, to our award-winning budget and finance staff and to you, our School Board. I am very grateful to work for a school division where we put students and staff first, no matter the situation.
I am also very proud of the work we do in VBCPS, work that provides evidence of the sound stewardship of the resources available to us here. Despite the pandemic-related obstacles we continue to face, as well as the fiscal challenges we’ve wrestled with as a result of the pandemic, VBCPS has thrived. I am proud to say that for the 12th consecutive year, VBCPS reached a record-high On-Time Graduation (OTG) rate, which now stands at 94.2%. In addition, the division’s dropout rate decreased to 2.9%—the lowest on record. VBCPS also outperformed Virginia’s rates of 92.3% for OTG and 5.1% for dropouts. That’s right. Amid a global pandemic, our graduation rate went up, not down.
What a testament to our work. Not only did we graduate our seniors during a health crisis, but we have we kept our future graduates connected to learning and cared for throughout. While our division has been 1:1 for some time, we’ve made our parking lots and playgrounds Wi-Fi accessible and offered extended hours for Chromebook exchange or replacement. One thousand hot spots were purchased and delivered to families, and five thousand wireless headphones were given to teachers along with faster, more powerful laptops.
We’ve kept students fed by making meals available via a pickup model at all schools and by delivering food via bus in some of our more vulnerable neighborhoods. Between March and December 2020, we served or delivered more than 3.8 million meals, and we’re currently averaging 150,000 meals per week.
When our school buildings were closed for in-person learning, we partnered with the city to open Safe Learning Centers, where children of working parents could be secure during the day.
Thanks to your guidance, our resilient, dedicated staff and a patient, supportive community, we have made some amazing things happen. Here are just a few more accomplishments from a remarkable year:
• Virginia Beach City Public Schools was a first-place winner of the National School BoardAssociation's 2020 Magna Award for removing barriers for students through JumpStart, apartnership between local nonprofit AidNow and the division's school social work services.
• For exceeding state accreditation standards, narrowing achievement gaps and improving outcomesfor students, the State Board of Education awarded Virginia Beach City Public Schools with nine2020 Highest Achievement Exemplar Awards, more than any other school division in the state.Twelve schools in the division earned the 2020 Continuous Improvement Award, which highlightsthose schools that are rated “accredited” or “accredited with conditions” for 2019-2020. No otherHampton Roads school division earned as many Continuous Improvement awards.
13

Chairwoman Rye, Vice-Chair Melnyk and School Board Members Page 3 February 2, 2021
• Parkway Elementary School was named a 2020-2021 National ESEA Distinguished School. This isthe second year in a row for a VBCPS school to earn this honor. Rosemont Elementary School wasa 2019-2020 National ESEA Distinguished School.
• For the second year in a row, VBCPS was designated a Virginia Environmental ExcellenceProgram Sustainability Partner by the Virginia Department of Environmental Quality. VBCPS is theonly school division in the state to earn this distinction.
• VBCPS was recognized by VDOE as one of only 15 "School Divisions of Innovation" for designingand implementing alternatives to traditional instructional practices that improve student learning andpromote college and career readiness, and good citizenship.
• For the third consecutive year, all VBCPS comprehensive high schools earned the National GoldCouncil of Excellence Award from the National Association of Student Councils (NASC). This awardrecognizes student councils for their records of leadership, service and activities that improve theschool and community. VBCPS represents more than 50% of the schools in Virginia on the list ofawardees
• And, for 11 consecutive years, we have been named one of the Best Communities for MusicEducation by the National Association of Music Merchants (NAMM) Foundation for outstandingcommitment to music education. Less than 5% of school districts across the nation earn thisprestigious award.
I’m also excited about our recently adopted equity policy that provides a framework to advance educational equity in alignment the division’s vision, values, and priorities. This policy calls on us to create an environment where all students have the opportunity to benefit from high standards and where all students have access to effective and inclusive learning environments and the resources required for a high-quality education. As a result, there will be an equity assessment in the coming months, ultimately leading to the development of an equity plan that will guide our work as we seek to bring to life the goals and emphases outlined in that policy and in our strategic plan, Compass to 2025. I can confidently say this Estimate of Needs underscores and will support that work and further distinguishes equity as something that needs to undergird everything we do. The priorities highlighted in this document directly support Goals 1-4 in Compass to 2025, which is a testament to how committed we are to ensuring our division-wide goals are supported from a budget perspective. We are literally putting our money where we as a community have determined it matters most. I am so appreciative of your support in this endeavor, and I can’t wait to see how these efforts continue to move our division forward and effect real change across this great city.
Additionally, as always, VBCPS recognizes the need for ongoing capital improvements across the division—another part of our commitment to ensure that every student and every staff member works and learns in an environment designed for excellence. To that end, the proposed Capital Improvement Program (CIP) includes funding to complete the three projects that are currently underway: Princess Anne Middle School Replacement, the Plaza Annex Addition, and An Achievable Dream Academy at Lynnhaven Middle School. There is also funding in the FY 2021/22 - 2026/27 budget to continue planning for and begin the replacement of Princess Anne High School. This project is now fully funded in the 6-year CIP, as is the Bettie F. Williams Elementary School/Bayside 6th Grade Campus project.
14

Chairwoman Rye, Vice-Chair Melnyk and School Board Members Page 4 February 2, 2021
This CIP also includes funding to begin planning for the Bayside High School Replacement project in years five and six of the program. This CIP continues to budget for infrastructure projects such as roof and HVAC improvements, as well as replacing playground equipment. Of course, even with all of this, it will be important that we continue the capital improvements conversation with our city leaders, legislators and our community in order to make more substantial progress in the future.
I want to personally thank you for taking the time to read and understand the FY21-22 Superintendent’s Estimate of Needs. I look forward to continuing this collaboration with all of you as we strive to develop a budget that will keep Virginia Beach City Public Schools a world-class school division for our students and families.
Yours in Education,
Aaron C. Spence, Ed.D., Superintendent
15
16
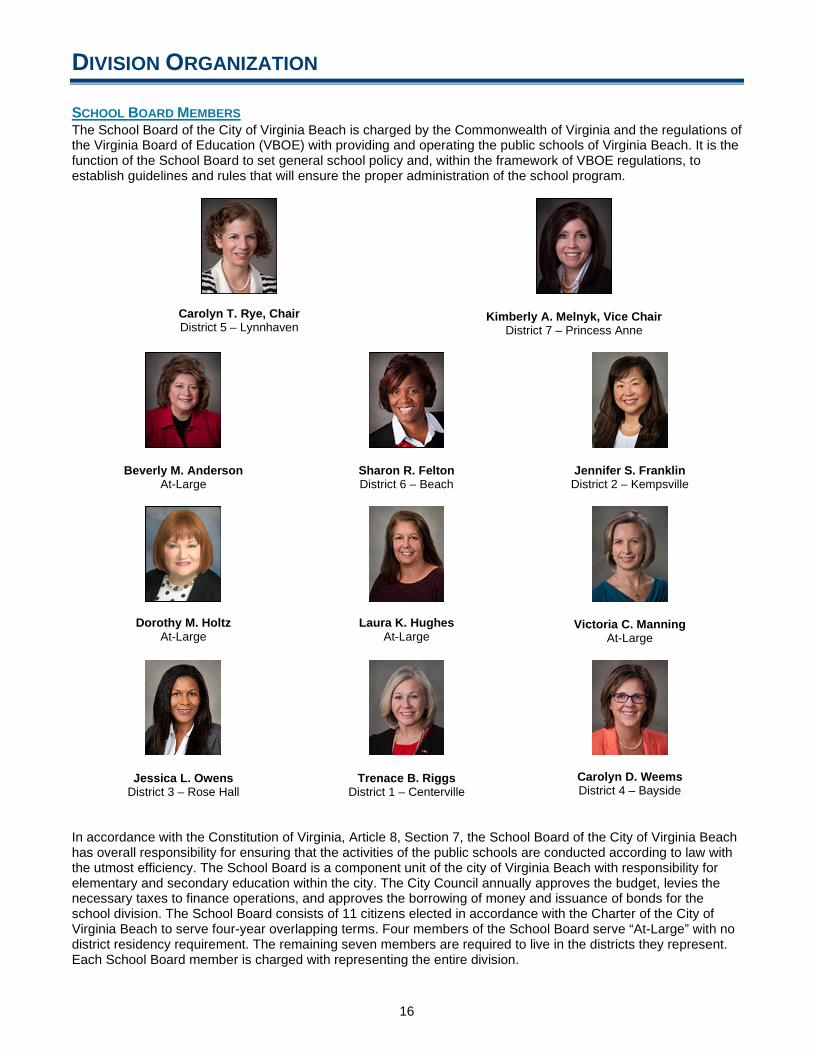
DIVISION ORGANIZATION SCHOOL BOARD MEMBERS The School Board of the City of Virginia Beach is charged by the Commonwealth of Virginia and the regulations of the Virginia Board of Education (VBOE) with providing and operating the public schools of Virginia Beach. It is the function of the School Board to set general school policy and, within the framework of VBOE regulations, to establish guidelines and rules that will ensure the proper administration of the school program.
Carolyn T. Rye, Chair District 5 – Lynnhaven
Kimberly A. Melnyk, Vice Chair District 7 – Princess Anne
Beverly M. Anderson At-Large
Sharon R. Felton District 6 – Beach
Jennifer S. Franklin District 2 – Kempsville
Dorothy M. Holtz At-Large
Laura K. Hughes At-Large
Victoria C. Manning At-Large
Jessica L. Owens District 3 – Rose Hall
Trenace B. Riggs District 1 – Centerville
Carolyn D. Weems District 4 – Bayside
In accordance with the Constitution of Virginia, Article 8, Section 7, the School Board of the City of Virginia Beach has overall responsibility for ensuring that the activities of the public schools are conducted according to law with the utmost efficiency. The School Board is a component unit of the city of Virginia Beach with responsibility for elementary and secondary education within the city. The City Council annually approves the budget, levies the necessary taxes to finance operations, and approves the borrowing of money and issuance of bonds for the school division. The School Board consists of 11 citizens elected in accordance with the Charter of the City of Virginia Beach to serve four-year overlapping terms. Four members of the School Board serve “At-Large” with no district residency requirement. The remaining seven members are required to live in the districts they represent. Each School Board member is charged with representing the entire division.
17
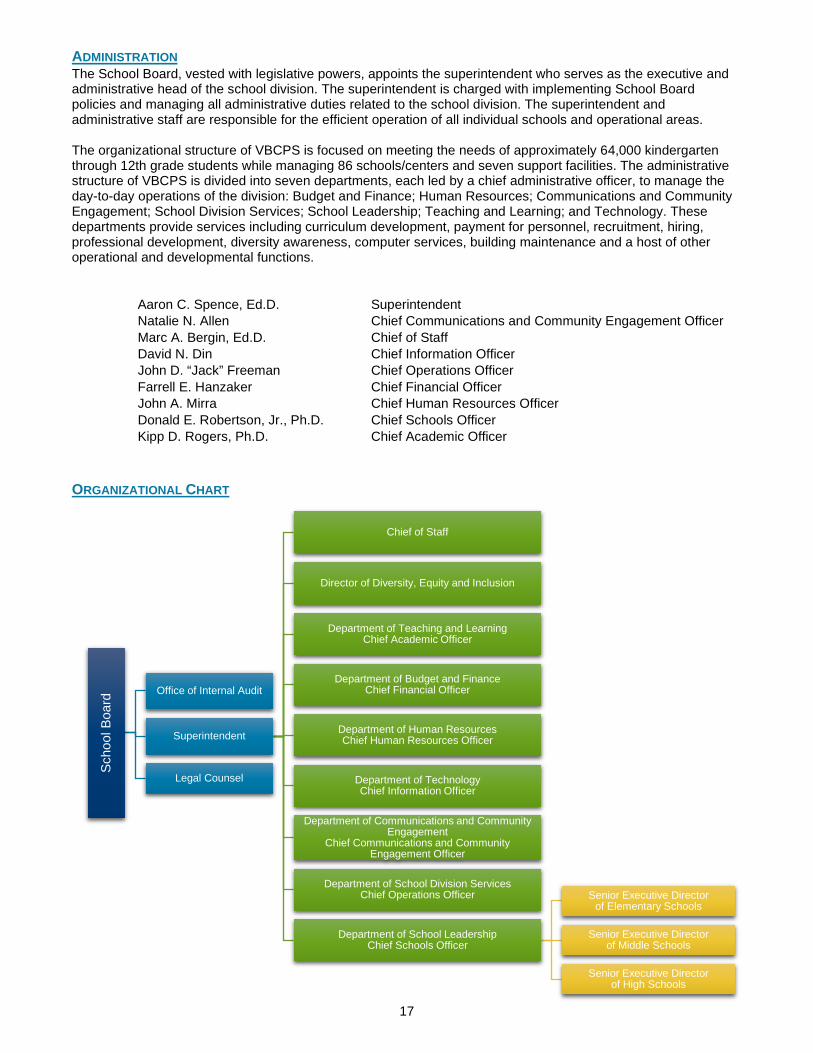
ADMINISTRATION The School Board, vested with legislative powers, appoints the superintendent who serves as the executive and administrative head of the school division. The superintendent is charged with implementing School Board policies and managing all administrative duties related to the school division. The superintendent and administrative staff are responsible for the efficient operation of all individual schools and operational areas. The organizational structure of VBCPS is focused on meeting the needs of approximately 64,000 kindergarten through 12th grade students while managing 86 schools/centers and seven support facilities. The administrative structure of VBCPS is divided into seven departments, each led by a chief administrative officer, to manage the day-to-day operations of the division: Budget and Finance; Human Resources; Communications and Community Engagement; School Division Services; School Leadership; Teaching and Learning; and Technology. These departments provide services including curriculum development, payment for personnel, recruitment, hiring, professional development, diversity awareness, computer services, building maintenance and a host of other operational and developmental functions.
Aaron C. Spence, Ed.D. Superintendent Natalie N. Allen Chief Communications and Community Engagement Officer Marc A. Bergin, Ed.D. Chief of Staff David N. Din Chief Information Officer John D. “Jack” Freeman Chief Operations Officer Farrell E. Hanzaker Chief Financial Officer John A. Mirra Chief Human Resources Officer Donald E. Robertson, Jr., Ph.D. Chief Schools Officer Kipp D. Rogers, Ph.D. Chief Academic Officer
ORGANIZATIONAL CHART
Scho
ol B
oard
Office of Internal Audit
Superintendent
Chief of Staff
Director of Diversity, Equity and Inclusion
Department of Teaching and LearningChief Academic Officer
Department of Budget and FinanceChief Financial Officer
Department of Human ResourcesChief Human Resources Officer
Department of TechnologyChief Information Officer
Department of Communications and Community Engagement
Chief Communications and Community Engagement Officer
Department of School Division ServicesChief Operations Officer
Department of School LeadershipChief Schools Officer
Senior Executive Directorof Elementary Schools
Senior Executive Director of Middle Schools
Senior Executive Director of High Schools
Legal Counsel
18
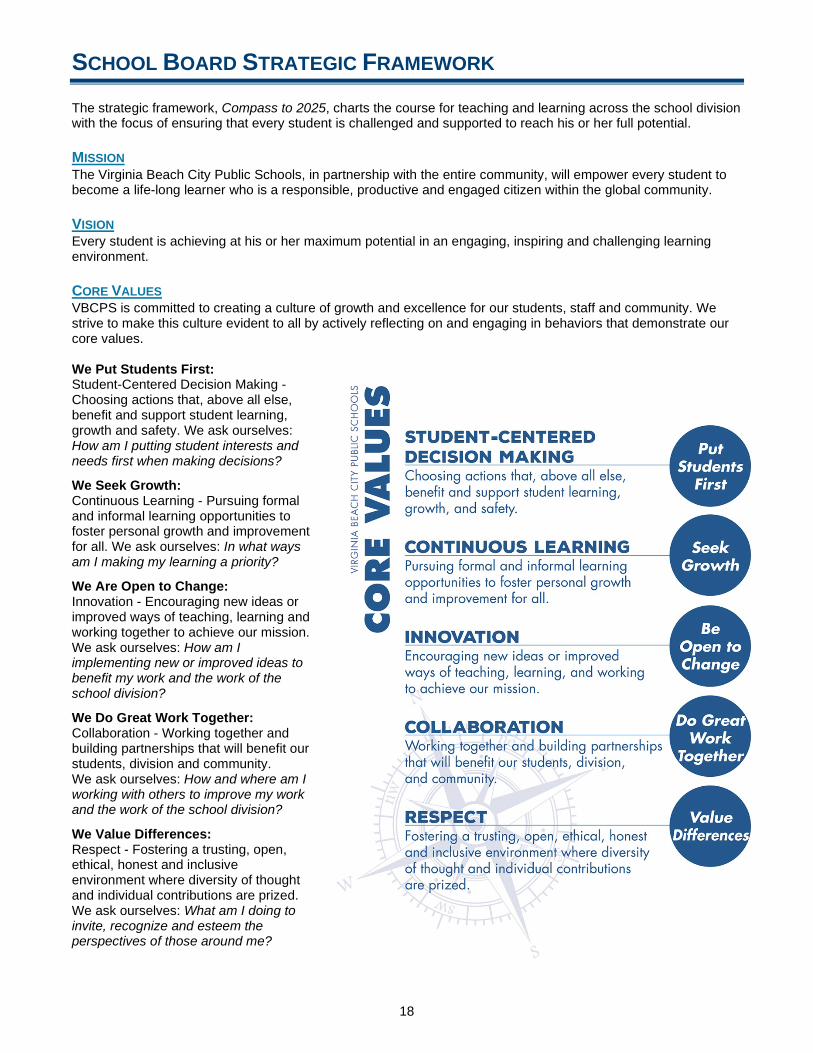
SCHOOL BOARD STRATEGIC FRAMEWORK The strategic framework, Compass to 2025, charts the course for teaching and learning across the school division with the focus of ensuring that every student is challenged and supported to reach his or her full potential. MISSION The Virginia Beach City Public Schools, in partnership with the entire community, will empower every student to become a life-long learner who is a responsible, productive and engaged citizen within the global community. VISION Every student is achieving at his or her maximum potential in an engaging, inspiring and challenging learning environment. CORE VALUES VBCPS is committed to creating a culture of growth and excellence for our students, staff and community. We strive to make this culture evident to all by actively reflecting on and engaging in behaviors that demonstrate our core values. We Put Students First: Student-Centered Decision Making - Choosing actions that, above all else, benefit and support student learning, growth and safety. We ask ourselves: How am I putting student interests and needs first when making decisions? We Seek Growth: Continuous Learning - Pursuing formal and informal learning opportunities to foster personal growth and improvement for all. We ask ourselves: In what ways am I making my learning a priority? We Are Open to Change: Innovation - Encouraging new ideas or improved ways of teaching, learning and working together to achieve our mission. We ask ourselves: How am I implementing new or improved ideas to benefit my work and the work of the school division? We Do Great Work Together: Collaboration - Working together and building partnerships that will benefit our students, division and community. We ask ourselves: How and where am I working with others to improve my work and the work of the school division? We Value Differences: Respect - Fostering a trusting, open, ethical, honest and inclusive environment where diversity of thought and individual contributions are prized. We ask ourselves: What am I doing to invite, recognize and esteem the perspectives of those around me?

19
GOALS The division’s new strategic framework, called Compass to 2025, was adopted by the School Board at its Nov. 26, 2019, meeting and will set the school division's future direction for the next five years. Compass to 2025 was developed by a strategic planning committee made up of parents, students, division staff and representatives from the military, community interests, area businesses and higher education. The committee was tasked with soliciting stakeholder insight and input through community meetings, a virtual town hall and strategy development sessions. They worked together to review feedback and develop the overarching goals of the framework. Teams of central support staff developed the strategies for each goal. The goals and strategies represent areas the division will work toward improving over the next five years to help achieve student, workforce and organizational success. The overarching goals in the new framework are: Educational Excellence; Student Well-Being; Student Ownership of Learning; An Exemplary, Diversified Workforce; Mutually Supportive Partnerships; and Organizational Effectiveness and Efficiency. While VBCPS is staying the course set out by Compass to 2020, goals for the new strategic framework are better defined and have been expanded from four to six, allowing for a substantial emphasis on equity and student ownership of learning, along with mental, physical and digital wellness. The new framework, which took effect July 1, 2020, builds upon Compass to 2020, which resulted in a string of unprecedented successes for the division: earning accreditation three consecutive years; reaching record-high graduation and low dropout rates; students' achievements being recognized with nearly half a billion dollars in scholarships since 2015; and students earning a milestone 100,000 industry certifications. Through Compass to 2025, the division will focus on meeting the needs of today’s learners – and tomorrow’s – and giving our students the tools for meaningful community engagement and fulfilling, successful lives, no matter where their paths take them.

20
BUDGET DEVELOPMENT PROCESS BUDGET PLANNING Tenets of the School Board’s new strategic framework, Compass to 2025, drive the division’s operational and financial plans. The School Board budget reflects multiple stages of planning to allocate resources for carrying out the goals defined through the strategic framework. Each planning phase includes input from senior staff, school division employees, city staff and the community. Each year, staff members from the city and VBCPS collaborate to make projections about economic indicators and budget trends that are likely to occur over the next five years. In preparation for the Five-Year Forecast report and to frame the upcoming budget process, city and school division staff meet with local and regional economists each year. This year the outlook is optimistic, mainly due to the recovery of local real estate, personal property and other consumer related revenues. Other data points focusing on metrics involving tourism, housing and defense also point to growth, positivity and overall well-being in Virginia Beach. Impact of Planning Processes on the Approved Budget The Capital Improvement Program (CIP) assesses requirements for new facilities, renovation of existing facilities, infrastructure management, technology upgrades and other facility-related needs. The list of projects resulting from this assessment and guidance, outlined in the division’s Comprehensive Long-Range Facility Master Plan, provide a clear statement of school facility requirements. Actual completion dates for CIP projects depend on cash flow and debt service limitations. VBCPS develops a series of student enrollment projections and analyses annually to aid in identifying future student needs and developing recommendations for how to best address these needs. In support of the short and long-range budget planning processes, student membership projections for each school are used to determine staffing and funding allocations. Thorough planning processes are used to generate three drafts of the budget document at multiple stages of budget development. The Superintendent’s Estimate of Needs (SEON) is developed and presented to the School Board in February. The School Board then conducts several workshops prior to submitting a Proposed School Board Operating Budget to the City Council in March. Both documents detail projected revenues and expenditures and outline proposed changes as compared to the prior year’s budget. The City Council must approve the appropriation for the division no later than May 15. Ultimately, the School Board Approved Budget document is drafted using final revenue data from the city and General Assembly. BUDGET DEVELOPMENT OVERVIEW SCHOOL OPERATING BUDGET The graphic on the following page highlights major events that impact the budget process; however, the narrative more fully explains activities that contribute to the development and approval of the annual School Operating budget. Groundwork for the annual process begins in September when staff from the Office of Budget Development prepare and publish a budget calendar that outlines key dates associated with the development, presentation, approval and appropriation of funds for school use. The chief financial officer (CFO) works with budget staff to draft a baseline budget using estimated revenues and expenditures and assuming the division will maintain current staffing levels, programs and policies. Adjustments are made to the baseline budget to account for the latest economic projections, revenue estimates and information about likely increases for expenditure types such as fringe benefits and purchased services (to execute contractual agreements).
Compass to 2025
Five-Year Financial Forecast
Capital Improvement
Program
Student Enrollment Projections
Budget Documents

21
During the annual budget kickoff meeting in October, the CFO provides budget managers with an economic update and revenue outlook for the upcoming fiscal year along with general directions for preparing their budgets. Budget development strategies are communicated, and current budget challenges and priorities are discussed. From October through December, departmental budget requests are compiled and analyzed, and recommendations are formulated by the Office of Budget Development for executive review. The Five-Year Forecast, a collaborative undertaking between VBCPS and city staff, is drafted and published each November and establishes underlying assumptions about expected costs, revenues, position turnover, inflation and enrollment that drive budget development. The forecast report is presented to the City Council and the School Board in a joint meeting. A public hearing is held during a School Board meeting in November or December to solicit public input on the School Operating budget. The Governor’s budget with projected state payments for each school division is introduced in December. In addition to estimated revenue information for the Standards of Quality (SOQ), incentive, categorical and lottery funded accounts, the Governor’s budget release includes an electronic file that provides school divisions the opportunity to adjust average daily membership (ADM) to test the effect on state funding projections and local match requirements. The House of Delegates and the Senate have the opportunity to amend the Governor’s budget proposals during the General Assembly session that convenes in January. The General Assembly adopts a final budget before the end of the session, which generally occurs in March. VBCPS departmental requests are summarized and presented to the superintendent and senior staff in January to begin deliberations on unmet needs and budget priorities. If initial revenue estimates are unfavorable and a budget shortfall is predicted, these discussions will focus on cost-saving strategies and potential cuts that may be required to balance the budget. The SEON, considered the starting point for the following year’s fiscal budget, is developed using the projected state payments outlined in the Governor’s introduced budget and estimated local revenue figures provided by city staff. Following the February presentation of the SEON, the School Board conducts several budget workshops with the administration to facilitate discussion prior to developing and presenting the Proposed Operating Budget to the City Council in March. During this same period, an additional public hearing is held to offer the community an opportunity to be involved in the budget development process. CAPITAL IMPROVEMENT PROGRAM BUDGET Guided by a comprehensive Long-Range Facility Master Plan, the CIP reflects the capital maintenance and construction needs of the school division. Capital expenditures included as a project in the CIP typically cost at least $100,000 and have a useful life of at least 20 years. In conjunction with the City Council, the School Board determines actual funding for the capital projects on an annual basis. The CIP budget addresses the current year’s needs as well as planned capital projects over the succeeding five-year period. Projects may include acquisition, construction, renovation, betterment or improvement of land, school buildings and facilities; roof replacements; HVAC replacements; and equipment or vehicles. The CIP budget development process closely follows the calendar and timeline of the School Operating budget, beginning with a preliminary meeting with city staff in September. After discussing plans and projects with staff from the city, CIP request forms are distributed to schools and offices and are returned to the administration in late October. A public hearing is held during a School Board meeting in November or December to solicit public input on plans for the CIP budget. Following the schedule for the School Operating budget, the CIP budget is presented to the School Board in February with the SEON. During budget workshops conducted in February and March, the School Board meets with the superintendent and senior staff to review and discuss the proposed six-year plan for the CIP budget. Another public hearing is held in February to support community involvement in the CIP budget development process. In 2007, VBCPS, Hirsch Bedner Associates and Cooperative Strategies worked in collaboration to develop a Long-Range School Facility Master Plan. This plan outlined a series of options for modernizing facilities within the division. In the 2007 plan, the timeline for school modernization and replacement was dependent upon a proposed funding level. Since that time, funding has dipped from the 2007 level of $60 million per year, and construction costs have increased significantly. In the fall of 2017, VBCPS began the process to review and revise
OctoberBudget kickoff
meeting
DecemberGovernor's
budget released
JanuaryVA General Assembly
convenes 30 day session
FebruarySchool Board
receives SEON and conducts
budget workshops
MarchSchool Board adopts budget
and presents to City Council
MayCity Council
adopts budget by May 15
22
the 10-year-old facility master plan, specifically with an objective to update demographic, condition and program data and the intent to develop recommendations using new data and current funding levels. A steering committee worked with the community to develop a new Long-Range School Facility Master Plan. This master plan was formally accepted by the School Board on Sept. 11, 2018 and will guide the division’s work for the next 12-15 years. BUDGET ADOPTION In accordance with Virginia State Code, the School Board is required to present a balanced budget to the City Council on, or before, April 1. To meet that requirement, VBCPS’ budget is delivered by formal presentation to the City Council each April. In the interest of time, a formal budget resolution is generally adopted by the School Board in March. After the School Operating and CIP budgets have been adopted and forwarded to the city for review, updated information related to revenue projections, debt service obligations, or employee compensation and benefits is analyzed and assessed, as it becomes available, to determine any impact the revised figures may have on the budgets. Following deliberations about budget priorities and development, staff from the city and VBCPS coordinate efforts to make final adjustments to projected revenues and complete a budget reconciliation process. The City Council must approve the appropriation for the School Operating and CIP budgets no later than May 15. Once the City Council adopts a final budget ordinance in May, VBCPS has firm numbers for the share of local revenue the division will receive from the city. Since over half of VBCPS’ funding comes directly from the city, understanding details about local revenue is critical for finalizing the budget development process. Once total amounts are known, the School Board Approved Operating Budget is drafted to present all revenue and expenditure details for the next fiscal year, which begins July 1. BUDGET AMENDMENTS Managing the annual budget for VBCPS is an ongoing cyclical process that encompasses the development, monitoring and review of activities for the current and future fiscal years. Once the budget is adopted by the City Council, it becomes the legal basis for the programs of each department during the fiscal year. The CFO and his budget staff conduct a comprehensive budget review toward the end of the fiscal year to address variances in estimated revenues, estimated expenditures and other changes to the division’s financial condition. Fiscal accountability is based on the established signature authority. Financial and programmatic monitoring of departmental activities occurs throughout the year and ensures conformity with the adopted budget. Budget amendments may be made to meet the changing needs of a school, a department and/or the division. All local funding is appropriated by the City Council to the school division. The School Board may ask for an increase in the appropriation from the City Council, in accordance with the City/School Revenue Sharing Policy, that is included, for reference, in the appendix to this document. Amendments to the School Operating budget are made in accordance with School Board Policy 3-10, that governs the transfer of funds. The policy states that, “neither the School Board, the superintendent nor school staff shall expend nor contract to expend, in any fiscal year, any sum of money in excess of the funds available for school purposes for that fiscal year without the consent of the City Council.”

23
BUDGET CALENDAR FY 2021/22 Operating Budget and FY 2021/22-FY 2026/27 Capital Improvement Program Calendar
2020 Oct. 7 A budget kickoff meeting is conducted to provide senior staff and budget managers with an
economic update, revenue outlook and general directions for budget development Oct. 7 - Dec. 11 Budget requests are submitted by senior staff and budget managers to the Office of Budget
Development Nov. 17 A Five-Year Forecast is presented to the School Board and the City Council Dec. 4 Recommended part-time hourly rates for FY 2021/22 are submitted by the Department of
Human Resources to the Office of Budget Development Dec. 15 A draft of the Capital Improvement Program is prepared for the superintendent’s review Dec. 15 A public hearing is held to solicit stakeholder input and offer the community an opportunity
to be involved in the budget development process December (3rd week)
State revenue estimates are released by the Virginia Department of Education
2021 Jan. 4 - 15 Budget requests are reviewed, refined and summarized by the Office of Budget
Development Jan. 12 The recommended Capital Improvement Program budget is presented to the
superintendent and senior staff Jan. 12 The unbalanced School Operating budget is presented to the superintendent and senior
staff Feb. 2 The Superintendent’s Estimate of Needs for FY 2021/22 is presented to the School Board
(Special School Board meeting required) Feb. 2 The Superintendent’s Proposed FY 2021/22-FY 2026/27 Capital Improvement Program
budget is presented to the School Board (Special School Board meeting required) Feb. 9 School Board Budget Workshop #1 is held Feb. 9 A public hearing is held to solicit stakeholder input and offer the community an opportunity
to be involved in the budget development process Feb. 16 School Board Budget Workshop #2 is held Feb. 23 School Board Budget Workshop #3 is held Mar. 2 School Board Budget Workshop #4 is held Mar. 2 The FY 2021/22 School Operating budget and the FY 2021/22-FY 2026/27 Capital
Improvement Program budget are adopted by the School Board (Special School Board meeting required)
Mar. 9 The FY 2021/22 School Board Proposed Operating budget is provided to city staff April The FY 2021/22 School Board Proposed Operating budget and FY 2021/22 - FY 2026/27
Capital Improvement Program budget are presented to the City Council (Sec. 15.1-163) No Later Than May 15
The FY 2021/22 School Board Proposed Operating budget and FY 2021/22 - FY 2026/27 Capital Improvement Program budget are approved by the City Council (Sec. 22.1-93; 22.1-94; 22.1-115)
24
School Board Funds
Governmental Funds$1,005,454,414
General$833,010,877
School OperatingBudget
$828,816,993
Green Run Collegiate$4,193,884
Special Revenue$172,443,537
Categorical Grants$121,755,222
Federal Grants$89,526,508
State Grants$24,661,514
Other Grants$7,567,200
Other Funds$50,688,315
Athletics$5,478,274
Cafeterias$36,237,372
Cell Tower Technology$800,000
Equipment Replacement
$744,581
Instructional Technology$1,121,686
Textbooks$6,237,402
Vending Operations$69,000
Capital Projects
Proprietary Funds$182,803,417
Internal Service$182,803,417
Risk Management$14,032,765
Health Insurance$168,670,652
Flexible Benefits Forfeiture$100,000
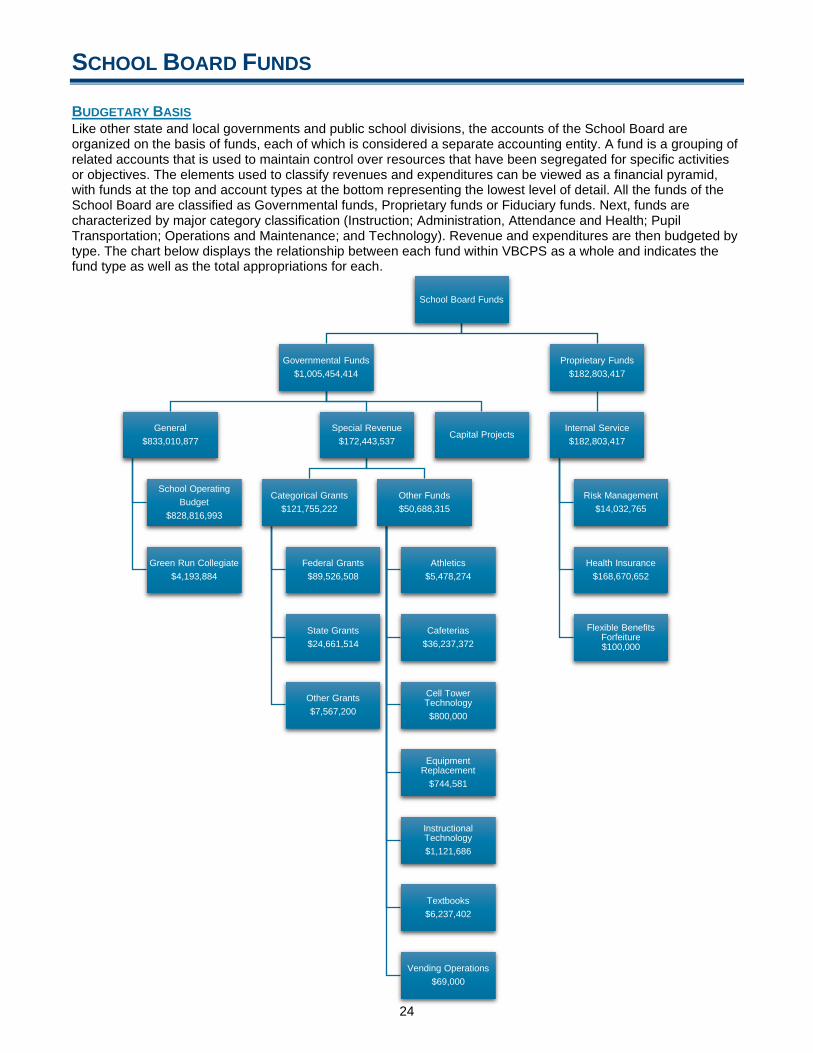
SCHOOL BOARD FUNDS BUDGETARY BASIS Like other state and local governments and public school divisions, the accounts of the School Board are organized on the basis of funds, each of which is considered a separate accounting entity. A fund is a grouping of related accounts that is used to maintain control over resources that have been segregated for specific activities or objectives. The elements used to classify revenues and expenditures can be viewed as a financial pyramid, with funds at the top and account types at the bottom representing the lowest level of detail. All the funds of the School Board are classified as Governmental funds, Proprietary funds or Fiduciary funds. Next, funds are characterized by major category classification (Instruction; Administration, Attendance and Health; Pupil Transportation; Operations and Maintenance; and Technology). Revenue and expenditures are then budgeted by type. The chart below displays the relationship between each fund within VBCPS as a whole and indicates the fund type as well as the total appropriations for each.

25
− School Operating − Green Run Collegiate − Athletics − Cafeterias − Categorical Grants
− Cell Tower Technology − Equipment Replacement − Instructional Technology − Textbooks − Vending Operations
− Flexible Benefits Forfeiture
− Health Insurance − Risk Management − Capital Projects
− Instruction − Administration, Attendance and Health − Pupil Transportation
− Operations and Maintenance − Technology
− Revenue Types: Federal, State, State Sales Tax, Local, Fund Balance and Transfers
− Expenditure Types: Personnel, Fringe Benefits, Purchased Services, Other Charges, Materials and Supplies, Capital Outlay, Improvements and Transfers
Fund Classification
Fund Type Description School Board Fund Budget
Basis Accounting
Basis Governmental funds – account for operating, special revenue and capital project activities
General fund
The General fund is the general operating fund of the School Board that is used to account for all of the financial resources, except those required to be accounted for in another fund. Funds are allocated separately between the School Operating budget and Green Run Collegiate (GRC) charter school.
School Operating Green Run Collegiate
Modified Accrual
Modified Accrual
Capital Projects fund
The Capital Projects fund is used to account for the financial resources for the acquisition or construction of major capital facilities.
Capital Projects Modified Accrual
Modified Accrual
Special Revenue funds
The Special Revenue funds are used to account for the proceeds of specific revenue sources (other than capital projects), which are legally restricted or committed to be expended for specified purposes.
Athletics Cafeterias Categorical Grants Cell Tower Technology Equipment Replacement Instructional Technology Textbooks Vending Operations
Modified Accrual
Modified Accrual
Proprietary funds – account for risk management and health insurance program activities
Internal Service funds
Internal Service funds are used to account for the financing of goods and/or services provided by one department or agency to other departments or agencies of the governmental unit (and other governmental units) on a cost-reimbursement basis.
Flexible Benefits Forfeiture Health Insurance Risk Management
Accrual Accrual
Fiduciary funds – account for resources held for others by VBCPS as an agent or trustee
Agency funds
Agency funds are used to account for assets held by the School Board as an agent for individuals, private organizations, other governmental units and/or other funds.
Payroll Deductions Fringe Benefits School Activity Accounts
Accrual Accrual
Fund
Major Category Classification
Type
26
FUND DESCRIPTIONS GENERAL FUND The General fund is the general operating fund of the School Board that is used to account for all of the financial resources, except those required to be accounted for in another fund. Funds are allocated separately between the School Operating budget and Green Run Collegiate (GRC). Within the fund, revenue and expenditures are budgeted by type. The budget is divided into five major category classifications: Instruction; Administration, Attendance and Health; Pupil Transportation; Operations and Maintenance; and Technology. CAPITAL PROJECTS FUND The CIP budget outlines the basic financing plan for capital needs. The Capital Projects fund tracks financial transactions used for the acquisition, construction or renovation of school buildings and sites, along with other major capital improvements. While the dollars budgeted in this fund address only the current year's needs, the CIP actually has capital projects programmed over a six-year span. SPECIAL REVENUE FUNDS The Special Revenue funds are used to account for the proceeds of specific revenue sources (other than capital projects), which are legally restricted or committed to be expended for specified purposes.
ATHLETICS: The Athletics fund accounts for the costs of holding athletic activities at the division’s schools. Typical expenditures consist of coaching supplements, security staff, event officials, post-season travel, equipment, uniforms and supplies. The primary source of revenue for the Athletics fund is a transfer from the School Operating fund that supplements the money generated from event admission receipts, monies received for participation in post-season tournaments and interest earned on deposits. CAFETERIAS: The Cafeterias fund is used to account for the procurement, preparation and serving of student breakfasts, snacks and lunches. The primary revenue sources are receipts from food sales and reimbursements from the federal school lunch program. CATEGORICAL GRANTS: The Categorical Grants fund is used to account for federal, state, local, nonprofit and private industry grants that support instructional programs. Most grants are legally restricted or dedicated to be expended for specified purposes. CELL TOWER TECHNOLOGY: The Communication Towers Technology fund accounts for payments from the leasing of School Board property for commercial wireless communication towers. The funds received from lease payments and the interest earned is used to acquire and replace/repair technology resources including computers, software, wiring, training, facsimile, multi-functional devices and interactive whiteboards. EQUIPMENT REPLACEMENT: The Equipment Replacement fund provides funding to support an equipment replacement cycle for selected capital equipment for schools and support departments. INSTRUCTIONAL TECHNOLOGY: The Instructional Technology fund provides for the cyclical replacement of classroom and instructional computers/devices. TEXTBOOKS: The Textbooks fund is used for the acquisition of textbooks (online and print) and related materials for students. VENDING OPERATIONS: The Vending Operations fund is predominantly supported through receipts relating to the bottled drinks vending operations of the school division (through a long-term exclusive contract with a vending company). Proceeds from this contract are used to support student and staff activities.
INTERNAL SERVICE FUNDS Internal Service funds are used to account for the financing of goods and/or services provided by one department or agency to other departments or agencies of the governmental unit (and other governmental units) on a cost-reimbursement basis.
HEALTH INSURANCE: The Health Insurance fund provides a means for accounting for health insurance and the administration thereof for city and school employees. RISK MANAGEMENT: The Risk Management fund provides for the administration of the workers’ compensation program, the centralization of self-insurance accounts for liability and the purchase of commercial insurance.

27
FY 2021/22 BUDGET AT A GLANCE BUDGET SUMMARY The FY 2021/22 School Board Proposed Operating Budget, including General funds, Categorical Grants and other funds, totals $1,005,454,414. This is an increase of $90,180,724, or nearly 9.9 percent, from the FY 2020/21 budget that totaled $915,273,690. The following chart shows that the majority of total FY 2021/22 revenues and expenditures for VBCPS can be accounted for in the School Operating budget. The additional tables provide detailed data by major source of revenue and type of expenditures.
Total FY 2021/22 School Board Proposed Operating Budget - All Funds
REVENUES BY MAJOR SOURCE
EXPENDITURES BY TYPE
Note: Due to rounding, percentages may not total 100 percent. NET BUDGET OF ALL FUNDS The calculation of the net budget is illustrated below and involves eliminating the duplication of funding between various VBCPS accounting funds (interfund transfers). For example, the transfer of revenues from the School Operating fund to Green Run Collegiate, categorical grants and athletics would be duplicated if not netted-out of the calculation below.
School Operating82.4%
Green Run Collegiate0.4%
Categorical Grants12.1%
Other Funds5.0%
Fund 115 Fund 201 Fund 203 Fund 204 Fund 210 Fund 211 Fund 212 Fund 213 Fund 214 Fund 215 TotalLocal Revenue (Revenue Sharing Formula) 418,317,940 - - - - - - - - - 418,317,940 Local Revenue (Special Revenue Funds) - - - 504,000 - 63,000 516,000 12,093,879 7,567,200 56,483 20,800,562 State Revenue 311,317,655 - - - - - - 550,000 20,247,176 - 332,114,831 State Sales Tax 76,513,057 - - - - - - - - 4,109,308 80,622,365 Federal Revenue 13,500,000 - - - - - - 20,403,886 89,477,436 - 123,381,322 Fund Balance - - 1,121,686 - 744,581 6,000 284,000 3,189,607 - 2,071,611 7,417,485 Transfer(s) from Other Funds - 4,193,884 - 4,974,274 - - - - 4,463,410 - 13,631,568 Other Local Revenue 3,868,341 - - - - - - - - - 3,868,341 School Reserve (reversion) 5,300,000 - - - - - - - - - 5,300,000 Total Revenue 828,816,993 4,193,884 1,121,686 5,478,274 744,581 69,000 800,000 36,237,372 121,755,222 6,237,402 1,005,454,414
School Operating
Green Run Collegiate
Equipment Replacement
Instructional Technology
Vending Operations Cafeterias Grants Textbooks Athletics
Cell Tower Technology
Fund 115 Fund 201 Fund 203 Fund 204 Fund 210 Fund 211 Fund 212 Fund 213 Fund 214 Fund 215 TotalPersonnel Services 503,478,365 2,512,031 - 2,787,930 - - - 13,196,702 38,569,271 99,170 560,643,469 Fringe Benefits 197,316,235 890,477 - 213,274 - - - 5,334,089 14,051,919 37,597 217,843,591 Purchased Services 49,975,451 412,672 - 1,282,029 - 200 - 523,120 5,573,108 - 57,766,580 Other Charges 26,031,100 77,339 - 241,250 - 58,280 - 49,801 1,694,879 - 28,152,649 Materials and Supplies 33,087,063 301,365 1,121,686 764,800 744,581 10,520 800,000 16,283,660 61,692,912 6,100,635 120,907,222 Capital Outlay 5,199,533 - - 188,991 - - - 850,000 173,133 - 6,411,657 Land, Structures and Improvements 97,678 - - - - - - - - - 97,678 Transfer(s) to Other Funds 13,631,568 - - - - - - - - - 13,631,568 Total Expenditure 828,816,993 4,193,884 1,121,686 5,478,274 744,581 69,000 800,000 36,237,372 121,755,222 6,237,402 1,005,454,414
School Operating
Green Run Collegiate
Equipment Replacement
Instructional Technology
Vending Operations
Cell Tower Technology Cafeterias Grants Textbooks Athletics
Total Budget of All Funds
$1,005,454,414
Interfund Transfers
$13,631,568
Net Budget of All Funds
$991,822,846

28
BUDGETARY PRIORITIES/CHALLENGES There are many factors unique to school divisions that can trigger educational cost increases that outpace inflation. For example, increases in labor costs, changes in legislation, rising inflation and new/expanded programs Understanding these factors provides a greater appreciation of the financial challenges that schools confront today and of the context in which budgeting decisions must be made. SCHOOL SAFETY Because children and schools are the heart of a community, the topic of school safety and security is routinely discussed and analyzed. In April 2018, VBCPS Superintendent Dr. Aaron Spence called for the formation of a Blue Ribbon Panel on School Safety and Security to analyze the school division's safety procedures, infrastructure and practices. This panel was to identify the division's current best practices as well as potential areas of improvement. The panel presented 11 recommendations to the School Board during a summer retreat in 2018, and several enhancements have been completed to bolster security infrastructure throughout the division. VBCPS has been proactive with school safety measures, taking actions to keep exterior doors locked, install video intercom systems at the main entrance of schools, mount additional cameras that are monitored using closed circuit television systems and post security staff in school lobbies to screen visitors. Of significant importance, VBCPS continues to partner with the Virginia Beach Police Department to provide uniformed School Resource Officers in all secondary schools. In addition to tackling the physical safety of students, the Blue Ribbon Panel also recommended ways to help students’ mental health and wellbeing. School administration has continued to develop, implement and expand the use of new and existing resources, where appropriate, to meet the Blue Ribbon Panel's recommendations. TECHNOLOGY The division’s new strategic framework, Compass to 2025, took effect July 1, 2020. One of the strategies linked to the overarching goal of Student Ownership of Learning is to expand upon the effective and efficient use of technology to meet students’ individual needs and provide them with the tools for accessing, creating and sharing knowledge. In support of the new strategic framework, the division’s 1:1 technology initiative provides
Chromebooks to every student in the division. Additionally, the division has allocated one-time funding from multiple sources to replace broken and aging whiteboards with standalone interactive displays to further support transformational learning experiences for all students. This project will make it possible for students and staff to take advantage of enhanced features available in these interactive flat panel systems while alleviating the costly maintenance needs of the projector-based systems currently in place. The fiscal challenge moving forward will be to identify approximately $1.7 million in funding for ongoing annual expenses related to replacement interactive whiteboards.
Technology has proved to be instrumental during the COVID-19 pandemic and has provided a resource for students to succeed in the classroom. As a result of federal dollars released through the Coronavirus Aid, Relief, and Economic Security (CARES) Act, VBCPS has purchased items such as upgraded laptops and essential computer peripherals for teachers; laptop cases to protect student devices; additional outdoor wireless connectivity at schools; Chromebooks; iPads; an internet filtering and classroom management software solution; and assistive technology for students with special needs. Additionally, VBCPS has been able to address barriers to internet access by providing mobile hotspots for students in need and monthly internet subsidies for low-income families. EMPLOYEE COMPENSATION AND WORKFORCE CHALLENGES The 2020 global pandemic has exacerbated the existing national teacher shortage as more and more teachers leave their jobs during this time of economic uncertainty. It remains to be seen whether these teachers will return once the health crisis becomes more stable. This phenomenon coupled with the short supply of newly trained teachers is particularly challenging in school year 2020/21. In support of goal four of the Strategic Framework, VBCPS is focused on placing a premium on recruiting, hiring, supporting and retaining high-quality staff in all positions. One of the top strategies aimed at addressing this goal is to provide a competitive compensation and

29
benefits plan for employees. While VBCPS ranks first in the Hampton Roads region for entry-level teacher salary compensation, the division lags in several other compensation milestones. The division began the process of addressing salary compression on both the unified and instructional experience-based step pay scales. However, due to budgetary constraints arising from the COVID pandemic, the school division was not able to continue addressing salary compression on the scales and only provided minimal compensation increases in FY 2020/2021. Since 2006, additional needs have been identified in other areas of compensation to make the division competitive with the local market. These needs continue to include increasing educational allowances for advanced degrees; increasing the value of additional duty supplements; reclassifying teacher assistants to place them on one pay grade versus six different ones; market realignment of identified clerical positions; and moving selected teacher positions from the unified to the instructional pay scale. These improvements would require budget increases totaling approximately $12.8 million in ongoing, annual expenses. The division completed a targeted compensation study of the division’s clerical jobs. While most of the jobs were found to be in alignment with the market, there are some jobs that are out of alignment. The anticipated cost to adjust these jobs is $936,000. EMPLOYEE BENEFITS VBCPS is budgeting a 3.0 percent increase to the employer costs in FY 2021/22. This favorable trend (below the national median average of 6.0 percent) can be attributed to plan design changes, better education and communication, implementation of an online enrollment tool, a partnership with the Sentara Quality Care Network and a redesigned employee wellness program. As a result of these improvements, the health fund balance has grown over the last few years. The Benefits Executive Committee (a group with members from the city and school staffs) along with Mercer, a health care consulting firm, will continue to monitor medical expense claims, workplace needs, market trends and federal legislation that could impact costs. STATE AND FEDERAL MANDATES VBCPS must comply with state and federal mandates that significantly impact division wide needs and priorities. Mandates are not always funded and can pose a financial burden on school divisions and localities and school divisions. In 2011, the Virginia General Assembly created the Governor’s Task Force for Local Government Mandate Review. The task force was asked “to review state mandates imposed on localities and to recommend temporary suspension or permanent repeal of such mandates, or any other action as appropriate.” In August 2015, the Governor’s Task Force issued an interim report with recommendations for the General Assembly to consider. This task force expired on July 1, 2018; no additional reports have been issued. As of December 2019, the total impact of state and federal unfunded mandates to VBCPS was $44.0 million. Approximately $16.0 million of that total are for mandates that originated either from the General Assembly or the Virginia Department of Education (VDOE). STRUCTURALLY FLAWED OPERATING BUDGET The FY 2020/21 budget marks the eleventh consecutive year VBCPS has had to rely on one-time reversion funds to augment the School Operating budget and pay for recurring expenses. While the use of one-time funding has helped bridge the gap between expenditures and available revenues, the use of these funds to pay for ongoing costs has created a structural imbalance that requires recurring revenue to resolve. Relying on one-time dollars for ongoing expenses is simply not a sustainable budget strategy. Therefore, to correct this structural imbalance, the use of this one-time funding will be reduced from $5.8 million in FY 2020/21 to $5.3 million in FY 2021/22.

30
SCHOOL OPERATING BUDGET HIGHLIGHTS The School Operating budget provides for the day-to-day operations and maintenance of the division. Given that 82.4 percent of the total FY 2021/22 budget is appropriated in the School Operating fund, additional details are provided. The proposed FY 2021/22 School Operating budget totals $828,816,993. This is an increase of a little over 37.2 million, or 4.7 percent, from the FY 2020/21 budget of $791,599,982. REVENUE HIGHLIGHTS In the FY 2021/22 budget, local contributions continue to be the most substantial source of revenue for VBCPS. The Commonwealth of Virginia provides the next largest source of revenue to through state aid and sales tax revenues. The remaining revenues are obtained from federal aid, tuition, fees and other sources. • From the local appropriation received, funds are first distributed to debt service and Pay-As-You-Go (PAYGO)
CIP (current revenue that pays for capital projects). The remainder of funds are then appropriated to the General fund.
• Debt Service funds are managed and controlled by the city of Virginia Beach. The funds are deducted from the city’s local contribution to the division, reducing the amount appropriated for the School Operating budget. The total Debt Service payment for FY 2021/22 is estimated at $49,442,812, which represents an increase of $1,812,484, or 3.8 percent, from the FY 2020/21 amount of $47,630,328.
• VBCPS receives most of its funding, 51.0 percent, from local contributions. The FY 2021/22 local contribution (generated through the Revenue Sharing Formula and other local contributions) totals $422,186,281 an increase of nearly $27.3 million, or 6.9 percent, over the FY 2020/21 amount of $394,889,644.
• In Virginia, school divisions receive the majority of state aid based on their local composite index (LCI). Counties and cities with a lower composite index receive more state funding than those with a higher index. The state calculates the LCI every two years. Calculations for the 2020-2022 biennium budget resulted in an increase for Virginia Beach’s LCI from .4046 to .4082, triggering a slight loss in state funding.
• State revenue for FY 2021/22, which accounts for 37.6 percent of total operating revenue, increased by $13,526,056, compared to the FY 2020/21 budget of $297,791,599. The FY 2021/22 total is $311,317,655 and equates to a 4.5 percent increase. This revenue source includes nearly $12.5 million in No Loss Funding that will be used to offset a reduction in funding due to reduced enrollment caused by the Novel Coronavirus Disease 2019 (COVID-19). The second component of state revenue, sales tax, decreased by $2,696,682, or 3.4 percent, compared to the FY 2020/21 Approved Budget of $79,209,739. Projected sales tax receipts represent 9.2 percent of VBCPS’ revenue.
• The FY 2021/22 budget includes $13.5 million in federal revenue. This amount reflects level funding compared to the FY 2020/21 budget.
• In prior years, VBCPS has relied on fund balance or reversion funds to maintain critical services in response to the recession and significant losses of state funding. VBCPS will use $5.3 million of School Reserve (reversion) revenue to balance the FY 2021/22 School Operating budget. The School Reserve revenue amount represents a decrease of $500,000 below the previous fiscal year when VBCPS used $5.8 million of this one-time funding source to balance the School Operating budget.
VBCPS Local Revenue Budget Comparison
BUDGET BALANCING AND EXPENDITURE HIGHLIGHTS This budget reflects considerable increases in revenue, primarily at the local level. The combination of this additional revenue and cost saving efforts to reprioritize budget line items and reallocate existing resources will allow the division to address several of the School Board’s funding goals and priorities. There are many unpredictable factors affecting the projection of revenue and expenditures. As such, VBCPS develops and utilizes budget assumptions that are based on data and information available at the time the budget is formulated. To balance the FY 2021/22 School Operating budget, the following steps were taken: • Sources of revenue have been analyzed for use in developing a balanced budget. The city shared information
about local revenue contributions and debt service. The Governor’s Introduced Amendments to the 2020-2022 Biennial Budget was used to determine state funding for FY 2021/22. School divisions are provided the option of using the Governor’s projection for ADM or entering a local estimate for enrollment projections.
FY 2017/18 FY 2018/19 FY 2019/20 FY 2020/21 FY 2021/22Revenue Sharing Formula 427,710,350 442,120,415 447,578,560 438,551,631 467,760,752
Less: Debt Service (44,947,680) (41,951,320) (43,313,882) (47,630,328) (49,442,812) Less: Pay-as-you-go - (500,000) (721,541) - -
Local General Fund Revenue Total 382,762,670 399,669,095 403,543,137 390,921,303 418,317,940

31
VBCPS chose the local ADM estimate of 64,611 provided by the internal demographer to determine state funding projections for next fiscal year.
• Adjustments were made to reduce the baseline by strategically reprioritizing and realigning budget items. Accounts linked to operational efficiencies were reevaluated to generate additional savings. The FY 2021/22 budget also includes baseline personnel reductions and anticipated savings from employee turnover and vacancies. Position turnover represents the savings realized when experienced employees retire or leave the system and are replaced by workers with less experience, who earn a lower salary. These types of savings are impacted by changes in the economy, compensation adjustments, and other VBCPS employee initiatives.
• Revenue reserve funding has been included in the FY 2021/22 SEON as a result of the changing economic conditions resulting from COVID-19.
• The compensation parameters in the FY 2021/22 SEON have been updated to move all eligible employees up an experience step (0.5 percent), not to exceed the “top of scale” and to provide a 4.5 percent cost of living adjustment (COLA). The projected cost for these increases is over $27.8 million inclusive of benefits. The Governor’s Introduced Amendments to the 2020-2022 Biennial Budget includes a one-time bonus payment for funded SOQ instructional and support personnel. To receive the incentive funding, a school division must certify to VDOE that a minimum average two percent, or equivalent action, will be provided in FY 2021/22, by Sept 1, 2021. The salary increase will allow the division to access these supplemental state funds amounting to a little over $4.0 million for FY 2021/22.
• Funding has been allocated in the budget to increase allowances for advanced degrees, upgrade school counseling department chairs and move all custodians up one pay grade.
• The number of elementary guidance counselors (13.0 FTEs) and middle school counselors (3.0 FTEs) have been increased to meet SOQ requirements based on an amendment that reduces the staffing ratios to 325-to-1 in all schools.
• Restored non-FTE expenditures that were reduced in the FY 2020/21 budget in order to balance to projected revenue shortfalls at both the local and state level as a result of COVID-19.
• Funding has been identified to support special education program mandates, increase the local match required for the Virginia Preschool Initiative and to pay additional costs associated with grounds/landscaping.
• Additional positions and related expenses have been added to expand the Spanish Immersion Program and support the Environmental Studies Program at the Brock Center.
FY 2020/21Adopted
FY 2021/22Proposed Variance
RevenueFederal 13,500,000 13,500,000 - State 297,791,599 311,317,655 13,526,056 State Sales Tax 79,209,739 76,513,057 (2,696,682) Local Contribution (RSF) 390,921,303 418,317,940 27,396,637 Other Local 3,968,341 3,868,341 (100,000) School Reserve (reversion) 5,800,000 5,300,000 (500,000) Sandbridge TIF Reallocation 409,000 - (409,000)
791,599,982 828,816,993 37,217,011
Amount BalanceBudget Balancing
37,217,011 Baseline adjustments and net position changes (e.g. realigning positions, enrollment, K-3 primary class size reduction) 2,382,688 39,599,699
(1,820,879) 37,778,820 (27,846,184) 9,932,636 (3,000,000) 6,932,636
(227,134) 6,705,502 (1,433,542) 5,271,960 (1,234,558) 4,037,402 (2,491,759) 1,545,643
(453,626) 1,092,017 (168,335) 923,682 (138,811) 784,871 (358,344) 426,527 (175,242) 251,285 (251,285) -
Additional local match required for the Virginia Preschool Initiative
Revenue reserve to prepare for any potential reduction in revenue estimates that may occur in FY 2021/22Experience step increase (0.50 percent) and COLA (4.5 percent)Increase allowances for advanced degrees
Additional guidance counselor positions (13.0 ES and 3.0 MS)Restore FY 2020/21 reduction of 2% to non-personnel line itemsAdditional funding to support special education program mandates (Comprehensive Services Act)
Upgrade school counseling department chairsMove all custodians up one pay grade
Additional costs associated with grounds/landscaping service level for schoolsAdditional positions and related expenses to expand the Spanish Immersion ProgramAdditional position and related expenses to support the Environmental Studies Program at the Brock CenterExpansion of the University Fellows Program with ODU and UVA

32
UNMET NEEDS As part of the budget development process, departmental requests are summarized and presented to the superintendent and senior staff to begin deliberations on unmet needs and budget priorities. Within the first quarter of the fiscal year, the superintendent and senior staff consider one-time requests that could not feasibly be funded in the School Operating budget to determine the appropriate use(s) for any reversion funds. The following lists provide an approximate accounting of the division’s unmet operating and technology needs.
OPERATING NEEDS
TECHNOLOGY NEEDS
One-Time Annual5,300,000$
11,915,264$ $ 2,913,851 Increase allowances for advanced degrees $ 5,034,981 Move all teacher assistants to Grade U10 (including equity adjustments) $ 1,262,972 Revise and increase additional duty supplements $ 936,462 Upgrade identified clerical positions $ 931,628 Upgrade all bus drivers to Grade U10 $ 555,480 Provide an allowance for teacher assistants that hold a Bachelor's degree $ 279,890 Early commitment signing incentives
1,500,000$ 500,000$ 336,000$ 180,000$ 180,000$ 105,000$ 84,500$
769,000$ 8,185,500$ 12,684,264$
Paint entire interior of ten schools
Replace stage curtains at various schools
Infrastructure upgrades to support scratch cooking initiative (electrical, plumbing and equipment replacement)Activity bus replacement (6)
White fleet replacement vehicles
Additional access controls on doorsReplace security cameras at various facilities
Replacement of basketball scoreboards (six high schools and eight middle schools)
Operating Needs Total
Eliminate need for one-time funds in balancing budgetAdditional personnel costs:
Description (not in priority order)
One-Time Annual8,000,000$ 2,000,000$
755,000$ 225,000$ 225,000$
1,500,000$ 1,500,000$ 10,480,000$ 3,725,000$
Wireless network replacementData governance solution to prevent data security issuesInternet access for facilities who qualify for free and reduced lunch
Technology Needs Total
Description (not in priority order)Telephone system replacement

33
GENERAL FUND The General fund is the general operating fund of the School Board that is used to account for all of the financial resources, except those required to be accounted for in another fund. Funds are allocated separately between the School Operating budget and Green Run Collegiate (GRC) Charter School. Because over 82.0 percent of the total FY 2021/22 budget is appropriated in the School Operating fund, details and brief descriptions of the different revenue and expenditure types, classifications and categories are provided in the charts on the following pages. SCHOOL OPERATING FUND REVENUE SOURCES As previously mentioned, local contributions continue to be the most substantial source of revenue for VBCPS. Note: Due to rounding, percentages may not add to 100 percent. Federal ...................................................................................................................................................... $13,500,000 General funds and categorical funds (primarily Impact Aid revenue) State .......................................................................................................................................................$311,317,655 SOQ payments, incentive funds, lottery proceeds and categorical amounts established by the General Assembly on a biennial basis State Sales Tax ........................................................................................................................................ $76,513,057 State sales tax (1.125 percent) dedicated to public education and distributed to school divisions based on the number of school-age children residing in the locality Local Contribution ...................................................................................................................................$418,317,940 Appropriation from the city of Virginia Beach (calculated using the RSF) Other Local ................................................................................................................................................. $3,868,341 Miscellaneous sources of revenue such as rental of facilities, summer school tuition and non-resident tuition Additional Funds (non-recurring) ................................................................................................................ $5,300,000
School Reserve (reversion) Total School Operating Fund Revenue Sources ...............................................................................$828,816,993
Local Contribution50.5%
State37.6%
State Sales Tax9.2%
Federal1.6%
Additional Funds0.6%
Other Local0.5%
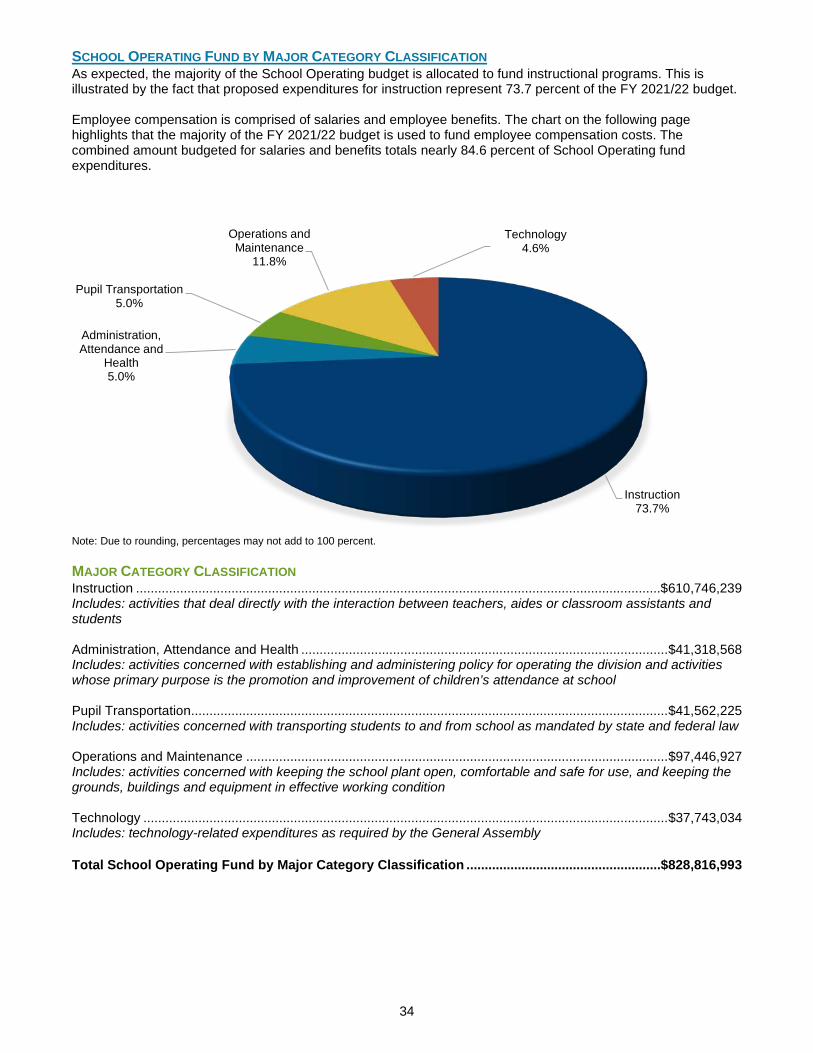
34
SCHOOL OPERATING FUND BY MAJOR CATEGORY CLASSIFICATION As expected, the majority of the School Operating budget is allocated to fund instructional programs. This is illustrated by the fact that proposed expenditures for instruction represent 73.7 percent of the FY 2021/22 budget.
Employee compensation is comprised of salaries and employee benefits. The chart on the following page highlights that the majority of the FY 2021/22 budget is used to fund employee compensation costs. The combined amount budgeted for salaries and benefits totals nearly 84.6 percent of School Operating fund expenditures.
Note: Due to rounding, percentages may not add to 100 percent. MAJOR CATEGORY CLASSIFICATION Instruction ...............................................................................................................................................$610,746,239 Includes: activities that deal directly with the interaction between teachers, aides or classroom assistants and students Administration, Attendance and Health .................................................................................................... $41,318,568 Includes: activities concerned with establishing and administering policy for operating the division and activities whose primary purpose is the promotion and improvement of children’s attendance at school Pupil Transportation.................................................................................................................................. $41,562,225 Includes: activities concerned with transporting students to and from school as mandated by state and federal law Operations and Maintenance ................................................................................................................... $97,446,927 Includes: activities concerned with keeping the school plant open, comfortable and safe for use, and keeping the grounds, buildings and equipment in effective working condition Technology ............................................................................................................................................... $37,743,034 Includes: technology-related expenditures as required by the General Assembly Total School Operating Fund by Major Category Classification .....................................................$828,816,993
Instruction73.7%
Administration, Attendance and
Health5.0%
Pupil Transportation5.0%
Operations and Maintenance
11.8%
Technology4.6%

35
SCHOOL OPERATING FUND EXPENDITURES BY TYPE
Note: Due to rounding, percentages may not add to 100 percent. TYPE Personnel Services .................................................................................................................................$503,478,365 Includes: all compensation for the direct labor of persons in the employment of the school division including salaries and wages paid to employees for full-time, part-time and temporary work; supplements, allowances, overtime and similar compensation; payments for time not worked such as annual, funeral, sick and personal reasons leave; holidays; and other paid absences (e.g., jury duty, military pay) Fringe Benefits ........................................................................................................................................$197,316,235 Includes: job-related benefits provided for school employees as part of their total compensation; the employer's portion of the Federal Insurance Contributions Act (FICA); retirement contributions; health and life insurance premiums; unemployment insurance premiums; flexible benefits program; employee assistance program; workers' compensation; and tuition reimbursements Purchased Services .................................................................................................................................. $49,975,451 Includes: services acquired from outside sources on a fee basis or fixed-time contract basis (with the exception of payments for rentals, utilities or extensive repairs considered to be additions or improvements to capital assets) Other Charges .......................................................................................................................................... $26,031,100 Includes: payments of utilities, postage, telecommunications, insurance, rentals, travel and other miscellaneous charges Materials and Supplies ............................................................................................................................. $33,087,063 Includes: articles and commodities acquired that are consumed or materially altered when used and capital outlay items that have a per-unit cost of less than $5,000 Capital Outlay ............................................................................................................................................. $5,199,533 Includes: outlays that result in the acquisition of or additions to capital assets with a unit cost of $5,000 or more (with the exception of outlays for major capital facilities such as buildings and land) Land, Structures and Improvement ................................................................................................................. $97,678 Includes: expenditures of projects that are less than $1 million in estimated cost Transfers to Other Funds ......................................................................................................................... $13,631,568 Includes: the conveying of cash from one fund (e.g., School Operating) to another fund (e.g., Textbooks) without recourse Total School Operating Fund Expenditures by Type ........................................................................$828,816,993
Personnel Services60.75%
Fringe Benefits23.81%
Purchased Services6.03%
Other Charges3.14%
Materials and Supplies3.99%
Capital Outlay0.63%
Land, Structures and Improvements0.01%
Transfers to Other Funds1.64%

36
GENERAL FUND REVENUE BUDGET COMPARISON
Notes: No Loss Funding (*) - The amended budget recognizes the effects of the COVID-19 pandemic on public school enrollment in school year 2020/21 and provides significant No Loss Funding for school divisions. Due to Rounding, percentages may not add to 100 percent.
FY 2017/18 FY 2018/19 FY 2019/20 FY 2020/21 FY 2021/22 PercentActual Actual Actual Approved Proposed of Total Variance
Department of Defense 2,068,992 2,131,760 4,026,962 1,500,000 1,500,000 0.18% - Other Federal Funds 3,422,340 2,463,234 2,627,316 1,964,809 1,964,809 0.24% - Public Law 874 (Impact Aid) 6,813,731 11,048,816 9,698,001 9,935,191 9,935,191 1.20% - Rebates and Refunds (NJROTC) 309,329 317,522 319,312 100,000 100,000 0.01% - Federal Revenue Total 12,614,392 15,961,332 16,671,591 13,500,000 13,500,000 1.63% -
At-Risk Initiative 3,010,507 3,461,264 3,789,306 5,930,533 6,288,681 0.76% 358,148 Basic School Aid 178,412,666 178,656,354 176,893,073 194,239,903 191,099,407 23.06% (3,140,496) Bonus Payment - - - - 4,161,644 0.50% 4,161,644 Career and Technical Education 237,320 249,227 240,230 328,669 318,903 0.04% (9,766) Class Size Initiative 4,544,238 5,064,339 5,067,089 5,369,420 5,079,167 0.61% (290,253) Compensation Supplement 1,723,755 - 10,506,769 - - 0.00% - English as a Second Language 716,216 858,002 1,089,527 1,707,149 1,603,531 0.19% (103,618) Foster Home Children 333,614 363,512 419,896 455,023 470,374 0.06% 15,351 Gifted and Talented 1,956,372 1,982,464 1,986,075 2,051,091 1,988,313 0.24% (62,778) Infrastructure and Operations Per Pupil Fund - - - - 14,685,425 1.77% 14,685,425 Other State Funds * 1,615 15,470 - - 12,455,856 1.50% 12,455,856 Prevention, Intervention and Remediation 4,687,141 4,599,317 4,607,694 4,733,287 4,588,415 0.55% (144,872) Remedial Summer School 240,747 264,206 210,448 188,358 1,935 0.00% (186,423) Social Security 10,597,014 10,586,360 10,645,361 11,241,558 10,935,722 1.32% (305,836) Special Education 19,156,141 18,714,464 18,748,547 20,668,688 20,036,078 2.42% (632,610) Special Education (Homebound) 154,090 115,495 117,042 117,991 77,743 0.01% (40,248) Special Education (Regional Tuition) 9,315,527 9,417,315 10,185,744 9,690,078 9,690,078 1.17% - State Employee Insurance 733,639 713,687 714,987 788,881 764,736 0.09% (24,145) State Sales Tax 74,264,875 76,320,888 79,610,836 79,209,739 76,513,057 9.23% (2,696,682) Supplemental Lottery Per Pupil Allocation 11,182,703 14,438,288 14,538,465 12,394,018 - 0.00% (12,394,018) Virginia Retirement System 24,332,374 23,353,430 23,435,684 26,230,301 25,465,702 3.07% (764,599) Vocational Education 1,874,856 1,903,166 1,906,632 1,656,651 1,605,945 0.19% (50,706) State Revenue Total 347,475,410 351,077,248 364,713,404 377,001,338 387,830,712 46.79% 10,829,374
Additional Local Contributions 735,538 735,538 735,538 885,538 735,538 0.09% (150,000) Driver Education Tuition 239,213 257,961 100,280 322,125 322,125 0.04% - General Adult Education Tuition 102,090 75,990 80,452 142,839 142,839 0.02% - Indirect Costs of Grants 701,222 722,660 674,450 600,000 600,000 0.07% - Licensed Practical Nursing Tuition 18,300 17,450 22,200 25,575 25,575 0.00% - Local Contributions (RSF) 373,348,171 380,865,731 376,892,661 390,921,303 418,317,940 50.47% 27,396,637 Non-Resident Tuition 247,581 227,372 132,612 100,000 100,000 0.01% - Other Funds 448,997 1,178,362 429,658 224,703 224,703 0.03% - Renaissance Academy Tuition - - - 20,811 20,811 0.00% - Rental of Facilities 499,341 432,731 281,549 450,000 450,000 0.05% - Sale of Salvage Equipment 126,266 80,583 664,457 12,000 12,000 0.00% - Sale of School Vehicles 216,789 224,992 177,665 15,000 15,000 0.00% - Stop Arm Enforcement Program - 214,355 634,957 300,000 350,000 0.04% 50,000 Summer School Tuition 548,778 556,949 564,157 700,000 700,000 0.08% - Vocational Adult Education Tuition 18,118 12,220 9,951 169,750 169,750 0.02% - Local Revenue Total 377,250,404 385,602,895 381,400,587 394,889,644 422,186,281 50.92% 27,296,637 Revenue Total 737,340,206 752,641,475 762,785,583 785,390,982 823,516,993 99.36% 38,126,011
Sandbridge TIF Reallocation 409,000 409,000 409,000 409,000 - 0.00% (409,000) School Reserve (reversion) 8,803,897 6,800,000 5,800,000 5,800,000 5,300,000 0.64% (500,000) Additional Funds Total 9,212,897 7,209,000 6,209,000 6,209,000 5,300,000 0.64% (909,000) School Operating Fund Total 746,553,103 759,850,475 768,994,583 791,599,982 828,816,993 100.00% 37,217,011 Transfer(s) from Other Funds 3,315,737 3,360,081 3,450,635 4,076,486 4,193,884 100.00% 117,398 Green Run Collegiate Fund Total 3,315,737 3,360,081 3,450,635 4,076,486 4,193,884 100.00% 117,398 General Fund Total 749,868,840 763,210,556 772,445,218 795,676,468 833,010,877 100.00% 37,334,409

37
GENERAL FUND EXPENDITURES BUDGET COMPARISON
Notes: As a result of the updated Chart of Accounts, effective FY 2020/21, cost centers notated with an asterix (*) were recategorized from Instructional to Administration, Attendance and Health. Due to rounding, percentages may not add to 100 percent.
FY 2017/18 FY 2018/19 FY 2019/20 FY 2020/21 FY 2021/22 PercentActual Actual Actual Approved Proposed of Total Variance
8104 Elementary Classroom 145,974,473 148,707,655 158,250,914 162,331,914 168,474,973 20.33% 6,143,059 8106 Middle Classroom 59,278,558 60,404,147 59,972,855 61,385,786 64,685,427 7.80% 3,299,641 8108 High Classroom 76,421,703 78,659,715 79,255,372 80,472,274 84,016,603 10.14% 3,544,329 8110 Special Education Classroom 93,358,590 94,363,460 96,819,690 98,538,818 102,633,315 12.38% 4,094,497 8112 Technical and Career Education Classroom 17,076,604 16,901,712 17,092,502 18,935,725 19,914,869 2.40% 979,144 8114 Gifted Classroom 14,219,545 14,167,856 14,280,737 14,848,349 15,584,485 1.88% 736,136 8116 Alternative Education Classroom 6,342,291 6,412,088 6,353,241 7,181,149 6,416,405 0.77% (764,744) 8118 Remedial Education Classroom 8,146,235 8,469,344 8,232,135 8,490,984 8,766,568 1.06% 275,584 8120 Summer School 1,613,168 1,743,514 1,293,987 1,602,285 1,634,984 0.20% 32,699 8122 Summer Slide 228,966 201,272 269,397 270,483 276,002 0.03% 5,519 8124 Adult Education 1,917,207 1,918,827 1,946,946 2,071,804 2,146,253 0.26% 74,449 8135 Guidance 17,139,374 17,916,328 18,302,886 18,761,386 21,118,003 2.55% 2,356,617 8137 Social Workers 4,170,914 4,553,745 4,298,918 4,212,900 4,322,047 0.52% 109,147 8139 Homebound 309,968 319,432 307,160 409,356 420,050 0.05% 10,694 8145 Teaching and Learning 16,436,857 16,680,497 16,568,862 18,189,751 18,393,004 2.22% 203,253 8147 Instructional Professional Growth and Innovation 968,793 1,021,072 1,071,108 1,305,397 1,356,352 0.16% 50,955 8149 Diversity, Equity and Inclusion 73,771 42,749 39,769 86,990 437,799 0.05% 350,809 8151 Student Leadership 1,431,886 1,436,487 1,491,825 1,573,761 1,631,976 0.20% 58,215 8153 School Leadership 1,845,847 1,729,305 1,839,751 2,109,817 2,190,225 0.26% 80,408 8155 Student Activities 8,450,985 7,797,007 7,417,697 8,738,974 8,814,049 1.06% 75,075 8157 Special Education Support 3,606,924 3,629,589 3,528,557 3,654,199 3,828,401 0.46% 174,202 8159 Technical and Career Education Support 925,674 935,641 957,375 999,699 1,038,088 0.13% 38,389 8161 Gifted Education Support 2,312,208 2,290,030 2,354,435 2,494,044 2,604,385 0.31% 110,341 8163 Alternative Education Support 1,367,724 1,325,356 1,368,200 1,522,808 2,746,419 0.33% 1,223,611 8165 Library Media Support 12,980,306 12,835,451 13,135,821 13,393,552 13,898,222 1.68% 504,670 8175 Office of the Principal - Elementary 25,563,940 26,264,347 26,413,385 26,680,607 27,792,450 3.35% 1,111,843 8177 Office of the Principal - Middle School 10,961,318 11,081,092 11,313,689 11,456,352 11,924,851 1.44% 468,499 8179 Office of the Principal - High 11,607,617 11,988,649 11,954,285 12,407,215 12,950,799 1.56% 543,584 8181 Office of the Principal - Technical and Career Education 642,687 656,246 667,171 700,301 729,235 0.09% 28,934 8206 Communications and Community Engagement * 1,790,855 1,990,075 1,997,405 - - 0.00% - 8214 Planning, Innovation and Accountability * 2,239,881 1,964,243 1,636,290 - - 0.00% - 8252 Psychological Services * 4,584,738 4,620,929 5,513,350 - - 0.00% - 8254 Audiological Services * 485,127 505,713 505,156 - - 0.00% -
554,474,734 563,533,573 576,450,871 584,826,680 610,746,239 73.69% 25,919,559
8202 Board, Legal and Governmental Services 1,098,516 1,157,350 1,158,503 1,287,734 1,316,618 0.16% 28,884 8204 Office of Superintendent 958,846 1,034,417 1,056,291 1,151,311 1,201,850 0.15% 50,539 8206 Communications and Community Engagement * - - - 2,282,408 2,361,749 0.28% 79,341 8208 Human Resources 4,864,276 5,044,656 5,133,198 5,735,654 5,899,041 0.71% 163,387 8210 Professional Growth and Innovation 816,806 804,266 816,969 903,274 945,110 0.11% 41,836 8212 Consolidated Benefits 2,042,295 2,065,127 2,079,030 2,567,934 2,628,955 0.32% 61,021 8214 Planning, Innovation and Accountability * - - - 2,316,683 2,414,470 0.29% 97,787 8216 Budget and Finance 4,741,231 6,870,574 4,798,368 5,274,412 7,308,973 0.88% 2,034,561 8220 Internal Audit 435,728 438,798 469,864 484,173 510,320 0.06% 26,147 8222 Purchasing Services 1,089,778 1,106,787 1,066,194 1,106,532 1,222,324 0.15% 115,792 8250 Health Services 7,742,476 7,799,731 7,948,498 8,237,525 8,713,417 1.05% 475,892 8252 Psychological Services * - - - 6,047,739 6,264,233 0.76% 216,494 8254 Audiological Services * - - - 506,820 531,508 0.06% 24,688
23,789,952 26,321,706 24,526,915 37,902,199 41,318,568 4.99% 3,416,369
8302 Transportation Management 2,505,007 2,610,317 2,739,543 2,633,561 2,671,682 0.32% 38,121 8304 Vehicle Operations 28,572,469 23,432,253 21,402,449 22,774,021 23,858,065 2.88% 1,084,044 8306 Vehicle Operations - Special Education 7,979,474 7,169,128 6,031,435 6,760,693 7,271,785 0.88% 511,092 8308 Monitoring Services - Special Education 3,505,501 3,416,422 3,173,006 3,674,624 3,721,128 0.45% 46,504 8310 Vehicle Maintenance 3,243,213 3,460,096 3,530,916 3,929,936 4,039,565 0.49% 109,629
45,805,664 40,088,216 36,877,349 39,772,835 41,562,225 5.01% 1,789,390
8402 School Division Services 794,310 676,601 329,484 331,167 334,827 0.04% 3,660 8404 Facilities and Maintenance Services 43,525,990 44,653,134 44,376,521 46,730,138 48,423,889 5.84% 1,693,751 8406 Custodial Services 26,462,927 26,147,814 25,878,632 28,320,428 30,511,523 3.68% 2,191,095 8408 Grounds Services 4,731,908 4,442,908 4,571,314 4,479,888 4,710,125 0.57% 230,237 8410 Vehicle Services 1,468,793 2,178,038 1,641,031 1,590,248 1,646,914 0.20% 56,666 8412 Safe Schools 7,083,894 7,261,850 8,178,241 8,204,950 8,635,101 1.04% 430,151 8414 Distribution Services 1,643,209 1,775,750 1,827,245 2,021,201 2,245,030 0.27% 223,829 8416 Telecommunications 1,010,280 1,071,371 1,040,974 1,041,809 939,518 0.11% (102,291)
86,721,311 88,207,466 87,843,442 92,719,829 97,446,927 11.76% 4,727,098
Technology 37,744,706 38,217,900 40,265,023 36,378,439 37,743,034 4.55% 1,364,595 37,744,706 38,217,900 40,265,023 36,378,439 37,743,034 4.55% 1,364,595
748,536,367 756,368,861 765,963,600 791,599,982 828,816,993 100.00% 37,217,011
3,004,423 3,136,045 3,281,263 3,716,293 3,833,691 91.41% 117,398 - - - - - 0.00% -
227,187 207,823 161,756 321,578 321,578 7.67% - 66 - 179 - - 0.00% -
65,424 20,668 26,064 38,615 38,615 0.92% - 3,297,100 3,364,536 3,469,262 4,076,486 4,193,884 100.00% 117,398
751,833,467 759,733,397 769,432,862 795,676,468 833,010,877 100.00% 37,334,409
Green Run Collegiate Fund Total
General Fund Total
Instruction Total
Administration, Attendance and Health Total
Pupil Transportation Total
Operations and Maintenance Total
Technology Total
School Operating Fund Total
Green Run Collegiate InstructionGreen Run Collegiate Administration, Attendance and HealthGreen Run Collegiate Pupil TransportationGreen Run Collegiate Operations and MaintenanceGreen Run Collegiate Technology

38
EXPENDITURES BY MAJOR CATEGORY CLASSIFICATION AND TYPE SCHOOL OPERATING FUND
GREEN RUN COLLEGIATE
Note: Due to rounding, percentages may not add to 100 percent.
Instruction
Administration, Attendance and
Health Pupil
Transportation Operations and
Maintenance Technology Total Percent of Total
Budget Personnel Services 403,091,553 24,829,928 21,843,276 39,813,207 13,900,401 503,478,365 60.75%Fringe Benefits 157,700,789 10,040,693 8,712,125 15,737,119 5,125,509 197,316,235 23.81%Purchased Services 27,421,051 3,075,303 391,849 15,167,227 3,920,021 49,975,451 6.03%Other Charges 1,175,291 2,758,004 1,644,022 20,206,861 246,922 26,031,100 3.14%Materials and Supplies 8,075,241 614,640 4,562,841 5,910,125 13,924,216 33,087,063 3.99%Capital Outlay 112,206 - 4,408,112 489,650 189,565 5,199,533 0.63%Land, Structures and Improvements - - - 97,678 - 97,678 0.01%Transfers to Other Funds 13,170,108 - - 25,060 436,400 13,631,568 1.64%School Operating Fund Total 610,746,239 41,318,568 41,562,225 97,446,927 37,743,034 828,816,993 100.00%
Percent of Total 73.69% 4.99% 5.01% 11.76% 4.55% 100.00%
Instruction
Administration, Attendance and
Health Pupil
Transportation Operations and
Maintenance Technology Total Percent of Total
Budget Personnel Services 2,511,367 - - - 664 2,512,031 59.90%Fringe Benefits 890,426 - - - 51 890,477 21.23%Purchased Services 91,094 - 321,578 - - 412,672 9.84%Other Charges 77,339 - - - - 77,339 1.84%Materials and Supplies 263,465 - - - 37,900 301,365 7.19%Capital Outlay - - - - - - 0.00%Land, Structures and Improvements - - - - - - 0.00%Transfers to Other Funds - - - - - - 0.00%Green Run Collegiate Fund Total 3,833,691 - 321,578 - 38,615 4,193,884 100.00%
Percent of Total 91.41% 0.00% 7.67% 0.00% 0.92% 100.00%
39
SPECIAL REVENUE FUNDS Although the majority of the total FY 2021/22 School Operating budget is accounted for in the General fund and intended to support day-to-day activities, Special Revenue funds function to supplement the School Operating budget and equate to almost $172.5 million, or 17.2 percent, of the total budget for VBCPS. These funds are legally restricted and must be spent for specific purposes. The charts below show the breakdown of revenues by major source and expenditures by type for VBCPS budgeted special revenue funds. The FY 2021/22 budget for all special revenue funds is expected to increase considerably by over $52.9 million from FY 2020/21. This is mostly as a result of federal dollars released through the CARES Act and the Coronavirus Response and Relief Supplemental Appropriations (CRRSA) Act. Special Revenue Funds Budget Comparison
CATEGORICAL GRANTS VBCPS receives additional revenue by securing grants to help fund specific initiatives. The Categorical Grants fund is used to account for federal, state, local, nonprofit and private industry grants that support instructional programs. Categorical grants range in size, scope, administration and purpose. They are subject to budget appropriations from the federal and state governments and are typically legally restricted or dedicated to be expended for specified purposes. Grant-funded services, programs and personnel may be affected if award amounts are reduced or eliminated. Award amounts from FY 2020/21 are used to project program funding estimates for anticipated FY 2021/22 grant revenues. Adjustments are typically made during the first and second quarters of the fiscal year to reflect actual award notifications. Available year-end balances for some grants may carry forward across fiscal years because they are awarded on a multi-year basis. In these instances, current year revenues and expenditures are estimated to prepare carryover budgets for the following year. Grant budgets are amended throughout the fiscal year to align expenditures with total revenue. Based on required compensation adjustments and/or adopted salary increases, the allocation of positions and other expenditures are modified as needed to balance the budgets for categorical grants. A reserve is maintained in the Categorical Grants fund to provide appropriation authority funding for grant awards received during the fiscal year. For FY 2021/22, $7.2 million is budgeted as a reserve for contingency. The projected FY 2021/22 budget for Categorical Grants is $121,755,222 and includes 516.5 FTE positions. This is an increase of $52,291,911, or nearly 75.3 percent, from the FY 2020/21 Adopted Budget that totaled $69,463,311. Categorical Grant funds are projected to account for 12.1 percent of the FY 2021/22 total budget. Two federal projects, Title VI, Part B, Individuals with Disabilities Education Act of 2004 (IDEA, Section 611), ($19,985,042), and Title I, Part A, Improving the Academic Achievement of the Disadvantaged ($14,533,449),
2017/18Approved
FY 2018/19 Approved
FY 2019/20Approved
FY 2020/21Approved
FY 2021/22Proposed Variance
Athletics 5,099,823 5,028,774 5,227,274 5,478,274 5,478,274 - Cafeterias 31,679,250 33,733,213 35,554,104 37,540,299 36,237,372 (1,302,927) Categorical Grants 58,856,748 61,486,650 65,962,175 69,463,311 121,755,222 52,291,911 Cell Tower Technology 850,000 850,000 800,000 800,000 800,000 - Equipment Replacement 170,193 1,088,036 80,000 1,051,000 744,581 (306,419) Instructional Technology 79,579 260,244 200,000 698,000 1,121,686 423,686 Textbooks 5,179,602 6,206,584 4,775,188 4,411,338 6,237,402 1,826,064 Vending Operations 229,702 150,000 150,000 155,000 69,000 (86,000) Total 102,144,897 108,803,501 112,748,741 119,597,222 172,443,537 52,846,315
40
account for 28.4 percent of the Categorical Grants revenue budget. Title I, Part A, provides financial assistance through state educational agencies to school divisions and public schools with high numbers or percentages of children from low-income families to help ensure that all children meet challenging state academic content and achievement standards. Except as otherwise provided, amounts awarded to a Local Education Agency (LEA) under Title VI, Part B, may be used only to pay the excess costs of providing special education and related services to children with disabilities. Excess costs are those costs for the education of an elementary school or secondary school student with a disability that are above the average annual per student expenditure incurred by an LEA during the preceding school year, as may be appropriate. Historically, nearly half of the funding accounted for in the Categorical Grants fund can be attributed each year to these two federal programs. For FY 2021/22, this percentage is reduced due to federal funding received under the CARES Act and CRRA Act to address the impact COVID-19 has had and continues to have on schools. These two federal relief programs represent over 39.2 percent of the Categorical Grants fund for FY 2021/22. VDOE calculates and publishes LEA indirect cost rates each fiscal year. These rates apply to requests for reimbursement of indirect cost expenditures. Each grant award contains specific requirements regarding whether indirect costs may be recovered and whether the restricted or unrestricted rate should be used. LEA indirect cost rates are to be used by school divisions to recover the indirect costs associated with the administration of federal grants. As required by the U.S. Department of Education, the FY 2020/21 rate used to calculate indirect costs for the FY 2021/22 budget is 2.5 percent. OTHER FUNDS Other funds are used to account for the proceeds of specific revenue sources that are legally restricted or committed to be expended for specific purposes. Other funds are projected to account for 5.1 percent of the FY 2021/22 total budget. The Cafeterias and Textbook funds represent the two largest budgets of all other funds. The Cafeterias fund is used to account for the procurement, preparation, and serving of student breakfasts, snacks and lunches. The primary revenue sources are receipts from food sales and the federal school lunch program. The projected FY 2021/22 budget for the Cafeterias fund is $36,237,372. Revenue budgeted in the Textbooks fund is used for the acquisition of textbooks (online and print) and related materials for VBCPS students. The total budget for the FY 2021/22 Textbooks fund is $6,237,402. State funding is provided for textbooks on a per pupil basis. For FY 2021/22, it is anticipated that VBCPS will receive $4.1 million in state revenue for textbooks.
.
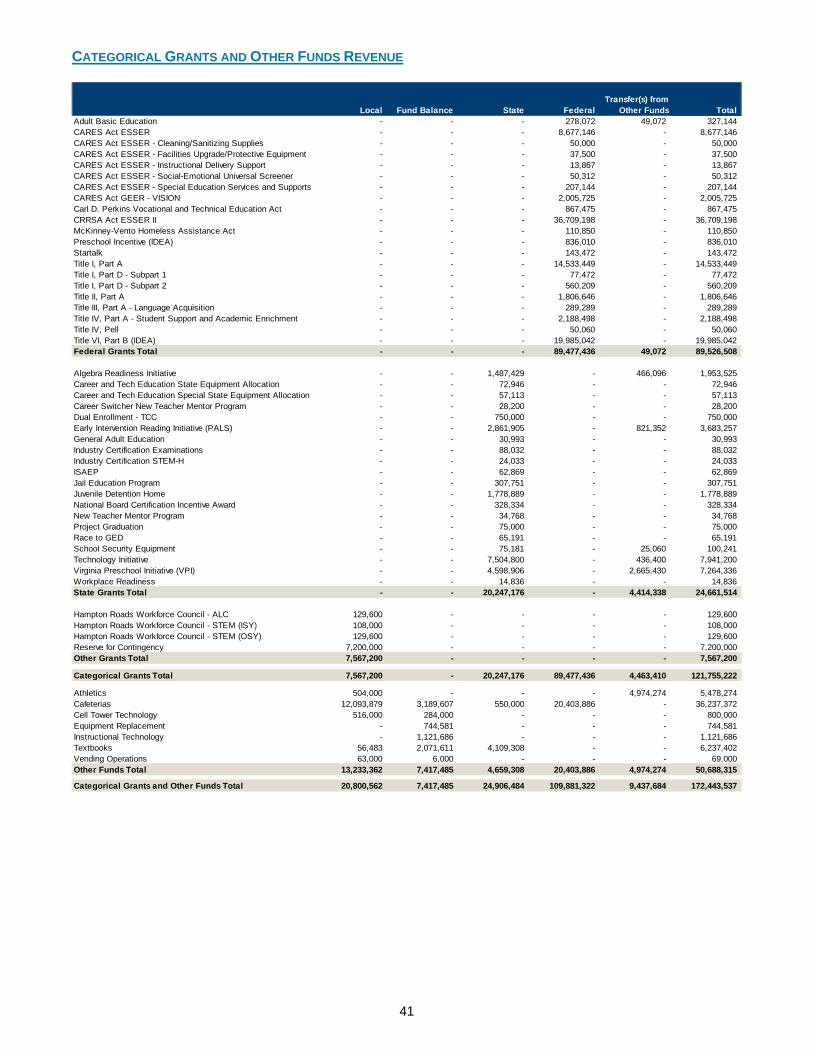
41
CATEGORICAL GRANTS AND OTHER FUNDS REVENUE
Local Fund Balance State Federal Transfer(s) from
Other Funds TotalAdult Basic Education - - - 278,072 49,072 327,144 CARES Act ESSER - - - 8,677,146 - 8,677,146 CARES Act ESSER - Cleaning/Sanitizing Supplies - - - 50,000 - 50,000 CARES Act ESSER - Facilities Upgrade/Protective Equipment - - - 37,500 - 37,500 CARES Act ESSER - Instructional Delivery Support - - - 13,867 - 13,867 CARES Act ESSER - Social-Emotional Universal Screener - - - 50,312 - 50,312 CARES Act ESSER - Special Education Services and Supports - - - 207,144 - 207,144 CARES Act GEER - VISION - - - 2,005,725 - 2,005,725 Carl D. Perkins Vocational and Technical Education Act - - - 867,475 - 867,475 CRRSA Act ESSER II - - - 36,709,198 - 36,709,198 McKinney-Vento Homeless Assistance Act - - - 110,850 - 110,850 Preschool Incentive (IDEA) - - - 836,010 - 836,010 Startalk - - - 143,472 - 143,472 Title I, Part A - - - 14,533,449 - 14,533,449 Title I, Part D - Subpart 1 - - - 77,472 - 77,472 Title I, Part D - Subpart 2 - - - 560,209 - 560,209 Title II, Part A - - - 1,806,646 - 1,806,646 Title III, Part A - Language Acquisition - - - 289,289 - 289,289 Title IV, Part A - Student Support and Academic Enrichment - - - 2,188,498 - 2,188,498 Title IV, Pell - - - 50,060 - 50,060 Title VI, Part B (IDEA) - - - 19,985,042 - 19,985,042 Federal Grants Total - - - 89,477,436 49,072 89,526,508
Algebra Readiness Initiative - - 1,487,429 - 466,096 1,953,525 Career and Tech Education State Equipment Allocation - - 72,946 - - 72,946 Career and Tech Education Special State Equipment Allocation - - 57,113 - - 57,113 Career Switcher New Teacher Mentor Program - - 28,200 - - 28,200 Dual Enrollment - TCC - - 750,000 - - 750,000 Early Intervention Reading Initiative (PALS) - - 2,861,905 - 821,352 3,683,257 General Adult Education - - 30,993 - - 30,993 Industry Certification Examinations - - 88,032 - - 88,032 Industry Certification STEM-H - - 24,033 - - 24,033 ISAEP - - 62,869 - - 62,869 Jail Education Program - - 307,751 - - 307,751 Juvenile Detention Home - - 1,778,889 - - 1,778,889 National Board Certification Incentive Award - - 328,334 - - 328,334 New Teacher Mentor Program - - 34,768 - - 34,768 Project Graduation - - 75,000 - - 75,000 Race to GED - - 65,191 - - 65,191 School Security Equipment - - 75,181 - 25,060 100,241 Technology Initiative - - 7,504,800 - 436,400 7,941,200 Virginia Preschool Initiative (VPI) - - 4,598,906 - 2,665,430 7,264,336 Workplace Readiness - - 14,836 - - 14,836 State Grants Total - - 20,247,176 - 4,414,338 24,661,514
Hampton Roads Workforce Council - ALC 129,600 - - - - 129,600 Hampton Roads Workforce Council - STEM (ISY) 108,000 - - - - 108,000 Hampton Roads Workforce Council - STEM (OSY) 129,600 - - - - 129,600 Reserve for Contingency 7,200,000 - - - - 7,200,000 Other Grants Total 7,567,200 - - - - 7,567,200
Categorical Grants Total 7,567,200 - 20,247,176 89,477,436 4,463,410 121,755,222
Athletics 504,000 - - - 4,974,274 5,478,274 Cafeterias 12,093,879 3,189,607 550,000 20,403,886 - 36,237,372 Cell Tower Technology 516,000 284,000 - - - 800,000 Equipment Replacement - 744,581 - - - 744,581 Instructional Technology - 1,121,686 - - - 1,121,686 Textbooks 56,483 2,071,611 4,109,308 - - 6,237,402 Vending Operations 63,000 6,000 - - - 69,000 Other Funds Total 13,233,362 7,417,485 4,659,308 20,403,886 4,974,274 50,688,315
Categorical Grants and Other Funds Total 20,800,562 7,417,485 24,906,484 109,881,322 9,437,684 172,443,537

42
CATEGORICAL GRANTS AND OTHER FUNDS EXPENDITURES
Personnel Services
Fringe Benefits
Purchased Services
Other Charges
Materials and
Supplies Capital
Outlay TotalAdult Basic Education 231,360 74,536 3,000 1,698 16,550 - 327,144 CARES Act ESSER 2,835,708 367,329 495,299 15,780 4,963,030 - 8,677,146 CARES Act ESSER - Cleaning/Sanitizing Supplies - - 1,179 - 48,821 - 50,000 CARES Act ESSER - Facilities Upgrade/Protective Equipment - - 891 - 36,609 - 37,500 CARES Act ESSER - Instructional Delivery Support 11,902 911 320 - 734 - 13,867 CARES Act ESSER - Social-Emotional Universal Screener - - 12,600 - 37,712 - 50,312 CARES Act ESSER - Special Education Services and Supports 186,213 14,245 4,930 - 1,756 - 207,144 CARES Act GEER - VISION - - 19,225 880,000 1,106,500 - 2,005,725 Carl D. Perkins Vocational and Technical Education Act 25,269 1,933 208,355 104,462 373,823 153,633 867,475 CRRSA Act ESSER II - - 895,346 - 35,813,852 - 36,709,198 McKinney-Vento Homeless Assistance Act 52,183 3,991 - 13,000 41,676 - 110,850 Preschool Incentive (IDEA) 582,318 210,901 20,391 7,400 15,000 - 836,010 Startalk 101,901 7,826 15,718 3,280 14,747 - 143,472 Title I, Part A 8,008,810 2,846,676 767,600 308,584 2,601,779 - 14,533,449 Title I, Part D - Subpart 1 71,966 5,506 - - - - 77,472 Title I, Part D - Subpart 2 255,482 87,920 9,575 - 207,232 - 560,209 Title II, Part A 1,156,101 491,224 152,335 - 6,986 - 1,806,646 Title III, Part A - Language Acquisition 171,455 53,889 9,314 9,353 45,278 - 289,289 Title IV, Part A - Student Support and Academic Enrichment 667,027 231,317 628,809 139,051 522,294 - 2,188,498 Title IV, Pell - - 60 10,000 40,000 - 50,060 Title VI, Part B (IDEA) 13,325,643 6,172,172 484,227 3,000 - - 19,985,042 Federal Grants Total 27,683,338 10,570,376 3,729,174 1,495,608 45,894,379 153,633 89,526,508
Algebra Readiness Initiative 960,636 73,489 632,000 - 287,400 - 1,953,525 Career and Tech Education State Equipment Allocation - - - - 72,946 - 72,946 Career and Tech Education Special State Equipment Allocation - - - - 57,113 - 57,113 Career Switcher New Teacher Mentor Program 28,200 - - - - - 28,200 Dual Enrollment - TCC - - 750,000 - - - 750,000 Early Intervention Reading Initiative (PALS) 3,068,447 277,594 5,000 7,778 324,438 - 3,683,257 General Adult Education 28,791 2,202 - - - - 30,993 Industry Certification Examinations - - - - 88,032 - 88,032 Industry Certification STEM-H - - - - 24,033 - 24,033 ISAEP 37,823 11,440 - - 13,606 - 62,869 Jail Education Program 227,834 70,665 - 5,000 4,252 - 307,751 Juvenile Detention Home 1,212,428 449,335 60,151 8,225 48,750 - 1,778,889 National Board Certification Incentive Award 328,334 - - - - - 328,334 New Teacher Mentor Program 34,768 - - - - - 34,768 Project Graduation 10,000 766 - - 64,234 - 75,000 Race to GED 54,520 4,171 - - 6,500 - 65,191 School Security Equipment - - 21,427 - 78,814 - 100,241 Technology Initiative 35,349 2,703 200,000 175,248 7,508,400 19,500 7,941,200 Virginia Preschool Initiative 4,722,701 2,541,635 - - - - 7,264,336 Workplace Readiness - - - - 14,836 - 14,836 State Grants Total 10,749,831 3,434,000 1,668,578 196,251 8,593,354 19,500 24,661,514
Hampton Roads Workforce Council - ALC 46,940 20,996 60,464 - 1,200 - 129,600 Hampton Roads Workforce Council - STEM (ISY) 45,420 8,407 50,172 1,500 2,501 - 108,000 Hampton Roads Workforce Council - STEM (OSY) 43,742 18,140 64,720 1,520 1,478 - 129,600 Reserve for Contingency - - - - 7,200,000 - 7,200,000 Local Grants Total 136,102 47,543 175,356 3,020 7,205,179 - 7,567,200
Categorical Grants Total 38,569,271 14,051,919 5,573,108 1,694,879 61,692,912 173,133 121,755,222
Athletics 2,787,930 213,274 1,282,029 241,250 764,800 188,991 5,478,274 Cafeterias 13,196,702 5,334,089 523,120 49,801 16,283,660 850,000 36,237,372 Cell Tower Technology - - - - 800,000 - 800,000 Equipment Replacement - - - - 744,581 - 744,581 Instructional Technology - - - - 1,121,686 - 1,121,686 Textbooks 99,170 37,597 - - 6,100,635 - 6,237,402 Vending Operations - - 200 58,280 10,520 - 69,000 Other Funds Total 16,083,802 5,584,960 1,805,349 349,331 25,825,882 1,038,991 50,688,315
Categorical Grants and Other Funds Total 54,653,073 19,636,879 7,378,457 2,044,210 87,518,794 1,212,124 172,443,537

43
OPERATING COSTS OF AVERAGE DAILY MEMBERSHIP State K-12 SOQ spending in school divisions is driven by student enrollment and local ability to pay. The VBCPS 2020/21 actual Sept. 30 student membership for K-12 was 63,836. This amount is 2,980 students, or 4.46 percent, below student membership from the same period in 2019/20. The decline in student enrollment can be attributed to several factors related to the COVID-19 pandemic. Some students enrolled in private schools or other virtual programs, more parents opted to homeschool their children and many military transfers were put on hold due to the pandemic. The FY 2021/22 School Operating budget was developed using a student membership projection of 64,611. This is slightly higher than the ADM of 63,693.35 used in the development of the Governor’s Introduced Amendments to the 2020-2022 Biennial Budget. STUDENT ENROLLMENT The school division uses a cohort survival model to generate base student membership projections. This model essentially compares the number of students in a particular grade to the number of students in the previous grade during the previous year. Ratios are computed for each grade progression over a multiyear period and are then used to project future enrollments. To project kindergarten enrollment, birth data lagged five years behind its respective kindergarten class is used to calculate a cohort ratio. Student projections are further adjusted using analysis generated in the school division’s Geographic Information System, a detailed analysis of residential housing trends, Virginia Beach resident birth rates and other available data that may impact student enrollment. For the past several years, data from the Office of Demographics and Planning have demonstrated how recent economic conditions have had a significant impact on the division’s student membership. Factors such as the increasing number of students in shared housing and homeless situations, fluctuations in the numbers of students opting to attend private schools, and volatility in the real estate market have created instability in VBCPS’ student enrollment. Between FY 2015/16 and FY 2020/21, VBCPS student enrollment declined by 6.1 percent. According to the Weldon Cooper Center for Public Service at the University of Virginia, VBCPS is among the majority of Virginia school divisions with respect to declining enrollment trends. In 90 of Virginia’s 133 counties and cities, student enrollment has fallen since 2010. Over the next five years, statewide student enrollment is likely to dip moderately and, according to the Center, Hampton Roads is expected to experience one of the largest numeric declines. The graph and table below show the actual and projected enrollment in the division for fiscal years 2015/16 through 2025/26.
Source: VBCPS Department of School Division Services, September 30th Historical Student Membership and FINAL 2021/22 – 2025/26 September 30th Student Membership Projections
2015/16 2016/17 2017/18 2018/19 2019/20 2020/21 2021/22 2022/23 2023/24 2024/25 2025/26 Actual 68,011 67,323 67,154 66,820 66,816 63,836 Projected 68,140 68,015 66,984 66,888 66,653 66,651 64,611 65,451 65,370 65,154 64,902
64,000
65,000
66,000
67,000
68,000
69,000
70,000
Projected and Actual Student Enrollment
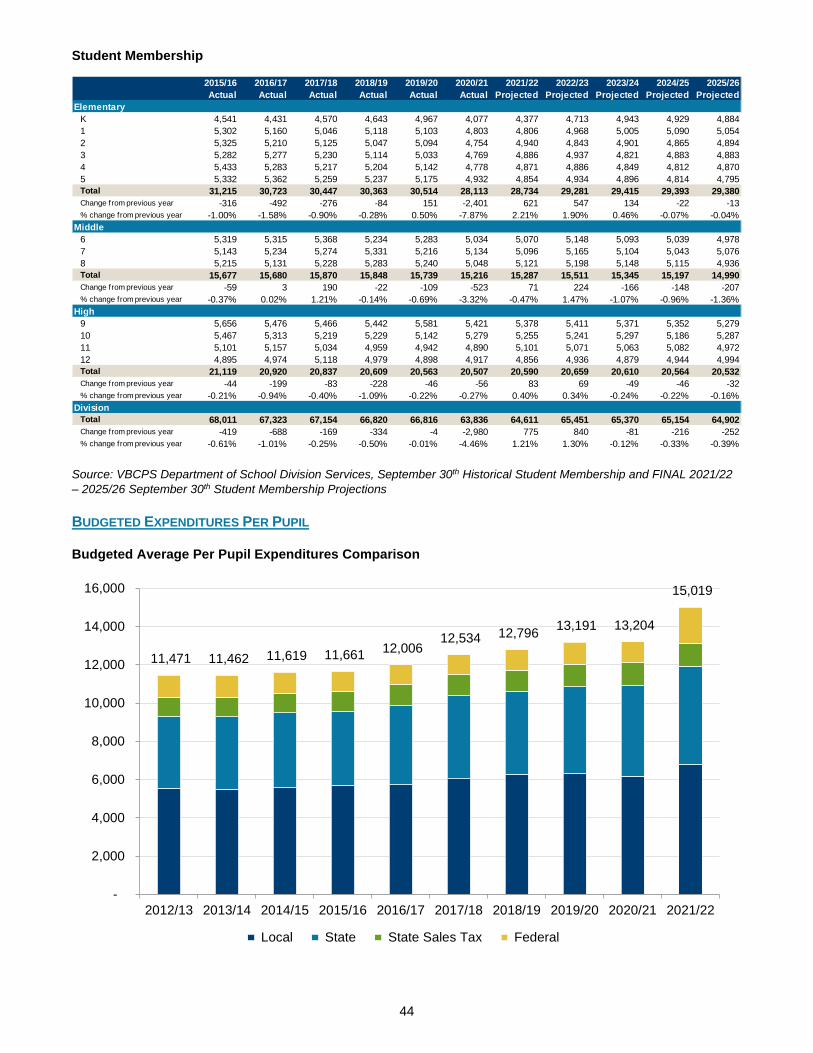
44
Student Membership
Source: VBCPS Department of School Division Services, September 30th Historical Student Membership and FINAL 2021/22 – 2025/26 September 30th Student Membership Projections
BUDGETED EXPENDITURES PER PUPIL Budgeted Average Per Pupil Expenditures Comparison
2015/16Actual
2016/17Actual
2017/18Actual
2018/19Actual
2019/20Actual
2020/21Actual
2021/22Projected
2022/23Projected
2023/24Projected
2024/25Projected
2025/26Projected
ElementaryK 4,541 4,431 4,570 4,643 4,967 4,077 4,377 4,713 4,943 4,929 4,8841 5,302 5,160 5,046 5,118 5,103 4,803 4,806 4,968 5,005 5,090 5,0542 5,325 5,210 5,125 5,047 5,094 4,754 4,940 4,843 4,901 4,865 4,8943 5,282 5,277 5,230 5,114 5,033 4,769 4,886 4,937 4,821 4,883 4,8834 5,433 5,283 5,217 5,204 5,142 4,778 4,871 4,886 4,849 4,812 4,8705 5,332 5,362 5,259 5,237 5,175 4,932 4,854 4,934 4,896 4,814 4,795Total 31,215 30,723 30,447 30,363 30,514 28,113 28,734 29,281 29,415 29,393 29,380Change from previous year -316 -492 -276 -84 151 -2,401 621 547 134 -22 -13% change from previous year -1.00% -1.58% -0.90% -0.28% 0.50% -7.87% 2.21% 1.90% 0.46% -0.07% -0.04%
Middle6 5,319 5,315 5,368 5,234 5,283 5,034 5,070 5,148 5,093 5,039 4,9787 5,143 5,234 5,274 5,331 5,216 5,134 5,096 5,165 5,104 5,043 5,0768 5,215 5,131 5,228 5,283 5,240 5,048 5,121 5,198 5,148 5,115 4,936Total 15,677 15,680 15,870 15,848 15,739 15,216 15,287 15,511 15,345 15,197 14,990Change from previous year -59 3 190 -22 -109 -523 71 224 -166 -148 -207% change from previous year -0.37% 0.02% 1.21% -0.14% -0.69% -3.32% -0.47% 1.47% -1.07% -0.96% -1.36%
High9 5,656 5,476 5,466 5,442 5,581 5,421 5,378 5,411 5,371 5,352 5,27910 5,467 5,313 5,219 5,229 5,142 5,279 5,255 5,241 5,297 5,186 5,28711 5,101 5,157 5,034 4,959 4,942 4,890 5,101 5,071 5,063 5,082 4,97212 4,895 4,974 5,118 4,979 4,898 4,917 4,856 4,936 4,879 4,944 4,994Total 21,119 20,920 20,837 20,609 20,563 20,507 20,590 20,659 20,610 20,564 20,532Change from previous year -44 -199 -83 -228 -46 -56 83 69 -49 -46 -32% change from previous year -0.21% -0.94% -0.40% -1.09% -0.22% -0.27% 0.40% 0.34% -0.24% -0.22% -0.16%
DivisionTotal 68,011 67,323 67,154 66,820 66,816 63,836 64,611 65,451 65,370 65,154 64,902Change from previous year -419 -688 -169 -334 -4 -2,980 775 840 -81 -216 -252% change from previous year -0.61% -1.01% -0.25% -0.50% -0.01% -4.46% 1.21% 1.30% -0.12% -0.33% -0.39%
11,471 11,462 11,619 11,661 12,006 12,534 12,796 13,191 13,204
15,019
-
2,000
4,000
6,000
8,000
10,000
12,000
14,000
16,000
2012/13 2013/14 2014/15 2015/16 2016/17 2017/18 2018/19 2019/20 2020/21 2021/22
Local State State Sales Tax Federal
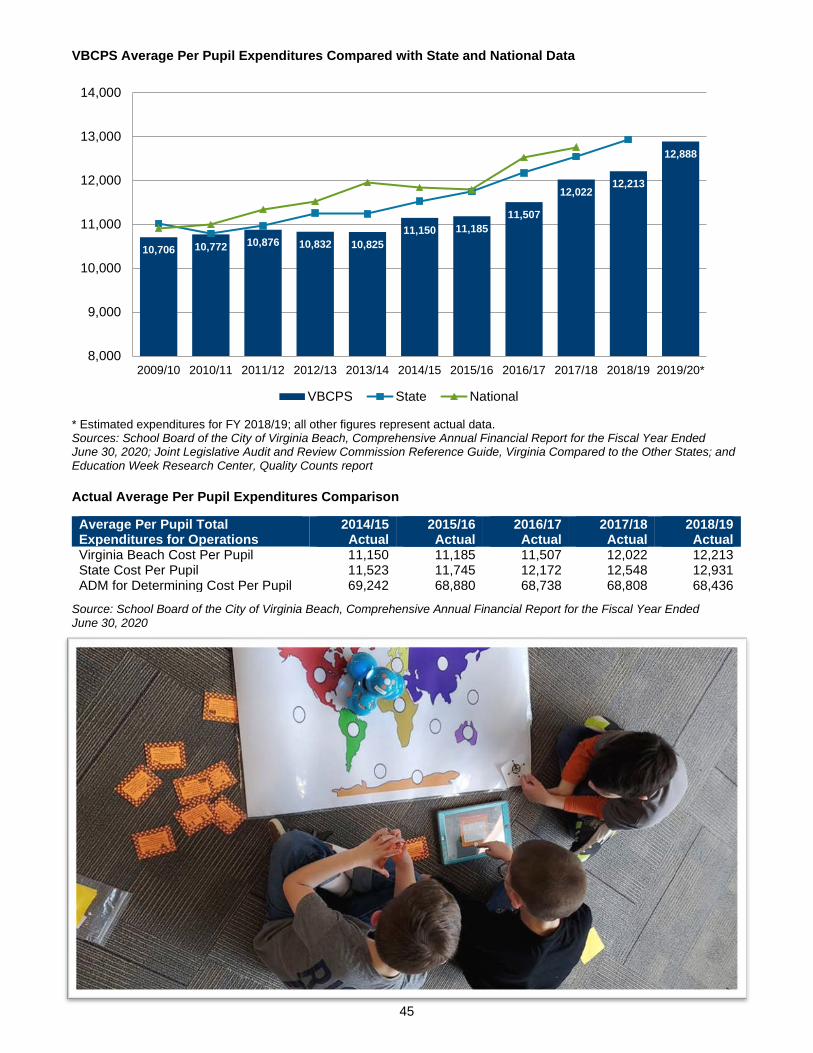
45
VBCPS Average Per Pupil Expenditures Compared with State and National Data
* Estimated expenditures for FY 2018/19; all other figures represent actual data. Sources: School Board of the City of Virginia Beach, Comprehensive Annual Financial Report for the Fiscal Year Ended June 30, 2020; Joint Legislative Audit and Review Commission Reference Guide, Virginia Compared to the Other States; and Education Week Research Center, Quality Counts report Actual Average Per Pupil Expenditures Comparison Average Per Pupil Total Expenditures for Operations
2014/15 Actual
2015/16 Actual
2016/17 Actual
2017/18 Actual
2018/19 Actual
Virginia Beach Cost Per Pupil 11,150 11,185 11,507 12,022 12,213 State Cost Per Pupil 11,523 11,745 12,172 12,548 12,931 ADM for Determining Cost Per Pupil 69,242 68,880 68,738 68,808 68,436
Source: School Board of the City of Virginia Beach, Comprehensive Annual Financial Report for the Fiscal Year Ended June 30, 2020
10,706 10,772 10,876 10,832 10,82511,150 11,185
11,507
12,02212,213
12,888
8,000
9,000
10,000
11,000
12,000
13,000
14,000
2009/10 2010/11 2011/12 2012/13 2013/14 2014/15 2015/16 2016/17 2017/18 2018/19 2019/20*
VBCPS State National
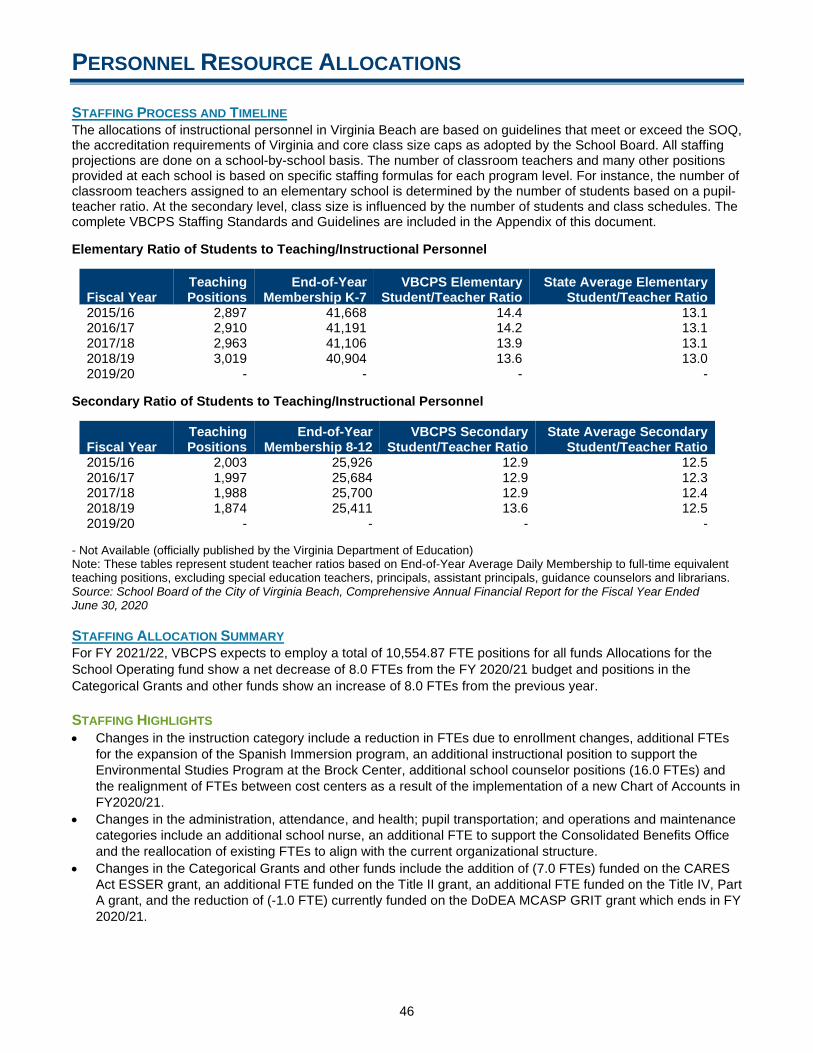
46
PERSONNEL RESOURCE ALLOCATIONS STAFFING PROCESS AND TIMELINE The allocations of instructional personnel in Virginia Beach are based on guidelines that meet or exceed the SOQ, the accreditation requirements of Virginia and core class size caps as adopted by the School Board. All staffing projections are done on a school-by-school basis. The number of classroom teachers and many other positions provided at each school is based on specific staffing formulas for each program level. For instance, the number of classroom teachers assigned to an elementary school is determined by the number of students based on a pupil-teacher ratio. At the secondary level, class size is influenced by the number of students and class schedules. The complete VBCPS Staffing Standards and Guidelines are included in the Appendix of this document. Elementary Ratio of Students to Teaching/Instructional Personnel
Fiscal Year Teaching Positions
End-of-Year Membership K-7
VBCPS Elementary Student/Teacher Ratio
State Average Elementary Student/Teacher Ratio
2015/16 2,897 41,668 14.4 13.1 2016/17 2,910 41,191 14.2 13.1 2017/18 2,963 41,106 13.9 13.1 2018/19 3,019 40,904 13.6 13.0 2019/20 - - - -
Secondary Ratio of Students to Teaching/Instructional Personnel
Fiscal Year Teaching Positions
End-of-Year Membership 8-12
VBCPS Secondary Student/Teacher Ratio
State Average Secondary Student/Teacher Ratio
2015/16 2,003 25,926 12.9 12.5 2016/17 1,997 25,684 12.9 12.3 2017/18 1,988 25,700 12.9 12.4 2018/19 1,874 25,411 13.6 12.5 2019/20 - - - -
- Not Available (officially published by the Virginia Department of Education) Note: These tables represent student teacher ratios based on End-of-Year Average Daily Membership to full-time equivalent teaching positions, excluding special education teachers, principals, assistant principals, guidance counselors and librarians. Source: School Board of the City of Virginia Beach, Comprehensive Annual Financial Report for the Fiscal Year Ended June 30, 2020
STAFFING ALLOCATION SUMMARY For FY 2021/22, VBCPS expects to employ a total of 10,554.87 FTE positions for all funds Allocations for the School Operating fund show a net decrease of 8.0 FTEs from the FY 2020/21 budget and positions in the Categorical Grants and other funds show an increase of 8.0 FTEs from the previous year. STAFFING HIGHLIGHTS • Changes in the instruction category include a reduction in FTEs due to enrollment changes, additional FTEs
for the expansion of the Spanish Immersion program, an additional instructional position to support the Environmental Studies Program at the Brock Center, additional school counselor positions (16.0 FTEs) and the realignment of FTEs between cost centers as a result of the implementation of a new Chart of Accounts in FY2020/21.
• Changes in the administration, attendance, and health; pupil transportation; and operations and maintenance categories include an additional school nurse, an additional FTE to support the Consolidated Benefits Office and the reallocation of existing FTEs to align with the current organizational structure.
• Changes in the Categorical Grants and other funds include the addition of (7.0 FTEs) funded on the CARES Act ESSER grant, an additional FTE funded on the Title II grant, an additional FTE funded on the Title IV, Part A grant, and the reduction of (-1.0 FTE) currently funded on the DoDEA MCASP GRIT grant which ends in FY 2020/21.
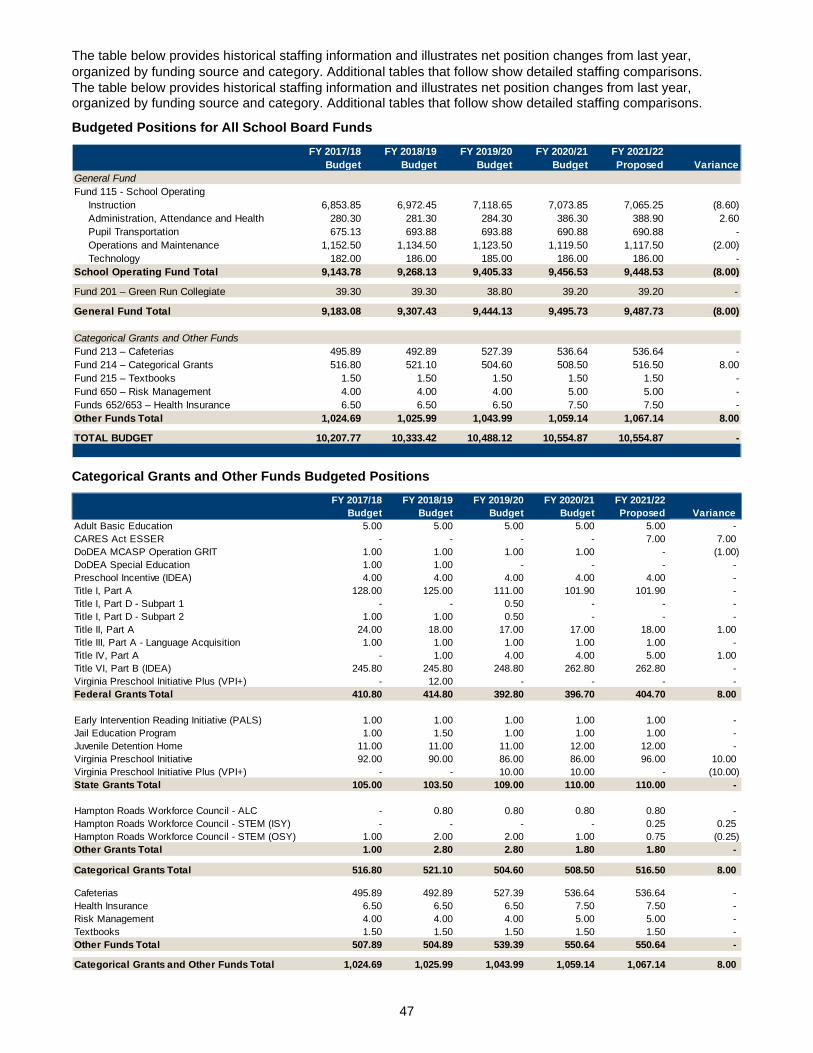
47
The table below provides historical staffing information and illustrates net position changes from last year, organized by funding source and category. Additional tables that follow show detailed staffing comparisons. The table below provides historical staffing information and illustrates net position changes from last year, organized by funding source and category. Additional tables that follow show detailed staffing comparisons.
Budgeted Positions for All School Board Funds
Categorical Grants and Other Funds Budgeted Positions
FY 2017/18Budget
FY 2018/19Budget
FY 2019/20Budget
FY 2020/21Budget
FY 2021/22Proposed Variance
General FundFund 115 - School Operating
Instruction 6,853.85 6,972.45 7,118.65 7,073.85 7,065.25 (8.60)Administration, Attendance and Health 280.30 281.30 284.30 386.30 388.90 2.60 Pupil Transportation 675.13 693.88 693.88 690.88 690.88 - Operations and Maintenance 1,152.50 1,134.50 1,123.50 1,119.50 1,117.50 (2.00)Technology 182.00 186.00 185.00 186.00 186.00 -
School Operating Fund Total 9,143.78 9,268.13 9,405.33 9,456.53 9,448.53 (8.00)
Fund 201 – Green Run Collegiate 39.30 39.30 38.80 39.20 39.20 -
General Fund Total 9,183.08 9,307.43 9,444.13 9,495.73 9,487.73 (8.00)
Categorical Grants and Other FundsFund 213 – Cafeterias 495.89 492.89 527.39 536.64 536.64 - Fund 214 – Categorical Grants 516.80 521.10 504.60 508.50 516.50 8.00 Fund 215 – Textbooks 1.50 1.50 1.50 1.50 1.50 - Fund 650 – Risk Management 4.00 4.00 4.00 5.00 5.00 - Funds 652/653 – Health Insurance 6.50 6.50 6.50 7.50 7.50 - Other Funds Total 1,024.69 1,025.99 1,043.99 1,059.14 1,067.14 8.00
TOTAL BUDGET 10,207.77 10,333.42 10,488.12 10,554.87 10,554.87 -
FY 2017/18 FY 2018/19 FY 2019/20 FY 2020/21 FY 2021/22Budget Budget Budget Budget Proposed Variance
Adult Basic Education 5.00 5.00 5.00 5.00 5.00 - CARES Act ESSER - - - - 7.00 7.00 DoDEA MCASP Operation GRIT 1.00 1.00 1.00 1.00 - (1.00) DoDEA Special Education 1.00 1.00 - - - - Preschool Incentive (IDEA) 4.00 4.00 4.00 4.00 4.00 - Title I, Part A 128.00 125.00 111.00 101.90 101.90 - Title I, Part D - Subpart 1 - - 0.50 - - - Title I, Part D - Subpart 2 1.00 1.00 0.50 - - - Title II, Part A 24.00 18.00 17.00 17.00 18.00 1.00 Title III, Part A - Language Acquisition 1.00 1.00 1.00 1.00 1.00 - Title IV, Part A - 1.00 4.00 4.00 5.00 1.00 Title VI, Part B (IDEA) 245.80 245.80 248.80 262.80 262.80 - Virginia Preschool Initiative Plus (VPI+) - 12.00 - - - - Federal Grants Total 410.80 414.80 392.80 396.70 404.70 8.00
Early Intervention Reading Initiative (PALS) 1.00 1.00 1.00 1.00 1.00 - Jail Education Program 1.00 1.50 1.00 1.00 1.00 - Juvenile Detention Home 11.00 11.00 11.00 12.00 12.00 - Virginia Preschool Initiative 92.00 90.00 86.00 86.00 96.00 10.00 Virginia Preschool Initiative Plus (VPI+) - - 10.00 10.00 - (10.00) State Grants Total 105.00 103.50 109.00 110.00 110.00 -
Hampton Roads Workforce Council - ALC - 0.80 0.80 0.80 0.80 - Hampton Roads Workforce Council - STEM (ISY) - - - - 0.25 0.25 Hampton Roads Workforce Council - STEM (OSY) 1.00 2.00 2.00 1.00 0.75 (0.25) Other Grants Total 1.00 2.80 2.80 1.80 1.80 -
Categorical Grants Total 516.80 521.10 504.60 508.50 516.50 8.00
Cafeterias 495.89 492.89 527.39 536.64 536.64 - Health Insurance 6.50 6.50 6.50 7.50 7.50 - Risk Management 4.00 4.00 4.00 5.00 5.00 - Textbooks 1.50 1.50 1.50 1.50 1.50 - Other Funds Total 507.89 504.89 539.39 550.64 550.64 -
Categorical Grants and Other Funds Total 1,024.69 1,025.99 1,043.99 1,059.14 1,067.14 8.00
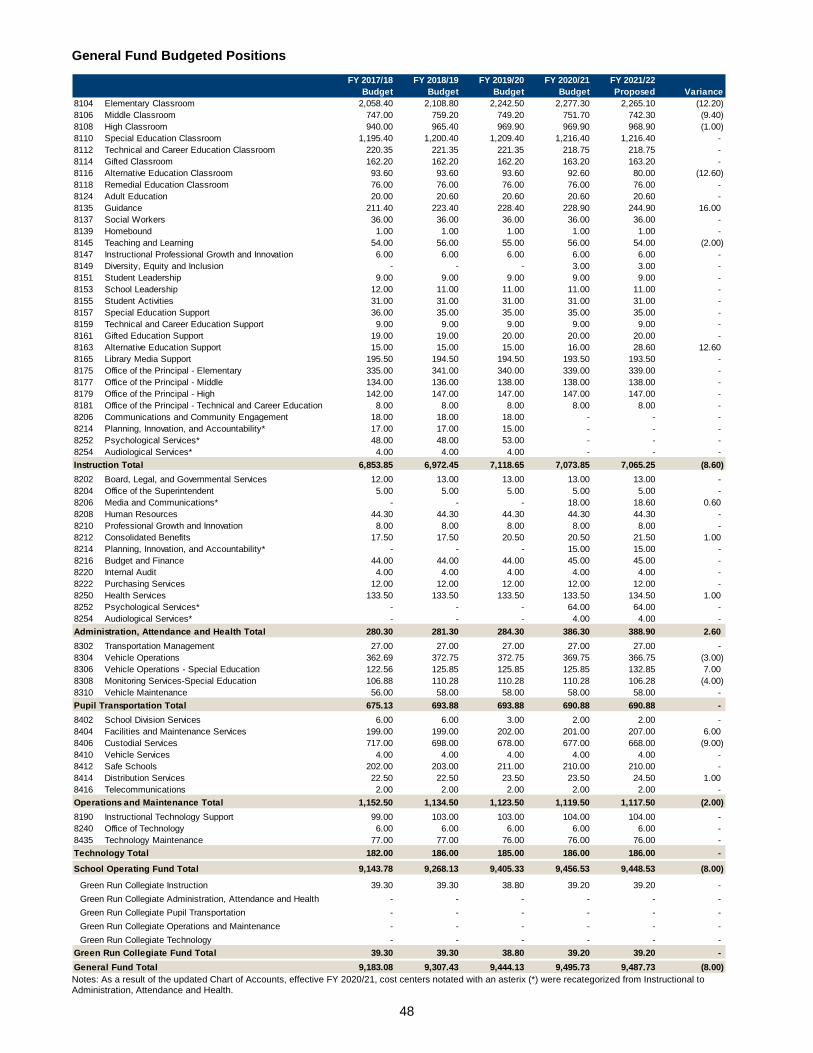
48
General Fund Budgeted Positions
Notes: As a result of the updated Chart of Accounts, effective FY 2020/21, cost centers notated with an asterix (*) were recategorized from Instructional to Administration, Attendance and Health.
FY 2017/18 FY 2018/19 FY 2019/20 FY 2020/21 FY 2021/22Budget Budget Budget Budget Proposed Variance
8104 Elementary Classroom 2,058.40 2,108.80 2,242.50 2,277.30 2,265.10 (12.20) 8106 Middle Classroom 747.00 759.20 749.20 751.70 742.30 (9.40) 8108 High Classroom 940.00 965.40 969.90 969.90 968.90 (1.00) 8110 Special Education Classroom 1,195.40 1,200.40 1,209.40 1,216.40 1,216.40 - 8112 Technical and Career Education Classroom 220.35 221.35 221.35 218.75 218.75 - 8114 Gifted Classroom 162.20 162.20 162.20 163.20 163.20 - 8116 Alternative Education Classroom 93.60 93.60 93.60 92.60 80.00 (12.60) 8118 Remedial Education Classroom 76.00 76.00 76.00 76.00 76.00 - 8124 Adult Education 20.00 20.60 20.60 20.60 20.60 - 8135 Guidance 211.40 223.40 228.40 228.90 244.90 16.00 8137 Social Workers 36.00 36.00 36.00 36.00 36.00 - 8139 Homebound 1.00 1.00 1.00 1.00 1.00 - 8145 Teaching and Learning 54.00 56.00 55.00 56.00 54.00 (2.00) 8147 Instructional Professional Growth and Innovation 6.00 6.00 6.00 6.00 6.00 - 8149 Diversity, Equity and Inclusion - - - 3.00 3.00 - 8151 Student Leadership 9.00 9.00 9.00 9.00 9.00 - 8153 School Leadership 12.00 11.00 11.00 11.00 11.00 - 8155 Student Activities 31.00 31.00 31.00 31.00 31.00 - 8157 Special Education Support 36.00 35.00 35.00 35.00 35.00 - 8159 Technical and Career Education Support 9.00 9.00 9.00 9.00 9.00 - 8161 Gifted Education Support 19.00 19.00 20.00 20.00 20.00 - 8163 Alternative Education Support 15.00 15.00 15.00 16.00 28.60 12.60 8165 Library Media Support 195.50 194.50 194.50 193.50 193.50 - 8175 Office of the Principal - Elementary 335.00 341.00 340.00 339.00 339.00 - 8177 Office of the Principal - Middle 134.00 136.00 138.00 138.00 138.00 - 8179 Office of the Principal - High 142.00 147.00 147.00 147.00 147.00 - 8181 Office of the Principal - Technical and Career Education 8.00 8.00 8.00 8.00 8.00 - 8206 Communications and Community Engagement 18.00 18.00 18.00 - - - 8214 Planning, Innovation, and Accountability* 17.00 17.00 15.00 - - - 8252 Psychological Services* 48.00 48.00 53.00 - - - 8254 Audiological Services* 4.00 4.00 4.00 - - -
6,853.85 6,972.45 7,118.65 7,073.85 7,065.25 (8.60) 8202 Board, Legal, and Governmental Services 12.00 13.00 13.00 13.00 13.00 - 8204 Office of the Superintendent 5.00 5.00 5.00 5.00 5.00 - 8206 Media and Communications* - - - 18.00 18.60 0.60 8208 Human Resources 44.30 44.30 44.30 44.30 44.30 - 8210 Professional Growth and Innovation 8.00 8.00 8.00 8.00 8.00 - 8212 Consolidated Benefits 17.50 17.50 20.50 20.50 21.50 1.00 8214 Planning, Innovation, and Accountability* - - - 15.00 15.00 - 8216 Budget and Finance 44.00 44.00 44.00 45.00 45.00 - 8220 Internal Audit 4.00 4.00 4.00 4.00 4.00 - 8222 Purchasing Services 12.00 12.00 12.00 12.00 12.00 - 8250 Health Services 133.50 133.50 133.50 133.50 134.50 1.00 8252 Psychological Services* - - - 64.00 64.00 - 8254 Audiological Services* - - - 4.00 4.00 -
280.30 281.30 284.30 386.30 388.90 2.60 8302 Transportation Management 27.00 27.00 27.00 27.00 27.00 - 8304 Vehicle Operations 362.69 372.75 372.75 369.75 366.75 (3.00) 8306 Vehicle Operations - Special Education 122.56 125.85 125.85 125.85 132.85 7.00 8308 Monitoring Services-Special Education 106.88 110.28 110.28 110.28 106.28 (4.00) 8310 Vehicle Maintenance 56.00 58.00 58.00 58.00 58.00 -
675.13 693.88 693.88 690.88 690.88 - 8402 School Division Services 6.00 6.00 3.00 2.00 2.00 - 8404 Facilities and Maintenance Services 199.00 199.00 202.00 201.00 207.00 6.00 8406 Custodial Services 717.00 698.00 678.00 677.00 668.00 (9.00) 8410 Vehicle Services 4.00 4.00 4.00 4.00 4.00 - 8412 Safe Schools 202.00 203.00 211.00 210.00 210.00 - 8414 Distribution Services 22.50 22.50 23.50 23.50 24.50 1.00 8416 Telecommunications 2.00 2.00 2.00 2.00 2.00 -
1,152.50 1,134.50 1,123.50 1,119.50 1,117.50 (2.00) 8190 Instructional Technology Support 99.00 103.00 103.00 104.00 104.00 - 8240 Office of Technology 6.00 6.00 6.00 6.00 6.00 - 8435 Technology Maintenance 77.00 77.00 76.00 76.00 76.00 -
182.00 186.00 185.00 186.00 186.00 - 9,143.78 9,268.13 9,405.33 9,456.53 9,448.53 (8.00)
39.30 39.30 38.80 39.20 39.20 - - - - - - - - - - - - - - - - - - - - - - - - -
39.30 39.30 38.80 39.20 39.20 - 9,183.08 9,307.43 9,444.13 9,495.73 9,487.73 (8.00)
Green Run Collegiate Fund TotalGeneral Fund Total
School Operating Fund Total
Instruction Total
Administration, Attendance and Health Total
Pupil Transportation Total
Operations and Maintenance Total
Technology Total
Green Run Collegiate InstructionGreen Run Collegiate Administration, Attendance and HealthGreen Run Collegiate Pupil TransportationGreen Run Collegiate Operations and MaintenanceGreen Run Collegiate Technology
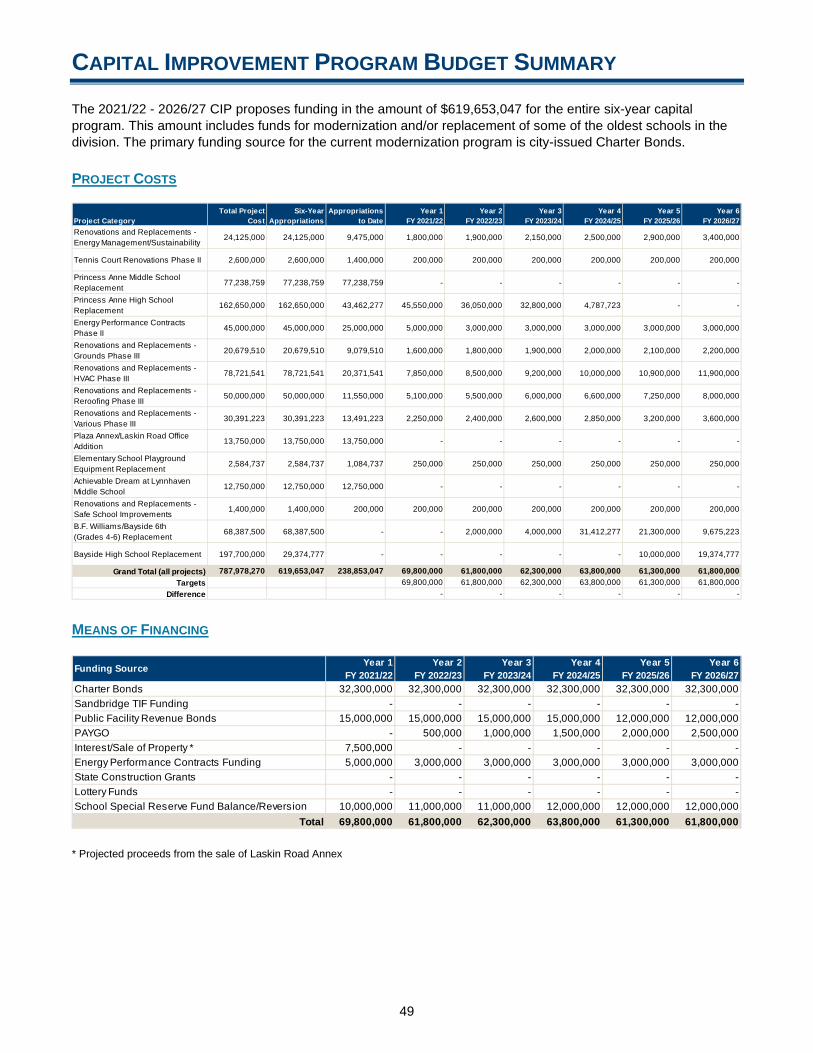
49
CAPITAL IMPROVEMENT PROGRAM BUDGET SUMMARY The 2021/22 - 2026/27 CIP proposes funding in the amount of $619,653,047 for the entire six-year capital program. This amount includes funds for modernization and/or replacement of some of the oldest schools in the division. The primary funding source for the current modernization program is city-issued Charter Bonds. PROJECT COSTS
MEANS OF FINANCING
* Projected proceeds from the sale of Laskin Road Annex
Project Category Total Project
Cost Six-Year
Appropriations
Appropriations
to Date Year 1
FY 2021/22 Year 2
FY 2022/23 Year 3
FY 2023/24 Year 4
FY 2024/25 Year 5
FY 2025/26 Year 6
FY 2026/27 Renovations and Replacements - Energy Management/Sustainability 24,125,000 24,125,000 9,475,000 1,800,000 1,900,000 2,150,000 2,500,000 2,900,000 3,400,000
Tennis Court Renovations Phase II 2,600,000 2,600,000 1,400,000 200,000 200,000 200,000 200,000 200,000 200,000
Princess Anne Middle School Replacement 77,238,759 77,238,759 77,238,759 - - - - - -
Princess Anne High School Replacement 162,650,000 162,650,000 43,462,277 45,550,000 36,050,000 32,800,000 4,787,723 - -
Energy Performance Contracts Phase II 45,000,000 45,000,000 25,000,000 5,000,000 3,000,000 3,000,000 3,000,000 3,000,000 3,000,000
Renovations and Replacements - Grounds Phase III 20,679,510 20,679,510 9,079,510 1,600,000 1,800,000 1,900,000 2,000,000 2,100,000 2,200,000
Renovations and Replacements - HVAC Phase III 78,721,541 78,721,541 20,371,541 7,850,000 8,500,000 9,200,000 10,000,000 10,900,000 11,900,000
Renovations and Replacements - Reroofing Phase III 50,000,000 50,000,000 11,550,000 5,100,000 5,500,000 6,000,000 6,600,000 7,250,000 8,000,000
Renovations and Replacements - Various Phase III 30,391,223 30,391,223 13,491,223 2,250,000 2,400,000 2,600,000 2,850,000 3,200,000 3,600,000
Plaza Annex/Laskin Road Office Addition 13,750,000 13,750,000 13,750,000 - - - - - -
Elementary School Playground Equipment Replacement 2,584,737 2,584,737 1,084,737 250,000 250,000 250,000 250,000 250,000 250,000
Achievable Dream at Lynnhaven Middle School 12,750,000 12,750,000 12,750,000 - - - - - -
Renovations and Replacements - Safe School Improvements 1,400,000 1,400,000 200,000 200,000 200,000 200,000 200,000 200,000 200,000
B.F. Williams/Bayside 6th (Grades 4-6) Replacement 68,387,500 68,387,500 - - 2,000,000 4,000,000 31,412,277 21,300,000 9,675,223
Bayside High School Replacement 197,700,000 29,374,777 - - - - - 10,000,000 19,374,777
Grand Total (all projects) 787,978,270 619,653,047 238,853,047 69,800,000 61,800,000 62,300,000 63,800,000 61,300,000 61,800,000 Targets 69,800,000 61,800,000 62,300,000 63,800,000 61,300,000 61,800,000
Difference - - - - - -
Funding Source Year 1 FY 2021/22
Year 2 FY 2022/23
Year 3FY 2023/24
Year 4 FY 2024/25
Year 5 FY 2025/26
Year 6 FY 2026/27
Charter Bonds 32,300,000 32,300,000 32,300,000 32,300,000 32,300,000 32,300,000Sandbridge TIF Funding - - - - - -Public Facility Revenue Bonds 15,000,000 15,000,000 15,000,000 15,000,000 12,000,000 12,000,000PAYGO - 500,000 1,000,000 1,500,000 2,000,000 2,500,000Interest/Sale of Property * 7,500,000 - - - - -Energy Performance Contracts Funding 5,000,000 3,000,000 3,000,000 3,000,000 3,000,000 3,000,000State Construction Grants - - - - - -Lottery Funds - - - - - -School Special Reserve Fund Balance/Reversion 10,000,000 11,000,000 11,000,000 12,000,000 12,000,000 12,000,000
Total 69,800,000 61,800,000 62,300,000 63,800,000 61,300,000 61,800,000
50
This page intentionally left blank

51
APPENDIX The Strategic Framework • Schools and Centers
Staffing Standards and Guidelines • Revenue Sharing Policy Budget Manager and Signature Authority

52
This page intentionally left blank
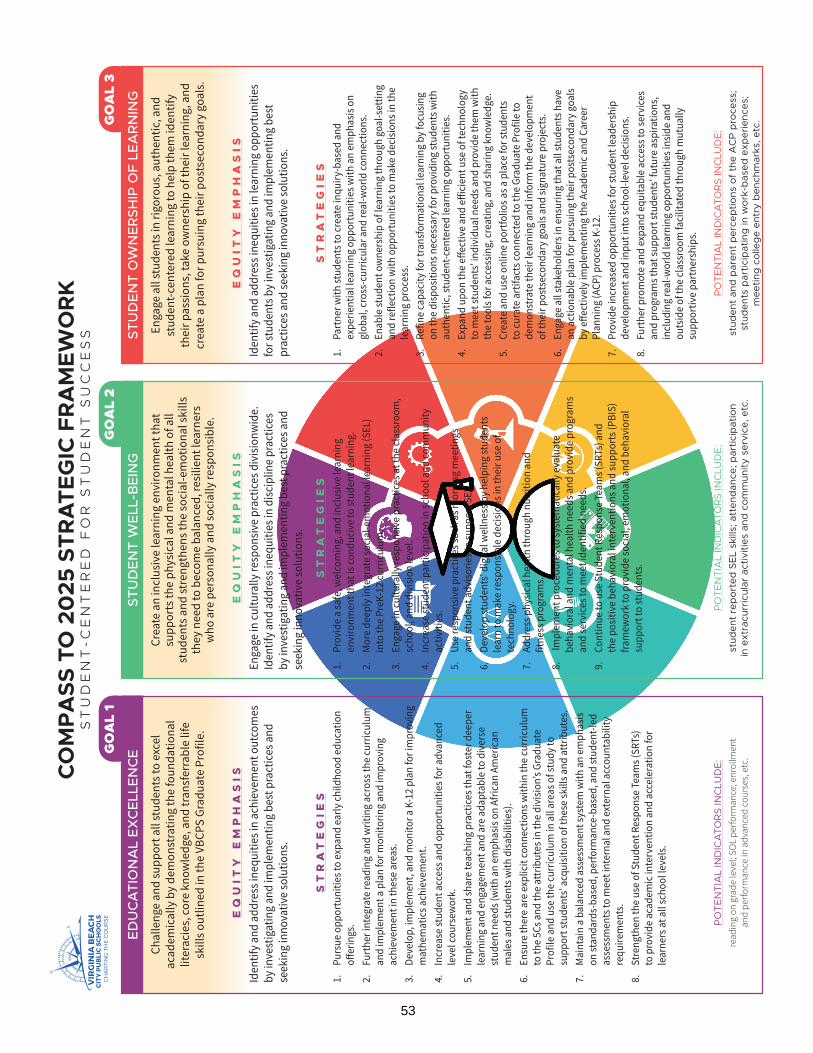
CO
MP
ASS
TO
20
25 S
TR
AT
EG
IC F
RA
ME
WO
RK
ST
UD
EN
T-C
EN
TE
RE
D F
OR
ST
UD
EN
T S
UC
CE
SS
GO
AL
1
ED
UC
AT
ION
AL
EX
CE
LLE
NC
E
Chal
leng
e an
d su
ppor
t all
stud
ents
to e
xcel
ac
adem
ical
ly b
y de
mon
stra
ting
the
foun
datio
nal
liter
acie
s, c
ore
know
ledg
e, a
nd tr
ansf
erra
ble
life
skill
s out
lined
in th
e VB
CPS
Grad
uate
Pro
file.
EQ
UIT
Y E
MP
HA
SIS
Iden
tify
and
addr
ess i
nequ
ities
in a
chie
vem
ent o
utco
mes
by
inve
stig
atin
g an
d im
plem
entin
g be
st p
ract
ices
and
se
ekin
g in
nova
tive
solu
tions
.
ST
RA
TE
GIE
S1.
Pu
rsue
opp
ortu
nitie
s to
expa
nd e
arly
child
hood
edu
catio
n off
erin
gs.
2.
Furt
her i
nteg
rate
read
ing
and
writ
ing
acro
ss th
e cu
rric
ulum
an
d im
plem
ent a
pla
n fo
r mon
itorin
g an
d im
prov
ing
achi
evem
ent i
n th
ese
area
s.3.
De
velo
p, im
plem
ent,
and
mon
itor a
K-1
2 pl
an fo
r im
prov
ing
mat
hem
atic
s ach
ieve
men
t.4.
In
crea
se st
uden
t acc
ess a
nd o
ppor
tuni
ties f
or a
dvan
ced
leve
l cou
rsew
ork.
5.
Impl
emen
t and
shar
e te
achi
ng p
ract
ices
that
fost
er d
eepe
r le
arni
ng a
nd e
ngag
emen
t and
are
ada
ptab
le to
div
erse
st
uden
t nee
ds (w
ith a
n em
phas
is o
n Af
rican
Am
eric
an
mal
es a
nd st
uden
ts w
ith d
isab
ilitie
s).
6.
Ensu
re th
ere
are
expl
icit
conn
ectio
ns w
ithin
the
curr
icul
um
to th
e 5C
s and
the
attr
ibut
es in
the
divi
sion
’s Gr
adua
te
Prof
ile a
nd u
se th
e cu
rric
ulum
in a
ll ar
eas o
f stu
dy to
su
ppor
t stu
dent
s’ ac
quis
ition
of t
hese
skill
s and
attr
ibut
es.
7.
Mai
ntai
n a
bala
nced
ass
essm
ent s
yste
m w
ith a
n em
phas
is
on st
anda
rds-
base
d, p
erfo
rman
ce-b
ased
, and
stud
ent-l
ed
asse
ssm
ents
to m
eet i
nter
nal a
nd e
xter
nal a
ccou
ntab
ility
re
quire
men
ts.
8.
Stre
ngth
en th
e us
e of
Stu
dent
Res
pons
e Te
ams (
SRTs
) to
pro
vide
aca
dem
ic in
terv
entio
n an
d ac
cele
ratio
n fo
r le
arne
rs a
t all
scho
ol le
vels
.
PO
TE
NT
IAL
IND
ICA
TOR
S IN
CLU
DE
:re
adin
g on
gra
de le
vel;
SOL
perfo
rman
ce; e
nrol
lmen
t an
d pe
rform
ance
in a
dvan
ced
cour
ses,
etc
.
GO
AL
2
STU
DE
NT
WE
LL-B
EIN
G
Crea
te a
n in
clus
ive
lear
ning
env
ironm
ent t
hat
supp
orts
the
phys
ical
and
men
tal h
ealth
of a
ll st
uden
ts a
nd st
reng
then
s the
soci
al-e
mot
iona
l ski
lls
they
nee
d to
bec
ome
bala
nced
, res
ilien
t lea
rner
s w
ho a
re p
erso
nally
and
soci
ally
resp
onsi
ble.
EQ
UIT
Y E
MP
HA
SIS
Enga
ge in
cultu
rally
resp
onsi
ve p
ract
ices
div
isio
nwid
e.
Iden
tify
and
addr
ess i
nequ
ities
in d
isci
plin
e pr
actic
es
by in
vest
igat
ing
and
impl
emen
ting
best
pra
ctic
es a
nd
seek
ing
inno
vativ
e so
lutio
ns.
ST
RA
TE
GIE
S1.
Pr
ovid
e a
safe
, wel
com
ing,
and
incl
usiv
e le
arni
ng
envi
ronm
ent t
hat i
s con
duci
ve to
stud
ent l
earn
ing.
2.
Mor
e de
eply
inte
grat
e so
cial
-em
otio
nal l
earn
ing
(SEL
) in
to th
e Pr
eK-1
2 cu
rric
ulum
.3.
En
gage
in cu
ltura
lly re
spon
sive
pra
ctic
es a
t the
clas
sroo
m,
scho
ol, a
nd d
ivis
ion
leve
l.4.
In
crea
se st
uden
t par
ticip
atio
n in
scho
ol a
nd co
mm
unity
ac
tiviti
es.
5.
Use
resp
onsi
ve p
ract
ices
such
as m
orni
ng m
eetin
gs
and
stud
ent a
dvis
orie
s to
supp
ort S
EL.
6.
Deve
lop
stud
ents
’ dig
ital w
elln
ess b
y he
lpin
g st
uden
ts
lear
n to
mak
e re
spon
sibl
e de
cisi
ons i
n th
eir u
se o
f te
chno
logy
.7.
Ad
dres
s phy
sica
l hea
lth th
roug
h nu
triti
on a
nd
fitne
ss p
rogr
ams.
8.
Impl
emen
t pro
cedu
res t
o sy
stem
atic
ally
eva
luat
e be
havi
oral
and
men
tal h
ealth
nee
ds a
nd p
rovi
de p
rogr
ams
and
serv
ices
to m
eet i
dent
ified
nee
ds.
9.
Cont
inue
to u
se S
tude
nt R
espo
nse
Team
s (SR
Ts) a
nd
the
posi
tive
beha
vior
al in
terv
entio
ns a
nd su
ppor
ts (P
BIS)
fra
mew
ork
to p
rovi
de so
cial
, em
otio
nal,
and
beha
vior
al
supp
ort t
o st
uden
ts.
PO
TE
NT
IAL
IND
ICA
TOR
S IN
CLU
DE
:st
uden
t re
po
rted
SE
L sk
ills;
att
end
ance
; par
ticip
atio
n in
ext
racu
rric
ular
act
iviti
es a
nd c
om
mun
ity s
ervi
ce, e
tc.
GO
AL
3
STU
DE
NT
OW
NE
RSH
IP O
F LE
AR
NIN
G
Enga
ge a
ll st
uden
ts in
rigo
rous
, aut
hent
ic, a
nd
stud
ent-c
ente
red
lear
ning
to h
elp
them
iden
tify
thei
r pas
sion
s, ta
ke o
wne
rshi
p of
thei
r lea
rnin
g, a
nd
crea
te a
pla
n fo
r pur
suin
g th
eir p
osts
econ
dary
goa
ls.
EQ
UIT
Y E
MP
HA
SIS
Iden
tify
and
addr
ess i
nequ
ities
in le
arni
ng o
ppor
tuni
ties
for s
tude
nts b
y in
vest
igat
ing
and
impl
emen
ting
best
pr
actic
es a
nd se
ekin
g in
nova
tive
solu
tions
.
ST
RA
TE
GIE
S1.
Pa
rtne
r with
stud
ents
to cr
eate
inqu
iry-b
ased
and
ex
perie
ntia
l lea
rnin
g op
port
uniti
es w
ith a
n em
phas
is o
n gl
obal
, cro
ss-c
urric
ular
and
real
-wor
ld co
nnec
tions
.2.
En
able
stud
ent o
wne
rshi
p of
lear
ning
thro
ugh
goal
-set
ting
and
refle
ctio
n w
ith o
ppor
tuni
ties t
o m
ake
deci
sion
s in
the
lear
ning
pro
cess
.3.
Re
fine
capa
city
for t
rans
form
atio
nal l
earn
ing
by fo
cusi
ng
on th
e di
spos
ition
s nec
essa
ry fo
r pro
vidi
ng st
uden
ts w
ith
auth
entic
, stu
dent
-cen
tere
d le
arni
ng o
ppor
tuni
ties.
4.
Expa
nd u
pon
the
effec
tive
and
effic
ient
use
of t
echn
olog
y to
mee
t stu
dent
s’ in
divi
dual
nee
ds a
nd p
rovi
de th
em w
ith
the
tool
s for
acc
essi
ng, c
reat
ing,
and
shar
ing
know
ledg
e.5.
Cr
eate
and
use
onl
ine
port
folio
s as a
pla
ce fo
r stu
dent
s to
cura
te a
rtifa
cts c
onne
cted
to th
e Gr
adua
te P
rofil
e to
de
mon
stra
te th
eir l
earn
ing
and
info
rm th
e de
velo
pmen
t of
thei
r pos
tsec
onda
ry g
oals
and
sign
atur
e pr
ojec
ts.
6.
Enga
ge a
ll st
akeh
olde
rs in
ens
urin
g th
at a
ll st
uden
ts h
ave
an a
ctio
nabl
e pl
an fo
r pur
suin
g th
eir p
osts
econ
dary
goa
ls
by e
ffect
ivel
y im
plem
entin
g th
e Ac
adem
ic a
nd C
aree
r Pl
anni
ng (A
CP) p
roce
ss K
-12.
7.
Prov
ide
incr
ease
d op
port
uniti
es fo
r stu
dent
lead
ersh
ip
deve
lopm
ent a
nd in
put i
nto
scho
ol-le
vel d
ecis
ions
.8.
Fu
rthe
r pro
mot
e an
d ex
pand
equ
itabl
e ac
cess
to se
rvic
esan
d pr
ogra
ms t
hat s
uppo
rt st
uden
ts’ f
utur
e as
pira
tions
, in
clud
ing
real
-wor
ld le
arni
ng o
ppor
tuni
ties i
nsid
e an
d ou
tsid
e of
the
clas
sroo
m fa
cilit
ated
thro
ugh
mut
ually
su
ppor
tive
part
ners
hips
.
PO
TE
NT
IAL
IND
ICA
TOR
S IN
CLU
DE
:st
uden
t an
d p
aren
t p
erce
ptio
ns o
f th
e A
CP
pro
cess
; st
uden
ts p
artic
ipat
ing
in w
ork
-bas
ed e
xper
ienc
es;
mee
ting
co
lleg
e en
try
ben
chm
arks
, etc
.
53
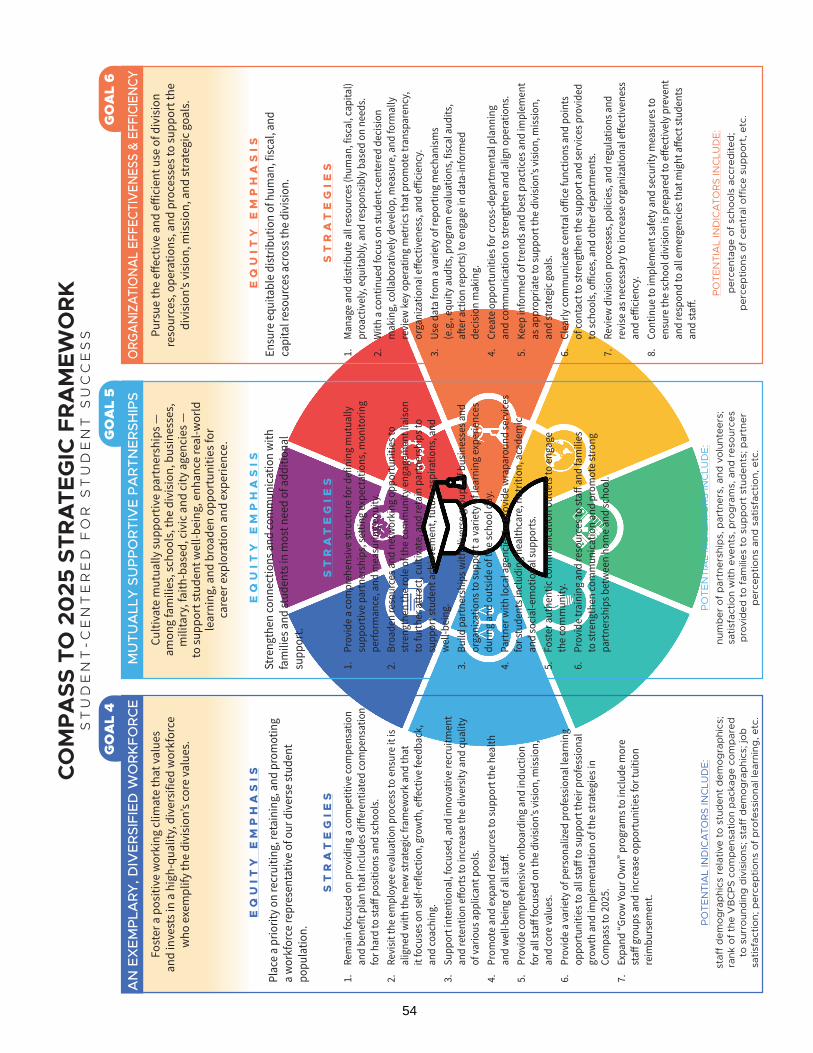
CO
MP
ASS
TO
20
25 S
TR
AT
EG
IC F
RA
ME
WO
RK
ST
UD
EN
T-C
EN
TE
RE
D F
OR
ST
UD
EN
T S
UC
CE
SS
GO
AL
4
AN
EX
EM
PLA
RY, D
IVE
RSI
FIE
D W
OR
KFO
RC
E
Fost
er a
pos
itive
wor
king
clim
ate
that
val
ues
and
inve
sts i
n a
high
-qua
lity,
div
ersi
fied
wor
kfor
ce
who
exe
mpl
ify th
e di
visi
on’s
core
val
ues.
EQ
UIT
Y E
MP
HA
SIS
Plac
e a
prio
rity
on re
crui
ting,
reta
inin
g, a
nd p
rom
otin
g
a w
orkf
orce
repr
esen
tativ
e of
our
div
erse
stud
ent
popu
latio
n.
ST
RA
TE
GIE
S
1.
Rem
ain
focu
sed
on p
rovi
ding
a co
mpe
titiv
e co
mpe
nsat
ion
and
bene
fit p
lan
that
incl
udes
diff
eren
tiate
d co
mpe
nsat
ion
for h
ard
to st
aff p
ositi
ons a
nd sc
hool
s.2.
Re
visi
t the
em
ploy
ee e
valu
atio
n pr
oces
s to
ensu
re it
is
alig
ned
with
the
new
stra
tegi
c fra
mew
ork
and
that
it
focu
ses o
n se
lf-re
flect
ion,
gro
wth
, effe
ctiv
e fe
edba
ck,
and
coac
hing
.3.
Su
ppor
t int
entio
nal,
focu
sed,
and
inno
vativ
e re
crui
tmen
t an
d re
tent
ion
effor
ts to
incr
ease
the
dive
rsity
and
qua
lity
of va
rious
app
lican
t poo
ls.
4.
Prom
ote
and
expa
nd re
sour
ces t
o su
ppor
t the
hea
lth
and
wel
l-bei
ng o
f all
staff
.5.
Pr
ovid
e co
mpr
ehen
sive
onb
oard
ing
and
indu
ctio
n fo
r all
staff
focu
sed
on th
e di
visi
on’s
visi
on, m
issi
on,
and
core
valu
es.
6.
Prov
ide
a va
riety
of p
erso
naliz
ed p
rofe
ssio
nal l
earn
ing
oppo
rtun
ities
to a
ll st
aff to
supp
ort t
heir
prof
essi
onal
gr
owth
and
impl
emen
tatio
n of
the
stra
tegi
es in
Co
mpa
ss to
202
5.7.
Ex
pand
“Gro
w Yo
ur O
wn”
pro
gram
s to
incl
ude
mor
e st
aff g
roup
s and
incr
ease
opp
ortu
nitie
s for
tuiti
on
reim
burs
emen
t.
PO
TE
NT
IAL
IND
ICA
TOR
S IN
CLU
DE
:st
aff
dem
og
rap
hics
rel
ativ
e to
stu
den
t d
emo
gra
phi
cs;
rank
of
the
VB
CP
S co
mp
ensa
tion
pac
kag
e co
mp
ared
to
sur
roun
din
g d
ivis
ions
; sta
ff d
emo
gra
phi
cs; j
ob
sa
tisfa
ctio
n; p
erce
ptio
ns o
f p
rofe
ssio
nal l
earn
ing
, etc
.
GO
AL
5
MU
TU
ALL
Y S
UP
PO
RT
IVE
PA
RT
NE
RSH
IPS
Culti
vate
mut
ually
supp
ortiv
e pa
rtne
rshi
ps —
am
ong
fam
ilies
, sch
ools
, the
div
isio
n, b
usin
esse
s,
mili
tary
, fai
th-b
ased
, civ
ic a
nd c
ity a
genc
ies —
to
supp
ort s
tude
nt w
ell-b
eing
, enh
ance
real
-wor
ld
lear
ning
, and
bro
aden
opp
ortu
nitie
s for
ca
reer
exp
lora
tion
and
expe
rienc
e.
EQ
UIT
Y E
MP
HA
SIS
Stre
ngth
en co
nnec
tions
and
com
mun
icat
ion
with
fa
mili
es a
nd st
uden
ts in
mos
t nee
d of
add
ition
al
supp
ort.
ST
RA
TE
GIE
S
1.
Prov
ide
a co
mpr
ehen
sive
stru
ctur
e fo
r def
inin
g m
utua
llysu
ppor
tive
part
ners
hips
, set
ting
expe
ctat
ions
, mon
itorin
g pe
rform
ance
, and
mea
surin
g eq
uity
.2.
Br
oade
n re
sour
ces a
nd n
etw
orki
ng o
ppor
tuni
ties t
o st
reng
then
the
role
of t
he co
mm
unity
eng
agem
ent l
iais
on
to fu
rthe
r attr
act,
culti
vate
, and
reta
in p
artn
ersh
ips t
o su
ppor
t stu
dent
ach
ieve
men
t, fu
ture
asp
iratio
ns, a
nd
wel
l-bei
ng.
3.
Build
par
tner
ship
s with
div
erse
gro
ups o
f bus
ines
ses a
nd
orga
niza
tions
to su
ppor
t a va
riety
of l
earn
ing
expe
rienc
es
durin
g an
d ou
tsid
e of
the
scho
ol d
ay.
4.
Part
ner w
ith lo
cal a
genc
ies t
o pr
ovid
e w
rapa
roun
d se
rvic
es
for s
tude
nts i
nclu
ding
hea
lthca
re, n
utrit
ion,
aca
dem
ic
and
soci
al-e
mot
iona
l sup
port
s.5.
Fo
ster
aut
hent
ic co
mm
unic
atio
n ou
tlets
to e
ngag
e th
e co
mm
unity
.6.
Pr
ovid
e tra
inin
g an
d re
sour
ces t
o st
aff a
nd fa
mili
es
to st
reng
then
com
mun
icat
ion
and
prom
ote
stro
ng
part
ners
hips
bet
wee
n ho
me
and
scho
ol.
PO
TE
NT
IAL
IND
ICA
TOR
S IN
CLU
DE
:nu
mb
er o
f p
artn
ersh
ips,
par
tner
s, a
nd v
olu
ntee
rs;
satis
fact
ion
with
eve
nts,
pro
gra
ms,
and
res
our
ces
pro
vid
ed t
o f
amili
es t
o s
upp
ort
stu
den
ts; p
artn
er
per
cep
tions
and
sat
isfa
ctio
n, e
tc.
GO
AL
6
ORG
AN
IZAT
ION
AL
EFFE
CTIV
ENES
S &
EFFI
CIEN
CY
Purs
ue th
e eff
ectiv
e an
d eff
icie
nt u
se o
f div
isio
n re
sour
ces,
ope
ratio
ns, a
nd p
roce
sses
to su
ppor
t the
di
visi
on’s
visi
on, m
issi
on, a
nd st
rate
gic
goal
s.
EQ
UIT
Y E
MP
HA
SIS
Ensu
re e
quita
ble
dist
ribut
ion
of h
uman
, fis
cal,
and
capi
tal r
esou
rces
acr
oss t
he d
ivis
ion.
ST
RA
TE
GIE
S
1.
Man
age
and
dist
ribut
e al
l res
ourc
es (h
uman
, fis
cal,
capi
tal)
proa
ctiv
ely,
equ
itabl
y, a
nd re
spon
sibl
y ba
sed
on n
eeds
.2.
W
ith a
cont
inue
d fo
cus o
n st
uden
t-cen
tere
d de
cisi
on
mak
ing,
colla
bora
tivel
y de
velo
p, m
easu
re, a
nd fo
rmal
ly
revi
ew k
ey o
pera
ting
met
rics t
hat p
rom
ote
trans
pare
ncy,
or
gani
zatio
nal e
ffect
iven
ess,
and
effi
cien
cy.
3.
Use
data
from
a va
riety
of r
epor
ting
mec
hani
sms
(e.g
., eq
uity
aud
its, p
rogr
am e
valu
atio
ns, f
isca
l aud
its,
after
act
ion
repo
rts)
to e
ngag
e in
dat
a-in
form
ed
deci
sion
mak
ing.
4.
Crea
te o
ppor
tuni
ties f
or cr
oss-
depa
rtm
enta
l pla
nnin
g an
d co
mm
unic
atio
n to
stre
ngth
en a
nd a
lign
oper
atio
ns.
5.
Keep
info
rmed
of t
rend
s and
bes
t pra
ctic
es a
nd im
plem
ent
as a
ppro
pria
te to
supp
ort t
he d
ivis
ion’
s vis
ion,
mis
sion
, an
d st
rate
gic g
oals
.6.
Cl
early
com
mun
icat
e ce
ntra
l offi
ce fu
nctio
ns a
nd p
oint
s of
cont
act t
o st
reng
then
the
supp
ort a
nd se
rvic
es p
rovi
ded
to sc
hool
s, o
ffice
s, a
nd o
ther
dep
artm
ents
.7.
Re
view
div
isio
n pr
oces
ses,
pol
icie
s, a
nd re
gula
tions
and
re
vise
as n
eces
sary
to in
crea
se o
rgan
izatio
nal e
ffect
iven
ess
and
effic
ienc
y.8.
Co
ntin
ue to
impl
emen
t saf
ety
and
secu
rity
mea
sure
s to
ensu
re th
e sc
hool
div
isio
n is
pre
pare
d to
effe
ctiv
ely
prev
ent
and
resp
ond
to a
ll em
erge
ncie
s tha
t mig
ht a
ffect
stud
ents
an
d st
aff. P
OT
EN
TIA
L IN
DIC
ATO
RS
INC
LUD
E:
per
cent
age
of
scho
ols
acc
red
ited
; p
erce
ptio
ns o
f ce
ntra
l off
ice
sup
po
rt, e
tc.
54

55
SCHOOLS AND CENTERS With 55 elementary schools, 15 middle schools, 11 high schools, one charter school and a number of secondary/post-secondary specialty centers, VBCPS is the largest school division in the region. In terms of the number of students enrolled, VBCPS is ranked No. 4 in the state of Virginia and No. 49 in the United States. In addition to core instructional programs at each of the 86 schools and centers, VBCPS offers students a variety of unique instructional programs to acquire skills and knowledge that support their academic achievement and growth and development as learners, workers and citizens. These programs are available to ensure every child is challenged and supported to reach his or her full potential. ELEMENTARY SCHOOLS
Location Address Phone Alanton Elementary 1441 Stephens Road 757.648.2000 Arrowhead Elementary 5549 Susquehanna Drive 757.648.2040 Bayside Elementary 5649 Bayside Road 757.648.2080 Birdneck Elementary 957 S. Birdneck Road 757.648.2120 Brookwood Elementary 601 S. Lynnhaven Road 757.648.2160 Centerville Elementary 2201 Centerville Turnpike 757.648.2200 Christopher Farms Elementary 2828 Pleasant Acres Drive 757.648.2240 College Park Elementary 1110 Bennington Road 757.648.2280 Cooke Elementary 1501 Mediterranean Avenue 757.648.2320 Corporate Landing Elementary 1590 Corporate Landing Pkwy 757.648.2360 Creeds Elementary 920 Princess Anne Road 757.648.2400 Dey Elementary 1900 N. Great Neck Road 757.648.2440 Diamond Springs Elementary 5225 Learning Circle 757.648.4240 Fairfield Elementary 5428 Providence Road 757.648.2480 Glenwood Elementary 2213 Round Hill Drive 757.648.2520 Green Run Elementary 1200 Green Garden Circle 757.648.2560 Hermitage Elementary 1701 Pleasure House Road 757.648.2600 Holland Elementary 3340 Holland Road 757.648.2640 Indian Lakes Elementary 1240 Homestead Drive 757.648.2680 Kempsville Elementary 570 Kempsville Road 757.648.2720 Kempsville Meadows Elementary 736 Edwin Drive 757.648.2760 King’s Grant Elementary 612 N. Lynnhaven Road 757.648.2800 Kingston Elementary 3532 King's Grant Road 757.648.2840 Landstown Elementary 2212 Recreation Drive 757.648.2880 Linkhorn Park Elementary 977 First Colonial Road 757.648.2920 Luxford Elementary 4808 Haygood Road 757.648.2960 Lynnhaven Elementary 210 Dillon Drive 757.648.3000 Malibu Elementary 3632 Edinburgh Drive 757.648.3040 New Castle Elementary 4136 Dam Neck Road 757.648.3080 Newtown Elementary 5277 Learning Circle 757.648.3120 North Landing Elementary 2929 North Landing Road 757.648.3160 Ocean Lakes Elementary 1616 Upton Drive 757.648.3200 Parkway Elementary 4180 O'Hare Drive 757.648.3280 Pembroke Elementary 4622 Jericho Road 757.648.3320 Pembroke Meadows Elementary 820 Cathedral Drive 757.648.3360 Point O'View Elementary 5400 Parliament Drive 757.648.3440 Princess Anne Elementary 2444 Seaboard Road 757.648.3480 Providence Elementary 4968 Providence Road 757.648.3520 Red Mill Elementary 1860 Sandbridge Road 757.648.3560 Rosemont Elementary 1257 Rosemont Road 757.648.3600 Rosemont Forest Elementary 1716 Grey Friars Chase 757.648.3640 Salem Elementary 3961 Salem Lakes Blvd. 757.648.3680 Seatack Elementary 912 S. Birdneck Road 757.648.3720 Shelton Park Elementary 1700 Shelton Road 757.648.3760 Strawbridge Elementary 2553 Strawbridge Road 757.648.3800 Tallwood Elementary 2025 Kempsville Road 757.648.3840 Thalia Elementary 421 Thalia Road 757.648.3880
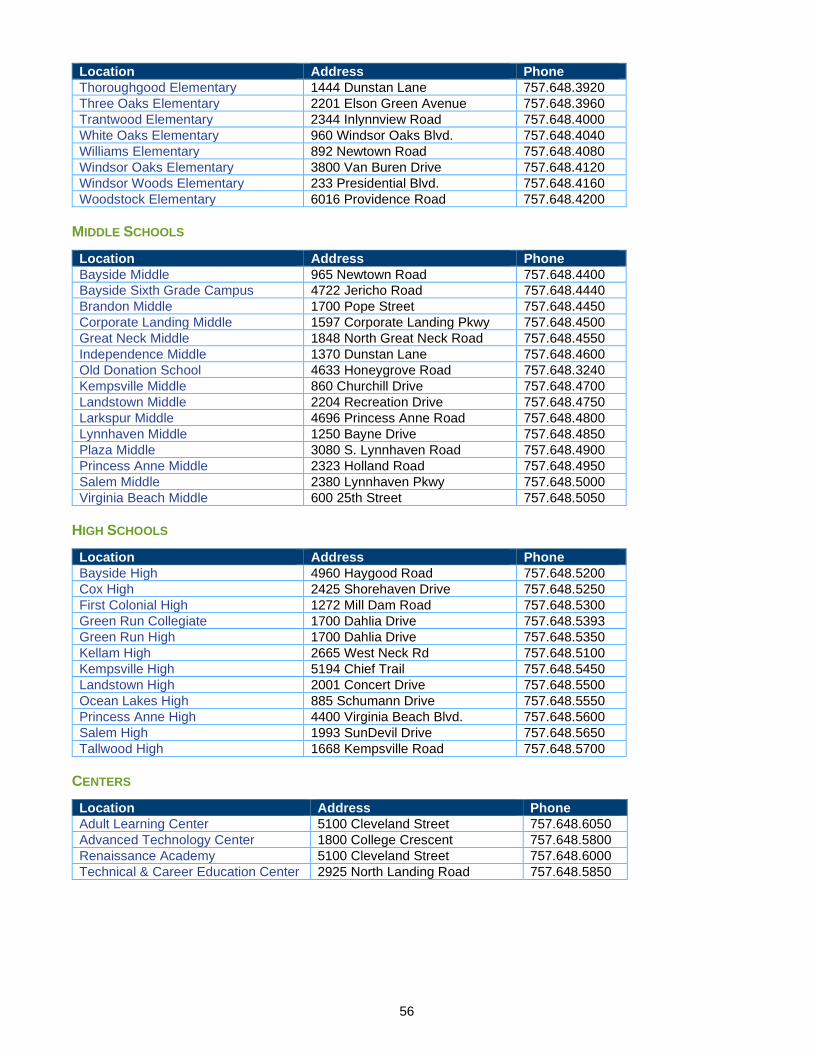
56
Location Address Phone Thoroughgood Elementary 1444 Dunstan Lane 757.648.3920 Three Oaks Elementary 2201 Elson Green Avenue 757.648.3960 Trantwood Elementary 2344 Inlynnview Road 757.648.4000 White Oaks Elementary 960 Windsor Oaks Blvd. 757.648.4040 Williams Elementary 892 Newtown Road 757.648.4080 Windsor Oaks Elementary 3800 Van Buren Drive 757.648.4120 Windsor Woods Elementary 233 Presidential Blvd. 757.648.4160 Woodstock Elementary 6016 Providence Road 757.648.4200
MIDDLE SCHOOLS
Location Address Phone Bayside Middle 965 Newtown Road 757.648.4400 Bayside Sixth Grade Campus 4722 Jericho Road 757.648.4440 Brandon Middle 1700 Pope Street 757.648.4450 Corporate Landing Middle 1597 Corporate Landing Pkwy 757.648.4500 Great Neck Middle 1848 North Great Neck Road 757.648.4550 Independence Middle 1370 Dunstan Lane 757.648.4600 Old Donation School 4633 Honeygrove Road 757.648.3240 Kempsville Middle 860 Churchill Drive 757.648.4700 Landstown Middle 2204 Recreation Drive 757.648.4750 Larkspur Middle 4696 Princess Anne Road 757.648.4800 Lynnhaven Middle 1250 Bayne Drive 757.648.4850 Plaza Middle 3080 S. Lynnhaven Road 757.648.4900 Princess Anne Middle 2323 Holland Road 757.648.4950 Salem Middle 2380 Lynnhaven Pkwy 757.648.5000 Virginia Beach Middle 600 25th Street 757.648.5050
HIGH SCHOOLS
Location Address Phone Bayside High 4960 Haygood Road 757.648.5200 Cox High 2425 Shorehaven Drive 757.648.5250 First Colonial High 1272 Mill Dam Road 757.648.5300 Green Run Collegiate 1700 Dahlia Drive 757.648.5393 Green Run High 1700 Dahlia Drive 757.648.5350 Kellam High 2665 West Neck Rd 757.648.5100 Kempsville High 5194 Chief Trail 757.648.5450 Landstown High 2001 Concert Drive 757.648.5500 Ocean Lakes High 885 Schumann Drive 757.648.5550 Princess Anne High 4400 Virginia Beach Blvd. 757.648.5600 Salem High 1993 SunDevil Drive 757.648.5650 Tallwood High 1668 Kempsville Road 757.648.5700
CENTERS
Location Address Phone Adult Learning Center 5100 Cleveland Street 757.648.6050 Advanced Technology Center 1800 College Crescent 757.648.5800 Renaissance Academy 5100 Cleveland Street 757.648.6000 Technical & Career Education Center 2925 North Landing Road 757.648.5850

Staffing Standards and Guidelines Elementary School
FY 2020/21
The allocations of instructional personnel in Virginia Beach are based on guidelines that meet or exceed the Standards of Quality (SOQ), the accreditation requirements of Virginia, and core class size caps as adopted by the School Board.
NOTE: These standards represent current information and may be subject to change because of the Standards of Accreditation and Standards of Learning implementation requirements and the local operating budget.
These standards do not include teachers for resource programs, itinerant services, special education, Title I, school counselors, instructional technology specialists and library media specialists.
Grade Level [see Note (5)]
Virginia SOQ Accreditation Standard Division-wide Ratios
[See Note (3)]
VBCPS Classroom
Teacher Allocation
VBCPS Target Class Size
Ratio [see Note (1)]
VBCPS Class Size Cap
[see Note (1)] K 24:1 without assistant; no class larger than 29;
with a full-time assistant if ADM is greater than 24:1 25:1 25:1 27
1 24:1 no class larger than 30 25:1 25:1 27 2 24:1 no class larger than 30 25:1 25:1 27 3 24:1 no class larger than 30 25:1 25:1 27 4 25:1 no class larger than 35 26:1 26:1 27 5 25:1 no class larger than 35 26:1 26:1 27
NOTES TO STAFFING STANDARDS:
(1) Schools are monitored throughout the year for compliance with pupil/teacher ratios. An additional teacherwill be added at a grade level when the average class-size of all sections on the grade level reachesthe class-size cap as shown above. In all cases, adequate funds must be available.
(2) Exceptions to student/teacher target ratios can be requested on the basis of existing staff. The writtenrequest for exception must include the program rationale for the exception, as it relates specifically tostudent achievement and/or an objective in the school's strategic plan. A cost analysis will becompleted by the Department of Human Resources after the appropriate administrator in the Departmentof School Leadership receives the request.
(3) Thirty-one elementary schools in Virginia Beach participate in the state K-3 Class-Size Initiative. TheVirginia Department of Education (VDOE) determines the ratio for each school based on thepercentage of students who receive free lunch.
Schools that participate in the Virginia K-3 Class-Size Initiative must maintain a K-3 class-sizeaverage as listed below.
17 schools @ 19 to 1 with no class in K-3 larger than 256 schools @ 18 to 1 with no class in K-3 larger than 244 schools @ 17 to 1 with no class in K-3 larger than 232 schools @ 16 to 1 with no class in K-3 larger than 221 school @ 14 to 1 with no class in K-3 larger than 20
(4) Principals are asked to schedule planning periods for elementary grade levels at the same time eachday, whenever possible, to provide opportunities for collaborative planning and staff development.
57
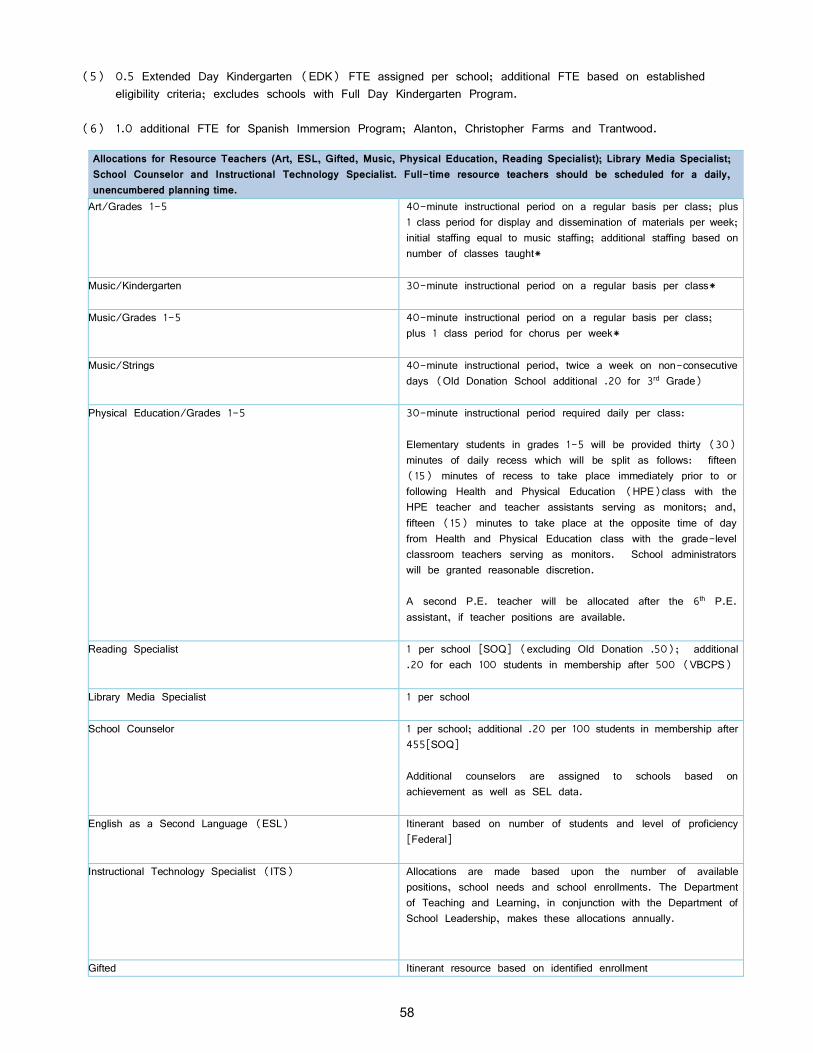
(5) 0.5 Extended Day Kindergarten (EDK) FTE assigned per school; additional FTE based on established
eligibility criteria; excludes schools with Full Day Kindergarten Program.
(6) 1.0 additional FTE for Spanish Immersion Program; Alanton, Christopher Farms and Trantwood.
Allocations for Resource Teachers (Art, ESL, Gifted, Music, Physical Education, Reading Specialist); Library Media Specialist; School Counselor and Instructional Technology Specialist. Full-time resource teachers should be scheduled for a daily, unencumbered planning time. Art/Grades 1-5 40-minute instructional period on a regular basis per class; plus
1 class period for display and dissemination of materials per week; initial staffing equal to music staffing; additional staffing based on number of classes taught*
Music/Kindergarten
30-minute instructional period on a regular basis per class*
Music/Grades 1-5
40-minute instructional period on a regular basis per class; plus 1 class period for chorus per week*
Music/Strings 40-minute instructional period, twice a week on non-consecutive days (Old Donation School additional .20 for 3rd Grade)
Physical Education/Grades 1-5 30-minute instructional period required daily per class: Elementary students in grades 1-5 will be provided thirty (30) minutes of daily recess which will be split as follows: fifteen (15) minutes of recess to take place immediately prior to or following Health and Physical Education (HPE)class with the HPE teacher and teacher assistants serving as monitors; and, fifteen (15) minutes to take place at the opposite time of day from Health and Physical Education class with the grade-level classroom teachers serving as monitors. School administrators will be granted reasonable discretion. A second P.E. teacher will be allocated after the 6th P.E. assistant, if teacher positions are available.
Reading Specialist 1 per school [SOQ] (excluding Old Donation .50); additional .20 for each 100 students in membership after 500 (VBCPS)
Library Media Specialist 1 per school
School Counselor 1 per school; additional .20 per 100 students in membership after 455[SOQ] Additional counselors are assigned to schools based on achievement as well as SEL data.
English as a Second Language (ESL) Itinerant based on number of students and level of proficiency [Federal]
Instructional Technology Specialist (ITS) Allocations are made based upon the number of available positions, school needs and school enrollments. The Department of Teaching and Learning, in conjunction with the Department of School Leadership, makes these allocations annually.
Gifted Itinerant resource based on identified enrollment
58
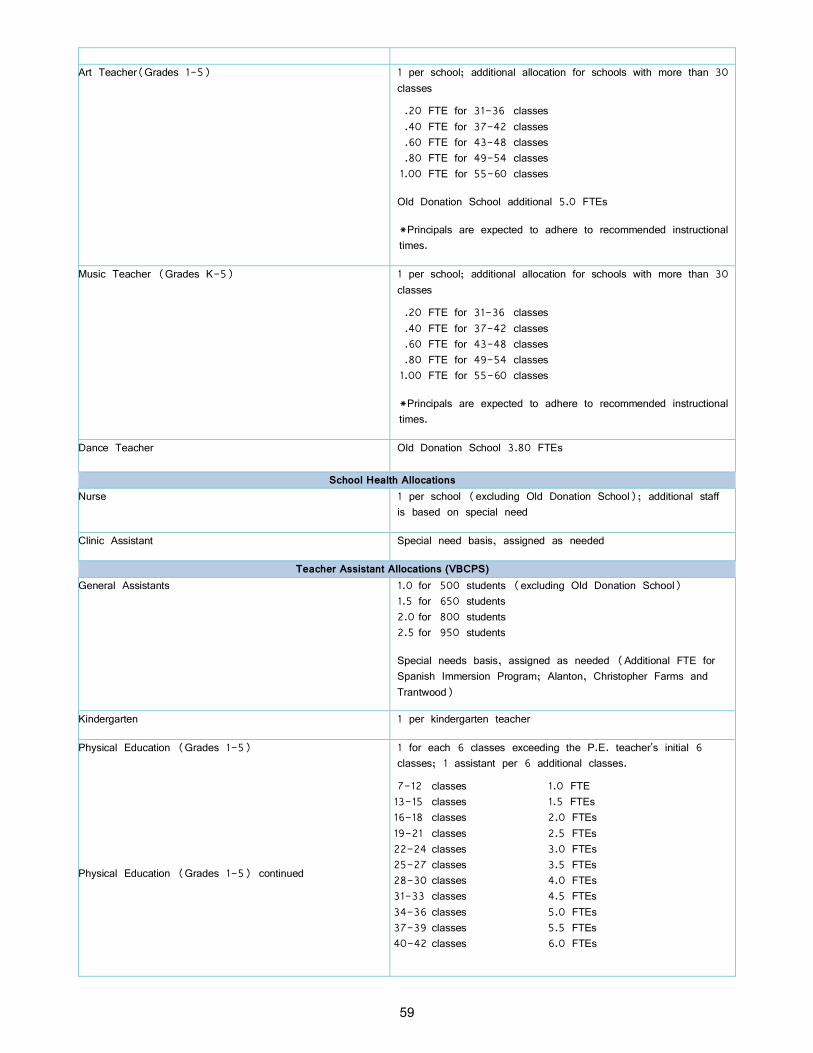
Art Teacher(Grades 1-5) 1 per school; additional allocation for schools with more than 30
classes
.20 FTE for 31-36 classes .40 FTE for 37-42 classes .60 FTE for 43-48 classes .80 FTE for 49-54 classes 1.00 FTE for 55-60 classes
Old Donation School additional 5.0 FTEs *Principals are expected to adhere to recommended instructional times.
Music Teacher (Grades K-5)
1 per school; additional allocation for schools with more than 30 classes
.20 FTE for 31-36 classes .40 FTE for 37-42 classes .60 FTE for 43-48 classes .80 FTE for 49-54 classes 1.00 FTE for 55-60 classes
*Principals are expected to adhere to recommended instructional times.
Dance Teacher
Old Donation School 3.80 FTEs
School Health Allocations Nurse 1 per school (excluding Old Donation School); additional staff
is based on special need
Clinic Assistant Special need basis, assigned as needed
Teacher Assistant Allocations (VBCPS) General Assistants
1.0 for 500 students (excluding Old Donation School) 1.5 for 650 students 2.0 for 800 students 2.5 for 950 students Special needs basis, assigned as needed (Additional FTE for Spanish Immersion Program; Alanton, Christopher Farms and Trantwood)
Kindergarten 1 per kindergarten teacher
Physical Education (Grades 1-5) Physical Education (Grades 1-5) continued
1 for each 6 classes exceeding the P.E. teacher's initial 6 classes; 1 assistant per 6 additional classes.
7-12 classes 1.0 FTE 13-15 classes 1.5 FTEs 16-18 classes 2.0 FTEs 19-21 classes 2.5 FTEs 22-24 classes 3.0 FTEs 25-27 classes 3.5 FTEs 28-30 classes 4.0 FTEs 31-33 classes 4.5 FTEs 34-36 classes 5.0 FTEs 37-39 classes 5.5 FTEs 40-42 classes 6.0 FTEs
59
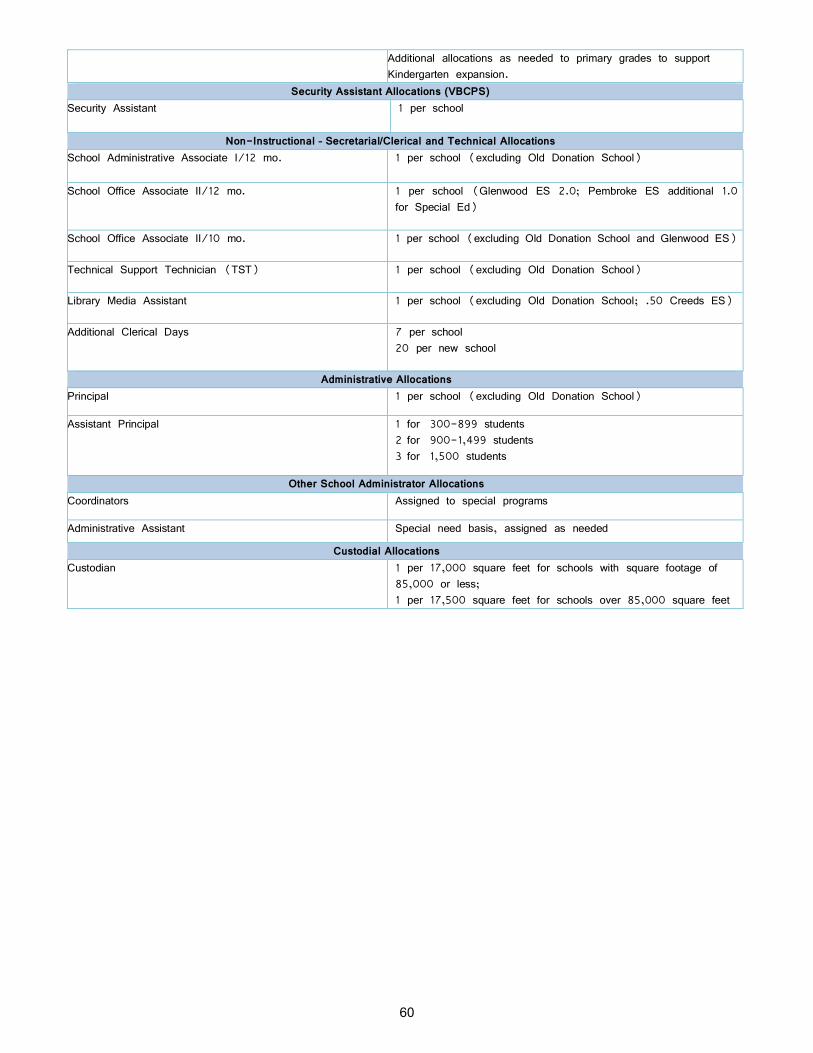
Additional allocations as needed to primary grades to support Kindergarten expansion.
Security Assistant Allocations (VBCPS) Security Assistant 1 per school
Non-Instructional – Secretarial/Clerical and Technical Allocations School Administrative Associate I/12 mo. 1 per school (excluding Old Donation School)
School Office Associate II/12 mo. 1 per school (Glenwood ES 2.0; Pembroke ES additional 1.0 for Special Ed)
School Office Associate II/10 mo. 1 per school (excluding Old Donation School and Glenwood ES)
Technical Support Technician (TST) 1 per school (excluding Old Donation School)
Library Media Assistant 1 per school (excluding Old Donation School; .50 Creeds ES)
Additional Clerical Days 7 per school 20 per new school
Administrative Allocations Principal 1 per school (excluding Old Donation School)
Assistant Principal 1 for 300-899 students 2 for 900-1,499 students 3 for 1,500 students
Other School Administrator Allocations Coordinators Assigned to special programs
Administrative Assistant Special need basis, assigned as needed
Custodial Allocations Custodian 1 per 17,000 square feet for schools with square footage of
85,000 or less; 1 per 17,500 square feet for schools over 85,000 square feet
60

Staffing Standards and Guidelines Middle School
FY 2020/21
The allocations of instructional personnel in Virginia Beach are based on guidelines that meet or exceed the SOQ and the accreditation requirements of Virginia and core class caps as adopted by the School Board.
NOTE: These standards represent current information and may be subject to change because of the Standards of Accreditation and Standards of Learning implementation requirements and the local operating budget.
Grade Level
SOQ Accreditation Standard
Division-wide Ratios
VBCPS Standard
Classroom Teacher
Allocation Middle School (Grades 6-8) 21.25:1(a) Bayside 6th and Bayside MS 20.25:1(a) Grade 6 25:1[SOQ] English 24:1[SOQ]
Courses VBCPS Target Class Size Ratio [see Note (1)]
Allocation Adjustments will be considered as follows: (Additional Teachers Subject to Availability
of Funds) (b) Core Courses-Math, Science, and Social Studies *Bayside 6th and Bayside MS
30:1
22:1
Class size minimum: 24:1 Class size maximum: 35:1 Class size maximum: 24:1
Core Course-English *Bayside 6th and Bayside MS
30:1
22:1
Class size minimum: 24:1 Class size maximum: 35:1 Class size maximum: 24:1
Exploratory Courses and Electives 28:1 Class size minimum: 20:1 Band and chorus: 37:1 for all sections Other electives: 30:1 for all sections
Career and Technical Education Courses
20:1 or number of work stations (c)
Class size minimum: 18:1 Class size maximum: 20:1 or number of work stations (See VDOE listings)
Physical Education 35:1 Class size minimum: 25:1 Class size maximum 35:1 – grade 6 Class size maximum: 37:1 – grades 7 and 8
Distance Learning 25:1 Class size minimum: N/A Class size maximum: 30:1
(a) This standard includes all instructional personnel other than teachers for gifted education, in-school suspension, special education, school counselors, library media specialists, student activity coordinators, reading specialists, math specialists, SOL improvement specialists and instructional technology specialists.
(b) Courses not meeting minimums may be dropped. Waivers may be granted, depending on the course
and the extenuating circumstances.
61
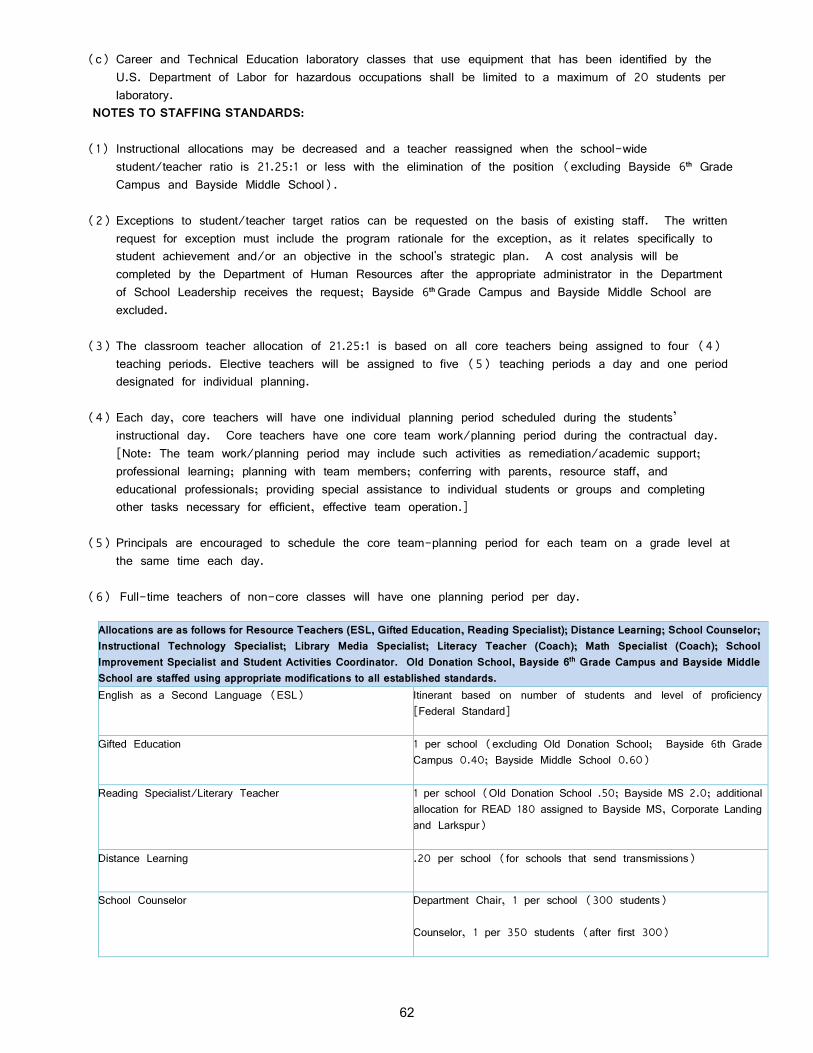
(c) Career and Technical Education laboratory classes that use equipment that has been identified by the U.S. Department of Labor for hazardous occupations shall be limited to a maximum of 20 students per laboratory.
NOTES TO STAFFING STANDARDS: (1) Instructional allocations may be decreased and a teacher reassigned when the school-wide
student/teacher ratio is 21.25:1 or less with the elimination of the position (excluding Bayside 6th Grade Campus and Bayside Middle School).
(2) Exceptions to student/teacher target ratios can be requested on the basis of existing staff. The written
request for exception must include the program rationale for the exception, as it relates specifically to student achievement and/or an objective in the school's strategic plan. A cost analysis will be completed by the Department of Human Resources after the appropriate administrator in the Department of School Leadership receives the request; Bayside 6th Grade Campus and Bayside Middle School are excluded.
(3) The classroom teacher allocation of 21.25:1 is based on all core teachers being assigned to four (4)
teaching periods. Elective teachers will be assigned to five (5) teaching periods a day and one period designated for individual planning.
(4) Each day, core teachers will have one individual planning period scheduled during the students’
instructional day. Core teachers have one core team work/planning period during the contractual day. [Note: The team work/planning period may include such activities as remediation/academic support; professional learning; planning with team members; conferring with parents, resource staff, and educational professionals; providing special assistance to individual students or groups and completing other tasks necessary for efficient, effective team operation.]
(5) Principals are encouraged to schedule the core team-planning period for each team on a grade level at
the same time each day. (6) Full-time teachers of non-core classes will have one planning period per day.
Allocations are as follows for Resource Teachers (ESL, Gifted Education, Reading Specialist); Distance Learning; School Counselor; Instructional Technology Specialist; Library Media Specialist; Literacy Teacher (Coach); Math Specialist (Coach); School Improvement Specialist and Student Activities Coordinator. Old Donation School, Bayside 6th Grade Campus and Bayside Middle School are staffed using appropriate modifications to all established standards. English as a Second Language (ESL)
Itinerant based on number of students and level of proficiency [Federal Standard]
Gifted Education 1 per school (excluding Old Donation School; Bayside 6th Grade Campus 0.40; Bayside Middle School 0.60)
Reading Specialist/Literary Teacher 1 per school (Old Donation School .50; Bayside MS 2.0; additional allocation for READ 180 assigned to Bayside MS, Corporate Landing and Larkspur)
Distance Learning
.20 per school (for schools that send transmissions)
School Counselor
Department Chair, 1 per school (300 students) Counselor, 1 per 350 students (after first 300)
62

Instructional Technology Specialist
Allocations are made based upon the number of available positions, school needs and schools enrollments. The Department of Teaching and Learning, in conjunction with the Department of School Leadership, makes these allocations annually.
Library Media Specialist .50 for < 300 students 1 for 300 students 2 for 1,000 students {SOQ]
Literacy Teacher (Coach) Assigned based on student needs
Math Specialist (Coach)
Assigned based on student needs
School Improvement Specialist (SOL) 1 per school (Bayside 6th Grade Campus .40; Bayside MS .60)
Student Activities Coordinator 1 per school (Bayside 6th Grade Campus .40; Bayside MS .60)
Paraprofessional Allocation In-School Suspension 1 per school (excluding Old Donation School; Bayside 6th Grade
Campus staffed with a TEA)
VBCPS Non-Instructional – Secretarial/Clerical and Technical Allocations School Admin Associate I-12 mo./Office Manager 1 per school
Bookkeeper 1 per school (excluding Bayside 6th Grade Campus)
School Office Associate II-10 mo./ Attendance Secretary
1 per school (excluding Old Donation School)
School Office Associate II-10 mo./ Discipline Secretary School Office Associate II/10 mo. School Office Associate II/10 mo.
1 for 1,000 students (includes Bayside MS) 2 for 1,600 students 3 for 2,200 students
School Office Associate II-12 mo./Data Tech
1 per school (Bayside 6th Grade Campus .40; Bayside MS .60)
School Office Associate II-12 mo./Guidance Secretary
1 per school (Bayside 6th Grade Campus staffed with a TEA)
Library Media Assistant 1 per school (750 enrollment) [SOQ]
Technical Support Technician
1 per school
Additional Clerical Days 21 per school 7 for Old Donation School and Bayside 6th Grade Campus
Security Assistant Allocations (VBCPS) Security Assistant 3 per school; Old Donation School 2.0; Bayside 6th Grade
Campus 2.0; additional staff assigned based on special need
63

Teacher Assistant Allocations Distance Learning 1 per school (excludes Old Donation School and Plaza MS)
General Assistant Old Donation School only
School Health Allocations Nurse 1 per school
Clinic Assistant 1 per school at 1,000 students
This standard will be adjusted and additional assistants assigned based on student needs, usage and programs.
Administrative Allocations Principal 1 per school [SOQ]
Assistant Principal 1 per school [SOQ-1 per 600 students] 2 for 900 students 3 for 1,200 students 4 for 1,800 students 5 for 2,400 students
Dean of Students 1 each for Bayside 6th Grade Campus and Bayside MS
Other School Administrator Allocations Coordinators Assigned to special programs
Administrative Assistant Special needs basis; assigned as needed
Custodial Allocations Custodians 1 per 17,500 square feet
64
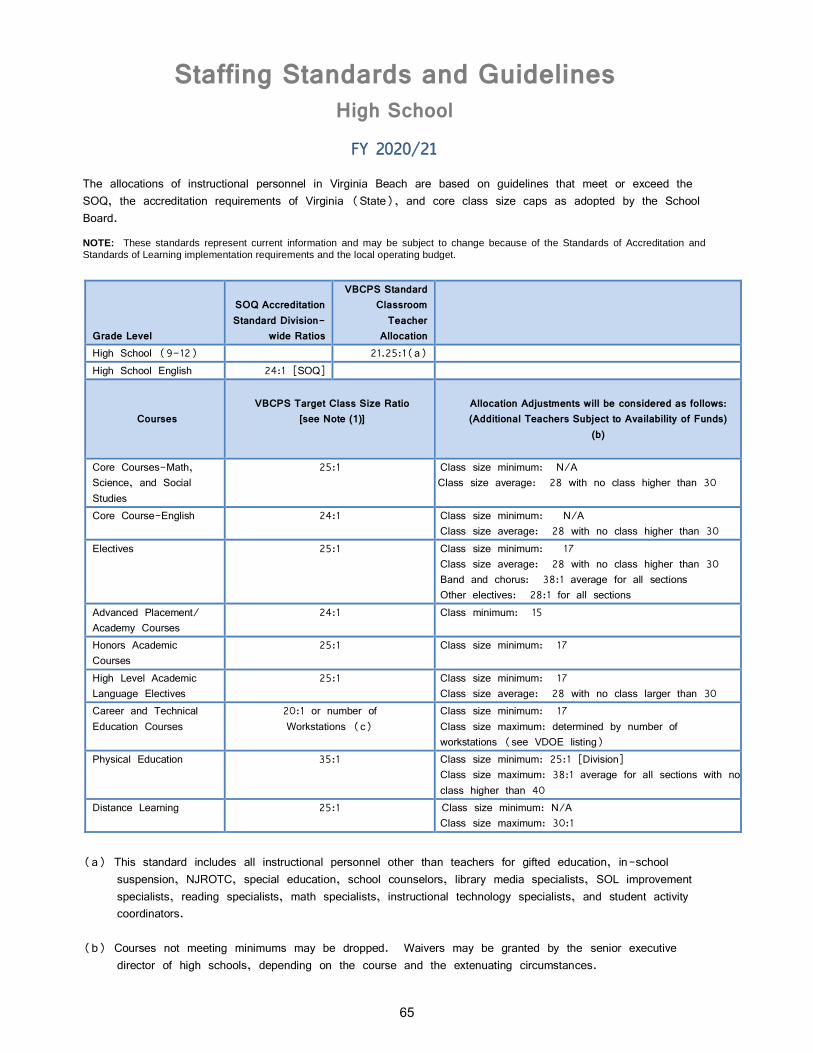
Staffing Standards and Guidelines High School
FY 2020/21 The allocations of instructional personnel in Virginia Beach are based on guidelines that meet or exceed the SOQ, the accreditation requirements of Virginia (State), and core class size caps as adopted by the School Board.
NOTE: These standards represent current information and may be subject to change because of the Standards of Accreditation and Standards of Learning implementation requirements and the local operating budget.
Grade Level
SOQ Accreditation Standard Division-
wide Ratios
VBCPS Standard Classroom
Teacher Allocation
High School (9-12) 21.25:1(a) High School English 24:1 [SOQ]
Courses
VBCPS Target Class Size Ratio
[see Note (1)]
Allocation Adjustments will be considered as follows: (Additional Teachers Subject to Availability of Funds)
(b)
Core Courses-Math, Science, and Social Studies
25:1 Class size minimum: N/A Class size average: 28 with no class higher than 30
Core Course-English 24:1 Class size minimum: N/A Class size average: 28 with no class higher than 30
Electives 25:1 Class size minimum: 17 Class size average: 28 with no class higher than 30 Band and chorus: 38:1 average for all sections Other electives: 28:1 for all sections
Advanced Placement/ Academy Courses
24:1 Class minimum: 15
Honors Academic Courses
25:1 Class size minimum: 17
High Level Academic Language Electives
25:1 Class size minimum: 17 Class size average: 28 with no class larger than 30
Career and Technical Education Courses
20:1 or number of Workstations (c)
Class size minimum: 17 Class size maximum: determined by number of workstations (see VDOE listing)
Physical Education 35:1 Class size minimum: 25:1 [Division] Class size maximum: 38:1 average for all sections with no class higher than 40
Distance Learning 25:1 Class size minimum: N/A Class size maximum: 30:1
(a) This standard includes all instructional personnel other than teachers for gifted education, in-school suspension, NJROTC, special education, school counselors, library media specialists, SOL improvement specialists, reading specialists, math specialists, instructional technology specialists, and student activity coordinators.
(b) Courses not meeting minimums may be dropped. Waivers may be granted by the senior executive
director of high schools, depending on the course and the extenuating circumstances.
65
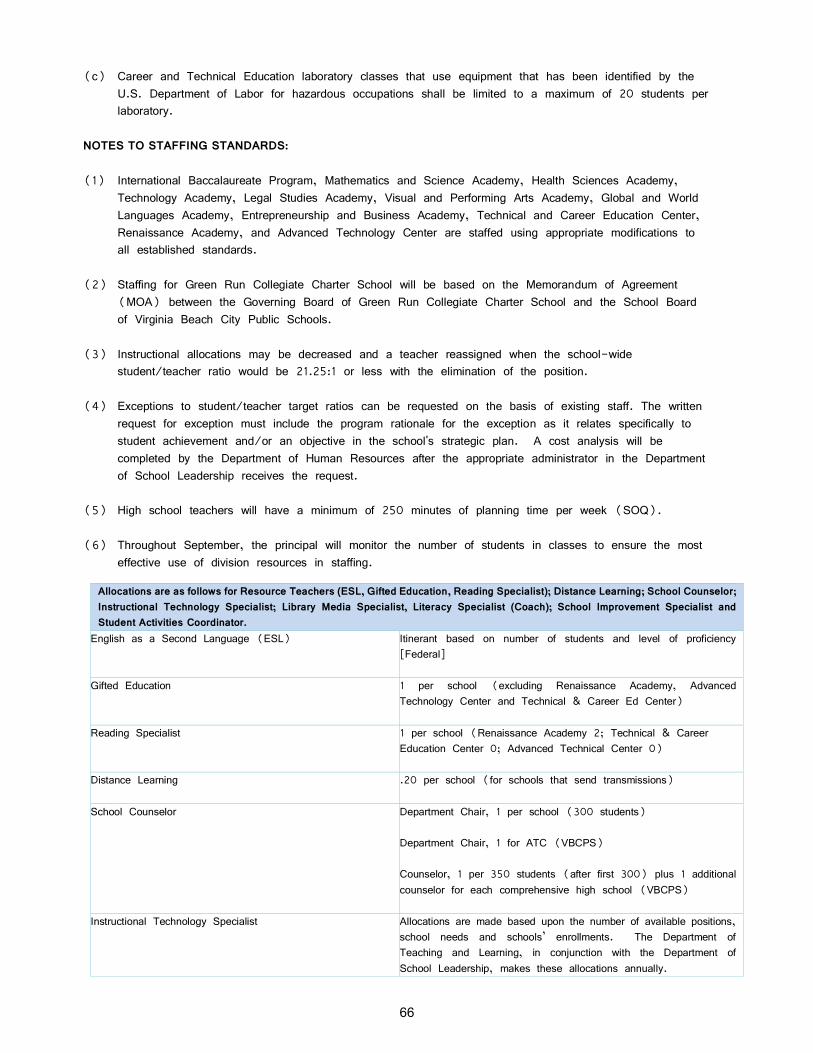
(c) Career and Technical Education laboratory classes that use equipment that has been identified by the
U.S. Department of Labor for hazardous occupations shall be limited to a maximum of 20 students per laboratory.
NOTES TO STAFFING STANDARDS: (1) International Baccalaureate Program, Mathematics and Science Academy, Health Sciences Academy,
Technology Academy, Legal Studies Academy, Visual and Performing Arts Academy, Global and World Languages Academy, Entrepreneurship and Business Academy, Technical and Career Education Center, Renaissance Academy, and Advanced Technology Center are staffed using appropriate modifications to all established standards.
(2) Staffing for Green Run Collegiate Charter School will be based on the Memorandum of Agreement
(MOA) between the Governing Board of Green Run Collegiate Charter School and the School Board of Virginia Beach City Public Schools.
(3) Instructional allocations may be decreased and a teacher reassigned when the school-wide
student/teacher ratio would be 21.25:1 or less with the elimination of the position. (4) Exceptions to student/teacher target ratios can be requested on the basis of existing staff. The written
request for exception must include the program rationale for the exception as it relates specifically to student achievement and/or an objective in the school's strategic plan. A cost analysis will be completed by the Department of Human Resources after the appropriate administrator in the Department of School Leadership receives the request.
(5) High school teachers will have a minimum of 250 minutes of planning time per week (SOQ). (6) Throughout September, the principal will monitor the number of students in classes to ensure the most
effective use of division resources in staffing.
Allocations are as follows for Resource Teachers (ESL, Gifted Education, Reading Specialist); Distance Learning; School Counselor; Instructional Technology Specialist; Library Media Specialist, Literacy Specialist (Coach); School Improvement Specialist and Student Activities Coordinator.
English as a Second Language (ESL)
Itinerant based on number of students and level of proficiency [Federal]
Gifted Education 1 per school (excluding Renaissance Academy, Advanced Technology Center and Technical & Career Ed Center)
Reading Specialist
1 per school (Renaissance Academy 2; Technical & Career Education Center 0; Advanced Technical Center 0)
Distance Learning .20 per school (for schools that send transmissions)
School Counselor Department Chair, 1 per school (300 students) Department Chair, 1 for ATC (VBCPS) Counselor, 1 per 350 students (after first 300) plus 1 additional counselor for each comprehensive high school (VBCPS)
Instructional Technology Specialist Allocations are made based upon the number of available positions, school needs and schools’ enrollments. The Department of Teaching and Learning, in conjunction with the Department of School Leadership, makes these allocations annually.
66

Library Media Specialist 1 per school Additional 1.0 added when enrollment exceeds 1,000. [SOQ]
Literacy Specialist (Coach) Assigned based on student needs
School Improvement Specialist (SOL) 1 per school (Renaissance Academy 2)
Student Activities Coordinator 1 per school with interscholastic program
Paraprofessional Allocations In-School Suspension
1 per school (Renaissance Academy 2)
Driver’s Education Instructor 1 per school
Non-Instructional – Secretarial/Clerical and Technical Allocations (Appropriate modifications to established standards are made for the Advanced Technology Center, Princess Anne High
School (Special Education Wing), Renaissance Academy, and Technical and Career Education Center.) School Admin Office Associate II-12 mo./ Office Manager 1 per school
Bookkeeper 1 per school
School Office Associate II-10 mo./ Attendance Secretary 1 per school
School Office Associate II-10 mo./ Discipline Secretary
1 for 1,000 students
School Office Associate II-12 mo.
1 for 1,600 students [State]; Princess Anne HS Special Ed Wing additional 1.0
School Office Associate II-10 mo. 1 additional for 2,200 students [State]
School Office Associate II-12 mo./ Data Tech 1 per school
School Office Associate II-12 mo./ Guidance 1 per school
Library Media Assistant 1 per school (750 students) [SOQ]
Technical Support Technician 1 per school
Additional Clerical Days 21 per comprehensive high school 30 per comprehensive high school to support student activity coordinators 20 for Renaissance Academy 7 for Adult Learning Center 7 for Advanced Technology Center 7 for Technical and Career Education Center 5 for Green Run Collegiate
Security Assistant Allocations Security Assistant-Day Security Assistant-Night
5 per school; additional staff is based on special needs 1 per school; additional staff is based on special needs
Distance Learning Assistant Allocations Distance Learning 1 per school
67
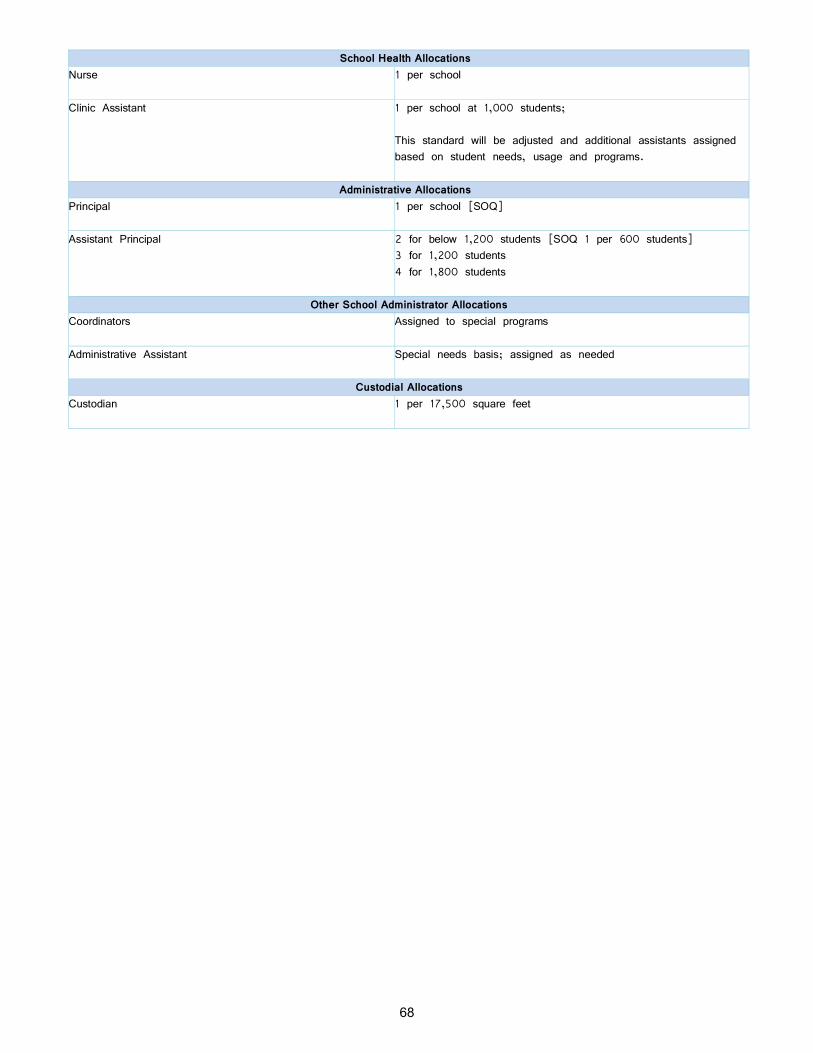
School Health Allocations Nurse 1 per school
Clinic Assistant 1 per school at 1,000 students;
This standard will be adjusted and additional assistants assigned based on student needs, usage and programs.
Administrative Allocations Principal 1 per school [SOQ]
Assistant Principal 2 for below 1,200 students [SOQ 1 per 600 students] 3 for 1,200 students 4 for 1,800 students
Other School Administrator Allocations Coordinators Assigned to special programs
Administrative Assistant Special needs basis; assigned as needed
Custodial Allocations Custodian 1 per 17,500 square feet
68
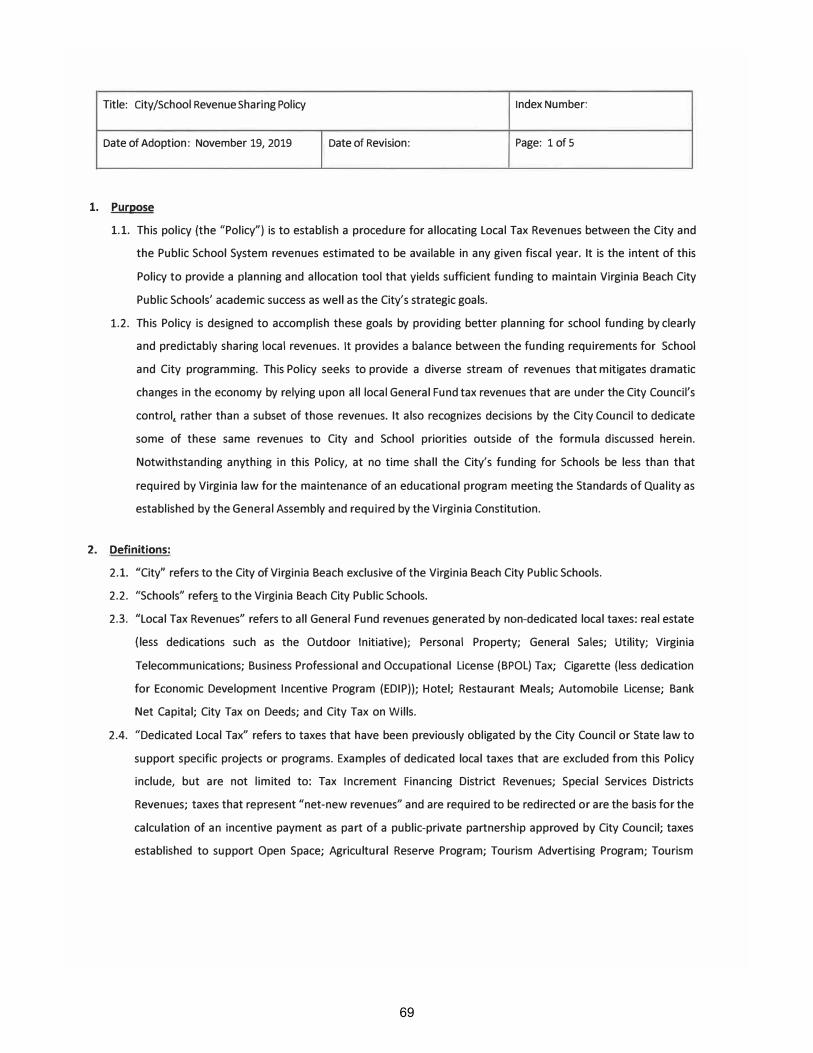
69
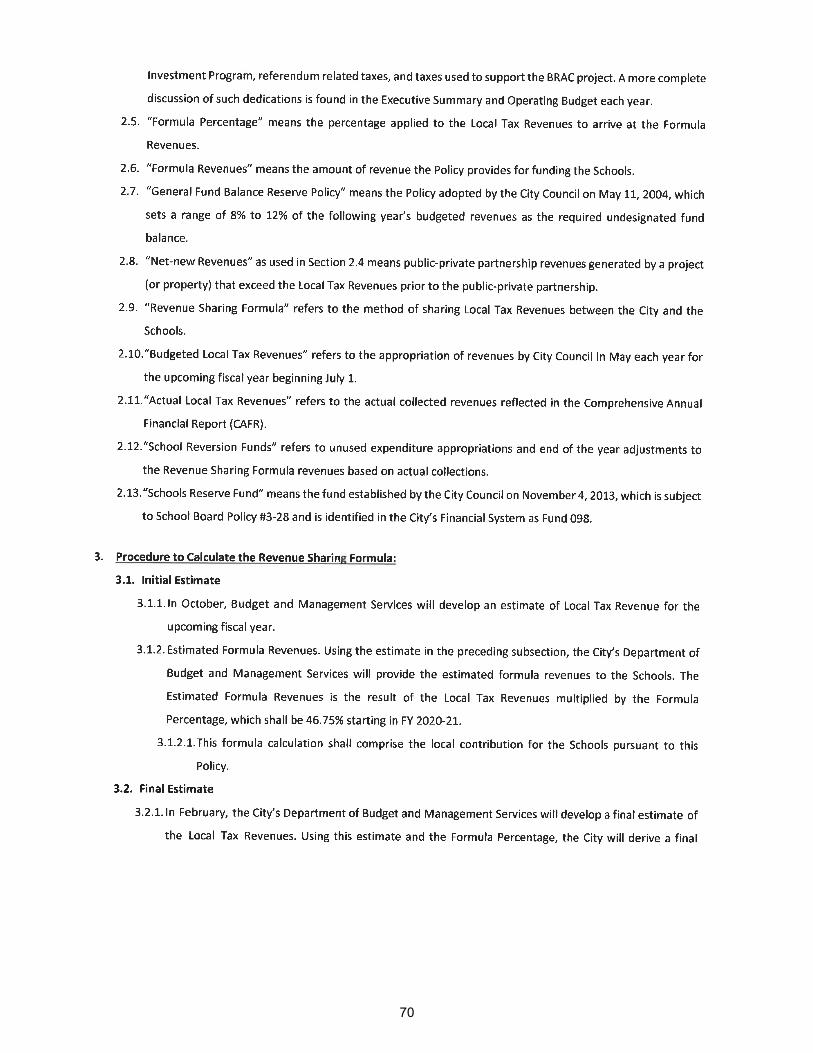
70
71
72

73

Budget Manager and Signature Authority(for FY 2020/21 budget and business transactions)
Updated: February 23, 2021
Fund Cost Center Description Senior Staff Budget Manager Signature Authority115 School Operating Fund
8104 Elementary Classroom Shirann Lewis Shirann Lewis Shirann LewisLinda Hayes Donald RobertsonSterling White
8106 Middle Classroom James Smith James Smith James SmithDonald Robertson
8108 High Classroom Cheryl Woodhouse Cheryl Woodhouse Cheryl WoodhouseDonald Robertson
8110 Special Ed Classroom Kipp Rogers Roni Myers-Daub Kipp RogersMarc Bergin
8112 Tech and Career Ed Classroom Kipp Rogers Sara Lockett Kipp RogersMatthew Delaney Marc Bergin
8114 Gifted Classroom Kipp Rogers Nicole DeVries Kipp RogersMatthew Delaney Marc Bergin
8116 Alternative Education Classroom Cheryl Woodhouse Kay Thomas Cheryl WoodhouseDonald Robertson
8118 Remedial Ed Classroom Kipp Rogers Kipp Rogers Kipp RogersMatthew Delaney Marc Bergin
8120 Summer School Kipp Rogers Alveta Green Kipp RogersAdrian Day Marc Bergin
8122 Summer Slide Kipp Rogers Danielle Colucci Kipp RogersMarc Bergin
8124 Adult Ed Cheryl Woodhouse Joey Phillips Cheryl WoodhouseDonald Robertson
8135 Guidance Kipp Rogers Alveta Green Kipp RogersMarc Bergin
8137 Social Workers Kipp Rogers Alveta Green Kipp RogersDamion Wilson Marc Bergin
8139 Homebound Donald Robertson Michael McGee Michael McGeeDonald Robertson
8145 Teaching and Learning Kipp Rogers Kipp Rogers Kipp RogersDanielle Colucci Marc BerginMatthew Delaney
8147 Instructional Prof Growth and Innovation Donald Robertson Janene Gorham Donald RobertsonMarc Bergin
8149 Diversity, Equity and Inclusion Aaron Spence LaQuiche Parrott Marc BerginAaron Spence
8151 Student Leadership Donald Robertson Michael McGee Michael McGeeDonald Robertson
8153 School Leadership Donald Robertson Shirann Lewis Shirann LewisDonald Robertson Donald Robertson
8155 Student Activities Donald Robertson Michael McGee Michael McGeeDonald Robertson
8157 Special Ed Support Kipp Rogers Roni Myers-Daub Kipp RogersMarc Bergin
8159 Tech and Career Ed Support Kipp Rogers Matthew Delaney Kipp RogersSara Lockett Marc Bergin
8161 Gifted Ed Support Kipp Rogers Kipp Rogers Kipp RogersMatthew Delaney Marc BerginNicole DeVries
8163 Alternative Ed Support Cheryl Woodhouse Kay Thomas Cheryl WoodhouseCheryl Woodhouse Donald Robertson
8165 Library Media Support Kipp Rogers Sharon Shewbridge Kipp RogersMarc Bergin
Each senior staff member is responsible for designated budget categories including departmental spending, line item compliance, and all expenditures through signature authority. This authority may be shared, if so designated; however, delegating signature authority does not nullify the senior staff member's accountability for fiscal responsibility.
74
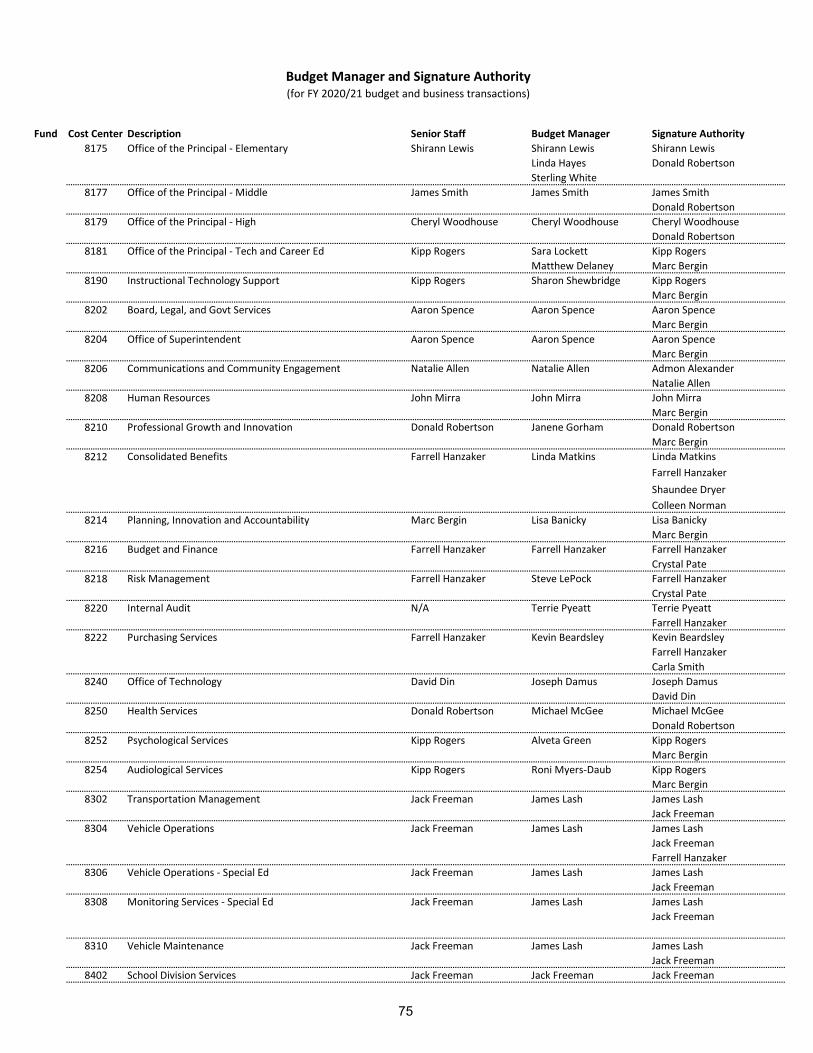
Budget Manager and Signature Authority(for FY 2020/21 budget and business transactions)
Fund Cost Center Description Senior Staff Budget Manager Signature Authority8175 Office of the Principal - Elementary Shirann Lewis Shirann Lewis Shirann Lewis
Linda Hayes Donald RobertsonSterling White
8177 Office of the Principal - Middle James Smith James Smith James SmithDonald Robertson
8179 Office of the Principal - High Cheryl Woodhouse Cheryl Woodhouse Cheryl WoodhouseDonald Robertson
8181 Office of the Principal - Tech and Career Ed Kipp Rogers Sara Lockett Kipp RogersMatthew Delaney Marc Bergin
8190 Instructional Technology Support Kipp Rogers Sharon Shewbridge Kipp RogersMarc Bergin
8202 Board, Legal, and Govt Services Aaron Spence Aaron Spence Aaron SpenceMarc Bergin
8204 Office of Superintendent Aaron Spence Aaron Spence Aaron SpenceMarc Bergin
8206 Communications and Community Engagement Natalie Allen Natalie Allen Admon AlexanderNatalie Allen
8208 Human Resources John Mirra John Mirra John MirraMarc Bergin
8210 Professional Growth and Innovation Donald Robertson Janene Gorham Donald RobertsonMarc Bergin
8212 Consolidated Benefits Farrell Hanzaker Linda Matkins Linda MatkinsFarrell HanzakerShaundee DryerColleen Norman
8214 Planning, Innovation and Accountability Marc Bergin Lisa Banicky Lisa BanickyMarc Bergin
8216 Budget and Finance Farrell Hanzaker Farrell Hanzaker Farrell HanzakerCrystal Pate
8218 Risk Management Farrell Hanzaker Steve LePock Farrell HanzakerCrystal Pate
8220 Internal Audit N/A Terrie Pyeatt Terrie PyeattFarrell Hanzaker
8222 Purchasing Services Farrell Hanzaker Kevin Beardsley Kevin BeardsleyFarrell HanzakerCarla Smith
8240 Office of Technology David Din Joseph Damus Joseph DamusDavid Din
8250 Health Services Donald Robertson Michael McGee Michael McGeeDonald Robertson
8252 Psychological Services Kipp Rogers Alveta Green Kipp RogersMarc Bergin
8254 Audiological Services Kipp Rogers Roni Myers-Daub Kipp RogersMarc Bergin
8302 Transportation Management Jack Freeman James Lash James LashJack Freeman
8304 Vehicle Operations Jack Freeman James Lash James LashJack FreemanFarrell Hanzaker
8306 Vehicle Operations - Special Ed Jack Freeman James Lash James LashJack Freeman
8308 Monitoring Services - Special Ed Jack Freeman James Lash James LashJack Freeman
8310 Vehicle Maintenance Jack Freeman James Lash James LashJack Freeman
8402 School Division Services Jack Freeman Jack Freeman Jack Freeman
75

Budget Manager and Signature Authority(for FY 2020/21 budget and business transactions)
Fund Cost Center Description Senior Staff Budget Manager Signature Authority8404 Facilities and Maintenance Services Jack Freeman Anthony Arnold Anthony Arnold
Eric Woodhouse Eric WoodhouseJack Freeman
8406 Custodial Services Jack Freeman Ed Jones (Acting) Ed Jones (Acting)Jack Freeman
8408 Grounds Services Jack Freeman Frank Fentress Jack FreemanFarrell Hanzaker
8410 Vehicle Services Jack Freeman James Lash James LashJack FreemanFarrell Hanzaker
8412 Safe Schools Jack Freeman Thomas DeMartini Jack FreemanFarrell Hanzaker
8414 Distribution Services Jack Freeman Ed Jones (Acting) Ed Jones (Acting)Jack Freeman
8416 Telecommunications David Din David Din David DinMichael Combs
8435 Technology Maintenance David Din David Din David Din or Michael Combs orJoe Damus
201 Green Run Collegiate Charter SOP Cheryl Woodhouse Rianne Patricio Rianne PatricioCheryl Woodhouse
202 School Allocations SOP Cheryl Woodhouse Rianne Patricio Rianne PatricioCheryl Woodhouse
8104 Elementary Classroom Shirann Lewis Principal PrincipalShirann Lewis
8106 Middle Classroom James Smith Principal PrincipalJames Smith
8108 High Classroom Cheryl Woodhouse Principal PrincipalCheryl Woodhouse
8110 Special Ed Classroom Kipp Rogers Principal PrincipalKipp Rogers
8112 Tech and Career Ed Classroom Kipp Rogers Principal PrincipalKipp Rogers
8114 Gifted Classroom Kipp Rogers Principal PrincipalKipp Rogers
8116 Alternative Education Classroom Cheryl Woodhouse Principal PrincipalCheryl Woodhouse
8161 Gifted Ed Support Kipp Rogers Principal PrincipalKipp Rogers
8165 Library Media Support Kipp Rogers Principal PrincipalKipp Rogers
8175 Office of the Principal - Elementary Shirann Lewis Principal PrincipalShirann Lewis
8177 Office of the Principal - Middle Cheryl Woodhouse Principal PrincipalCheryl Woodhouse
8179 Office of the Principal - High Cheryl Woodhouse Principal PrincipalCheryl Woodhouse
8181 Office of the Principal - Tech and Career Ed Kipp Rogers Principal PrincipalKipp Rogers
8190 Instructional Technology Support Kipp Rogers Principal PrincipalKipp Rogers
203 Instructional Technology SOP David Din David Din David Din andKipp RogersFarrell Hanzaker
204 Athletics SOP Donald Robertson Michael McGee Michael McGeeDonald Robertson
210 Equipment Replacement SRF Farrell Hanzaker Farrell Hanzaker Farrell HanzakerCrystal Pate
76

Budget Manager and Signature Authority(for FY 2020/21 budget and business transactions)
Fund Cost Center Description Senior Staff Budget Manager Signature Authority211 Vending Operations SRF Farrell Hanzaker Farrell Hanzaker Farrell Hanzaker
Crystal Pate212 Cell Tower Tech SRF David Din David Din David Din and
Farrell Hanzaker andMichael Combs
213 Cafeterias SRF Jack Freeman John Smith John SmithJack Freeman
214 Grants SRF702001 Asia Society Confucious Classrooms Network Kipp Rogers Matthew Delaney Kipp Rogers
Marc Bergin702003 Hampton Roads Workforce Council - ALC Cheryl Woodhouse Joey Phillips Cheryl Woodhouse
Donald Robertson702004 Hampton Roads Workforce Council - STEM (OSY) Kipp Rogers Matthew Delaney Kipp Rogers
Sara Lockett Marc Bergin702005 Hampton Roads Workforce Council - STEM (ISY) Kipp Rogers Matthew Delaney Kipp Rogers
Sara Lockett Marc Bergin702008 Network Improvement Community (NIC) Kipp Rogers Matthew Delaney Kipp Rogers
Marc Bergin702009 Project HOPE - City Wide SCA Kipp Rogers Alveta Green Kipp Rogers
Gay Thomas Marc Bergin702014 2Revolutions Marc Bergin Lisa Banicky Lisa Banicky
Marc Bergin702015 Hampton Roads Community Foundation (Piano) Kipp Rogers Nicole DeVries Kipp Rogers
Marc Bergin702013 VBEF School Plus Community Super Grant Donald Robertson Charles Foster James Smith
Donald Robertson702016 Verizon Innovative Lab Kipp Rogers Camille Harmon Kipp Rogers
Marc Bergin703001 Algebra Readiness Kipp Rogers Matthew Delaney Kipp Rogers
Marc Bergin703002 Career & Tech Ed State Equip Alloc Kipp Rogers Matthew Delaney Kipp Rogers
Sara Lockett Marc Bergin703003 Career Switcher Prog Mentor Reimb Donald Robertson Janene Gorham Donald Robertson
Marc Bergin703005 CTE Special State Equip Alloc Kipp Rogers Matthew Delaney Kipp Rogers
Sara Lockett Marc Bergin703006 Dual Enrollment TCC Kipp Rogers Matthew Delaney Kipp Rogers
Sara Lockett Marc Bergin703008 Early Reading Intervention Kipp Rogers Danielle Colucci Kipp Rogers
Marc Bergin703009 General Adult Ed Cheryl Woodhouse Joey Phillips Cheryl Woodhouse
Donald Robertson703010 Green Run Collegiate Charter School Support Cheryl Woodhouse Rianne Patricio Cheryl Woodhouse
Donald Robertson703014 Industry Cert Examinations Kipp Rogers Matthew Delaney Kipp Rogers
Sara Lockett Marc Bergin703015 Industry Cert Examinations STEM-H Kipp Rogers Matthew Delaney Kipp Rogers
Sara Lockett Marc Bergin703016 ISAEP Cheryl Woodhouse Kay Thomas Cheryl Woodhouse
Donald Robertson703017 Jail Education Program Kipp Rogers Roni Myers-Daub Kipp Rogers
Marc Bergin703018 Juvenile Detention Home Donald Robertson Charles Foster James Smith
Donald Robertson703019 National Board Certification Incentive Donald Robertson Janene Gorham Donald Robertson
Marc Bergin703020 New Teacher Mentor Donald Robertson Janene Gorham Donald Robertson
Marc Bergin
77

Budget Manager and Signature Authority(for FY 2020/21 budget and business transactions)
Fund Cost Center Description Senior Staff Budget Manager Signature Authority703021 Positive Behavior Interventions & Supports Kipp Rogers Alveta Green Kipp Rogers
Marc Bergin703023 Project Graduation Kipp Rogers Matthew Delaney Kipp Rogers
Marc Bergin703024 Race to GED Cheryl Woodhouse Joey Phillips Cheryl Woodhouse
Donald Robertson703025 School Security Equipment Jack Freeman Thomas DeMartini Jack Freeman
Marc Bergin703029 Technology Initiative
Non-training David Din David Din David Din Marc Bergin
Training Kipp Rogers Kipp Rogers Kipp RogersMarc Bergin
703033 VA Preschool Initiative Kipp Rogers Danielle Colucci Kipp RogersMarc Bergin
703034 Virginia Middle School Teacher Corps Kipp Rogers Matthew Delaney Kipp RogersMarc Bergin
703035 VPI+ Kipp Rogers Danielle Colucci Kipp RogersMarc Bergin
703036 Workplace Readiness Kipp Rogers Matthew Delaney Kipp RogersSara Lockett Marc Bergin
703038 STEM Competition Team Initiative Kipp Rogers Danielle Colucci Kipp RogersMarc Bergin
703039 Advancing Computer Science Education Kipp Rogers Matthew Delaney Kipp RogersMarc Bergin
703040 GoOpenVA Kipp Rogers Matthew Delaney Kipp RogersMarc Bergin
704001 Adult Basic Education Cheryl Woodhouse Joey Phillips Cheryl WoodhouseDonald Robertson
704002 Carl Perkins Kipp Rogers Matthew Delaney Kipp RogersSara Lockett Marc Bergin
704003 Champions Together - IDEA Kipp Rogers Roni Myers-Daub Roni Myers-DaubKipp Rogers
704006 DoDEA MCASP Operation GRIT Kipp Rogers Alveta Green Kipp RogersMarc Bergin
704011 McKinney Vento Kipp Rogers Alveta Green Kipp RogersGay Thomas Marc Bergin
704013 MyCAA LPN Cheryl Woodhouse Cheryl Woodhouse Cheryl WoodhouseDonald Robertson
704019 Post 9/11 GI Bill Cheryl Woodhouse Cheryl Woodhouse Cheryl WoodhouseDonald Robertson
704020 Preschool - IDEA Section 619 Kipp Rogers Roni Myers-Daub Kipp RogersMarc Bergin
704021 Startalk Kipp Rogers Nicole DeVries Kipp RogersMarc Bergin
704022 Title I Part A Kipp Rogers Danielle Colucci Kipp RogersLaura Silverman Marc Bergin
704023 Title I Part D Subpart 1 Donald Robertson Charles Foster James SmithDonald Robertson
704024 Title I Part D Subpart 2 Cheryl Woodhouse Kay Thomas Cheryl WoodhouseDonald Robertson
704025 Title II Part A Kipp Rogers Danielle Colucci Kipp RogersMarc Bergin
704026 Title III Part A Language Acquisition Kipp Rogers Nicole DeVries Kipp RogersMarc Bergin
704027 Title IV Part A Kipp Rogers Matthew Delaney Kipp RogersMarc Bergin
704028 Title IV Part B 21st CCLC - Lynnhaven ES Kipp Rogers Terri Breaux Kipp RogersNicole DeVries Marc Bergin
78
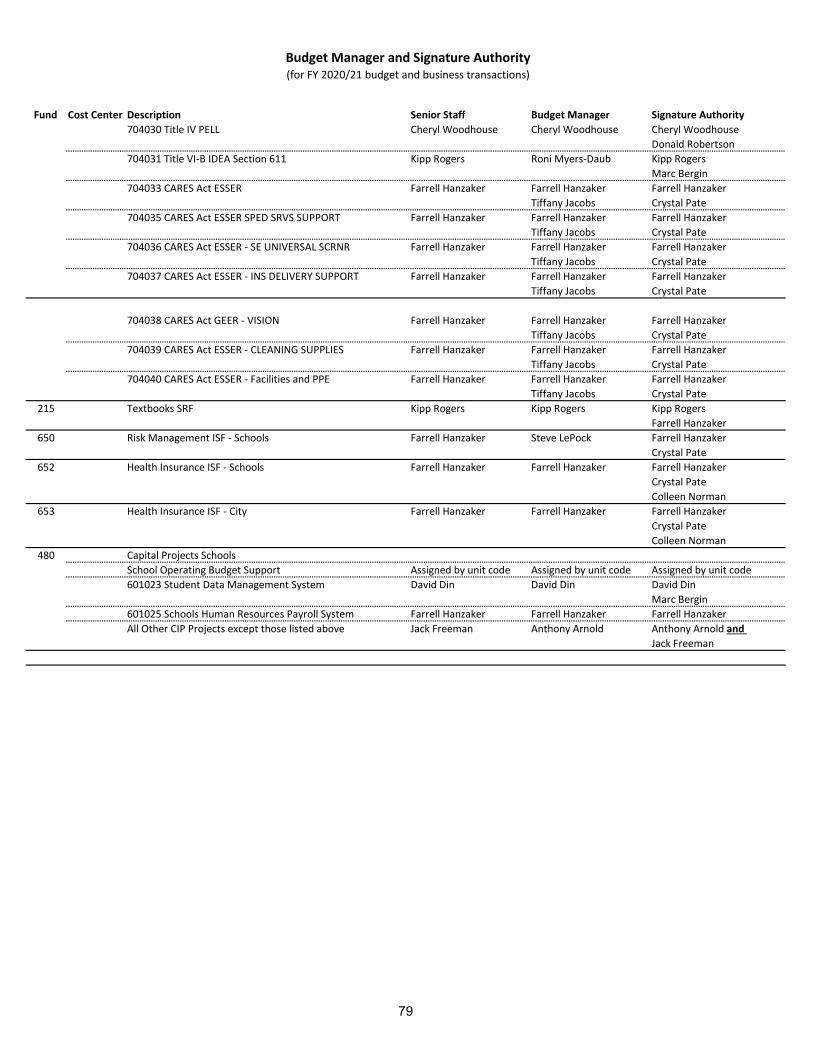
Budget Manager and Signature Authority(for FY 2020/21 budget and business transactions)
Fund Cost Center Description Senior Staff Budget Manager Signature Authority704030 Title IV PELL Cheryl Woodhouse Cheryl Woodhouse Cheryl Woodhouse
Donald Robertson704031 Title VI-B IDEA Section 611 Kipp Rogers Roni Myers-Daub Kipp Rogers
Marc Bergin704033 CARES Act ESSER Farrell Hanzaker Farrell Hanzaker Farrell Hanzaker
Tiffany Jacobs Crystal Pate704035 CARES Act ESSER SPED SRVS SUPPORT Farrell Hanzaker Farrell Hanzaker Farrell Hanzaker
Tiffany Jacobs Crystal Pate704036 CARES Act ESSER - SE UNIVERSAL SCRNR Farrell Hanzaker Farrell Hanzaker Farrell Hanzaker
Tiffany Jacobs Crystal Pate704037 CARES Act ESSER - INS DELIVERY SUPPORT Farrell Hanzaker Farrell Hanzaker Farrell Hanzaker
Tiffany Jacobs Crystal Pate
704038 CARES Act GEER - VISION Farrell Hanzaker Farrell Hanzaker Farrell HanzakerTiffany Jacobs Crystal Pate
704039 CARES Act ESSER - CLEANING SUPPLIES Farrell Hanzaker Farrell Hanzaker Farrell HanzakerTiffany Jacobs Crystal Pate
704040 CARES Act ESSER - Facilities and PPE Farrell Hanzaker Farrell Hanzaker Farrell HanzakerTiffany Jacobs Crystal Pate
215 Textbooks SRF Kipp Rogers Kipp Rogers Kipp RogersFarrell Hanzaker
650 Risk Management ISF - Schools Farrell Hanzaker Steve LePock Farrell HanzakerCrystal Pate
652 Health Insurance ISF - Schools Farrell Hanzaker Farrell Hanzaker Farrell HanzakerCrystal PateColleen Norman
653 Health Insurance ISF - City Farrell Hanzaker Farrell Hanzaker Farrell HanzakerCrystal PateColleen Norman
480 Capital Projects SchoolsSchool Operating Budget Support Assigned by unit code Assigned by unit code Assigned by unit code601023 Student Data Management System David Din David Din David Din
Marc Bergin601025 Schools Human Resources Payroll System Farrell Hanzaker Farrell Hanzaker Farrell HanzakerAll Other CIP Projects except those listed above Jack Freeman Anthony Arnold Anthony Arnold and
Jack Freeman
79
Aaron C. Spence, Ed.D., Superintendent Virginia Beach City Public Schools
2512 George Mason Drive, Virginia Beach, VA 23456-0038
Produced by the Department of Budget and Finance. For further information, please call (757) 263-1066
Notice of Non-Discrimination Policy Virginia Beach City Public Schools does not discriminate on the basis of race, color, religion, national origin, sex, sexual
orientation/gender identity, pregnancy, childbirth or related medical condition, disability, marital status, age, genetic information or veteran status in its programs and activities and provides equal access to the Boy Scouts and other designated youth
groups. School Board policies and regulations (including, but not limited to, Policies 2-33, 4-4, 4-6, 4-43, 5-7, 5-19, 5-20, 5-44, 6-7, 7-48, 7-49, 7-57 and Regulations 4-4.1, 4-4.2, 4-6.1, 4-43.1, 5-44.1, 7-11.1, 7-17.1 and 7-57.1) provide equal access tocourses, programs, counseling services, physical education and athletic, vocational education, instructional materials and
extracurricular activities.
To seek resolution of grievances resulting from alleged discrimination or to report violations of these policies, please contact the Title VI/Title IX Coordinator/Director of Student Leadership at (757) 263-2020, 1413 Laskin Road, Virginia Beach,
Virginia, 23451 (for student complaints) or the Section 504/ADA Coordinator/Chief Human Resources Officer at (757) 263-1133, 2512 George Mason Drive, Municipal Center, Building 6, Virginia Beach, Virginia, 23456 (for employees
or other citizens). Concerns about the application of Section 504 of the Rehabilitation Act should be addressed to the Section 504 Coordinator/Director of Student Support Services at (757) 263-1980, 2512 George Mason Drive, Virginia Beach, Virginia, 23456
or the Section 504 Coordinator at the student’s school. For students who are eligible or suspected of being eligible for special education or related services under IDEA, please contact the Office of Programs for Exceptional Children at (757) 263-2400,
Laskin Road Annex, 1413 Laskin Road, Virginia Beach, Virginia, 23451.
Alternative formats of this publication which may include taped, Braille, or large print materials are available upon request for individuals with disabilities. Call or write the Department of Budget and Finance, Virginia Beach City Public Schools, 2512
George Mason Drive, P.O. Box 6038, Virginia Beach, VA 23456-0038. Telephone 263-1066 (voice); fax 263-1173; 263-1240 (TDD).
vbschools.com your virtual link to Hampton Roads’ largest school system
No part of this publication may be produced or shared in any form without giving specific credit to Virginia Beach City Public Schools.
March 2021