fiscal year 2021 proposed annual operating budget
TRANSCRIPT

Proposed Annual Operating Budget
F I S C A L Y E A R 2 0 2 1

Wade Kapszukiewicz Mayor
[email protected] 419-245-1001fax 419-245-1370One Government CenterSuite 2200Toledo, Ohio 43604
toledo.oh.gov
November 15, 2020
Honorable Council President Matt Cherry and Members of Toledo City Council,
I am pleased to present for your review and consideration the proposed 2021 operating and capital budgets. A budget is always a reflection of our values. This administration values transparency, accountability, equitable investments in all of our neighborhoods, and most importantly, the team that works hard every day to ensure we achieve our goals. Our budget reflects these values.
The proposed budget revenues and expenditures total approximately $839 million with a general fund budget of approximately $283 million. We have proposed a capital improvement to general fund transfer of $11 million and a $23 million reduction in general fund balance, decisions made necessary due to the severe negative budget impact of COVID. We have significant financial challenges to realize the baseline service needs that our constituents should expect and deserve from local government.
The budget and department performance plans align with our five strategic priorities and include performance metrics to ensure continuous improvement in service delivery. Our strategic priorities are:
1. Basic Services: Provide basic services to residents in an effective and efficient manner.
2. Environment: Ensure all of our environmental resources, major equipment, andinfrastructure are efficient and sustainable for long-term viability.
3. Quality Investments: Make investments that improve the quality of life for all peoplewho live, work, and play in Toledo.
4. Customer Service: Employees take pride in providing excellent services to our residents.
5. Workplace Culture: Employees feel connected, valued, and appreciated.
While 2020 has proven to be a challenging year, I am proud of our many accomplishments. Our budget discipline in 2018 and 2019 helped to cushion the blow of 2020. We used our CARES funding to stabilize small businesses and residents by providing grants, rental, and mortgage assistance to our residents as they navigate the financial impact of the pandemic. In addition to short term assistance, our 2020 initiatives, programs, and activities will have long term impact on moving our community forward.
We made significant strides in reprioritizing community development on targeted neighborhood revitalization. Our five year consolidated plan includes Neighborhood Revitalization Strategy Areas (NRSA) that would allow for more flexible use of funding to support development in our neighborhoods that need it most. Our revitalization strategy includes layering ongoing investments such as the LED light conversion, lead pipe replacement and lead remediation, and roads for greater impact. Passage of a new lead ordinance with a strategy for making 23,000 properties lead

safe is being implemented and will continue over several years. We kicked-off the process to develop a comprehensive housing strategy and 10-year action plan that will provide a common vision for housing investment. The strategy will align with our comprehensive plan, which will provide a blueprint for future land use.
This year also saw us turn year’s long blighted properties back into productive use. The site of the old Southwyck Mall, which has been vacant for 10-years, is now home of the new Amazon Distribution Center. After over 10 years of absentee ownership by an out-of-town speculator, the historic buildings at the “four corners” section of downtown were acquired by the Lucas County Land Bank – and now stand ready to be redeveloped as vital mixed-use residential and commercial spaces making way for increased economic development downtown. The 22nd Century committee’s downtown master plan made local control of the Spitzer and Nicholas a priority – in part because they sit on the only corner where all four original buildings still remain. We continue to support small businesses that our critical to job creation and retention, which is critical to our economic vitality. We also introduced legislation to support a disparity study that will provide recommendations on how we can increase procurement opportunities for minority- and women-owned businesses. We are one of five Ohio cities participating in the Forward Cities E3 Accelerator, an initiative to assess the health of our equitable entrepreneurial ecosystem.
We now have the ability to make significant investments in our infrastructure. The passage of Issue 4 allows us to allocate approximately $19 million a year in residential roads. We are also making a $100 million investment in changing every water meter over the next three years. The replacement of 127,000 water meters in the city and Lucas County will allow for more accurate and reliable billing and reduced maintenance cost. The technology gives our customers information at their fingertips and allows them to be able to control their bills. We are transitioning all 28,000 conventional high-pressure sodium bulb streetlights to energy-efficient LEDs and will complete the project by the end of 2021 increasing public safety and saving the city annually on energy cost. We’ve also upgraded our website to make it more accessible to residents, businesses, and visitors. These are not only cost savings measures, but supports our strategic priorities to become a smart city by leveraging technology to increase operational efficiency, share information with the public and improve both the quality of government services and citizen welfare.
This past year has highlighted a need to focus on diversity, equity and inclusion (DEI) in how we deliver services, invest in neighborhoods, and support our workforce. We are engaging experts to assist us with developing a DEI strategy that will focus on recruitment, hiring and promotions, implicit bias training, procurement diversity, equitable deployment of city services, and improved community-police relations. We will become a member of the Government Alliance on Racial Equity, a national network of governments working to achieve racial equity and advance opportunities for all. We are also one of 30 cities across the country selected into the What Works Cities Fiscal Health and Equity Initiative, a Bloomberg Philanthropies program. The initiative will allow us to manage COVID-19’s impact on our city finances while maintain equity as we work to meet the needs of the community.
As we enter the final year of our 2018-2021 strategic plan, we will continue much of the work we have started in 2020. We will have greater financial transparency, as this budget includes resources for a budget and forecasting software that will allow us to align our financial investments to our strategic plan. We are making progress with implementing our data governance strategy and will introduce dashboards for the community to see how well we are doing with delivering services by visiting our new and improved website.
During the 2021 budget planning process, we continued to engage the budget taskforce during bi-weekly meetings to ensure council representation. Keeping with last year’s process, we maintained an additional layer of transparency by ensuring Council members had the opportunity to seek clarity and provide feedback on the strategic plan objectives, potential budget solutions and operational and capital needs prior to submitting the draft budget for your review. We welcome additional input prior to the passage of the budget and will work with you to ensure opportunities for public input through the Council of the Whole meetings scheduled for December.
The 2021 proposed budget aligns with the above data-driven priorities and includes, but are not limited to, the following initiatives to meet our goals and objectives:
1. Address public safety needs by allocating funds for a 31-member police class and a 50-member firefighter class.
2. Identify opportunities to leverage technology and other resources for increased investment in our environment and neighborhood infrastructure with a regional water commission, improving our urban beautification strategy, investment in lead safety, enhanced mowing operations, focused pothole plan and completing a city-wide 28,000 LED conversion by December 2021.
3. Ensure we are attracting and retaining a diverse workforce with the knowledge, skills and abilities to provide excellent services to our residents by investing in training and development, succession planning, recognizing employees for the contributions they make to our community, and aligning our succession planning and internship opportunities with regional workforce development strategies.
4. Following the passage of Issue 4, we are going to invest $19 million dollars to improve residential roads.
We are committed to data-informed decision making regarding service delivery and budget alignment. Strategic priorities and goals will be included in department development plans and the leadership team will be evaluated on how well they are moving the needle to accomplish our goals. This continuous improvement process will ensure we are investing tax dollars in the areas of most concern to our stakeholders.
Strategic Budget
Alignment
Strategic Priority
Data Analysis
Performance Evaluation
Budget Alignment
Service Program
Alignment

We are proud of the list of 2020 accomplishments that not only have regional impact, but also significant impact on our ability to provide high quality services to our residents and workforce. We believe the 2021 proposed budget will allow for greater success and partnership between Council and the administration. As we emerge from COVID, we look forward to hosting hundreds of thousands of visitors in Toledo for the 2021 Solheim Cup. The planning with partners is ongoing to ensure that hotels, small businesses, bars, restaurants and cultural institutions will have a great economic impact. We look forward to putting our best forward. It will be a welcomed event after a challenging year of social distancing and an opportunity to show the world that you will do better in Toledo.
Sincerely,
Wade Kapszukiewicz Mayor

Table of Contents
Mayor’s Letter 2
Elected Officials 7
Organizational Chart 8
Strategic Priorities 9
Key Performance Indicators 19
Budgeting for Equity 20
Community Profile 22
Budget Policies 36
Budget Calendar 50
Budget Summary 51
Departmental Overviews 73
Appendix 184

Cecelia AdamsAt-LargeRetired school administrator
Matt CherryDistrict 2, Council PresidentBusiness Agent
Nick Komives At-LargeCommunity organizer
Theresa Gadus District 3Educational interpreter
Vanice WilliamsDistrict 4Childcare center owner/operator
Katie Moline At-LargeCertified public accountant
Sam Melden District 5Strategic engagement
Tiffany Whitman At-Large University administrator
Chris DelaneyDistrict 6Retired police officer
Cerssandra McPherson At-LargePublic school paraprofessional
City Council
John Hobbs IIIDistrict 1Pastor/coach
Rob Ludeman At-LargeRealtor
7
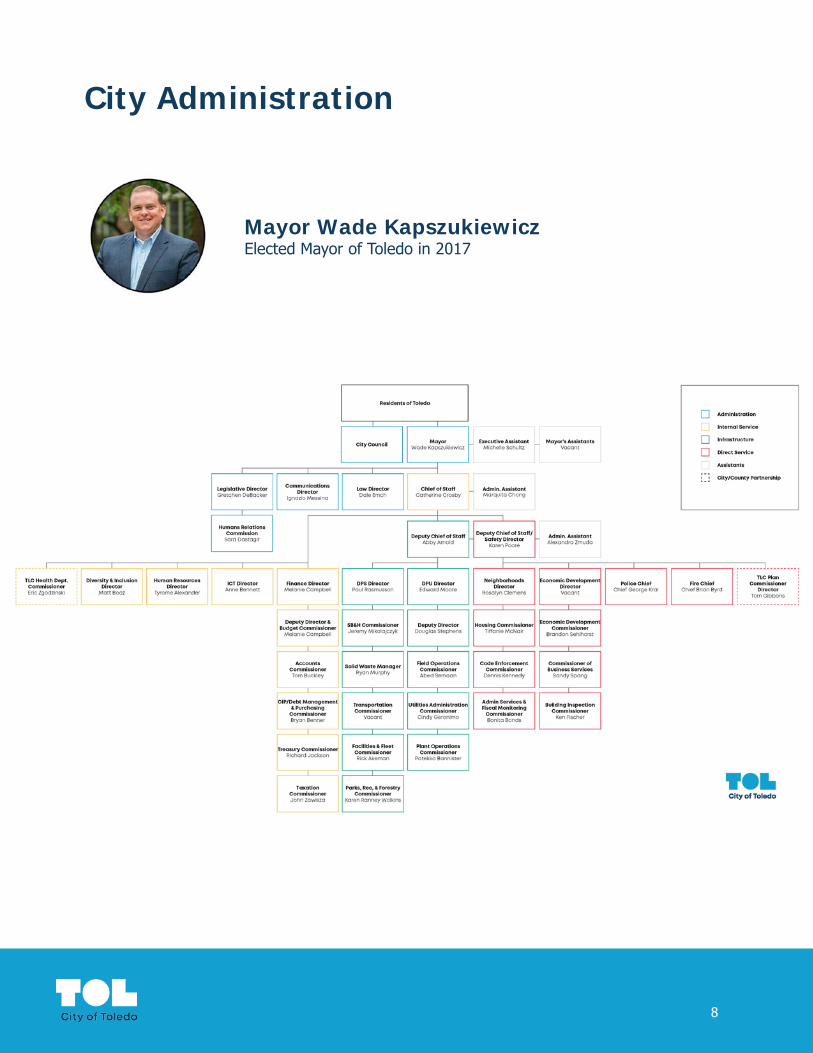
Mayor Wade KapszukiewiczElected Mayor of Toledo in 2017
City Administration
8
Strategic Priorities2 0 2 0
Basic ServicesProvide basic services to residents in an effective and efficient manner.
Objectives1. Ensure prompt response to calls for service across the city.
2. Ensure public safety employees are well-trained, equipped, accountable,transparent, and respectable.
3. Maintain, preserve, and manage City records and information/data withclear, forward-looking plans so that data will be a readily accessibleresource that contributes to community goals.
4. Provide quality city services such as trash collection and solid wastemanagement services that encourage community-wide recycling, reuse,and reduction of waste.
5. Respond to growing service demands through partnerships, innovation,and prioritizing service levels that can be sustained by revenue.
6. Ensure the efficient and effective use of tax-payer dollars in providing Cityservices.
99
9

EnvironmentEnsure all of our environmental resources, major equipment, and infrastructure are efficient and sustainable for long-term viability.
Objectives1. Promote conservation of natural resources by incentivizing and
implementing sustainable practices, energy efficiency, and alternativeenergy solutions.
2. Promote and implement sustainability practices within the organization.
3. Provide education and leadership to ensure natural resources arepreserved for future generations.
4. Maintain reliable utility infrastructure to deliver safe and clean waterto all residents and facilitate wastewater treatment and storm watermanagement.
5. Develop and sustain public infrastructure that services the needs of thecommunity including utilities and water supply.
6. Operate water, sewer, and storm water utilities in a manner which providesfor the health of the community and protects and promotes environmentalsustainability.
10

Quality InvestmentMake investments that improve the quality of life for all people who live, work, and play in Toledo.
ObjectivesNeighborhoods
1. Proactively (re)invest in neighborhoods through support of programs andencourage sustainable community (re)development and rehabilitationpractices that address blight, and preserve and protect historic properties
2. Enforce regulations to ensure home and public spaces are structurallysecure, clean, visually appealing, and promote community well-being.
Economic Development
1. Encourage entrepreneurship with local, minority, and women businessowners by supporting access to counseling, capital, and contractingopportunities.
2. Use investment incentives, policies, and maintain updated marketingmaterials, engagement strategies and development review processes toinvite investment and reinvestment by offering consistent and transparentprocesses to developers.
Quality of Life
1. Provide and support the availability of high-quality, affordablerecreational programming and activities that appeal to people of alldemographics.
2. Develop and sustain public infrastructure that services the needs of thecommunity including roads, parks, green spaces, facilities, and Wi-Fi.
3. Develop inclusive programming to serve the needs and interests of thewhole City, and partner with community organizations to create a fair, justand welcoming community.
4. Provide access to high-quality education/resources to prepare residents,including youth, for career/education beyond a high school diploma.
1111
11

Customer ServiceEmployees take pride in providing excellent service to our residents.
Objectives1. Leverage technology and data throughout the organization for more
efficient service delivery.
2. Identify and implement financial process improvements for greaterefficiency and effective oversight of city financial resources.
3. Facilitate timely and effective communication throughout the publicthrough a variety of media modes.
4. Respond to growing service demands through collaboration, innovation,and outcome management.
Workplace CultureEmployees feel connected, valued, and appreciated.
Objectives1. Attract, develop, motivate, and retain a diverse, high quality, engaged, and
productive workforce.
2. Use data to evaluate service delivery that is evaluated on clearly definedexpectations and focused on service excellence.
3. Facilitate timely and effective communication throughout the organization.
1212
12
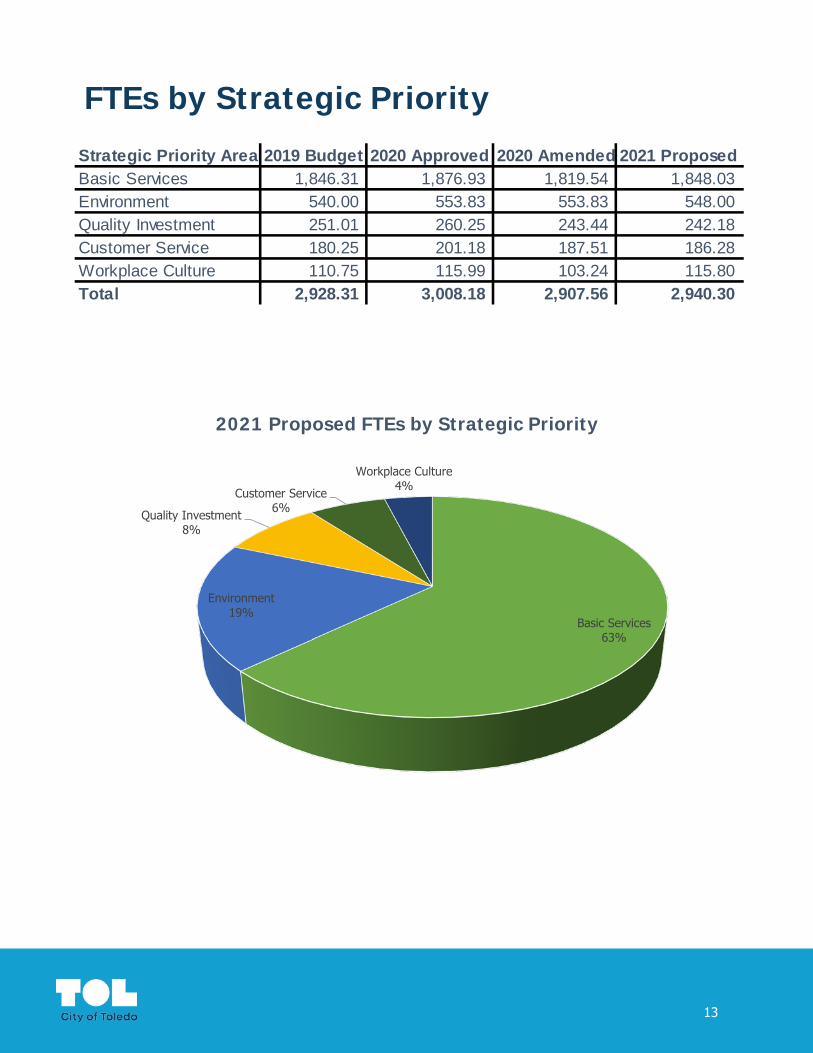
FTEs by Strategic Priority
Strategic Priority Area 2019 Budget 2020 Approved 2020 Amended 2021 ProposedBasic Services 1,846.31 1,876.93 1,819.54 1,848.03 Environment 540.00 553.83 553.83 548.00 Quality Investment 251.01 260.25 243.44 242.18 Customer Service 180.25 201.18 187.51 186.28 Workplace Culture 110.75 115.99 103.24 115.80 Total 2,928.31 3,008.18 2,907.56 2,940.30
Basic Services63%
Environment19%
Quality Investment8%
Customer Service6%
Workplace Culture4%
2021 Proposed FTEs by Strategic Priority
13
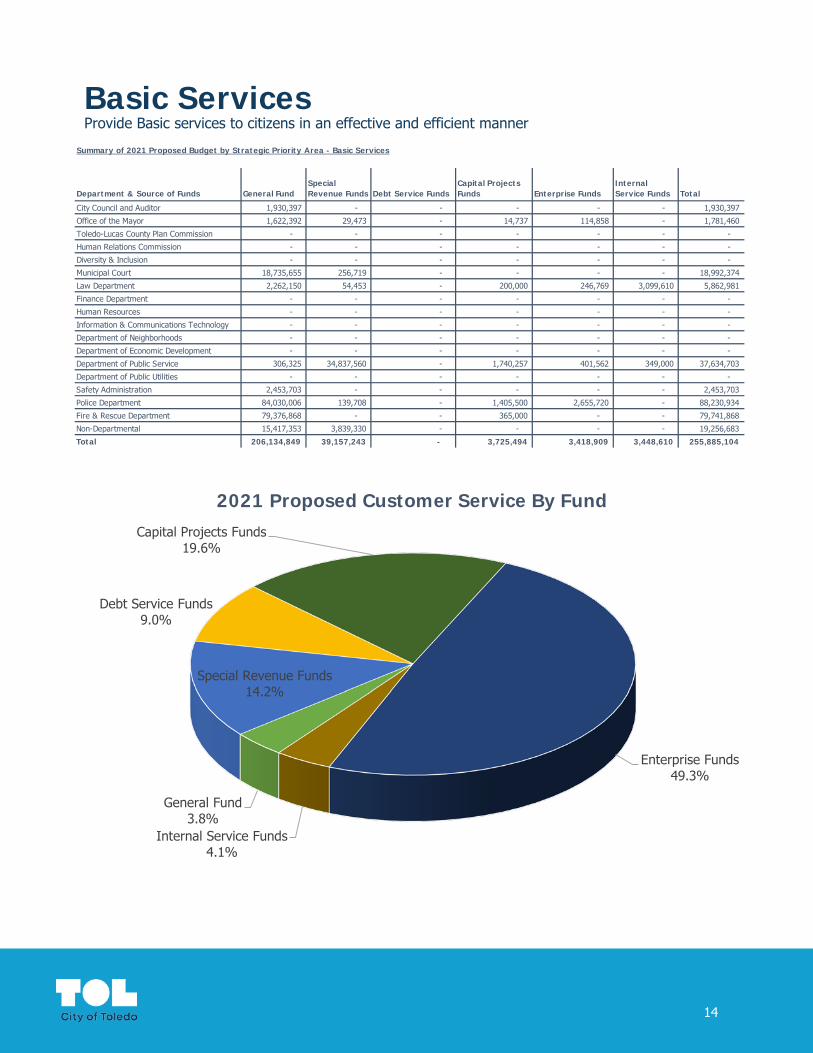
Basic ServicesProvide Basic services to citizens in an effective and efficient manner
Summary of 2021 Proposed Budget by Strategic Priority Area - Basic Services
Department & Source of Funds General FundSpecial Revenue Funds Debt Service Funds
Capital Projects Funds Enterprise Funds
Internal Service Funds Total
City Council and Auditor 1,930,397 - - - - - 1,930,397
Office of the Mayor 1,622,392 29,473 - 14,737 114,858 - 1,781,460
Toledo-Lucas County Plan Commission - - - - - - -
Human Relations Commission - - - - - - -
Diversity & Inclusion - - - - - - -
Municipal Court 18,735,655 256,719 - - - - 18,992,374
Law Department 2,262,150 54,453 - 200,000 246,769 3,099,610 5,862,981
Finance Department - - - - - - -
Human Resources - - - - - - -
Information & Communications Technology - - - - - - -
Department of Neighborhoods - - - - - - -
Department of Economic Development - - - - - - -
Department of Public Service 306,325 34,837,560 - 1,740,257 401,562 349,000 37,634,703
Department of Public Utilities - - - - - - -
Safety Administration 2,453,703 - - - - - 2,453,703
Police Department 84,030,006 139,708 - 1,405,500 2,655,720 - 88,230,934
Fire & Rescue Department 79,376,868 - - 365,000 - - 79,741,868
Non-Departmental 15,417,353 3,839,330 - - - - 19,256,683
Total 206,134,849 39,157,243 - 3,725,494 3,418,909 3,448,610 255,885,104
General Fund3.8%
Special Revenue Funds14.2%
Debt Service Funds9.0%
Capital Projects Funds19.6%
Enterprise Funds49.3%
Internal Service Funds4.1%
2021 Proposed Customer Service By Fund
14

EnvironmentEnsure all our environmental resources, major equipment, and infrastructure are efficient and sustainable for long-term viability
Summary of 2021 Proposed Budget by Strategic Priority Area - Environment
Department & Source of Funds General FundSpecial Revenue Funds Debt Service Funds
Capital Projects Funds Enterprise Funds
Internal Service Funds Total
City Council and Auditor - - - - - - -
Office of the Mayor - - - - - - -
Toledo-Lucas County Plan Commission - - - - - - -
Human Relations Commission - - - - - - -
Diversity & Inclusion - - - - - - -
Municipal Court - - - - - - -
Law Department - - - - - - -
Finance Department - - - - - - -
Human Resources - - - - - - -
Information & Communications Technology - - - - - - -
Department of Neighborhoods - - - - - - -
Department of Economic Development - - - - - - -
Department of Public Service 6,472,693 - - 303,000 - - 6,775,693
Department of Public Utilities 232,188 799,903 - - 180,833,590 - 181,865,681
Safety Administration - - - - - - -
Police Department - - - - - - -
Fire & Rescue Department - - - - - - -
Non-Departmental - - - - - - -
Total 6,704,881 799,903 - 303,000 180,833,590 - 188,641,374
General Fund3.6%
Special Revenue Funds0.4%
Capital Projects Funds0.2%
Enterprise Funds95.9%
2021 Proposed Environment By Fund
15

Quality InvestmentMake investments that improve the quality of life for people who live, work, and play in Toledo
Summary of 2021 Proposed Budget by Strategic Priority Area - Quality Investment
Department & Source of Funds General FundSpecial Revenue Funds Debt Service Funds
Capital Projects Funds Enterprise Funds
Internal Service Funds Total
City Council and Auditor - - - - - - -
Office of the Mayor - - - - - - -
Toledo-Lucas County Plan Commission 912,658 278,341 - 84,164 - - 1,275,164
Human Relations Commission 235,201 - - - - - 235,201
Diversity & Inclusion - - - - - - -
Municipal Court - - - - - - -
Law Department - - - - - - -
Finance Department - - - - - - -
Human Resources - - - - - - -
Information & Communications Technology - - - - - - -
Department of Neighborhoods 3,210,548 20,740,796 - - - - 23,951,344
Department of Economic Development 4,485,614 12,620 - - 71,032 - 4,569,266
Department of Public Service 5,841,589 9,677,796 - 1,701,873 - - 17,221,258
Department of Public Utilities 383,827 1,383,113 - 32,610,562 5,357,372 - 39,734,874
Safety Administration - - - - - - -
Police Department - - - - - - -
Fire & Rescue Department - - - - - - -
Non-Departmental 60,561,005 - - - - - 60,561,005
Total 75,630,442 32,092,667 - 34,396,600 5,428,404 - 147,548,113
General Fund44.9% Special Revenue Funds
24.5%
Capital Projects Funds26.4%
Enterprise Funds4.1%
2021 Proposed Quality Investment By Fund
16

Customer ServiceProvide excellent/outstanding service to our residents and other stakeholders
Summary of 2021 Proposed Budget by Strategic Priority Area - Customer Service
Department & Source of Funds General FundSpecial Revenue Funds Debt Service Funds
Capital Projects Funds Enterprise Funds
Internal Service Funds Total
City Council and Auditor - - - - - - -
Office of the Mayor - - - - - - -
Toledo-Lucas County Plan Commission - - - - - - -
Human Relations Commission - - - - - - -
Diversity & Inclusion - - - - - - -
Municipal Court - - - - - - -
Law Department - - - - - - -
Finance Department 6,796,453 27,193,708 17,247,569 33,561,595 68,233,133 823,416 153,855,874
Human Resources - - - - - - -
Information & Communications Technology 285,317 - - 4,030,000 - 7,138,857 11,454,174
Department of Neighborhoods - - - - - - -
Department of Economic Development - - - - - - -
Department of Public Service - - - - - - -
Department of Public Utilities - - - 15,705 26,349,008 - 26,364,713
Safety Administration - - - - - - -
Police Department - - - - - - -
Fire & Rescue Department - - - - - - -
Non-Departmental 270,505 - - - - - 270,505
Total 7,352,275 27,193,708 17,247,569 37,607,300 94,582,141 7,962,273 191,945,265
General Fund3.8%
Special Revenue Funds14.2%
Debt Service Funds9.0%
Capital Projects Funds19.6%
Enterprise Funds49.3%
Internal Service Funds4.1%
2021 Proposed Customer Service By Fund
17

Workplace CultureCreate a workplace where employees feel connected, valued, appreciated and can take pride in
Summary of 2021 Proposed Budget by Strategic Priority Area - Workplace Culture
Department & Source of Funds General FundSpecial Revenue Funds Debt Service Funds
Capital Projects Funds Enterprise Funds
Internal Service Funds Total
City Council and Auditor - - - - - - -
Office of the Mayor - - - - - - -
Toledo-Lucas County Plan Commission - - - - - - -
Human Relations Commission - - - - - - -
Diversity & Inclusion 1,023,078 83,242 - - 343,242 - 1,449,563
Municipal Court - - - - - - -
Law Department - - - - - - -
Finance Department - - - - - - -
Human Resources 2,110,840 32,792 - - 65,585 49,541,610 51,750,827
Information & Communications Technology - - - - - - -
Department of Neighborhoods - - - - - - -
Department of Economic Development - - - - - - -
Department of Public Service 696,600 - - 2,742,056 - 14,800,253 18,238,909
Department of Public Utilities - - - - - - -
Safety Administration - - - - - - -
Police Department - - - - - - -
Fire & Rescue Department - - - - - - -
Non-Departmental 210,495 - - - - - 210,495
Total 4,041,013 116,034 - 2,742,056 408,827 64,341,863 71,649,794
General Fund5.6%
Special Revenue Funds0.2%
Capital Projects Funds3.8%
Enterprise Funds0.6%
Internal Service Funds89.8%
2021 Proposed Workplace Culture By Fund
18
Key Performance Indicators2021
In 2018, the City of Toledo chose key performance indicators (KPI) from nearly every department to begin to measure different programs and benchmark new goals and objectives.
Over the course of 2019 and 2020, departments have been collecting data and reporting the metrics quarterly. These metrics will help the City of Toledo identify trends, measure our efficiency and effectiveness, and increase transparency.
Each KPI tracks progress towards one of the City’s strategic priorities: Basic Services, Environment, Quality Investment, Customer Service, and Workplace Culture .
The City of Toledo is focused on improving operations and making strategic budgeting decisions to accomplish these objectives, and is committed to communicating progress to the community.
All City departments have reviewed and updated their performance plans for 2021, incorporating key programs, activities and performance indicators.
Please see Appendix for the City of Toledo’s Performance Plan.
19
Budgeting for Equity2021
The 2021 Proposed Budget begins the process of incorporating equity analysis into the budgeting process. Budgeting for equity encourages budget and resource allocation decisions that do not disproportionately harm low-income residents and communities of color.
Throughout 2021 City leadership will be participating in a Bloomberg Philanthropies What Works Cities City Budgeting for Equity and Recovery program, a new effort that will help cities confront budget crisis while strengthening their commitment to equity in the wake of COVID-19. The program will help cities develop and implement plans to drive financial recovery and ensure that their budget crisis do not disproportionately harm low-income residents and communities of color. It will also provide the opportunity for leaders from the 30 participating cities to problem solve with a network of peers and produce a set of tactics for other local leaders to follow.
The Proposed FY 2021 Budget incorporates several key initiatives that align with the City’s strategic plan and promote equity in the community and within the City’s workplace.
20

Budgeting for Equity – Initiatives
Priority Equity and Budget Alignment
Government Alliance on Racial Equity Membership
Consulting services to analyze police data and engage the police and the community in dialogue to develop policy reform recommendations
Investment in budgeting and forecasting solution to improve tracking and reporting on the equitable investment of resources
Gun violence reduction initiative
Lead line replacement
Water afforability plan
Complete disparity study
Supplemental resources to oversee procurement diversity and contract compliance
Improve coordination of neighborhoods investment strategy in low-opportunity neighborhoods
Consulting services to building the City's diversity and inclusion strategy with a focus on attraction, retention, promotion and implicit bias
Supplement resources to investigate diversity and inclusion complaints
Revamp and centralize Americans with Disability Act program and inventory
Basic Services
Environment
Quality Investment
Workplace Culture
21

Community Profile2021
History
Toledo, the county seat of Lucas County, is located in the northwestern part of Ohio. It is part of an area known as the Great Black Swamp. Toledo itself was incorporated in 1836, and it was built on the site of a former stockade, Fort Industry, which was built in 1800. Originally, there were two separate towns named Lawrence and Vistula. When the Wabash and Erie Canal was mapped out in 1836, the location of Toledo was chosen as one of the termination points. The population of the two towns merged and created the new community of Toledo. By 1840, Toledo had a population of 1,322 people.
Although the canal would bring significant business to Toledo, the community still struggled in its early years. Many of its residents suffered from epidemics that spread rapidly in the region in 1838 and 1839. Finally, the canal was opened in 1845. The canal made the town a growing seaport along Lake Erie, and much commerce traveled through Toledo. In addition to the Wabash and Erie Canal, Toledo was connected to the city of Cincinnati by way of the Miami and Erie Canal.
When railroads began to emerge as a key form of transportation in Ohio in the second half of the nineteenth century, Toledo became a destination for a number of railroad lines. In addition, a number of industries began to emerge in the city, including furniture companies, carriage makers, breweries, railroad manufacturing companies, and glass companies, among others. The Libbey Glass Works was located in Toledo and helped to make the community known as the "City of Glass." By 1880, Toledo boasted a population of more than fifty thousand people, making it one of the largest cities in the state.
Many immigrants began to settle in Toledo by the late nineteenth century, attracted to the city because of the factory jobs available and the city's accessibility by rail and by water.
Toledo continued to grow, both in terms of population and industry, in the early twentieth century. Because of its dependence on manufacturing, the city suffered high unemployment rates during the Great Depression. As World War II began, however, Toledo's industries began to focus on wartime production, and unemployment concerns disappeared. Toledo made a unique contribution to the war effort. Home to the Willys-Overland Company, this firm began producing jeeps in 1941.
22

Today
Toledo is the model Midwestern city with a high quality of life and a low cost of living. Toledo is a proud, vibrant and diverse community that is home to a number of first-class academic institutions, a modern public school system, the internationally recognized Toledo Museum of Art, the Toledo Mud Hens, a spectacular zoo, world class parks, premium restaurants, nationally and internationally known products, a reenergized downtown, vibrant neighborhoods, top-rated healthcare systems, and an exemplary public library system.
Area and Location
The City is located in (and is the county seat of) Lucas County in northwestern Ohio, approximately 75 miles east of the Ohio-Indiana border. The City covers an area of 84 square miles and borders generally on Lake Erie and the City of Oregon to the east, the State of Michigan to the north, and Wood County to the south.
Population
The population of Toledo as of the 2010 Census was 287,208 and a 2018 population estimate shows the population is down slightly to 274,975. The median resident age in the 2010 census was 34.2.
0
100,000
200,000
300,000
400,000
500,000
600,000
1970 1980 1990 2000 2010
The populations of the City and the County in the last five Censuses
Toledo Lucas County
23

Housing
The following is current Census information concerning housing in the City, with comparative County and State statistics:
Median Value of Owner-Occupied
Homes% Constructed Prior
to 1940City $79,900 33.40%County $113,100 25.90%State $140,000 20.50%
Income
The City of Toledo had an estimated median household income of $37,100 between 2014 -2018. According to the 2018 population estimates from the U.S. Census Bureau 25.6% were living in poverty.
0 10,000 20,000 30,000 40,000 50,000 60,000
Toledo
Lucas County
Ohio
United States
2014-2018 Median Household Income
Number of Housing Units 2010
Number of Housing Units 2018
City 138,039 138,107 County 202,630 203,073 State 5,127,508 5,188,270
24
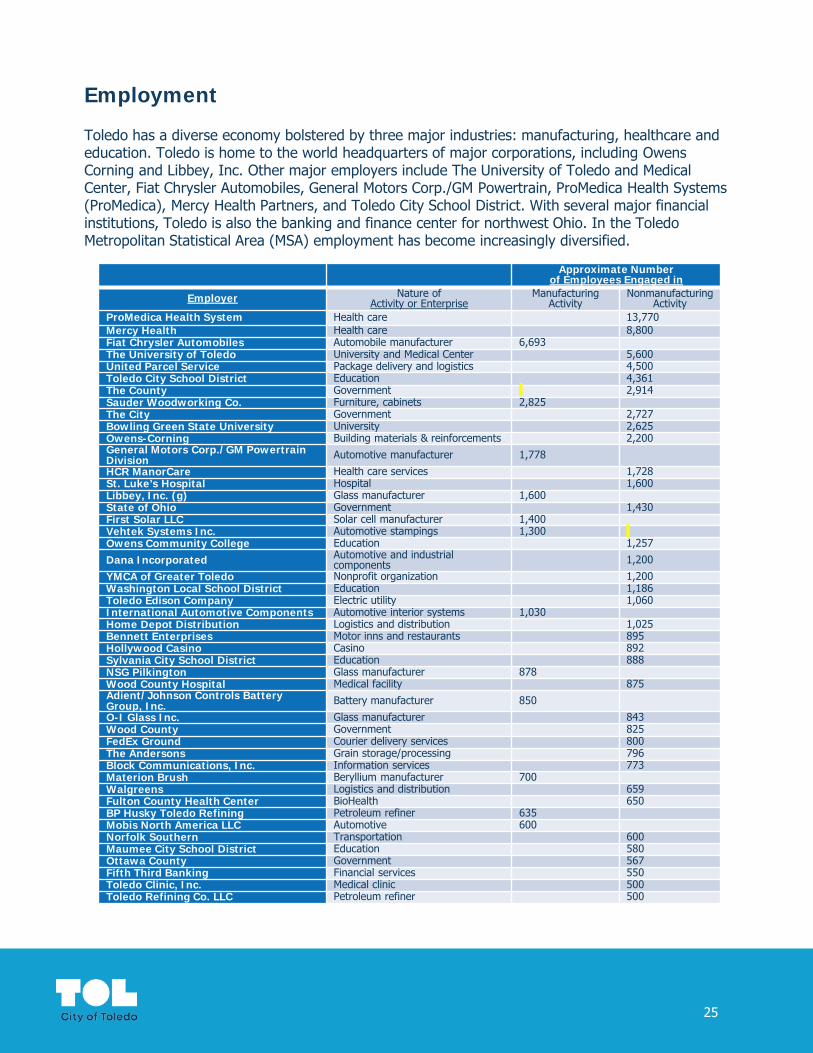
Employment
Toledo has a diverse economy bolstered by three major industries: manufacturing, healthcare and education. Toledo is home to the world headquarters of major corporations, including Owens Corning and Libbey, Inc. Other major employers include The University of Toledo and Medical Center, Fiat Chrysler Automobiles, General Motors Corp./GM Powertrain, ProMedica Health Systems (ProMedica), Mercy Health Partners, and Toledo City School District. With several major financial institutions, Toledo is also the banking and finance center for northwest Ohio. In the Toledo Metropolitan Statistical Area (MSA) employment has become increasingly diversified.
Approximate Number of Employees Engaged in
Employer Nature of Activity or Enterprise
Manufacturing Activity
Nonmanufacturing Activity
ProMedica Health System Health care 13,770Mercy Health Health care 8,800Fiat Chrysler Automobiles Automobile manufacturer 6,693The University of Toledo University and Medical Center 5,600United Parcel Service Package delivery and logistics 4,500Toledo City School District Education 4,361The County Government 2,914Sauder Woodworking Co. Furniture, cabinets 2,825The City Government 2,727Bowling Green State University University 2,625Owens-Corning Building materials & reinforcements 2,200General Motors Corp./GM Powertrain Division Automotive manufacturer 1,778
HCR ManorCare Health care services 1,728St. Luke’s Hospital Hospital 1,600Libbey, Inc. (g) Glass manufacturer 1,600State of Ohio Government 1,430First Solar LLC Solar cell manufacturer 1,400Vehtek Systems Inc. Automotive stampings 1,300Owens Community College Education 1,257
Dana Incorporated Automotive and industrial components 1,200
YMCA of Greater Toledo Nonprofit organization 1,200Washington Local School District Education 1,186Toledo Edison Company Electric utility 1,060International Automotive Components Automotive interior systems 1,030Home Depot Distribution Logistics and distribution 1,025Bennett Enterprises Motor inns and restaurants 895Hollywood Casino Casino 892Sylvania City School District Education 888NSG Pilkington Glass manufacturer 878Wood County Hospital Medical facility 875Adient/Johnson Controls Battery Group, Inc. Battery manufacturer 850
O-I Glass Inc. Glass manufacturer 843Wood County Government 825FedEx Ground Courier delivery services 800The Andersons Grain storage/processing 796Block Communications, Inc. Information services 773Materion Brush Beryllium manufacturer 700Walgreens Logistics and distribution 659Fulton County Health Center BioHealth 650BP Husky Toledo Refining Petroleum refiner 635Mobis North America LLC Automotive 600Norfolk Southern Transportation 600Maumee City School District Education 580Ottawa County Government 567Fifth Third Banking Financial services 550Toledo Clinic, Inc. Medical clinic 500Toledo Refining Co. LLC Petroleum refiner 500
25

Employment (continued)
Employment has steadily increased in Toledo since 2013. Since the start of 2018, the Civilian Labor Force in the City has shown steady increases – indicating more people are looking for permanent work. The City’s unemployment rate has continued to improve in comparison to the State’s average unemployment rate.
100,000
105,000
110,000
115,000
120,000
125,000
130,000
135,000
Mar
-11
Aug-
11
Jan-
12
Jun-
12
Nov
-12
Apr-
13
Sep-
13
Feb-
14
Jul-1
4
Dec
-14
May
-15
Oct
-15
Mar
-16
Aug-
16
Jan-
17
Jun-
17
Nov
-17
Apr-
18
Sep-
18
Feb-
19
Jul-1
9
Dec
-19
May
-20
Wor
kers
Employed Labor Force
0%
2%
4%
6%
8%
10%
12%
14%
16%
18%
Mar
-11
Aug-
11
Jan-
12
Jun-
12
Nov
-12
Apr-
13
Sep-
13
Feb-
14
Jul-1
4
Dec
-14
May
-15
Oct
-15
Mar
-16
Aug-
16
Jan-
17
Jun-
17
Nov
-17
Apr-
18
Sep-
18
Feb-
19
Jul-1
9
Dec
-19
May
-20
Un
empl
oym
ent
Rat
e
Toledo Unemployment Rate Ohio Unemployment Rate
26

Manufacturing
Manufacturing comprises approximately one-fifth of Toledo's economic base. Hundreds of manufacturing facilities are located in the Toledo metropolitan area. This includes automotive assembly and parts production plants as well as glass and solar panel production facilities.
Fiat Chrysler Fiat Chrysler Automobiles, the largest manufacturing employer in the City, has continued to invest in its Toledo Assembly Complex in the City in recent years, including approximately $1.0 billion of investments since 2016. Fiat Chrysler has stated that, with the renovation of the North Plant and the retooling of the South Plant, the company would have the capacity to produce more than 400,000 Wranglers and Gladiators annually at the Toledo Assembly Complex. In December 2019, Fiat Chrysler pledged to invest an additional $160 million in the North Plant for new equipment and training for production of a new electric plug-in hybrid version of the Wrangler JL that is expected to result in the creation of 100 new jobs and an additional $120 million in the South Plant for further retooling for the production of the Gladiator.
General Motors General Motors has completed three new investments in its GM Powertrain Division’s Alexis Road transmission plant in the City in the past seven years – a $667.6 million investment in a 650,000-square-foot addition to prepare the plant for production of 9-speed front-wheel-drive and 10-speed rear-wheel-drive transmissions, a $55.7 million investment to support production of fuel-efficient eight-speed transmissions and six-speed rear-wheel-drive transmissions, and a $30.6 million investment for equipment and tooling to expand capacity for the production of the six-speed rear-wheel drive transmissions – to accommodate General Motors’ product growth and meet increasing demand for those transmissions. With those investments and others, General Motors reports having invested more than $1.0 billion in the plant since 2011.
Dana IncorporatedIn 2017, Dana Incorporated, a Fortune 500 automotive and industrial components manufacturer, completed construction of a $75 million high-tech axle manufacturing facility in the Port Authority’s Overland Industrial Park in the City, converting and tripling the size of an existing 100,000-square-foot warehouse facility on the site to 300,000 square feet. Dana created that facility to support a number of new light-vehicle programs, including the new Jeep Wrangler JL and Gladiator models, that are being manufactured less than three miles away at Fiat Chrysler’s Toledo Assembly Complex, and three other vehicle programs for automakers in the region.
First Solar Manufacturing Facilities In October 2019, First Solar, Inc., the largest manufacturer of photovoltaic modules, completed construction and began operation a new $400 million, one million square-foot manufacturing facility for production of its advanced technology Series 6 thin-film photovoltaic modules. First Solar has a workforce of approximately 500 associates, with an estimated annual payroll of $30 million, at the new facility which is located in nearby Lake Township. The new facility is a few miles from First Solar’s flagship factory in the City of Perrysburg, which is adjacent to the City. In 2017, First Solar invested an additional $175 million to retool that factory, which is the largest solar manufacturing facility in the United States.
27

Healthcare
Residents of Toledo are served by ProMedica Health System and Mercy Health Partners and University of Toledo Medical Center (UTMC). Mercy Health has three hospitals in Toledo, including a state-of-the-art pediatric hospital. Promedica has three hospitals across the Toledo, including Toledo Hospital, Toledo Children’s Hospital, and Wildwood Orthopedic and Spine Hospital. Healthcare has emerged as one of the strongest industries in Toledo. The healthcare industry has grown with the expansion of ProMedica Health System and Mercy Health Partners, the two largest providers in northwest Ohio.
Mercy Health Partners In October 2017, Mercy Health completed construction of a $34 million project to expand facilities on the Mercy St. Vincent Medical Center and Mercy Children’s Hospital campus in the Downtown area of the City. The new 29,000-square-foot, two-story building houses St. Vincent’s and Mercy Children’s emergency services, including a level 1 trauma center and an expanded surgical area with more space for pre-operative and post-operative care.
In 2021, Mercy Health is planning to break ground on a mixed-used development project with NAI Harmon Group along the Cherry Street Corridor. The project will include eighty market rate apartments, five store fronts and office space. Mercy Health Partners is investing more than $1 billion in its current facilities and will maintain more than 2,700 employees. Much of this investment is in the downtown area.
ProMedica Health System In July 2019, ProMedica completed and opened Generations Tower at Toledo Hospital, a $400 million facility with 309 private patient rooms (some of which are replacing double rooms in other parts of its Toledo and Children’s hospitals) on nine floors and an additional four floors that that may be developed as demand requires, on a campus that also includes its similarly-sized Renaissance Tower that opened in 2008. Currently, Continental Development, working with ProMedica, is planning a $100 million development near the campus of Toledo Hospital. The project is expected to include upscale apartments, senior living, memory care and skilled nursing facilities, medical office buildings and facilities and an extended stay hotel. The City has provided certain infrastructure improvements, including an interchange on Interstate 475 in the area of the Hospital campus, which will support the project and additional development by ProMedica. The City also plans to establish a community reinvestment area to enable it to provide a tax incentive for the project.
A more than $50 million renovation of the Steam Plant and Promenade Park for ProMedica Health System’s Headquarters has been completed in downtown Toledo.
University of Toledo Medical CenterIn addition to ProMedica Health Systems and Mercy Health Partners, Toledo is home to the University of Toledo Medical Center (UTMC). The UT Medical Center at the Health Science campus is educating the next generation of physicians, nurses and other health care professionals.
28

Education
Toledo City SchoolsThe Toledo City School District is the principal school system in the City and the fourth largest school system in the State. It serves approximately 22,905 pupils in 52 elementary, junior high and senior high schools and specialized learning centers. The Board of Education of the School District administers an annual operating budget of approximately $413.115 million. The Board currently receives approximately 29.32% of its funding from local sources, including taxes, tuition, fees and interest income, approximately 70.04% of its funding from State sources and approximately 0.64% of its funding from federal sources. In 2014, the District completed the final phases of a major classroom facilities improvement program pursuant to which all of the District’s school facilities have been renovated or replaced.
University of Toledo The University of Toledo is a State university located in the City that traces its origins to 1872. The University reported a total enrollment of more than 20,000 in 2018 and had a Fall 2019 full-time equivalent (FTE) enrollment of 19,782, consisting of 15,568 FTE undergraduate students and 4,214 FTE graduate and professional students, making it the seventh largest of 14 public universities in the State. The University most recently reported that, together with its Medical Center, it has more than 5,600 employees, including 1,500 instructional faculty and 4,100 other staff members. In its fiscal year ended June 30, 2019, the University and its Medical Center reported operating revenues of $746.7 million, including net patient service and other patient services revenue of $369.8 million, net tuition and fees of $196.1 million, grants, gifts and contract revenues of $47.7 million and $133.2 million of auxiliary and other revenues. The University’s 13 colleges attract students from a broad region with a selection of approximately 5,000 course offerings in approximately 300 undergraduate, graduate and professional programs. A study released by the University in May 2017 estimated that the University contributes $1.35 billion annually to the region’s economy from payroll, University purchases and spending by students and visitors and the ripple effect of those expenditures.
Mercy CollegeMercy College of Ohio, a private institution of higher learning with a focus on healthcare education, has its main campus in the City where approximately 1,588 students were enrolled in Fall 2019.
1. City of Toledo Annual Information Statement29

Transportation
The City of Toledo is served by a broad-based transportation system, including well-developed ground, air and water transportation facilities.
Ohio TurnpikeThe Ohio Turnpike (Interstate Highway 80/90) and Interstate Highways 75, 280 and 475, complemented by six State routes and five U.S. highways, provide the City with direct east-west interstate highway access. Amtrak operates four passenger trains through the City along an east-west route. Additional daily interstate passenger service is provided by six privately owned bus lines, including Greyhound, which runs approximately 24 daily bus trips through the City, providing service to Cleveland, Chicago, Detroit, Cincinnati, Columbus and Indianapolis.
TARTAThe Toledo Area Regional Transit Authority (TARTA), a separate political subdivision, provides local bus service in the City and surrounding areas. TARTA is funded in part by property taxes levied on the entire service area, now comprised of the City and five surrounding municipalities and one township, which in recent years has provided approximately $12.8 million for operation and improvement of the system. In April 2018, TARTA acquired a former Goodwill building in the Downtown area of the City for $1.5 million and has renovated and remodeled that building for as a single downtown terminal, replacing its downtown loop bus system, and as its administrative headquarters. That terminal opened in mid-August 2019.
TARTA ridership over the past five years has been as follows:
Toledo Express AirportCommercial airline traffic is provided through the City’s Toledo Express Airport. Toledo Express Airport is a regional airport located approximately 15 miles southwest of the City, and Detroit Metropolitan Airport is located approximately 45 miles north of the City. The City is also served by two smaller, general aviation airports, including the City’s Toledo Executive Airport (formerly known as Metcalf Field), which is located approximately five miles south of the City. The City’s two airports, Toledo Express Airport and Toledo Executive Airport, are both leased to the Port Authority.
1,000,000
1,500,000
2,000,000
2,500,000
3,000,000
3,500,000
2015 2016 2017 2018 2019
Number of Passengers
30

Economic Development
Development activity is occurring across Toledo. Toledo has a strong future for Economic Development based on bringing jobs and investment to downtown, increased development in neighborhoods, continuing investment in necessary infrastructure to add to and maintain jobs, and leveraging City assets including infrastructure, location, transportation, labor force quality and availability.
Major Development Projects:
Toledo Marina Lofts 360 market rate apartments $70 MM investment
Glass City Riverwalk 70 acre new signature riverfront metropark $200 MM investment
Seagate Convention Center & Hotel 216 room dual branded Hilton Garden Inn &
Homewood Suites New 1,000 seat ballroom $94 MM investment; 250 new jobs
Fort Industry Square 115 market rate apartments $26 MM investment 37,000 sq. ft. of ground floor commercial
spaceTriad Business Park Sale of city-owned 53-acre parcel 200 new jobs; $11 MM annual payroll Located in a Joint Economic Development
Zone
Capital Commons Sale of city-owned 48-acre parcel to Estes
Express Lines for expansion 15 new jobs; 193 jobs retained
1411 Campbell Street Redevelopment of former industrial property 45 new jobs; $15 MM capital investment
Amazon Fulfillment Center 300+ Jobs $25MM investment 2.8 MM sq. ft. facility Located in a Municipal Utility District w/
Rossford
Colony Lofts 262 residential units 120 room hotel $50MM investment
Encompass Health 40-bed impatient rehab hospital $25MM investments
31

City Government
The City operates under and is governed by its Charter, which was first adopted by the voters in 1914 and has been and may be amended by the voters from time to time. The City is also subject to certain general State laws applicable to all cities. Under the Ohio Constitution, the City may exercise all powers of local self-government, and police powers to the extent not in conflict with applicable, general laws.
Legislative authority in the City is vested in a 12-member Council. Six members of the Council are elected at-large and six from districts within the City, all for overlapping four-year terms. The Council is authorized to enact ordinances and resolutions relating to City services, tax levies, appropriating and borrowing money, licensing and regulating businesses and trades and other municipal activities. The Council also has authority to fix the compensation of City officers and employees. The Council annually elects one of its members to serve as the President of Council, its presiding officer.
The City’s chief executive and administrative officer is the Mayor, who is elected by the voters to that office for a four-year term. The Mayor has authority to hire certain assistants and, subject to Council approval, to appoint the directors of all City departments, the commissioners of all City divisions, the members of all City boards and commissions and, with the additional approval of the applicable board or commission, the chief administrative officers of agencies under their jurisdiction. The Mayor is responsible for preparing a detailed annual budget estimate, keeping the Council advised of the financial condition and needs of the City and, generally, exercising all other executive and administrative powers and performing such duties as are conferred by the Charter or by State law on mayors or municipal chief executive officers.
The Mayor has authority to introduce ordinances, resolutions and other matters before the Council, to take part in the discussion of all matters coming before the Council, to vote on legislation before the Council if necessary to break a tie vote and to veto any legislation passed by the Council. Vetoes may be overridden by a three-fourths vote of all members of the Council.
32
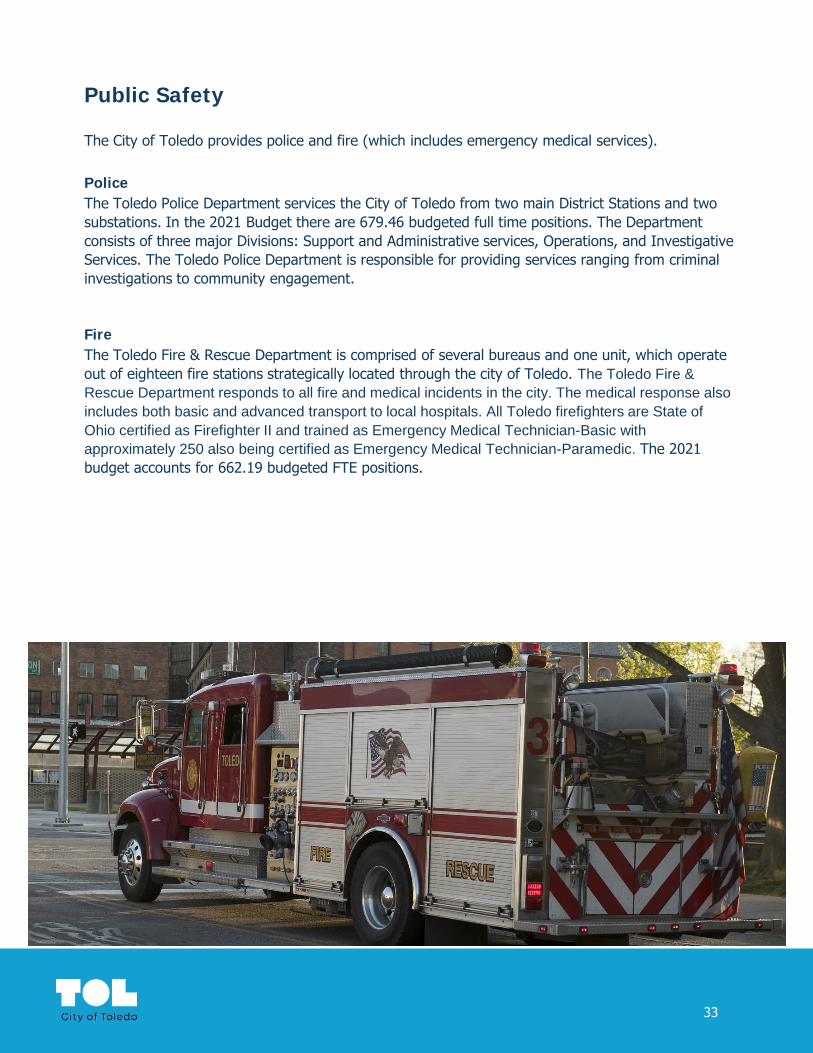
Public Safety
The City of Toledo provides police and fire (which includes emergency medical services).
PoliceThe Toledo Police Department services the City of Toledo from two main District Stations and two substations. In the 2021 Budget there are 679.46 budgeted full time positions. The Department consists of three major Divisions: Support and Administrative services, Operations, and Investigative Services. The Toledo Police Department is responsible for providing services ranging from criminal investigations to community engagement.
Fire The Toledo Fire & Rescue Department is comprised of several bureaus and one unit, which operate out of eighteen fire stations strategically located through the city of Toledo. The Toledo Fire & Rescue Department responds to all fire and medical incidents in the city. The medical response also includes both basic and advanced transport to local hospitals. All Toledo firefighters are State of Ohio certified as Firefighter II and trained as Emergency Medical Technician-Basic with approximately 250 also being certified as Emergency Medical Technician-Paramedic. The 2021 budget accounts for 662.19 budgeted FTE positions.
33

Public Utilities
Water SystemThe City owns and operates a waterworks system (the Water System) as a self-supporting enterprise that in 2019 produced an average of 73.4 million gallons of potable water per day, with a peak flow of 99.6 million gallons per day. Water is drawn from Lake Erie, treated at the City’s Collins Park Water Treatment Plant (the Plant), which has capacity to treat up to 130 million gallons of water per day, and then distributed through approximately 1,165 miles of water lines, over 50% of which were installed before 1930. The estimated replacement cost of the Water System is $1.362 billion. The Water System is operated by the Divisions of Water Treatment and Water Distribution within the City’s Department of Public Utilities.
The Water System is operated by the Division of Water Treatment and the Division of Water Distribution of the City’s Department of Public Utilities.
The Water System is a regional utility that provides water service for approximately 129,500 residential, commercial/institutional and industrial customers in the City and certain surrounding areas in Northwest Ohio and Southeast Michigan. The City estimates that approximately 500,000 people are served by the Water System. In October 2019, after years of discussions and negotiations that resulted in Charter amendment authorizing the establishment of a Regional Water Commission, the City and eight other jurisdictions entered into uniform agreements regarding the supply and purchase of surplus Toledo Water within the region that protect the integrity and capacity of the Water System and balance the interests and concerns of all parties. Those other jurisdictions include Lucas County and Fulton County, the City of Maumee, Monroe County on behalf of the South County Water System, the Northwestern Water and Sewer District, the City of Perrysburg, the City of Sylvania, and the Village of Whitehouse (collectively, the Contracting Communities). The Regional Water Commission provides a participatory vehicle for other jurisdictions with water contracts with the City to participate in the capital and water rate setting process.
Sewer SystemThe City owns and operates a sanitary sewage collection and treatment system (the Sewer System) as a self-supporting enterprise that in 2019 collected and treated approximately 73.4 million gallons of wastewater per day generated by residential, commercial, institutional and industrial users. Wastewater is collected by 1,027 miles of local and interceptor sanitary sewers owned by the City. The local sewers serving 77% of the City’s sewered area carry only sanitary sewage, while the remaining 23% of the City’s sewered area is served by combined local sewers that carry sanitary sewage and, in wet weather, storm water. The local sewers flow into interceptor sewers that carry the wastewater to the City’s Bay View Wastewater Treatment Plant (WWTP) for treatment. The WWTP is unusual in that it includes a traditional plant providing secondary treatment and a wet weather treatment facility (WWTF) providing the equivalent of primary treatment.
The Sewer System collects and treats wastewater flows from approximately 93,500 residential, commercial/institutional and industrial users in the City, and approximately 21,500 users outside the City. It is the sole provider of such service in the City and serves an estimated 320,000 persons.
34

Public Service
The City of Toledo Department of Public Service (DPS) provides a wide variety of services for residents. These services include include green space maintenance, parks maintenance and programming, maintaining tree canopy health and the repair and maintenance of the city’s roadways, which includes pavement restoration work, snow removal, leaf collection and street and alley cleaning. The Department is also responsible for providing and maintaining safe and efficient traffic flow on public roadways under the jurisdiction of the City of Toledo.
The DPS Division of Solid Waste is dedicated to the operation and maintenance of the City of Toledo’s Hoffman Road landfill to support the Lucas County refuse collection operations. The division strives to effectively and efficiently manage the landfill as a city asset by employing technology and innovative practices, as well as working to secure permit modifications and/or alterations that will extend the life of the landfill.
The DPS Division of Streets, Bridges & Harbor provides services to the public include street and alley cleaning and repair, pothole repair, pavement restoration of sewer and water repairs, snow & ice control, leaf collection, housing demolition, bridge operation, bridge and levee maintenance and repair, and harbor related operations.
The DPS Division of Transportation maintains and improves traffic flow on Toledo’s public roadways using accepted design practices and appropriate traffic control devices. The Division provides traffic control planning and design, repairs, replacements and preventative maintenance of street signs, signals and pavement markings throughout Toledo. Additionally, the division works closely with other city departments to assist with the coordination of special events that involve block closures, the evaluation of streets for the installation of speed humps, and the administration of an on-street parking program for mobility-impaired individuals.
The DPS Division of Parks, Recreation and Forestry is responsible for mowing of over 400 boulevards, cul-de-sacs and green spaces across the City. The Division also operates and maintains more than 50 athletic fields and facilities, which include baseball and softball diamonds, tennis courts, municipal pools, the Ottawa Park Ice Rink, and park shelter houses. Parks, Recreation and Forestry provide recreation programming opportunities through special events such as: Skating with Santa; Pumpkin-a-Rama; Eggxtravaganza; Fishing Rodeo; Pitch, Hit & Run; Punt, Pass & Kick and Concerts in the Ottawa Park Amphitheater. The City of Toledo has over 125 parks and facilities.
35

Budget Policies2021
State Law and City Charter Requirements
Detailed provisions for budgeting, tax levies and appropriations are made in the Revised Code. These include a review by county officials at several steps, and a requirement that the subdivision levy a property tax in an amount sufficient, with any other moneys available for the purpose, to pay the debt service on securities payable from property taxes.
The law requires generally that a subdivision prepare, and then adopt after a public hearing, a tax budget approximately six months before the start of the next fiscal year. The tax budget then is presented for review by the county budget commission, comprised of the county auditor, treasurer and prosecuting attorney. However, a county budget commission may waive the requirement for a tax budget and require more limited information. In 2001, the Lucas County Budget Commission voted to waive the requirement for a tax budget for the subdivisions in the County for future Fiscal Years and has since required that alternate tax budget information be provided by the City and those other subdivisions.
Under the current requirements, City budgeting for each Fiscal Year formally begins in the prior July with the preparation and submission to the County Budget Commission of tax budget information. For debt service, the information is to include the net amounts of debt service payable during that Fiscal Year for which property tax levies must be made (after application of estimated receipts from other sources) and the portions of those levies to be inside and outside the ten-mill limitation. That tax budget information is then reviewed by the County Budget Commission.
As part of that review, the County Budget Commission is to determine and approve levies for debt service outside and inside the ten-mill limitation. The Revised Code provides that “if any debt charge is omitted from the budget, the commission shall include it therein.”The County Budget Commission then certifies to the City its action together with the estimate by the County Auditor of the tax rates outside and inside the ten-mill limitation. Thereafter, the Council is to approve the tax levies and certify them to the proper County officials. The approved and certified tax rates are then to be reflected in the tax bills sent to property owners for collection in the following calendar year. Real property taxes are payable in two equal installments, the first usually in January and the second in July.
36
State Law and City Charter Requirements (continued)
The Council adopts a temporary appropriation measure before January 1 of each Fiscal Year, and then, by March 31, a permanent appropriation measure for that Fiscal Year. Although called “permanent,” the annual appropriation measure may be, and often is, amended during the Fiscal Year. Annual appropriations may not exceed the County Budget Commission’s official estimates of resources, and the County Auditor must certify that the City’s appropriation measures do not appropriate moneys in excess of the amounts set forth in those estimates. No money of the City is to be expended unless first appropriated by the Council. The Director of Finance is not to allow the amount set aside for any appropriation to be overdrawn or the amount appropriated for any one item of expense to be drawn upon for any other purpose.
Section 45 of the Charter of the City of Toledo identifies the fiscal year for the City as beginning on the first day of January and requires that on or before the fifteenth day of November of each year, the Mayor must prepare a balanced budget estimate of the expenses of conducting the affairs of the City for the following fiscal year. The estimate is compiled from detailed information obtained from the various City departments. Council is required to pass a balanced budget no later than March 31, 2021.
Prior to passage, the Administration works with City Council to hold budget hearings to review all departmental budget requests and discuss revenue and expenditure assumptions. Information about these budget hearings may be found on the City’s website as they are scheduled. There are opportunities for public input at these meetings.
Debt
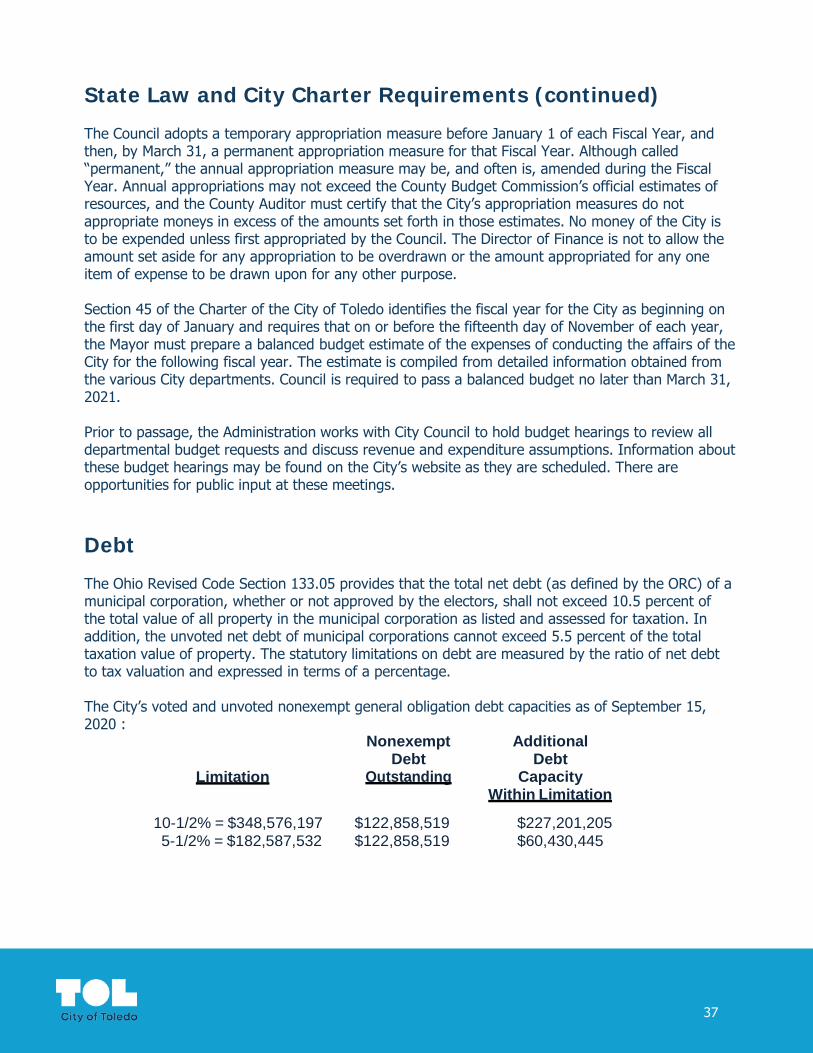
The Ohio Revised Code Section 133.05 provides that the total net debt (as defined by the ORC) of a municipal corporation, whether or not approved by the electors, shall not exceed 10.5 percent of the total value of all property in the municipal corporation as listed and assessed for taxation. In addition, the unvoted net debt of municipal corporations cannot exceed 5.5 percent of the total taxation value of property. The statutory limitations on debt are measured by the ratio of net debt to tax valuation and expressed in terms of a percentage.
The City’s voted and unvoted nonexempt general obligation debt capacities as of September 15, 2020 :
Limitation
Nonexempt Debt
Outstanding
Additional Debt
Capacity Within Limitation
10-1/2% = $348,576,197 $122,858,519 $227,201,205 5-1/2% = $182,587,532 $122,858,519 $60,430,445
37
Investments
Deposits and investments of City funds are governed by the Charter and Chapter 192 of the Toledo Municipal Code, enacted in 1986 and last amended in 2013 (the Investment Policy Ordinance). Under the Investment Policy Ordinance, the Director of Finance has general responsibility for carrying out the banking and investment policies of the City, and the Commissioner of Treasury has the day-to-day responsibility for investing and depositing City funds as they become available. Under the Investment Policy Ordinance and current practices, investments are made in the following categories:
1. Direct obligations of the United States, the Federal Home Loan Banks, the Federal Home LoanMortgage Corporation, Fannie Mae, and the Federal Farm Credit Banks;
2. Certificates of deposit with banking institutions having an office in the State, and demanddeposits with banking institutions having an office in the City, which in each case meet Cityrequirements relating to size, credit rating and collateralization of City deposits;
3. Federally insured certificates of deposit initiated through a reciprocal network of banks orsavings and loan associations that are members of the Federal Deposit Insurance Corporation;
4. Securities of other political subdivisions meeting certain rating requirements;
5. The State Treasurer’s subdivision investment pool (STAR Ohio) created pursuant to Section135.45 of the Revised Code;
6. Federally insured certificates of deposit with banks that are members of the Federal DepositInsurance Corporation initiated through the State Treasurer’s STAR Plus Program. TheInvestment Policy Ordinance also provides specific requirements for diversification ofinvestments.
38

Discretionary Funds
The City may expend, contingent on appropriation, funds for community programs and projects geared toward improving the quality of life for residents. Funding awards range from $1,000 to $25,000.
Organizations must meet the following criteria to be considered for funding:
• The physical location of the organization must be in the Toledo city limits• The organization must be a 501(c)(3) organization under the Internal Revenue Code• The organization must support programs and projects that improve the quality of life of city
residents throughout the year
Organizations that apply for funding are required to submit an application and supporting documentation to outline the scope of services that will be provided using the City funds. All organizations that have previously received funding are required to submit a final report of activities outlining the use of City funds. Failure to submit the final report will disqualify an organization from future funding consideration.
Payment of funds to approved organizations will not be made unless accompanied by a Letter of Understanding that is signed by the Mayor (or his designee) and acknowledged and countersigned by the organization.
Use of Public Funds
Permitted uses of City funds for food, awards, recognitions, travel and expenditures to outside organizations are as follows:• The City may expend funds to host events in appreciation of the City’s workforce and provide
tokens of appreciation to employees to recognize new hires, years of service and retirements.• The City may expend funds to provide beverages to employees, volunteer workers, elected
officials and business guests during regular working hours and events that require public participation.
• The City may expend funds to provide meals to employees, volunteer workers and electedofficials for work conducted during normal meal times.
• The City may expend funds for ceremonial activities as described in Administrative Policy andProcedure #21-Ceremonial Activities.
• The City may expend funds for awards, prizes and other recognitions to employees or outsideparties in association with fundraising efforts, events to raise awareness and other events.
• The City may host and expend funds for Wellness Luncheons to provide education to employeesin an effort to reduce the City’s health care costs.
• The City may expend funds to outside organizations where a written agreement between the Cityand such organization has been executed.
• Travel expenditures are authorized under the terms and conditions outlined in AdministrativePolicy and Procedure #4-Travel Allowance.
39

Basis of Accounting
Governmental Funds use the modified accrual basis of accounting. Under the modified accrual basis, revenue is recorded in the fiscal year in which the resources are measurable and become available. Available means that the resources will be collected within the current fiscal year or are expected to be collected soon enough thereafter to be used to pay liabilities for the current fiscal year. Under the modified accrual basis, the following revenue sources are considered to be both measurable and available at year end: income tax, state-levied local shared taxes (including gasoline taxes, local government funds and permissive taxes), fines and forfeitures, licenses and permits, interest, grants and rentals. Expenditures are recognized under the modified accrual basis of accounting when the related fund liability is incurred, if measurable.
The financial statements of the proprietary funds are reflected on the accrual basis of accounting, where the revenues are recorded when earned and expenses are recorded as incurred.
Budget Basis vs. Generally Accepted Accounting Principles (GAAP)The budget is adopted on a basis consistent with generally accepted accounting principles, except for certain items that are adjusted on the accounting system at fiscal year-end. This allows City departments to monitor their budgets throughout the year through reports generated by the City’s accounting system. The differences between the budgetary basis and GAAP include:
- Principal payments on outstanding debt in the enterprise funds are expensed for budgetary purposed instead of as an adjustment to the long-term liability on the balance sheet
- Capital outlay in the enterprise funds is expensed for budgetary purposes instead of recorded as an adjustment to capital assets on the balance sheet
- Compensated absences in the enterprise funds are not expensed for budgetary purposes. GAAP requires compensated absences to be accrued when earned by employees
- Pension and Other Post-Employment Benefits (OPEB) in the enterprise funds are expensed for budgetary purposes when paid. GAAP requires pension and OPEB to be accrued when earned by employees
- Debt issuances in the enterprise funds are recorded as revenue for budgetary purposes instead of an adjustment to long-term liability on the balance sheet.
40
Budget Process
Section 45 of the Charter of the City of Toledo identifies the fiscal year for the City as beginning on the first day of January and requires that on or before the fifteenth day of November of each year, the Mayor must prepare a balanced budget estimate of the expenses of conducting the affairs of the City for the following fiscal year. The estimate is compiled from detailed information obtained from the various City departments. The total items of current expense in the budget and appropriation ordinance shall not exceed the amount available for such purpose as provided by law.
Upon receipt of the Mayor's budget estimate, the Council shall at once prepare an appropriation ordinance, using the Mayor's budget estimate as a basis.
Provisions shall be made for public hearings upon the appropriation ordinance before a committee of the Council, or before the entire Council sitting as a committee of the whole.
Following the public hearings and before final passage, the appropriation ordinance shall be published in the City Journal with a separate schedule setting forth the items asked for in the Mayor's budget estimate which were refused or changed by the Council, and the reasons for such change or refusal.
The Council shall not pass the appropriation ordinance until fifteen (15) days after its publication, nor before the first Monday in January. The annual appropriation ordinance and any amendment or supplement thereto shall be in the form prescribed by the Revised Code of Ohio, and the amounts appropriated shall be subject to the limitations therein set forth. Adoption of the annual appropriations measure shall be subject to Sections 43(A) and 43(B) of the Charter.
Council, per the Charter, is required to pass a balanced budget no later than March 31, 2021.
Unless the ordinance specifically provides otherwise in any instance, not more than one-half of any appropriation shall be expended before the first day of July in the current year.
Prior to passage, the Administration works with City Council to hold budget hearings to review all departmental budget requests and discuss revenue and expenditure assumptions.
The City’s budget process emphasizes the role of departments and divisions in all stages of the process: the initial crafting of the budget, the presentations to City Council, and the ongoing monitoring of the budget throughout the year. The budget works from the assumptions that (1) the role of departments is to fully know and understand the programs that their department is responsible for, including the budgetary implications of those programs, and (2) the role of the Finance Department is to coordinate the budget process, provide technical assistance to departments as needed, and moderate the budgetary requests of departments given scarce resources. The process as a whole is an interactive one. The Finance Department maintains an open dialogue with departments and divisions. Departments and divisions also utilize the City’s accounting system for reports that help to guide decision making on their own and within the parameters of an approved budget.
41
Appropriations
Interim AppropriationsPrior to passage of the annual operating budget, interim funding is appropriated for continued operations of the City. Interim appropriations are based on one quarter of the approved operating budget estimate submitted in November. These appropriations may be adjusted above one quarter of the operating budget estimate to account for certain contractual and debt obligations that may exceed the one quarter threshold.
Budget AmendmentsAll budget amendments shall be approved by City Council. Budgets may be amended after adoption with approval of the City Council if changes result in a change in an increase in appropriation. All budget amendment requests must be made in writing to the Budget Office, the Director of Finance and the Office of the Mayor. If budget amendment request is approved by the Office of the Mayor, it will be presented to City Council for approval through the legislative process.
Grants and Expendable Trust FundsAll new grant awards are appropriated and authorized for expenditure through the legislative process. Legislation is prepared and submitted as needed to authorize grant agreements, the acceptance and deposit of the grant funds, and the appropriation and expenditure funds according to the terms of the grant. Once appropriated, grant funds carryforward each fiscal year until the grant is completed and closed.
Expendable trust funds are established for funds donated in trust to the City and for certain special revenue sources. Expendable trust funds are appropriated when received and authorized for expenditure according to each expendable trust’s enabling legislation. Expendable trust funds carryforward each fiscal year until the trust is disestablished.
TransfersAdministrative transfers of under $25,000 are authorized against existing appropriations in the operating budget within personnel service or between non-personnel account codes within an organization unit and fund.
Capital project and grant funds are legislatively controlled by individually approved projects or grant awards for each organization. Transfers within each project and grant appropriation are authorized at any dollar level, unless subject to specific restrictions in the enabling legislation. Transfers between projects and between grant appropriations are not authorized.
Carry ForwardsAt the end of each year all unexpended balances of appropriations shall revert to the respective funds from which the same were appropriated, and shall then be subject to future appropriation; but appropriations may be made in furtherance of improvements or other objects or work of the City which will not be completed within the current year.
Appropriations made in furtherance of improvements or other objects or work, including capital projects, grants and expendable trust funds, of the City which will not be completed within the current year will be carried forward to the next fiscal year and closed out upon completion.
42
Reserves
General FundFifty percent (50%) of any General Fund undesignated year-end fund balance is placed into the Budget Stabilization Reserve in order to strengthen the City’s financial position and establish adequate financial reserves. Withdrawals from the Budget Stabilization Reserve shall only be for the purpose of continuing basic City services during times of economic recession or substantial unexpected revenue loss.
Accumulation of funds in the Budget Stabilization Reserve are limited by the Ohio Revised Code, which requires that total General Fund budget stabilization reserves cannot exceed five percent (5%) of total General Fund revenue.
43
Revenues
The revenue budget includes all dollars expected to be received by or as a result of the operations of any agency of the City of Toledo. Revenue sources include:
Income Taxes: includes withholding, business and individual income tax receipts
Property Taxes: includes levies on property that the owner is required to pay to the City
Charges for Services: includes charges for City used services and equipment such as water and sewer, refuse removal, tow fees, fire emergency medical services and transport fees, repairs provided by the City, and internal service charges for municipal garage, facilities, data processing and risk management
Licenses and Permits: includes revenue from providing or assisting with permits, zoning and inspections, storage, parking, and licensing
Fines and Forfeitures: includes traffic, civil, court and red light and hand-held speed camera fines
Intergovernmental Services: includes revenue received from the State of Ohio and Lucas County, JEDZ and JEDD income, estate taxes, paramutual taxes and payments in lieu of taxes, casino revenue, homestead and rollback revenue
Special Assessment: includes service and improvement assessments
Investment Earnings: includes interest earnings
Other Revenue: includes demolition revenue, sale of assets, gifts and donations, and rent income
Issuance of Debt: includes bond and note proceeds and capitalized debt
Grants: includes all state and federal grants received by the City
Operating Transfers : includes operating transfers in from other funds
Capital Lease Proceeds: includes amounts provided by leases
Premium (discount) on Bond: includes premiums on bonds payable
Projected Use of Fund Balance
Projected Revenues in Excess of Proposed Budgeted Expenditures will be added to Year-End Fund Balances
44
Operating Budget
The City of Toledo is organized on a department/divisional basis and operations are accounted for through various funds and cost centers. Each divisional budget is within a particular fund of the City, with revenue and expense items assigned to various cost center and commitment areas. Expenditures are presented within the following areas:
Labor: includes all base and part-time salaries, severance, compensated absences, salary savings and other personnel reimbursements
Overtime
Pension
Employment Taxes and Medical: includes all medical, workers’ compensation, unemployment compensation and Medicare
Other Labor: includes all contractual stipends
Supplies & Services: includes all supply and service costs for items such as office, equipment and computer supplies clothing and equipment, janitorial supplies, motor and utility fuel and lubricants, small apparatus and tools associated with contractual services for office equipment and supply rentals, refuse collection services, travel expenses, utility charges, repair and maintenance, professional services, real estate fees, environmental related charges, seasonal and intern services, and internal service charges for fleet, facilities, risk management insurance, and telecommunications and data processing
Capital: includes all building modification costs, machinery and equipment, vehicles and infrastructure hardware and software, and capital project costs
Debt, Transfers and Other: includes principal and interest for bonds, notes and capital leases and associated debt service charges, program contract costs and transfers out to other funds, trust funds and contributions to other agencies
45

Department OrganizationCity Council and Auditor: includes City Council and the Auditor’s Office
Office of the Mayor
Toledo-Lucas County Plan Commission
Human Relations Commission
Office of Diversity & Inclusion
Municipal Court: includes Municipal Court Judges and Clerk of Municipal Court
Department of Finance: includes Financial Analysis, Finance Administration, Treasury and Taxation, Accounts, ERP Team, Debt Management, Purchasing and Supplies
Department of Law
Department of Information & Communications Technology: includes Information & Communications Technology and Engage Toledo
Department of Neighborhoods: includes Neighborhoods Administration, Housing, Code Enforcement and the Beautification Action Team (for presentation purposes in this document historical Beautification Action Team revenues and expenditures have been reflected under Code Enforcement, which mirrors how the current budget is structured)
Department of Human Resources
Department of Development: includes Economic Development, Real Estate and Building Inspection (for presentation purposes in this document historical Real Estate revenues and expenditures have been reflected under Economic Development, which mirrors how the current budget is structured)
Department of Public Service: includes Transportation, Streets, Bridges and Harbor, Solid Waste, Fleet and Facilities, Parks, Recreation and Forestry
Department of Public Utilities: includes Utilities Administration, Water Treatment, Water Distribution, Engineering Services, Water Reclamation, Sewer and Drainage Services and Environmental Services
Safety Administration
Police Department
Fire and Rescue Department
Non-Departmental: includes Non-Departmental and General Fund Utilities
46

Funds
The City uses funds to maintain its financial records during the year. A fund is defined as a fiscaland accounting entity with a self-balancing set of accounts. The City’s funds are classified asGovernmental, Proprietary and Fiduciary.
Governmental FundsGovernmental funds are those through which most governmental functions typically are financed. Governmental reporting focuses on the sources, uses and balances of current financial resources. Expendable assets are assigned to the various Governmental Funds according to the purposes for which they may or must be used. Current Liabilities are assigned to the fund from which they will be paid. Governmental funds are categorized as:
General FundAccounts for all financial resources of the City except for those required to be accounted for in another fund.
Special Revenue FundsAccounts for specific revenue sources that are restricted or committed to expenditure for specified purposes other than debt service or capital projects.
Capital Project FundsAccounts for resources that are restricted, committed or assigned to expenditure for capital outlays, including the acquisition or construction of capital facilities and other capital assets.
Debt Service FundsAccounts for resources that are restricted, committed or assigned to expenditure for principal and interest payments.
47

Funds (continued)
Proprietary FundsProprietary funds reporting focuses on changes in net position, financial position and cash flows. Proprietary funds are categorizes as:
EnterpriseAccount for operations that are financed and operated in a manner similar to private business enterprises where the intent of the governing body is that the costs of providing goods and services to the general public on a continuing basis be financed or recovered primarily through user charges.
Internal ServiceAccount for the financing of goods or services provided by one department or agency to other departments or agencies of the City, generally on a cost reimbursement basis. The City’s internal service funds account for municipal garage operations, capital replacement, printshop services, information technology services, risk management, facility operations, workers’ compensation and healthcare.
Fiduciary FundsFiduciary funds reporting focuses on reporting assets the City holds in trust for individuals, private organization other governments or other funds.
48

Fiduciary
General Fund Capital Projects Debt Service Enterprise Internal Service General Agency
Federal Block Grants
Parkland Replacement
Capital Improvement
GO Debt Service Water Workers' Compensation
Municipal Court
Street Construction
Maintenance and Repair
Cemeteries Property
Acquisition Site Development
Franklin Park/Westfield Municipal Public
Improvement TIF
Jeep Municipal Public
Improvement TIF
Utility Administration
Information Technology
Operation GrantMarina
DevelopmentSpecial Assesment
Improvement
Special Assessment Debt
ServiceSewer
Storeroom & PrintShop
Cemetery Maintenance
Expendable Trusts Road Improvements
Storm Sewer Municipal Garage
Golf Improvements Toledo City Parks Marina Operating Capital Replacement
Special Assessment
Toledo Home Program
Municipal Tow Lot Facility Operations
CARES Act Right-of-Way Toledo Public Power
Risk Management
Downtown Toledo Parking
Property Management
Healthcare
Small Business Assistance
City of Toledo - FundsGovernmental Proprietary
Special Revenue
49
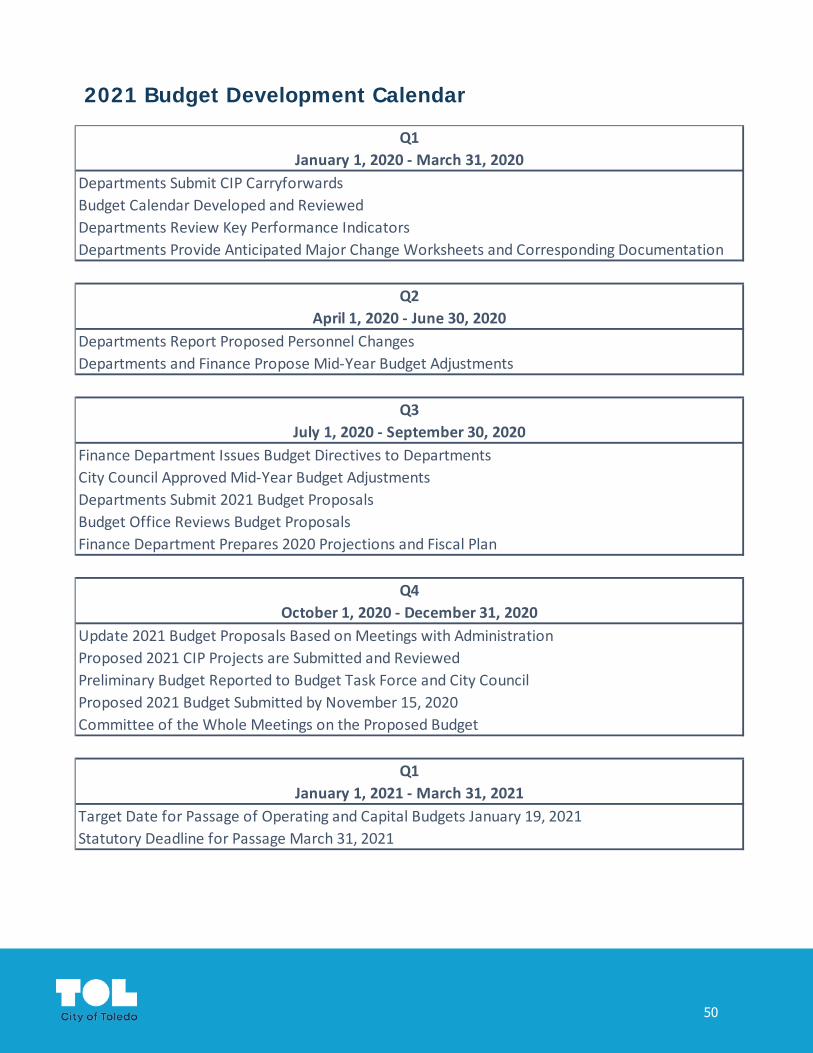
Departments and Finance Propose Mid-Year Budget Adjustments
City Council Approved Mid-Year Budget Adjustments
Committee of the Whole Meetings on the Proposed Budget
Q1January 1, 2021 - March 31, 2021
Target Date for Passage of Operating and Capital Budgets January 19, 2021Statutory Deadline for Passage March 31, 2021
Q4October 1, 2020 - December 31, 2020
Update 2021 Budget Proposals Based on Meetings with Administration
Preliminary Budget Reported to Budget Task Force and City CouncilProposed 2021 Budget Submitted by November 15, 2020
Proposed 2021 CIP Projects are Submitted and Reviewed
Q3July 1, 2020 - September 30, 2020
Finance Department Issues Budget Directives to Departments
Departments Submit 2021 Budget ProposalsBudget Office Reviews Budget ProposalsFinance Department Prepares 2020 Projections and Fiscal Plan
Q2April 1, 2020 - June 30, 2020
Departments Report Proposed Personnel Changes
Q1January 1, 2020 - March 31, 2020
Departments Submit CIP CarryforwardsBudget Calendar Developed and ReviewedDepartments Review Key Performance IndicatorsDepartments Provide Anticipated Major Change Worksheets and Corresponding Documentation
2021 Budget Development Calendar
50

Budget Summary

Summary of Positions, Revenues and Expenditures – All Funds
52

Full-Time Equivalent Positions by Fund
Fund 2019 Budget 2020 Approved 2020 Amended 2021 Proposed Change
General 1,758.44 1,808.28 1,722.39 1,746.28 23.89 Street Construction, Maintenance & Repair 115.02 142.28 140.24 147.21 6.97 Federal Grants 46.09 44.18 43.71 42.11 (1.60) Operation Grants 21.34 18.44 18.44 19.20 0.76 Toledo Home Program 1.75 1.76 1.76 2.07 0.31 Expendable Trusts 7.30 7.30 7.30 0.25 (7.05) Special Assessment 162.69 165.73 163.83 169.47 5.64 Capital Improvement 31.65 33.85 33.85 36.18 2.34 Special Assessment Improvement 1.50 1.65 1.65 - (1.65) Water 216.39 228.19 227.99 225.33 (2.66) Sewer 241.52 224.59 224.59 224.52 (0.08) Storm Water 72.42 68.65 68.65 68.97 0.32 Utility Administration 135.60 139.50 139.50 137.00 (2.50) Workers Compensation 5.25 5.25 4.83 4.25 (0.58) Information & Communication Technology 16.75 23.08 19.50 20.50 1.00 Storeroom & Printshop 0.60 0.60 0.18 - (0.18) Municipal Garage 65.40 66.40 60.82 65.20 4.38 Facility Operations 22.60 22.60 19.68 22.60 2.92 Risk Management 6.00 5.85 8.65 8.15 (0.50) Healthcare Internal Service - - - 1.00 1.00 Total 2,928.31 3,008.18 2,907.56 2,940.30 32.74
53
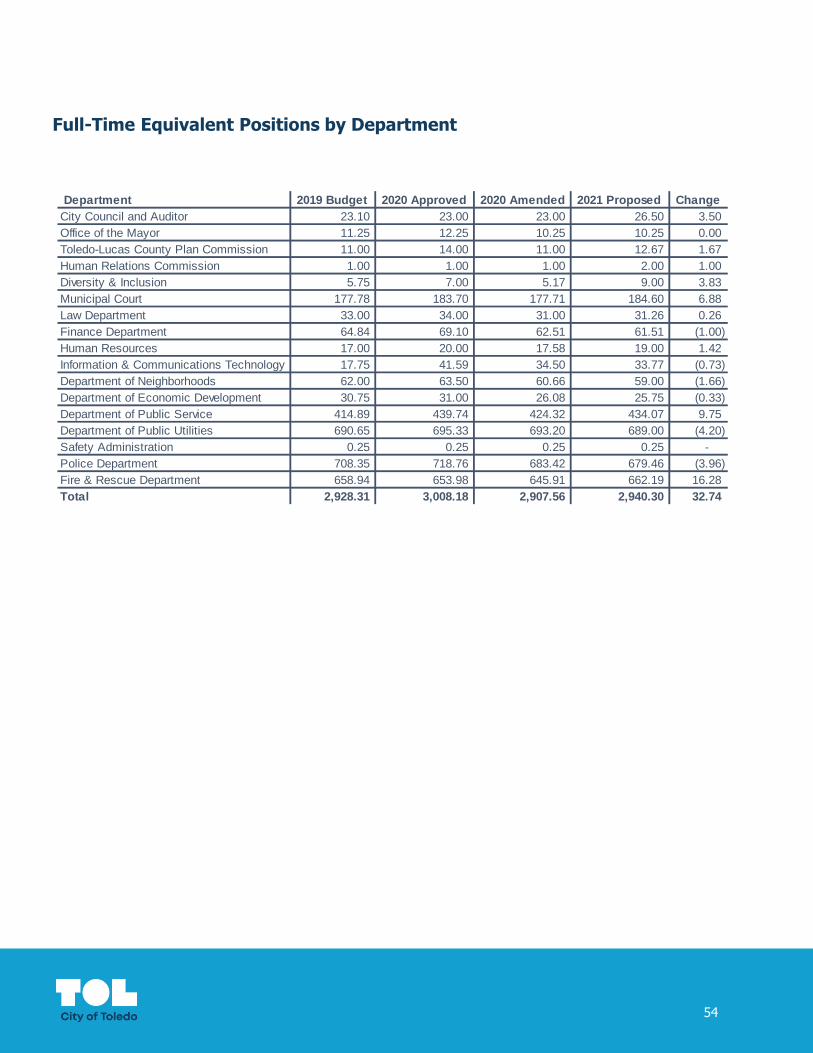
Full-Time Equivalent Positions by Department
Department 2019 Budget 2020 Approved 2020 Amended 2021 Proposed ChangeCity Council and Auditor 23.10 23.00 23.00 26.50 3.50 Office of the Mayor 11.25 12.25 10.25 10.25 0.00 Toledo-Lucas County Plan Commission 11.00 14.00 11.00 12.67 1.67 Human Relations Commission 1.00 1.00 1.00 2.00 1.00 Diversity & Inclusion 5.75 7.00 5.17 9.00 3.83 Municipal Court 177.78 183.70 177.71 184.60 6.88 Law Department 33.00 34.00 31.00 31.26 0.26 Finance Department 64.84 69.10 62.51 61.51 (1.00) Human Resources 17.00 20.00 17.58 19.00 1.42 Information & Communications Technology 17.75 41.59 34.50 33.77 (0.73) Department of Neighborhoods 62.00 63.50 60.66 59.00 (1.66) Department of Economic Development 30.75 31.00 26.08 25.75 (0.33) Department of Public Service 414.89 439.74 424.32 434.07 9.75 Department of Public Utilities 690.65 695.33 693.20 689.00 (4.20) Safety Administration 0.25 0.25 0.25 0.25 - Police Department 708.35 718.76 683.42 679.46 (3.96) Fire & Rescue Department 658.94 653.98 645.91 662.19 16.28 Total 2,928.31 3,008.18 2,907.56 2,940.30 32.74
54

ALL FUNDS REVENUE AND OTHER SOURCES SUMMARY
Summary of Revenues & Other Sources by Fund
Fund 2017 Actual 2018 Actual 2019 Actual 2020 Approved 2020 Amended 2021 Proposed
General 256,536,931 259,519,202 267,041,287 281,195,656 268,964,888 283,118,577
Special Revenue Funds 2017 Actual 2018 Actual 2019 Actual 2020 Approved 2020 Amended 2021 Proposed
Right of Way 234,350 228,900 225,400 225,000 225,000 225,000
Golf Improvements 250,000 220,000 1,183,326 1,993,016 1,993,016 1,685,260
Parkland Replacement 6,160 16,761 7,909 6,000 6,000 7,909
Marina Development 26,250 26,250 26,250 26,250 26,250 26,250
Cemetery Property Acquisition/Site Development 15,983 18,771 17,729 20,000 20,000 -
Cemetery Maintenance 37,694 70,091 65,564 48,160 48,160 -
Street Construction, Maintenance & Repair 13,929,961 13,177,540 15,678,843 19,267,338 19,295,173 19,208,407
Federal Grants 6,561,868 7,113,563 6,252,761 8,882,075 25,055,856 12,268,781
Operation Grants 5,232,212 5,086,214 4,823,428 3,632,595 19,678,092 6,669,457
CARES Act Fund - - - - 24,796,609 -
Toledo Home Program 1,970,598 2,268,713 2,096,717 2,063,320 7,850,301 3,269,142
Expendable Trusts 6,864,727 6,502,454 5,767,917 2,348,178 20,659,682 15,629
Special Assessment 48,849,660 47,699,784 49,106,294 55,236,335 55,236,335 56,013,246
Debt Service Funds 2017 Actual 2018 Actual 2019 Actual 2020 Approved 2020 Amended 2021 Proposed
General Obligation Debt Service 15,788,078 15,872,059 20,850,985 15,988,400 15,988,400 16,604,319
Jeep Municipal Public Improvement TIF 3,035,859 3,096,398 7,227,468 3,000,000 3,000,000 3,000,000
Special Assessment Debt Service 21,611 21,016 1,857 2,500 2,500 -
Capital Project Funds 2017 Actual 2018 Actual 2019 Actual 2020 Approved 2020 Amended 2021 Proposed
Capital Improvement 61,924,706 58,034,477 81,136,380 53,272,160 128,538,461 56,860,420
Road Improvements - - - - - 18,944,214
Franklin Park/Westfield Municipal Public Improvement TIF 2,152,368 2,236,036 2,225,829 2,302,000 5,070,341 35,000
Special Assessment Improvement 1,440,700 1,581,253 1,841,850 2,295,100 3,701,392 3,244,127
Enterprise Funds 2017 Actual 2018 Actual 2019 Actual 2020 Approved 2020 Amended 2021 Proposed
Water 261,578,976 266,388,813 459,779,521 118,878,139 366,813,452 119,618,925
Sewer 410,097,541 488,199,403 841,039,786 134,285,375 224,312,011 135,157,977
Storm Water 48,981,363 53,296,555 96,306,631 10,831,290 15,976,875 11,902,221
Utility Administration 17,628,693 17,881,121 18,197,463 16,560,882 16,560,882 19,857,100
Municipal Tow Lot 2,246,786 2,333,522 2,651,845 2,690,000 2,690,000 2,837,772
Toledo Public Power 1,052,693 821,745 638,722 856,800 856,800 851,500
Property Management 5,325,193 1,564,040 1,278,266 1,333,000 1,333,000 1,150,371
Small Business Development - - (126,375) - - -
Internal Service Funds 2017 Actual 2018 Actual 2019 Actual 2020 Approved 2020 Amended 2021 Proposed
Workers Compensation 5,426,452 5,871,120 5,542,590 7,409,056 7,378,159 6,989,136
Information & Communication Technology 4,842,950 4,591,256 5,691,622 7,481,401 7,481,401 7,149,309
Storeroom & Printshop 475,491 672,759 286,921 505,002 505,002 427,827
Municipal Garage 9,877,089 10,566,920 10,658,310 10,863,777 10,327,535 11,641,812
Capital Replacement 1,430,963 1,466,523 1,224,199 1,050,000 1,050,000 364,875
Facility Operations 6,553,465 7,432,136 3,926,150 3,522,777 3,522,777 3,467,909
Risk Management 2,201,872 758,985 1,555,265 2,178,172 2,889,671 3,104,163
Downtown Toledo Parking Revenue - - 165,000 - - 165,000
Healthcare Internal Service - - 479,571 42,450,000 42,450,000 42,623,589
Total 1,202,599,242 1,284,634,381 1,914,873,281 812,699,754 1,304,304,022 848,505,224
55

ALL FUNDS EXPENDITURES AND OTHER USES SUMMARY
Summary of Expenditures & Other Uses by Fund
Fund 2017 Actual 2018 Actual 2019 Actual 2020 Approved 2020 Amended 2021 Proposed
General 250,141,913 241,664,161 261,206,391 281,195,656 268,964,888 283,118,577
Special Revenue Funds 2017 Actual 2018 Actual 2019 Actual 2020 Approved 2020 Amended 2021 Proposed
Right of Way 225,000 225,000 225,000 225,000 225,000 225,000
Golf Improvements 350,893 57,288 1,400,882 1,993,016 1,993,016 1,685,260
Marina Development 10,831 15,622 15,867 9,097 9,097 19,220
Cemetery Maintenance 7,731 5,914 21,564 46,650 46,650 -
Street Construction, Maintenance & Repair 12,980,917 13,703,247 15,681,864 17,667,338 19,295,173 19,208,407
Federal Grants 7,088,551 6,598,310 6,282,286 8,882,075 23,152,343 12,268,781
Operation Grants 4,653,973 4,297,067 5,921,087 3,632,595 19,678,092 6,669,457
CARES Act Fund - - - - 24,796,609 -
Toledo Home Program 1,709,430 2,404,049 1,388,954 2,063,320 7,850,301 3,269,142
Expendable Trusts 4,665,225 4,832,953 5,772,373 2,348,178 20,659,682 15,629
Special Assessment 46,305,426 47,633,211 50,433,218 55,236,335 55,236,335 56,013,246
Debt Service Funds 2017 Actual 2018 Actual 2019 Actual 2020 Approved 2020 Amended 2021 Proposed
General Obligation Debt Service 15,788,078 15,779,643 20,601,926 15,988,400 15,988,400 16,604,319
Jeep Municipal Public Improvement TIF 3,598,351 3,492,439 4,862,322 719,000 719,000 643,250
Special Assessment Debt Service 17,250 16,500 15,750 - - -
Capital Project Funds 2017 Actual 2018 Actual 2019 Actual 2020 Approved 2020 Amended 2021 Proposed
Capital Improvement 56,587,444 66,299,810 79,325,816 53,272,160 128,538,460 56,860,420
Road Improvements - - - - - 18,944,214
Franklin Park/Westfield Municipal Public Improvement TIF 1,637,751 745,610 2,025,077 - 5,070,341 -
Special Assessment Improvement 1,473,713 1,756,412 2,001,541 2,295,084 3,701,392 3,239,520
Enterprise Funds 2017 Actual 2018 Actual 2019 Actual 2020 Approved 2020 Amended 2021 Proposed
Water 285,980,573 315,050,046 476,047,953 114,146,968 366,813,452 117,325,908
Sewer 412,352,869 469,682,011 828,816,256 132,795,506 224,312,011 133,722,351
Storm Water 45,713,236 51,599,089 96,597,611 10,479,334 15,976,876 11,902,221
Utility Administration 16,895,702 11,191,538 17,997,357 16,560,882 16,560,882 17,015,759
Municipal Tow Lot 2,179,458 2,421,175 2,671,127 2,690,000 2,690,000 2,837,772
Toledo Public Power 710,058 785,991 700,872 682,840 682,840 717,490
Property Management 1,328,957 1,276,855 1,603,708 1,333,000 1,333,000 1,150,371
Small Business Development 5,461 4,515 3,613 - - -
Internal Service Funds 2017 Actual 2018 Actual 2019 Actual 2020 Approved 2020 Amended 2021 Proposed
Workers Compensation 6,965,434 5,868,336 6,022,203 7,409,056 7,378,159 6,989,136
Information & Communication Technology 4,877,606 4,436,784 4,418,768 7,481,401 6,839,918 7,149,309
Storeroom & Printshop 431,571 365,954 249,944 504,151 491,339 427,827
Municipal Garage 9,454,615 10,389,888 10,894,863 10,863,777 10,327,535 11,641,812
Capital Replacement 1,579,493 1,939,358 1,267,528 1,050,000 1,050,000 349,000
Facility Operations 6,122,558 6,286,872 3,149,482 3,522,777 3,279,925 3,467,909
Risk Management 1,057,349 1,922,861 1,623,033 2,178,172 2,889,671 3,104,163
Healthcare Internal Service - - - 42,450,000 42,450,000 42,623,589
Total 1,202,897,416 1,292,748,510 1,909,246,236 799,721,768 1,299,000,389 839,209,058
56

Revenues, Expenditures and Positions -General Fund
57

General Fund Revenues and Other Sources
Income TaxesRevenue from income taxes accounts for the largest share of General Fund resources. The City’s income tax rate is 2.5%, of which 1.5% is permanent and 1.0% is temporary and must be renewed by voters every four years. This income tax is a flat tax of 2.5% applied on all wages earned within the City and on all wages earned by residents of Toledo outside the City.
Of the temporary tax, ¾% has been renewed by voters consistently since the initial authorization in 1982.
An additional ¼% was recently approved by voters for road improvements. The tax revenues collected as a result of the new ¼% tax will be deposited directly into the new Road Improvements Fund. The allocation of the 2.5% income tax is below.
There are three categories of income tax receipts: withholding, business and individual. Withholding taxes are all tax receipts withheld by employers and reported on W-2s. Business taxes are taxes paid on business net profits. Finally, individual taxes are taxes required to be remitted by individuals who do not have tax withheld on a W-2 but who work or live in the City of Toledo.
The 2021 proposed budget estimate projects total income tax collections totaling $195,400,000. The 2020 amended budget estimates $170,676,000 in income tax collections and total collections for 2020 are projected to exceed amended budget estimates by approximately $4,800,000.
Of the total income tax revenue estimated for 2021, $178,400,000 is estimated for the General Fund, while $17,000,000 is estimated for the Road Improvement Fund. Beginning in 2022 and beyond, the new income tax is expected to generate in excess of $19,000,000 annually.
General Police/Fire
Capital
Improvements Roads
1.00% Permanent 1.00%0.50% Permanent 0.25% 0.25%1.00% Temporary 0.25% 0.25% 0.25% 0.25%
2.50% Total 1.50% 0.25% 0.50% 0.25%
Tax Rate
Municipal Income Tax Allocation
58
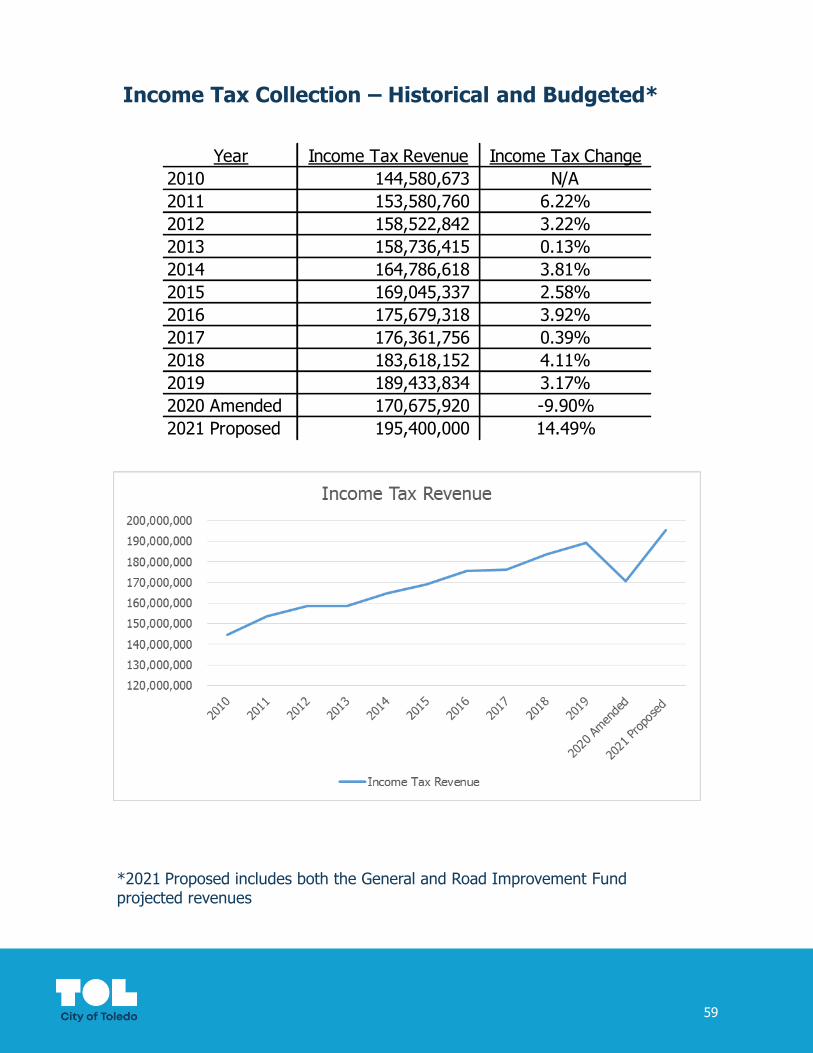
Income Tax Collection – Historical and Budgeted*
Year Income Tax Revenue Income Tax Change2010 144,580,673 N/A2011 153,580,760 6.22%2012 158,522,842 3.22%2013 158,736,415 0.13%2014 164,786,618 3.81%2015 169,045,337 2.58%2016 175,679,318 3.92%2017 176,361,756 0.39%2018 183,618,152 4.11%2019 189,433,834 3.17%2020 Amended 170,675,920 -9.90%2021 Proposed 195,400,000 14.49%
*2021 Proposed includes both the General and Road Improvement Fund projected revenues
59

General Fund Revenue and Other Sources (continued)
Property TaxesThe General Fund also receives revenue from property taxes. The 2021 budget estimates $12,757,500 in property tax receipts. Compared to the 2021 adopted budget, property tax revenues are estimated to increase by $245,000 or 1.95%.
Licenses and PermitsThe 2021 budget estimates license and permit revenue totaling $2,991,800, a decrease of $79,400 or 2.59% compared to the prior year budget.
Intergovernmental ServicesIntergovernmental services revenue includes local government funding received from the state, estate taxes, casino revenues, beer, liquor and cigarette taxes, joint economic development (JEDZ and CEDA) income and property tax payments associated with homestead and rollback. Declines in local government funds over the previous 10 years have resulted in the need for the City to rely on voter authorized transfers from the Capital Improvement Fund to support operating expenditures. Total estimated intergovernmental services revenue for 2021 is $16,814,500 which is $705,820 or 4.38% more than anticipated in the 2020 amended budget.
The 2021 estimate for state revenue sharing is $7,272,000. This includes $7,110,000 from the undivided local government distribution and $162,000 from the direct municipal local government distribution.
60

General Fund Revenue and Other Sources (continued)
Intergovernmental Services (continued)Casino revenues represent the second largest portion of intergovernmental services revenue. The 2021 budget estimates $5,310,000 in casino revenues. Compared to the amended 2020 budget, casino revenues are expected to increase by $972,000 or 22.41%.
Intergovernmental revenue also includes JEDZ and CEDA income and beer, liquor and cigarette taxes. The 2021 proposed budget projects an increase in JEDZ and CEDA income, from $1,768,180 to $1,818,000. Beer, liquor and cigarette tax revenue is expected to decrease from $437,000 in the 2020 amended budget to $425,000.
Estimated homestead and rollback property taxes are expected to increase in 2021 to $1,822,500 compared to $1,787,500 in the 2020 amended budget.
Charges for ServicesFunds received from charges for services account for the second largest category of General Fund revenues. The 2021 budget estimates $27,806,354 in this category. This includes revenue from cable fees, ambulance and emergency medical service billing, overhead cost allocations, cemetery and landfill disposal fees, refuse collection fees and other miscellaneous fees. Compared to the 2020 amended budget, projected revenue from charges for services has increased by $353,654 or 1.29%.
Revenue from refuse and recycling collections represents the largest portion of charges for services revenue at $11,960,000. Monthly collection fees were increased in 2016. The proposed 2021 budget does not include any increase in this fee.
Ambulance billing and emergency medical service revenue is projected at $6,322,250 for 2021. These revenues account for the second largest portion of charges for services revenues.
Cable franchise fees are flat compared to the amended 2020 budget at an estimated 2,075,000.
Fines and Forfeitures Fines and forfeitures revenue includes red light and hand-held speed camera revenue, court costs and fines. Total 2021 estimated revenue is $7,545,000. Revenue received from red light and speed violations is estimated at $5,400,000 for 2021. Of this total, $1,620,000 is anticipated from stationary cameras and $3,780,000 is anticipated from hand-held speed cameras. Revenue from court costs and other fees and fines is projected at $2,145,000.
61

General Fund Revenue and Other Sources (continued)
Investment Earnings and Other RevenueInvestment earnings reflects interest revenue recorded in the General Fund. The 2021 budget estimates $468,000 in interest earnings, a decrease of $141,450 or 23% over the 2020 amended budget.
Other revenue is budgeted at $835,000 in 2021. This category includes revenues for the Police Department to offset a portion of the cost of school resource officer salaries, and miscellaneous revenues received by several departments.
Operating TransfersThe 2021 proposed budget for operating transfers revenue totals $12,601,511. This includes transfers from the Capital Improvement Fund and the Tow Lot Fund. The 2021 proposed budget estimates transferring $ 11,000,000 from the Capital Improvement Fund and $1,601,511 from the Tow Lot Fund.
Projected Use of Fund BalanceThe proposed 2021 General Fund budget is balanced through the use of $22,898,912 of projected unassigned fund balance.
62

General Fund Revenue and Other Sources
Revenue Category 2017 Actual 2018 Actual 2019 Actual
2020
Approved
2020
Amended
2021
Proposed
Income Taxes 176,361,756 183,618,152 189,433,834 190,657,120 170,675,920 178,400,000 Property Taxes 12,024,576 12,222,829 12,641,588 12,512,500 12,512,500 12,757,500 Licenses and Permits 2,943,041 3,213,319 2,962,948 3,071,200 3,071,200 2,991,800 Intergovernmental Services 18,878,111 17,808,236 18,590,485 18,509,500 16,108,680 16,814,500 Charges for Services 29,298,616 28,480,977 28,848,117 28,528,700 27,452,700 27,806,354 Investment Earnings 461,726 1,469,245 2,189,796 1,218,900 609,450 468,000 Fines and Forfeitures 9,844,539 10,149,833 9,317,261 10,185,000 8,820,210 7,545,000 Other Revenue 1,305,986 1,268,477 1,587,567 675,200 699,200 835,000 Operating Transfers 5,418,580 1,288,134 1,469,693 9,409,022 9,859,022 12,601,511 Use of Fund Balance - - - 6,428,514 19,156,006 22,898,912 Total 256,536,931 259,519,202 267,041,287 281,195,656 268,964,888 283,118,577
Income Taxes63.01%
Property Taxes4.51%
Licenses and Permits1.06%
Intergovernmental Services5.94%
Charges for Services9.82%
Investment Earnings0.17%
Fines and Forfeitures2.66%
Other Revenue0.29%
Operating Transfers4.45%
Use of Fund Balance8.09%
2021 Proposed General Fund Revenues & Other Sources
63

General Fund Expenditures and Other Uses
LaborThe 2021 proposed budget for labor totals $121,079,924. This includes base and part-time wages, estimated severance, compensated absences, salary savings and other labor reimbursements.Compared to 2020 amended budget levels, estimated costs for 2020 have increased by 1.24% or $1,477,396.
Base and part-time salaries and wages total $121,902,376 in the proposed 2021 budget, an increase of 1.31% over 2020 amended budget levels.
Severance expenditures in 2021 are estimated at $1,880,989. Estimated severance expenditures are projected by each department based on the number of retirements anticipated during the year and the associated accrued sick time eligible to be paid out at retirement. Compared to the 2020 amended budget, total expenditures are estimated to decrease by $63,602.62 or 3.27%.
The proposed budget for compensated absences budget is $100,000.
The total proposed budget for salary savings and other personnel reimbursements for 2021 is $3,010,444. This includes salary, wage and fringe benefit savings of $1,750,000 to achieve by delaying the filling of vacant civilian positions for City departments. This also includes reimbursements for Finance - ERP and Engage Toledo, as well as projected grant reimbursements for the Police and Fire & Rescue Departments.
OvertimeThe proposed budget anticipated $7,791,543 for overtime expenditures in 2021. Of this total, the Police Department proposed overtime is $3,127,190 and the Fire and Rescue Department proposed overtime is $4,310,914. Overtime for all other departments totals $353,439 in the proposed 2021 budget. Compared to the amended 2020 budget, total overtime has increased by $1,602,460 or 25.89%.
PensionThe City participates in the Ohio Public Employees Retirement System (OPERS) and the Ohio Police & Fire Pension Fund (OP&F). Required employer contributions for these plans are 14% of eligible wages for employees other than police officers and firefighters and 19.5% of eligible wages for police officers and 24% of eligible wages for firefighters. The proposed budget for pension is $25,217,799 for 2021. Pension expenditures are impacted by changes in base wage and overtime expenditures. With increased wages and additional full time equivalents budgeted for 2021, associated pension expenditures are also anticipated to increase. In total, pension estimates have increased by $711,816.71 or 2.91% over 2020 amended budget levels.
Employment Taxes & MedicalEmployment tax and medical expenditures include workers’ compensation, Medicare costs, unemployment compensation and medical insurance expenditure estimates. The 2021 budget estimates $25,184,835 in total for these expenditures, which is a decrease of $504,917 or 1.97% compared to 2020 amended budget.
64

General Fund Expenditures and Other Uses (continued)
Other Personnel ExpensesTotal proposed budget for other personnel expenses is $1,255,242 in 2021. Other personnel expenses includes contractual stipends for Police and Fire & Rescue, tool and auto allowances and other contractual obligations. Compared to 2020 amended budgeted levels, expenditures have increased by $44,136 or 3.64%.
SuppliesThe proposed budget for supply expenditures for 2021 totals $3,790,622, which is $928,417 or 32.44% higher than the 2020 amended budget. This increase in the 2021 proposed budget is driven by the projected purchase of clothing, linen and equipment for the Fire & Rescue Department as the department will be onboarding and outfitting 50 new firefighters in 2021.
ServicesThe proposed budget for service expenditures for 2021 totals $56,954,449, which is $6,787,646 or 13.53% higher than the 2020 amended budget. The year-over-year budget increase is driven by projected increases several items including:
- projected increase in recycling expenditures - funding for enterprise-wide training & development - lead program contractual service costs for the Health Department- funding to support the City’s participation in the Choice Neighborhoods Planning Grant through
cooperative agreement with the Lucas Metropolitan Housing Authority- changes in the budgeting for revenues and expenditures for the traffic citation program, which in
2021 will be processed through the Clerk of Municipal Court
Debt, Transfers and OtherGeneral Fund debt expenditures are budgeted at $151,000 in the proposed 2021 budget. This budget covers debt payments related to the Dura landfill.
The Debt, Transfers and Other category also includes $500,000 in funding for lead program contracts administered through the Department of Neighborhoods.
Proposed budgeted operating transfers to other funds totals $40,959,704 for 2021. The largest transfer out of the General Fund results from the portion of the income tax transferred to the Capital Improvement Fund. This transfer is budgeted at $39,015,490 for 2021. The proposed budget includes an additional $1,944,214 transfer out to the Road Improvement to support residential road improvements during the first year of collections for the new ¼% income tax, which in 2022 and beyond is expected to generate in excess of $19,000,000 annually. Additionally, $175,260 is budgeted for transfer to the Golf Improvement Fund to support municipal golf operations in 2021.
65

Total Expenditures – General Fund
Expenditure Category 2017 Actual 2018 Actual 2019 Actual
2020
Approved
2020
Amended
2021
Proposed
Labor 108,701,409 108,011,800 116,167,815 124,440,339 119,602,530 121,079,924 Overtime 6,258,670 7,091,466 7,265,666 6,189,084 6,189,084 7,791,543 Pension 21,865,004 22,598,510 23,607,445 25,278,174 24,505,982 25,150,999 Employment Taxes & Medical 22,808,207 21,778,391 24,244,390 26,377,960 25,689,752 25,184,835 Other Personnel 1,102,583 1,072,764 1,089,314 1,293,324 1,211,106 1,255,242 Supplies 3,533,184 3,308,760 3,260,349 3,292,082 2,862,205 3,790,622 Services 39,249,508 36,774,379 44,669,028 51,033,137 50,166,803 56,954,449 Capital - - - - - - Debt, Transfers & Other 46,623,349 41,028,090 40,902,385 43,291,556 38,737,427 41,910,964 Total 250,141,913 241,664,161 261,206,391 281,195,656 268,964,888 283,118,577
Labor42.77%
Overtime2.75%
Pension8.88%
Employment Taxes & Medical8.90%
Other Personnel0.44%
Supplies1.34%
Services20.12%
Capital0.00%
Debt, Transfers & Other14.80%
2021 Proposed Budget Expenditures & Other Uses
66

Total Expenditures – General Fund – By Department
Department 2017 Actual 2018 Actual 2019 Actual
2020
Approved
2020
Amended
2021
Proposed
City Council and Auditor 1,496,505 1,087,312 1,692,491 2,140,437 1,766,942 1,930,397 Office of the Mayor 762,425 1,101,343 1,221,936 1,385,404 1,208,603 1,622,392 Toledo-Lucas County Plan Commission 428,972 474,549 586,865 963,942 708,793 912,658 Board of Community Relations 100,550 24,978 - - - - Human Relations Commission - 1,437 132,110 154,639 135,911 235,201 Youth Commission 94,695 98 - - - - Diversity & Inclusion 374,659 370,022 503,962 733,042 860,474 1,023,078 Municipal Court 13,989,532 14,700,094 14,848,818 16,760,527 15,761,584 18,735,655 Law Department 2,561,640 2,168,113 2,336,546 2,658,725 2,067,176 2,262,150 Finance Department 9,253,543 5,811,281 6,223,149 7,706,593 7,079,182 6,796,453 Human Resources 1,165,562 1,110,321 1,068,934 1,834,109 1,530,627 2,110,840 Information & Communications Technology - - - 596,214 489,469 285,317 Department of Neighborhoods 1,423,595 1,635,284 1,936,251 1,999,809 1,804,063 3,198,511 Department of Economic Development 3,280,252 3,260,452 3,882,147 4,648,538 4,161,029 4,485,614 Department of Public Service 8,616,676 9,300,961 10,924,110 12,967,905 11,879,627 13,314,656 Department of Public Utilities 368,878 383,040 566,609 678,751 512,144 616,015 Safety Administration 2,439,164 (1,849,269) 2,220,557 2,533,207 2,403,207 2,453,703 Police Department 77,931,875 75,715,109 81,256,016 86,918,214 84,434,010 84,030,006 Fire & Rescue Department 68,605,856 70,610,154 75,444,136 76,410,296 75,499,860 79,376,868 Non-Departmental 57,247,534 55,758,881 56,361,758 60,105,304 56,662,186 59,729,062 Total 250,141,913 241,664,161 261,206,391 281,195,656 268,964,888 283,118,577
Public Safety65.20%
All Other Departments20.33%
Operating Transfers14.47%
2021 Proposed Expenditures & Other Uses
67

General Fund Full-Time Equivalent Positions
Department 2019 Budget 2020 Approved 2020 Amended 2021 Proposed
City Council and Auditor 23.10 23.00 23.00 26.50 Office of the Mayor 9.95 10.95 9.15 9.15 Toledo-Lucas County Plan Commission 5.75 9.25 6.25 7.92 Human Relations Commission 1.00 1.00 1.00 2.00 Diversity & Inclusion 5.00 6.25 4.42 7.00 Municipal Court 174.18 180.40 174.41 181.30 Law Department 24.15 25.30 19.50 20.26 Finance Department 59.85 64.60 58.43 57.86 Human Resources 10.85 13.85 11.85 12.85 Information & Communications Technology - 18.50 15.00 13.27 Department of Neighborhoods 11.47 15.37 13.00 13.12 Department of Economic Development 29.75 30.00 25.08 24.75 Department of Public Service 31.66 34.45 30.63 26.11 Department of Public Utilities 7.20 5.39 3.26 4.28 Safety Administration 0.25 0.25 0.25 0.25 Police Department 705.35 715.76 681.26 677.46 Fire & Rescue Department 658.94 653.98 645.91 662.19 Total 1,758.44 1,808.28 1,722.39 1,746.28
68

General Fund Full-Time Equivalent Positions – Public Safety SummaryDepartment 2019 Budget 2020 Approved 2020 Amended 2021 Proposed
Public Safety* 1,538.73 1,550.39 1,501.84 1,521.20 All Other Departments 219.72 257.90 220.56 225.08 Total 1,758.44 1,808.28 1,722.39 1,746.28
*Public Safety includes Municipal Court, Safety Administration, Police and Fire & Rescue
Public Safety87.11%
All Other Departments12.89%
General Fund 2021 Proposed FTEs
69

Gen
eral
Fun
d Fi
scal
Pla
n an
d Pr
ojec
tion
Cit
y o
f To
led
o -
Ge
ne
ral Fu
nd
Pro
jecti
on
Re
ve
nu
es &
Oth
er
So
urc
es
20
20
Pro
jecte
d2
02
1 P
roje
cte
d2
02
2 P
roje
cte
d2
02
3 P
roje
cte
d2
02
4 P
roje
cte
d2
02
5 P
roje
cte
d2
02
6 P
roje
cte
d2
02
7 P
roje
cte
d2
02
8 P
roje
cte
d2
02
9 P
roje
cte
d
Inco
me
Taxe
s17
5,50
0,00
0
178,
400,
000
18
1,37
3,78
6
185,
271,
262
18
9,24
6,68
7
194,
924,
088
20
0,77
1,81
0
206,
794,
964
21
2,99
8,81
3
219,
388,
778
O
ther
Rev
enue
s66
,021
,500
69
,218
,154
70
,602
,517
72
,385
,567
73
,833
,279
75
,309
,944
76
,816
,143
78
,352
,466
79
,919
,515
81
,517
,906
O
pera
ting
Tran
sfer
26,8
32,4
58
12,6
01,5
11
18,1
33,5
41
18,1
66,2
12
18,1
99,5
36
18,2
33,5
27
18,2
68,1
98
18,3
03,5
62
18,3
39,6
33
18,3
76,4
25
To
tal R
ev
en
ue
s2
68
,35
3,9
58
2
60
,21
9,6
65
2
70
,10
9,8
44
2
75
,82
3,0
41
2
81
,27
9,5
02
2
88
,46
7,5
59
2
95
,85
6,1
51
3
03
,45
0,9
92
3
11
,25
7,9
62
3
19
,28
3,1
09
Exp
en
dit
ure
s &
Oth
er
Use
s2
02
0 P
roje
cte
d2
02
1 P
roje
cte
d2
02
2 P
roje
cte
d2
02
3 P
roje
cte
d2
02
4 P
roje
cte
d2
02
5 P
roje
cte
d2
02
6 P
roje
cte
d2
02
7 P
roje
cte
d2
02
8 P
roje
cte
d2
02
9 P
roje
cte
d
Wag
es10
9,77
0,85
1
130,
126,
709
13
1,33
7,50
8
132,
560,
415
13
3,79
5,55
2
135,
043,
039
13
6,30
3,00
2
137,
575,
564
13
8,86
0,85
2
140,
158,
992
Fr
inge
s42
,524
,966
50
,335
,833
53
,839
,192
54
,377
,584
54
,921
,359
55
,470
,573
56
,025
,279
56
,585
,531
57
,151
,387
57
,722
,901
Su
pplie
s &
Ser
vice
s52
,634
,007
61
,370
,071
58
,570
,071
58
,570
,071
58
,570
,071
58
,570
,071
58
,570
,071
58
,570
,071
58
,570
,071
58
,570
,071
De
bt72
1,00
0
151,
000
-
-
-
-
-
-
-
-
O
pera
ting
Tran
sfer
s38
,872
,333
41
,134
,964
39
,851
,657
40
,717
,763
41
,601
,190
42
,862
,835
44
,162
,329
45
,500
,808
46
,879
,441
48
,299
,433
To
tal Exp
en
dit
ure
s2
44
,52
3,1
57
2
83
,11
8,5
77
2
83
,59
8,4
27
2
86
,22
5,8
32
2
88
,88
8,1
72
2
91
,94
6,5
18
2
95
,06
0,6
80
2
98
,23
1,9
74
3
01
,46
1,7
50
3
04
,75
1,3
96
Pro
jecte
d F
un
d B
ala
nce
*2
02
0 P
roje
cte
d2
02
1 P
roje
cte
d2
02
2 P
roje
cte
d2
02
3 P
roje
cte
d2
02
4 P
roje
cte
d2
02
5 P
roje
cte
d2
02
6 P
roje
cte
d2
02
7 P
roje
cte
d2
02
8 P
roje
cte
d2
02
9 P
roje
cte
d
Proj
ecte
d St
artin
g Fu
nd B
alan
ce46
,622
,000
70
,452
,801
47
,553
,889
34
,065
,306
23
,662
,516
16
,053
,846
12
,574
,887
13
,370
,358
18
,589
,376
28
,385
,588
Chan
ge in
Fun
d Ba
lanc
e23
,830
,801
(2
2,89
8,91
2)
(13,
488,
583)
(1
0,40
2,79
1)
(7,6
08,6
70)
(3,4
78,9
59)
795,
471
5,
219,
018
9,79
6,21
2
14
,531
,712
Pro
jecte
d E
nd
ing
Fu
nd
Ba
lan
ce
70
,45
2,8
01
47
,55
3,8
89
34
,06
5,3
06
23
,66
2,5
16
16
,05
3,8
46
12
,57
4,8
87
13
,37
0,3
58
18
,58
9,3
76
28
,38
5,5
88
42
,91
7,3
00
*Tot
al G
ener
al F
und
Bala
nce
excl
udin
g No
n-Sp
enda
ble
& R
estr
icte
d Po
rtio
ns**
The
2020
pro
ject
ed r
even
ues
and
exep
endi
ture
s re
flect
the
estim
ated
impa
ct o
f CAR
ES A
ct fu
nds
and
Stat
e of
Ohi
o w
orke
rs' c
ompe
nsat
ion
reba
tes.
Ple
ase
see
Appe
ndix
A fo
r ad
ditio
nal i
nfor
mat
ion
on th
e Fi
scal
Pla
n &
Pro
ject
ion.
70

Capi
tal I
mpr
ovem
ent
Fund
Fis
cal P
lan
and
Proj
ectio
nC
ap
ita
l Im
pro
ve
me
nt
Fisca
l P
lan
an
d P
roje
cti
on
Pro
jecte
d S
ou
rce
s2
02
0 P
roje
cte
d2
02
1 P
roje
cte
d2
02
2 P
roje
cte
d2
02
3 P
roje
cte
d2
02
4 P
roje
cte
d2
02
5 P
roje
cte
d2
02
6 P
roje
cte
d2
02
7 P
roje
cte
d2
02
8 P
roje
cte
d2
02
9 P
roje
cte
d
Inc
ome
Taxe
s Al
loca
ted
for
CIP
and
Road
Impr
ovem
ents
*38
,333
,333
55
,745
,787
58
,840
,908
60
,125
,698
61
,436
,184
63
,306
,227
65
,232
,372
67
,216
,300
69
,259
,747
71
,364
,497
O
ther
Rev
enue
s an
d Tr
ansf
ers
1,28
1,87
8
5,
858,
655
3,90
8,68
6
3,
841,
161
3,84
4,11
1
3,
378,
638
1,74
8,51
3
37
9,80
0
380,
250
37
9,95
0
New
Deb
t Iss
uanc
e -
Leop
ardo
Pro
ject
**-
39,0
00,0
00
- -
- -
- -
- -
New
Deb
t Iss
uanc
e &
Oth
er O
blig
atio
ns -
Cap
ital P
roje
cts
16,7
78,2
57
11,3
00,0
00
10,4
60,0
00
6,36
5,00
0
9,
457,
000
11,6
45,0
00
11,7
50,0
00
10,4
50,0
00
9,00
0,00
0
9,
000,
000
To
tal S
ou
rce
s5
6,3
93
,46
8
11
1,9
04
,44
2
7
3,2
09
,59
4
70
,33
1,8
59
7
4,7
37
,29
5
78
,32
9,8
64
7
8,7
30
,88
4
78
,04
6,1
00
7
8,6
39
,99
7
80
,74
4,4
47
Pro
jecte
d U
se
s2
02
0 P
roje
cte
d2
02
1 P
roje
cte
d2
02
2 P
roje
cte
d2
02
3 P
roje
cte
d2
02
4 P
roje
cte
d2
02
5 P
roje
cte
d2
02
6 P
roje
cte
d2
02
7 P
roje
cte
d2
02
8 P
roje
cte
d2
02
9 P
roje
cte
d
Exi
stin
g De
bt S
ervi
ce19
,330
,156
20
,924
,230
20
,536
,572
20
,201
,586
16
,521
,540
15
,993
,902
13
,733
,983
13
,007
,645
12
,644
,267
8,
619,
682
Pro
ject
ed N
ew D
ebt S
ervi
ce-
- 99
8,00
3
2,05
1,31
8
6,
202,
832
7,33
9,95
4
8,
740,
165
9,79
2,27
7
10
,844
,389
11
,926
,561
P
roje
ct S
uppo
rt5,
127,
435
5,30
5,44
7
5,
305,
447
5,30
5,44
7
5,
305,
447
5,30
5,44
7
5,
305,
447
5,30
5,44
7
5,
305,
447
5,30
5,44
7
M
ajor
Roa
d &
Brid
ge P
roje
cts
- Ci
ty M
atch
11,5
21,4
55
8,30
0,00
0
6,
760,
000
4,86
5,00
0
7,
957,
000
10,1
45,0
00
7,50
0,00
0
7,
500,
000
7,50
0,00
0
7,
500,
000
Res
iden
tial R
oads
- N
ew F
undi
ng*
- 19
,230
,001
19
,464
,511
19
,583
,195
20
,010
,253
20
,618
,652
21
,245
,303
21
,890
,753
22
,555
,566
23
,240
,325
N
ew L
eopa
rdo
Capi
tal P
roje
cts*
*-
39,0
00,0
00
- -
- -
- -
- -
Bui
ldin
gs, I
mpr
ovem
ents
& E
quip
men
t37
,789
,907
11
,091
,000
5,
700,
000
3,00
0,00
0
3,
000,
000
3,00
0,00
0
5,
500,
000
4,20
0,00
0
3,
000,
000
3,00
0,00
0
1
% fo
r th
e Ar
ts C
ontr
ibut
ion
339,
143
33
3,05
7
325,
105
28
4,95
8
320,
027
34
3,77
4
350,
114
33
3,55
4
325,
958
36
9,57
9
Tra
nsfe
r to
Gen
eral
Fun
d8,
462,
106
11,0
00,0
00
16,5
00,0
00
16,5
00,0
00
16,5
00,0
00
16,5
00,0
00
16,5
00,0
00
16,5
00,0
00
16,5
00,0
00
16,5
00,0
00
To
tal U
se
s8
2,5
70
,20
2
11
5,1
83
,73
5
7
5,5
89
,63
8
71
,79
1,5
03
7
5,8
17
,09
8
79
,24
6,7
28
7
8,8
75
,01
2
78
,52
9,6
76
7
8,6
75
,62
7
76
,46
1,5
93
Pro
jecte
d F
un
d B
ala
nce
20
20
Pro
jecte
d2
02
1 P
roje
cte
d2
02
2 P
roje
cte
d2
02
3 P
roje
cte
d2
02
4 P
roje
cte
d2
02
5 P
roje
cte
d2
02
6 P
roje
cte
d2
02
7 P
roje
cte
d2
02
8 P
roje
cte
d2
02
9 P
roje
cte
d
Proj
ecte
d St
artin
g Fu
nd B
alan
ce38
,296
,633
12
,119
,899
8,
840,
606
6,46
0,56
2
5,
000,
917
3,92
1,11
4
3,
004,
250
2,86
0,12
2
2,
376,
547
2,34
0,91
7
Chan
ge in
Fun
d Ba
lanc
e(2
6,17
6,73
4)
(3,2
79,2
93)
(2
,380
,044
)
(1,4
59,6
45)
(1
,079
,803
)
(916
,864
)
(1
44,1
28)
(483
,575
)
(3
5,63
0)
4,28
2,85
4
P
roje
cte
d E
nd
ing
Fu
nd
Ba
lan
ce
12
,11
9,8
99
8
,84
0,6
06
6,4
60
,56
2
5
,00
0,9
17
3,9
21
,11
4
3
,00
4,2
50
2,8
60
,12
2
2
,37
6,5
47
2,3
40
,91
7
6
,62
3,7
71
For
pres
enta
tion
purp
oses
:*T
he n
ew 1
/4%
inco
me
tax
reve
nue
and
road
way
pro
ject
s ar
e in
clud
ed in
the
fisca
l pla
n an
d pr
ojec
tion.
Bud
gete
d an
d ac
tual
rev
enue
s an
d ex
pend
iture
s w
ill b
e re
cord
ed in
the
new
Roa
d Im
prov
emen
ts F
und.
**Th
e pr
opos
ed L
eopa
rdo
proj
ect f
undi
ng a
nd p
roje
ct a
ppro
pria
tion
are
refle
cted
. Sep
arat
e le
gisl
atio
n w
ill b
e pr
esen
ted
to a
utho
rize
sam
e.
71

Stre
et C
onst
ruct
ion,
Mai
nten
ance
& R
epai
r Fu
nd F
isca
l Pla
n an
d Pr
ojec
tion
Cit
y o
f To
led
o -
Str
ee
t C
on
str
ucti
on
, M
ain
ten
an
ce
& R
ep
air
(S
CM
R)
Fu
nd
Re
ve
nu
es &
Oth
er
So
urc
es
20
20
Pro
jecte
d2
02
1 P
roje
cte
d2
02
2 P
roje
cte
d2
02
3 P
roje
cte
d2
02
4 P
roje
cte
d2
02
5 P
roje
cte
d2
02
6 P
roje
cte
d2
02
7 P
roje
cte
d2
02
8 P
roje
cte
d2
02
9 P
roje
cte
d
Inte
rgov
ernm
enta
l Rev
enue
s16
,196
,000
17
,088
,000
17
,429
,760
17
,778
,355
18
,133
,922
18
,496
,601
18
,866
,533
19
,243
,863
19
,628
,741
20
,021
,316
O
ther
Rev
enue
s16
3,33
5
179,
500
18
3,09
0
186,
752
19
0,48
7
194,
297
19
8,18
3
202,
146
20
6,18
9
210,
313
O
pera
ting
Tran
sfer
225,
000
22
5,00
0
225,
000
22
5,00
0
225,
000
22
5,00
0
225,
000
22
5,00
0
225,
000
22
5,00
0
To
tal R
ev
en
ue
s16
,584
,335
17
,492
,500
17
,837
,850
18
,190
,107
18
,549
,409
18
,915
,897
19
,289
,715
19
,671
,010
20
,059
,930
20
,456
,628
Exp
en
dit
ure
s &
Oth
er
Use
s2
02
0 P
roje
cte
d2
02
1 P
roje
cte
d2
02
2 P
roje
cte
d2
02
3 P
roje
cte
d2
02
4 P
roje
cte
d2
02
5 P
roje
cte
d2
02
6 P
roje
cte
d2
02
7 P
roje
cte
d2
02
8 P
roje
cte
d2
02
9 P
roje
cte
d
Wag
es5,
564,
322
6,68
3,73
9
6,
714,
698
6,74
5,81
2
6,
777,
081
6,80
8,50
7
6,
840,
090
6,87
1,83
1
6,
903,
730
6,93
5,78
9
Fr
inge
s2,
748,
097
3,20
5,88
9
3,
221,
918
3,23
8,02
8
3,
254,
218
3,27
0,48
9
3,
286,
842
3,30
3,27
6
3,
319,
792
3,33
6,39
1
Su
pplie
s &
Ser
vice
s7,
208,
324
8,03
0,81
9
8,
070,
973
8,11
1,32
8
8,
151,
885
8,19
2,64
4
8,
233,
608
8,27
4,77
6
8,
316,
149
8,35
7,73
0
Ca
pita
l41
3,22
9
490,
000
-
- -
- -
- -
- O
pera
ting
Tran
sfer
s86
2,20
2
797,
960
79
7,96
0
797,
960
79
7,96
0
797,
960
33
4,83
7
334,
837
33
4,83
7
334,
837
To
tal Exp
en
dit
ure
s16
,796
,173
19
,208
,407
18
,805
,550
18
,893
,128
18
,981
,144
19
,069
,601
18
,695
,376
18
,784
,719
18
,874
,509
18
,964
,748
Pro
jecte
d F
un
d B
ala
nce
20
20
Pro
jecte
d2
02
1 P
roje
cte
d2
02
2 P
roje
cte
d2
02
3 P
roje
cte
d2
02
4 P
roje
cte
d2
02
5 P
roje
cte
d2
02
6 P
roje
cte
d2
02
7 P
roje
cte
d2
02
8 P
roje
cte
d2
02
9 P
roje
cte
d
Proj
ecte
d St
artin
g Fu
nd B
alan
ce*
4,70
2,00
0
4,
490,
162
2,77
4,25
5
1,
806,
555
1,10
3,53
3
67
1,79
8
518,
095
1,
112,
434
1,99
8,72
4
3,
184,
145
Ch
ange
in F
und
Bala
nce
(211
,838
)
(1
,715
,907
)
(967
,700
)
(7
03,0
21)
(431
,735
)
(1
53,7
03)
594,
339
88
6,29
0
1,18
5,42
1
1,
491,
881
Pro
jecte
d E
nd
ing
Fu
nd
Ba
lan
ce
4,4
90
,16
2
2
,77
4,2
55
1,8
06
,55
5
1
,10
3,5
33
67
1,7
98
5
18
,09
5
1,1
12
,43
4
1
,99
8,7
24
3,1
84
,14
5
4
,67
6,0
25
*202
0 Pr
ojec
ted
Star
ting
Fund
Bal
ance
Exc
lude
s No
n-Sp
enda
ble
Port
ion
of S
CMR
Bala
nce
72

Departmental Overviews

Toledo City Council
Toledo City Council is the legislative branch of City Government and operates in accordance with the provisions of the Charter of the City of Toledo, first adopted by the voters in 1914 and amended by the voters from time to time. City Council has nine standing committees that meet at the call of the Chair of the Committee. The standing committees are: Budget Oversight, Education, Recreation & Employment, Finance & Debt Oversight, Neighborhoods, Community Development & Health, Public Safety & Criminal Justice Reform, Regional Growth, Development & Small Business Enterprise, Streets, Public Services & Utilities, Water Quality & Sustainability, and Zoning & Planning.
Legislative authority in the City is vested in a twelve-member Council. Six members of the Council are elected at- large and six from districts; all for four-year terms. The Council is authorized to enact ordinances and resolutions relating to City services, tax levies, appropriating and borrowing money, licensing and regulating businesses and trades and other municipal activities. The Council also has authority to fix the compensation of City officers and employees. The Council elects one of its members to serve as the President of Council, its presiding officer.
Funding SourcesThe General Fund supports the functions of Toledo City Council in the proposed 2021 budget.
2021 HighlightsThe 2021 budget supports all members of the City Council office. In addition to the 12 serving Council members, there are ten staff employees who assist the members.
Position Title 2019 Budget 2020 Approved 2020 Amended 2021 ProposedAdministrative Assistant - 2.00 2.00 2.00 Administrative Specialist 3 4.50 4.50 4.50 4.50 Assistant Clerk Of Council 1.00 1.00 1.00 1.00 Clerk Of Council 1.00 1.00 1.00 1.00 Constituent Services Coordinator 0.60 0.50 0.50 - Councilman 11.00 11.00 11.00 15.00
Manager-Administrative Services 1.00 - - - Manager-Legislative Operations - 1.00 1.00 1.00 President Of Council 1.00 1.00 1.00 1.00 Secretary 3 2.00 - - - Total 22.10 22.00 22.00 25.50
74

Toledo City Council
General Fund
Expenditure Category 2017 Actual 2018 Actual 2019 Actual 2020 Approved 2020 Amended 2021 Proposed
Labor 786,878 448,205 930,615 1,006,238 993,867 1,083,850
Overtime - - - - - -
Pension 109,353 121,355 129,876 140,309 138,577 151,174
Employment Taxes & Medical 266,414 254,987 286,350 306,312 306,133 354,429
Other Personnel 3,300 3,300 3,850 3,575 3,575 3,575
Supplies 15,144 19,633 22,797 20,140 20,140 19,600
Services 210,119 134,353 207,638 249,805 192,724 201,428
Capital - - - - - -
Debt, Transfers & Other - - - 300,000 - -
Total 1,391,209 981,833 1,581,125 2,026,379 1,655,015 1,814,056
2021 Proposed Budget - City Council & Auditor
Expenditure Category & Source of Funds General Fund
Special Revenue Funds
Debt Service Funds
Capital Projects Funds
Enterprise Funds
Internal Service Funds Total
Labor 1,171,174 - - - - - 1,171,174
Overtime - - - - - - -
Pension 163,400 - - - - - 163,400
Employment Taxes & Medical 369,035 - - - - - 369,035
Other Personnel 3,575 - - - - - 3,575
Supplies 19,600 - - - - - 19,600
Services 203,612 - - - - - 203,612
Capital - - - - - - -
Debt, Transfers & Other - - - - - - -
Total 1,930,397 - - - - - 1,930,397
75

City Auditor The City Auditor provides independent audit review, upholds accountability and improves the efficiency and effectiveness of City government. Through continued examination, the Auditor ensures reliability and the integrity of City of Toledo financial and operating information in order to provide quality control and accountability to deter and prevent fraud.
Funding Sources:The General Fund supports all functions of the Auditor.
2021 Highlights:The 2021 budget funds one FTE in the Auditor’s office. Labor represents 98.12% of total budget.
Auditor
Position Title 2019 Budget 2020 Amended 2020 Approved 2021 ProposedCity Auditor 1.00 1.00 1.00 1.00 Total 1.00 1.00 1.00 1.00
General Fund
Expenditure Category 2017 Actual 2018 Actual 2019 Actual 2020 Approved 2020 Amended 2021 Proposed
Labor 78,244 80,304 82,640 85,106 83,417 87,324
Overtime - - - - - -
Pension 10,954 11,243 11,570 11,915 11,679 12,225
Employment Taxes & Medical 14,085 12,306 13,406 14,777 14,753 14,606
Other Personnel - - - - - -
Supplies - - 1,295 - - -
Services 2,013 1,625 2,455 2,260 2,079 2,185
Capital - - - - - -
Debt, Transfers & Other - - - - - -
Total 105,296 105,479 111,366 114,058 111,927 116,341
76
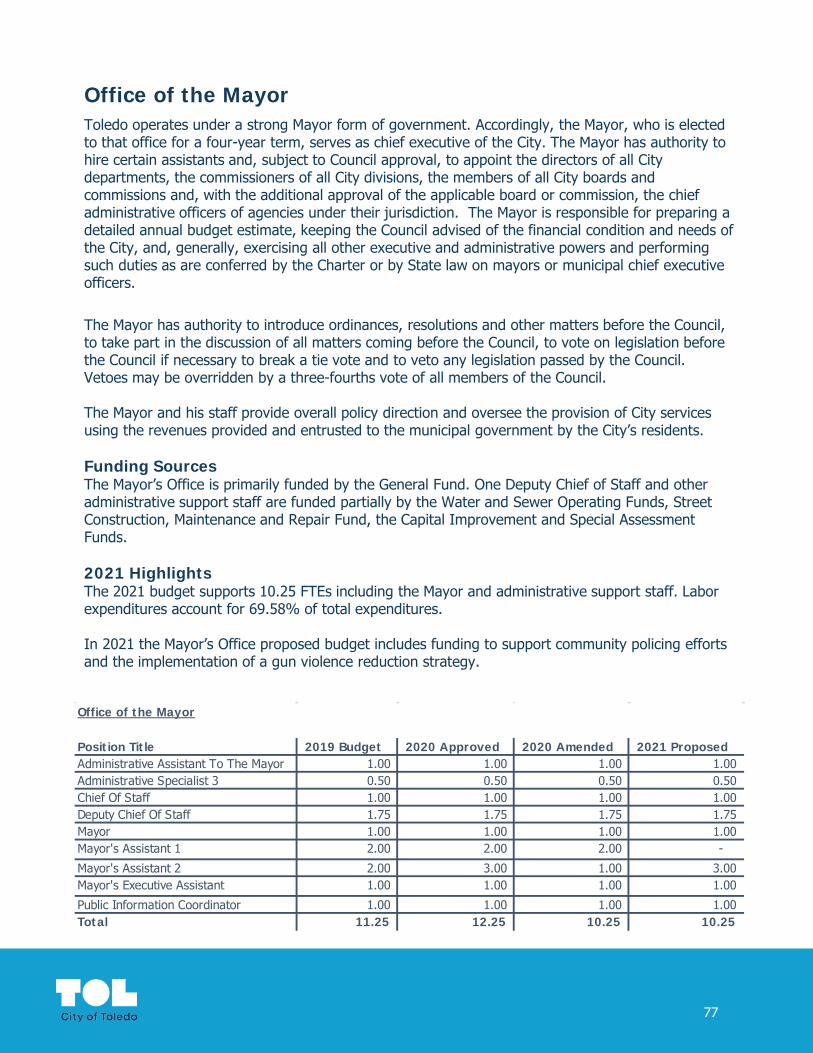
Office of the MayorToledo operates under a strong Mayor form of government. Accordingly, the Mayor, who is elected to that office for a four-year term, serves as chief executive of the City. The Mayor has authority to hire certain assistants and, subject to Council approval, to appoint the directors of all City departments, the commissioners of all City divisions, the members of all City boards and commissions and, with the additional approval of the applicable board or commission, the chief administrative officers of agencies under their jurisdiction. The Mayor is responsible for preparing a detailed annual budget estimate, keeping the Council advised of the financial condition and needs of the City, and, generally, exercising all other executive and administrative powers and performing such duties as are conferred by the Charter or by State law on mayors or municipal chief executive officers.
The Mayor has authority to introduce ordinances, resolutions and other matters before the Council, to take part in the discussion of all matters coming before the Council, to vote on legislation before the Council if necessary to break a tie vote and to veto any legislation passed by the Council. Vetoes may be overridden by a three-fourths vote of all members of the Council.
The Mayor and his staff provide overall policy direction and oversee the provision of City services using the revenues provided and entrusted to the municipal government by the City’s residents.
Funding SourcesThe Mayor’s Office is primarily funded by the General Fund. One Deputy Chief of Staff and other administrative support staff are funded partially by the Water and Sewer Operating Funds, Street Construction, Maintenance and Repair Fund, the Capital Improvement and Special Assessment Funds.
2021 HighlightsThe 2021 budget supports 10.25 FTEs including the Mayor and administrative support staff. Labor expenditures account for 69.58% of total expenditures.
In 2021 the Mayor’s Office proposed budget includes funding to support community policing efforts and the implementation of a gun violence reduction strategy.
Office of the Mayor
Position Title 2019 Budget 2020 Approved 2020 Amended 2021 ProposedAdministrative Assistant To The Mayor 1.00 1.00 1.00 1.00 Administrative Specialist 3 0.50 0.50 0.50 0.50 Chief Of Staff 1.00 1.00 1.00 1.00 Deputy Chief Of Staff 1.75 1.75 1.75 1.75 Mayor 1.00 1.00 1.00 1.00 Mayor's Assistant 1 2.00 2.00 2.00 -
Mayor's Assistant 2 2.00 3.00 1.00 3.00 Mayor's Executive Assistant 1.00 1.00 1.00 1.00
Public Information Coordinator 1.00 1.00 1.00 1.00 Total 11.25 12.25 10.25 10.25
77
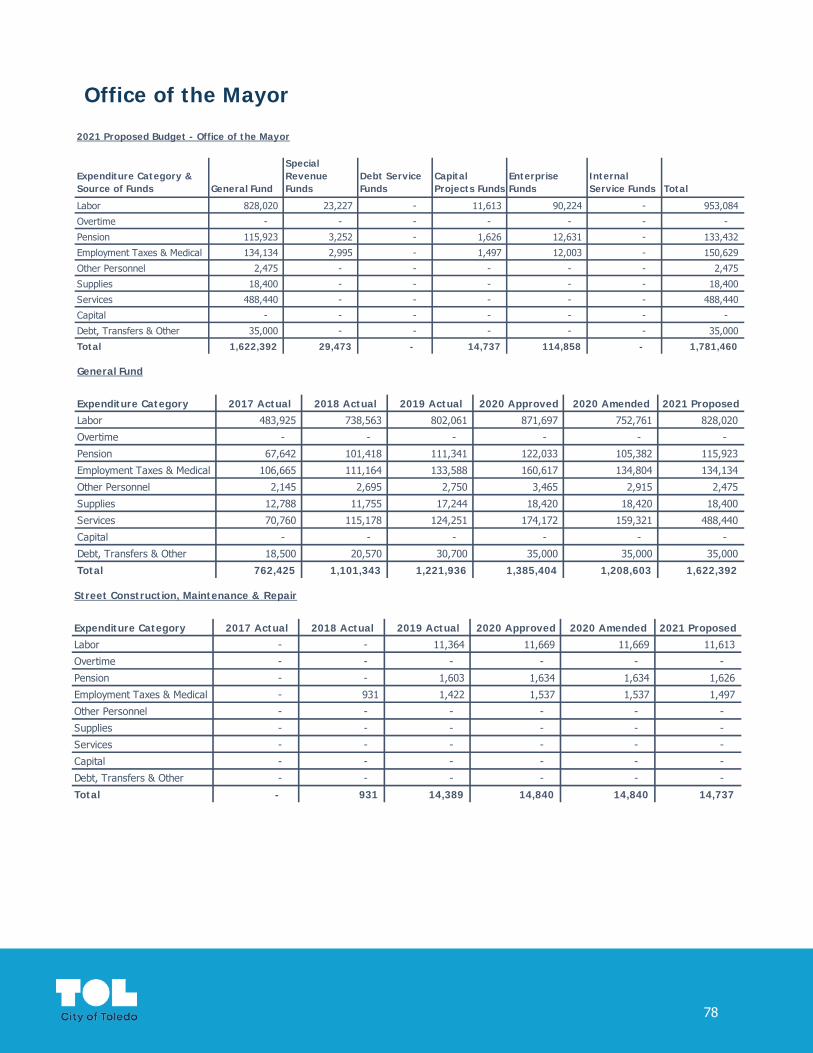
Office of the Mayor
General Fund
Expenditure Category 2017 Actual 2018 Actual 2019 Actual 2020 Approved 2020 Amended 2021 Proposed
Labor 483,925 738,563 802,061 871,697 752,761 828,020
Overtime - - - - - -
Pension 67,642 101,418 111,341 122,033 105,382 115,923
Employment Taxes & Medical 106,665 111,164 133,588 160,617 134,804 134,134
Other Personnel 2,145 2,695 2,750 3,465 2,915 2,475
Supplies 12,788 11,755 17,244 18,420 18,420 18,400
Services 70,760 115,178 124,251 174,172 159,321 488,440
Capital - - - - - -
Debt, Transfers & Other 18,500 20,570 30,700 35,000 35,000 35,000
Total 762,425 1,101,343 1,221,936 1,385,404 1,208,603 1,622,392
Street Construction, Maintenance & Repair
Expenditure Category 2017 Actual 2018 Actual 2019 Actual 2020 Approved 2020 Amended 2021 Proposed
Labor - - 11,364 11,669 11,669 11,613
Overtime - - - - - -
Pension - - 1,603 1,634 1,634 1,626
Employment Taxes & Medical - 931 1,422 1,537 1,537 1,497
Other Personnel - - - - - -
Supplies - - - - - -
Services - - - - - -
Capital - - - - - -
Debt, Transfers & Other - - - - - -
Total - 931 14,389 14,840 14,840 14,737
2021 Proposed Budget - Office of the Mayor
Expenditure Category & Source of Funds General Fund
Special Revenue Funds
Debt Service Funds
Capital Projects Funds
Enterprise Funds
Internal Service Funds Total
Labor 828,020 23,227 - 11,613 90,224 - 953,084
Overtime - - - - - - -
Pension 115,923 3,252 - 1,626 12,631 - 133,432
Employment Taxes & Medical 134,134 2,995 - 1,497 12,003 - 150,629
Other Personnel 2,475 - - - - - 2,475
Supplies 18,400 - - - - - 18,400
Services 488,440 - - - - - 488,440
Capital - - - - - - -
Debt, Transfers & Other 35,000 - - - - - 35,000
Total 1,622,392 29,473 - 14,737 114,858 - 1,781,460
78

Office of the Mayor
Special Assessment Services
Expenditure Category 2017 Actual 2018 Actual 2019 Actual 2020 Approved 2020 Amended 2021 Proposed
Labor 9,224 10,481 11,364 11,669 11,669 11,613
Overtime - - - - - -
Pension 1,290 1,454 1,589 1,634 1,634 1,626
Employment Taxes & Medical 1,428 1,270 1,421 1,537 1,537 1,497
Other Personnel - - - - - -
Supplies - - - - - -
Services - - - - - -
Capital - - - - - -
Debt, Transfers & Other - - - - - -
Total 11,943 13,204 14,374 14,840 14,840 14,737
Water
Expenditure Category 2017 Actual 2018 Actual 2019 Actual 2020 Approved 2020 Amended 2021 Proposed
Labor 52,579 48,965 52,685 66,927 66,927 55,160
Overtime - - - - - -
Pension 7,353 6,778 7,371 9,370 9,370 7,722
Employment Taxes & Medical 9,843 8,528 9,608 10,535 10,535 7,483
Other Personnel 110 - - 110 110 -
Supplies - - - - - -
Services - - - - - -
Capital - - - - - -
Debt, Transfers & Other - - - - - -
Total 69,886 64,271 69,664 86,942 86,942 70,365
Capital Improvement
Expenditure Category 2017 Actual 2018 Actual 2019 Actual 2020 Approved 2020 Amended 2021 ProposedLabor 9,224 10,481 11,364 11,669 11,669 11,613 Overtime - - - - - - Pension 1,290 1,454 1,589 1,634 1,634 1,626 Employment Taxes & Medical 1,428 1,270 1,421 1,537 1,537 1,497 Other Personnel - - - - - - Supplies - - - - - - Services 35,714 - - - - - Capital - - - - - - Debt, Transfers & Other - - - - - - Total 47,657 13,204 14,374 14,840 14,840 14,737
79

Office of the Mayor
Sewer
Expenditure Category 2017 Actual 2018 Actual 2019 Actual 2020 Approved 2020 Amended 2021 Proposed
Labor 27,675 31,442 34,090 35,175 35,175 35,064
Overtime - - - - - -
Pension 3,870 4,361 4,768 4,925 4,925 4,909
Employment Taxes & Medical 4,287 3,826 4,283 4,633 4,633 4,521
Other Personnel - - - - - -
Supplies - - - - - -
Services - - - - - -
Capital - - - - - -
Debt, Transfers & Other - - - - - -
Total 35,832 39,629 43,141 44,733 44,733 44,493
80

Toledo-Lucas County Plan CommissionThe Toledo-Lucas County Plan Commission seeks to create a community with a high quality of life and access to economic opportunity for all residents. The Plan Commission provides guidance on land use decisions and coordinates planning functions among constituent jurisdictions – The City of Toledo, Lucas County, and the eleven Lucas County townships.
Funding SourcesThe Plan Commission is funded through the General Fund, Federal Block Grant Funds, grants funding from Lucas County, and the Capital Improvement Fund.
2021 HighlightsThe Plan Commission is responsible for updating the comprehensive plan for the City of Toledo. This establishes the overall character, extent and location of various land uses.
The City of Toledo General Fund provides 71.57% of funding for the Plan Commission, while the remaining funding is provided by Lucas County, federal block grants and capital improvement funds.
Labor expenditures for the Plan Commission constitute 89.52% of total budget. In 2021, the proposed budget funds additional planning positions to support sign code compliance efforts and upcoming new planning projects, including the Comprehensive Plan.
Plan Commission
Position Title 2019 Budget 2020 Approved 2020 Amended 2021 ProposedAdministrative Assistant - 1.00 1.00 1.00 Administrator-Administrative Services 2 1.00 1.00 1.00 1.00 Associate Planner 2.00 4.00 2.00 2.00 Clerk Specialist 1 1.00 1.00 1.00 - Clerk Specialist 2 - - - 1.00 Director-Toledo Lucas County Plan Commission 1.00 1.00 1.00 1.00
Landscape & Site Plan Inspector 0.50 1.00 - - Planner 2.00 3.00 3.00 4.00
Planning Technician 0.50 - - - Principal Planner 2.00 2.00 2.00 2.00 Secretary 3 1.00 - - -
Sign & Zoning Compliance Officer - - - 0.67 Total 11.00 14.00 11.00 12.67
81

Toledo-Lucas County Plan Commission
General Fund
Expenditure Category 2017 Actual 2018 Actual 2019 Actual 2020 Approved 2020 Amended 2021 Proposed
Labor 280,279 313,150 367,689 604,882 427,202 570,553
Overtime 6,651 15,109 18,323 5,600 5,600 10,000
Pension 39,812 44,899 53,112 85,468 60,592 81,277
Employment Taxes & Medical 58,658 56,782 76,074 133,101 90,341 114,121
Other Personnel 2,380 2,480 3,570 3,025 3,025 3,025
Supplies 8,881 10,158 12,467 11,800 10,995 19,700
Services 32,310 31,971 55,630 120,066 111,037 113,982
Capital - - - - - -
Debt, Transfers & Other - - - - - -
Total 428,972 474,549 586,865 963,942 708,793 912,658
Federal Grants
Expenditure Category 2017 Actual 2018 Actual 2019 Actual 2020 Approved 2020 Amended 2021 Proposed
Labor 64,144 63,443 63,917 70,910 83,247 68,232
Overtime 468 (305) 261 - (261) -
Pension 8,913 8,968 9,459 9,927 11,190 9,552
Employment Taxes & Medical 15,892 15,502 18,561 14,501 26,398 14,337
Other Personnel 550 550 577 550 1,051 550
Supplies - - - - - -
Services - - - - - -
Capital - - - - - -
Debt, Transfers & Other - - - - - -
Total 89,966 88,158 92,775 95,888 121,624 92,671
2021 Proposed Budget - Plan Commission
Expenditure Category & Source of Funds General Fund
Special Revenue Funds
Debt Service Funds
Capital Projects Funds
Enterprise Funds
Internal Service Funds Total
Labor 570,553 196,554 - 60,863 - - 827,970
Overtime 10,000 - - - - - 10,000
Pension 81,277 27,518 - 8,521 - - 117,316
Employment Taxes & Medical 114,121 52,895 - 14,230 - - 181,247
Other Personnel 3,025 1,375 - 550 - - 4,950
Supplies 19,700 - - - - - 19,700
Services 113,982 - - - - - 113,982
Capital - - - - - - -
Debt, Transfers & Other - - - - - - -
Total 912,658 278,341 - 84,164 - - 1,275,164
82

Toledo-Lucas County Plan Commission
Operation Grants
Expenditure Category 2017 Actual 2018 Actual 2019 Actual 2020 Approved 2020 Amended 2021 Proposed
Labor 155,329 165,813 203,985 157,490 170,826 128,322
Overtime 2,625 4,189 5,415 - - -
Pension 21,874 22,874 23,021 22,049 23,800 17,965
Employment Taxes & Medical 38,483 44,445 52,445 39,168 37,844 38,558
Other Personnel 968 825 1,055 825 - 825
Supplies 7,557 9,277 - - - -
Services 1,302 3,917 - - 25,000 -
Capital - - - - - -
Debt, Transfers & Other - - - - - -
Total 228,138 251,340 285,921 219,531 257,470 185,670
Capital Improvement
Expenditure Category 2017 Actual 2018 Actual 2019 Actual 2020 Approved 2020 Amended 2021 Proposed
Labor 55,895 56,779 50,542 62,656 62,656 60,863
Overtime 2,424 1,605 409 - - -
Pension 7,791 7,956 6,985 8,772 8,772 8,521
Employment Taxes & Medical 13,786 11,939 13,363 14,336 14,336 14,230
Other Personnel 550 550 550 550 550 550
Supplies - - - - - -
Services - - - - - -
Capital - - - - - -
Debt, Transfers & Other - - - - - -
Total 80,447 78,829 71,849 86,314 86,314 84,164
83
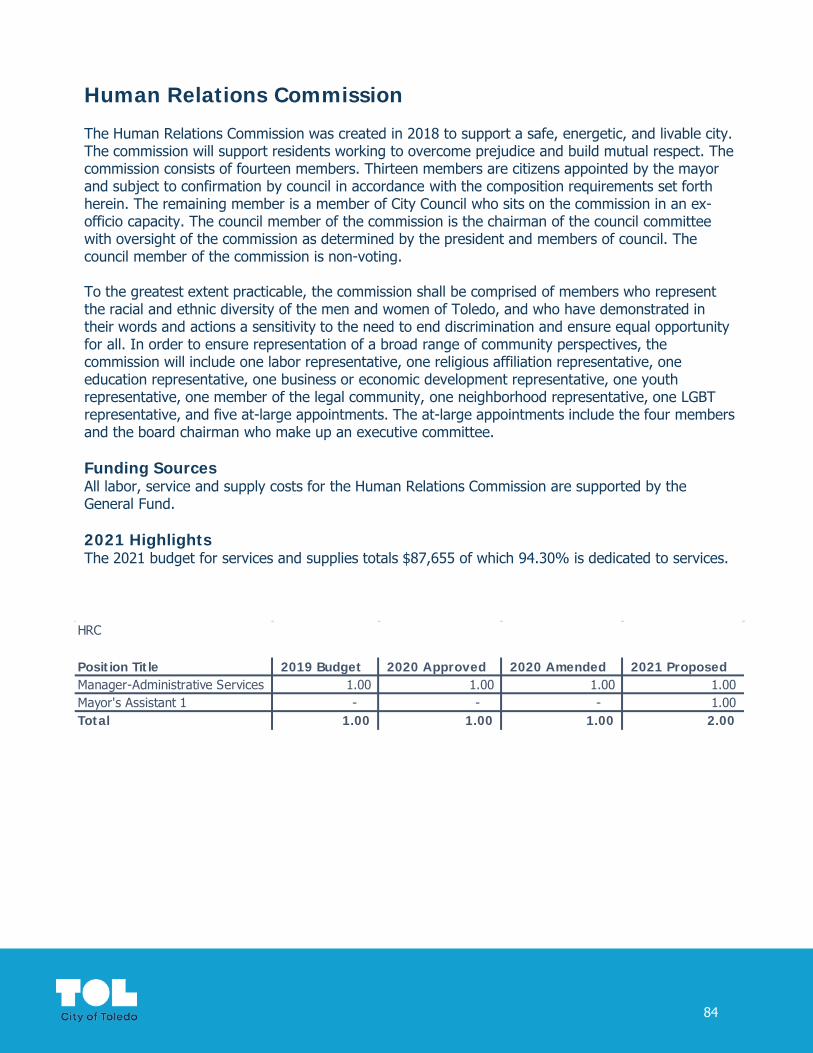
Human Relations Commission
The Human Relations Commission was created in 2018 to support a safe, energetic, and livable city. The commission will support residents working to overcome prejudice and build mutual respect. The commission consists of fourteen members. Thirteen members are citizens appointed by the mayor and subject to confirmation by council in accordance with the composition requirements set forth herein. The remaining member is a member of City Council who sits on the commission in an ex-officio capacity. The council member of the commission is the chairman of the council committee with oversight of the commission as determined by the president and members of council. The council member of the commission is non-voting.
To the greatest extent practicable, the commission shall be comprised of members who represent the racial and ethnic diversity of the men and women of Toledo, and who have demonstrated in their words and actions a sensitivity to the need to end discrimination and ensure equal opportunity for all. In order to ensure representation of a broad range of community perspectives, the commission will include one labor representative, one religious affiliation representative, one education representative, one business or economic development representative, one youth representative, one member of the legal community, one neighborhood representative, one LGBT representative, and five at-large appointments. The at-large appointments include the four members and the board chairman who make up an executive committee.
Funding SourcesAll labor, service and supply costs for the Human Relations Commission are supported by the General Fund.
2021 HighlightsThe 2021 budget for services and supplies totals $87,655 of which 94.30% is dedicated to services.
HRC
Position Title 2019 Budget 2020 Approved 2020 Amended 2021 ProposedManager-Administrative Services 1.00 1.00 1.00 1.00 Mayor's Assistant 1 - - - 1.00 Total 1.00 1.00 1.00 2.00
84

Human Relations Commission
General Fund
Expenditure Category 2017 Actual 2018 Actual 2019 Actual 2020 Approved 2020 Amended 2021 Proposed
Labor - - 67,846 65,500 65,500 104,208
Overtime - - - - - -
Pension - - 9,544 9,170 9,170 14,589
Employment Taxes & Medical - 231 13,219 14,385 14,385 28,199
Other Personnel - - - - - 550
Supplies - - 1,473 9,000 9,000 5,000
Services - 1,207 40,027 56,584 37,856 82,655
Capital - - - - - -
Debt, Transfers & Other - - - - - -
Total - 1,437 132,110 154,639 135,911 235,201
85

Office of Diversity & Inclusion
The Office of Diversity & Inclusion was created to administer programs, activities and services to ensure compliance with the Civil Rights Act and the Americans with Disabilities Act and to enforce the City’s prevailing wage regulations. The Office of Diversity & Inclusion exists to enforce all administrative policies under its jurisdiction and to assist the City of Toledo in achieving a dynamic, diverse workforce, enforce fair labor standards, and create a climate of inclusiveness that encourages small, minority, and female owned businesses to bid and receive City contracts.
Funding SourcesThe Office of Diversity & Inclusion is supported 70.58% General Fund. Additional funding in the 2021 proposed budget is provided by the Water, Sewer and Storm Water utility funds, the Street Construction, Maintenance & Repair Fund and the Special Assessment Services Fund.
2021 HighlightsThe 2021 budget supports 9.00 FTEs. Personnel costs account for 56.26% of the department’s budget.
The 2021 budget for services and supplies totals $584,053 and will support initiatives surrounding the City’s diversity and inclusion programs, including a disparity study to be completed in 2021.
Diversity & Inclusion
Position Title 2019 Budget 2020 Approved 2020 Amended 2021 ProposedAdministrative Analyst 1 1.00 1.00 1.00 - Administrative Analyst 2 - - - 4.00 Administrative Assistant - 1.00 1.00 1.00 Administrative Specialist 1 - - - 1.00 Administrative Specialist 3 2.75 2.00 1.17 - Director-Administrative Services 1.00 1.00 1.00 1.00
Manager-Administrative Services - 2.00 1.00 2.00 Secretary 3 1.00 - - -
Total 5.75 7.00 5.17 9.00
86

Office of Diversity & Inclusion
General Fund
Expenditure Category 2017 Actual 2018 Actual 2019 Actual 2020 Approved 2020 Amended 2021 Proposed
Labor 253,691 262,510 329,838 465,148 316,481 479,353
Overtime - - - - - -
Pension 35,493 36,654 46,119 65,121 43,187 67,109
Employment Taxes & Medical 58,579 51,144 66,393 91,168 95,930 100,363
Other Personnel 1,788 1,788 1,788 2,200 2,200 2,200
Supplies 984 1,034 10,554 270 770 170
Services 24,125 16,893 49,270 84,135 376,906 323,883
Capital - - - - - -
Debt, Transfers & Other - - - 25,000 25,000 50,000
Total 374,659 370,022 503,962 733,042 860,474 1,023,078
2021 Proposed Budget -Diversity & Inclusion
Expenditure Category & Source of Funds General Fund
Special Revenue Funds
Debt Service Funds
Capital Projects Funds
Enterprise Funds
Internal Service Funds Total
Labor 479,353 60,064 - - 60,064 - 599,481
Overtime - - - - - - -
Pension 67,109 8,410 - - 8,409 - 83,928
Employment Taxes & Medical 100,363 14,218 - - 14,219 - 128,800
Other Personnel 2,200 550 - - 550 - 3,300
Supplies 170 - - - - - 170
Services 323,883 - - - 260,000 - 583,883
Capital - - - - - - -
Debt, Transfers & Other 50,000 - - - - - 50,000
Total 1,023,078 83,242 - - 343,242 - 1,449,563
87

Office of Diversity & Inclusion
Sewer
Expenditure Category 2017 Actual 2018 Actual 2019 Actual 2020 Approved 2020 Amended 2021 Proposed
Labor - - - - - -
Overtime - - - - - -
Pension - - - - - -
Employment Taxes & Medical - - - - - -
Other Personnel - - - - - -
Supplies - - - - - -
Services - - - - - 67,248
Capital - - - - - -
Debt, Transfers & Other - - - - - -
Total - - - - - 67,248
Storm Water
Expenditure Category 2017 Actual 2018 Actual 2019 Actual 2020 Approved 2020 Amended 2021 Proposed
Labor - - - - - -
Overtime - - - - - -
Pension - - - - - -
Employment Taxes & Medical - - - - - -
Other Personnel - - - - - -
Supplies - - - - - -
Services - - - - - 9,745
Capital - - - - - -
Debt, Transfers & Other - - - - - -
Total - - - - - 9,745
88

Office of Diversity & Inclusion
Street Construction, Maintenance & Repair Fund
Expenditure Category 2017 Actual 2018 Actual 2019 Actual 2020 Approved 2020 Amended 2021 Proposed
Labor - - - - - 30,032
Overtime - - - - - -
Pension - - - - - 4,205
Employment Taxes & Medical - - - - - 7,109
Other Personnel - - - - - 276
Supplies - - - - - -
Services - - - - - -
Capital - - - - - -
Debt, Transfers & Other - - - - - -
Total - - - - - 41,622
Special Assessment Services Fund
Expenditure Category 2017 Actual 2018 Actual 2019 Actual 2020 Approved 2020 Amended 2021 Proposed
Labor - - - - - 30,032
Overtime - - - - - -
Pension - - - - - 4,205
Employment Taxes & Medical - - - - - 7,109
Other Personnel - - - - - 274
Supplies - - - - - -
Services - - - - - -
Capital - - - - - -
Debt, Transfers & Other - - - - - -
Total - - - - - 41,620
89

Municipal Court Judges
The responsibility of the Toledo Municipal Court is to hear and dispose of cases within the Court's jurisdictional limits in a judicious and timely manner and provide opportunities for rehabilitation. The Court's operation is defined by the Federal and State Constitutions, the Ohio Revised Code, Toledo Municipal Code, State Civil and Criminal Procedural Rules, and the Rules of Superintendence.
The Ohio constitution establishes the legislative, executive and judicial branches of government. The judiciary is a separate and co-equal branch of government, with separate powers and responsibilities. The Toledo Municipal Court is comprised of seven Judges. Six Judges preside over a mixed criminal and civil docket. One Judge presides over environmental criminal and civil cases, which include housing, environmental and related matters.
Major departments of the Municipal Court include the Probation Department, the Court Services Department, the Civil Bailiff’s Office and the Citizens Dispute Settlement Program. The Probation Department provides a wide-range of services including pre-sentence investigations, alternative sentencing programs (including community service) and standard and specialized supervision of offenders. About 7,500 individuals are serviced by the department each year. The Court Services Department provides an array of direct services to the Courtrooms, including scheduling of cases and attendant case services such as interpretation and electronic monitoring coordination. The Civil Bailiff’s Office perfects service for civil legal documents, oversees evictions, enforces civil judgments and executes writs as required by the Ohio Revised Code and local court rules. In addition, the Court’s Citizens Dispute Settlement Program provides mediation services for over 1,000 cases a year, saving the Court time and money.
Funding SourcesMunicipal Court (Judges Division) operations are funded primarily through the General Fund. Approximately 97.77% of labor, service and supply costs are supported by the General Fund, while remaining expenses are funded with projected grant dollars in the 2021 proposed budget.
2021 HighlightsThe 2021 budget allocates $3,293,789 for services and supplies. This includes funding for court security services.
Personnel expenditures account for 71.33% of total 2021 proposed budget.
90

Municipal Court Judges
TMC Judges
Position Title 2019 Budget 2020 Approved 2020 Amended 2021 ProposedActing Administrative Assistant 1.00 - - - Acting Assignment Commissioner 1.00 - - - Administrative Assistant - 1.00 1.00 1.00 Assignment Clerk 5.25 5.00 5.00 2.00 Assistant Chief Bailiff ` 1.00 1.00 1.00 Assistant Chief Probation Officer 1.00 1.00 1.00 1.00
Assistant Court Services Commissioner - 1.00 1.00 1.00 Bailiff-Chief Courtroom 1.00 1.00 1.00 1.00
Bailiff-Courtroom 7.15 7.65 7.65 7.65 Bookkeeper/Payroll Clerk 1.00 1.00 0.60 1.00 Building Operations Chief 0.50 1.00 1.00 1.00
Chief Bailiff 1.00 1.00 1.00 1.00 Chief Probation Officer 1.00 1.00 1.00 1.00 Community Service Officer 2.00 - - - Court Administrator 1.00 1.00 1.00 1.00 Court Reporter 2.00 2.00 2.00 2.00 Court Security Bailiff 1.25 2.63 2.63 2.63 Court Services Commissioner - 1.00 1.00 1.00 Court Services Specialist 5.00 8.50 8.50 12.00 Deputy Bailiff 7.50 7.25 5.50 8.00
Deputy Court Administrator 1.00 1.00 1.00 1.00 Finance Officer 1.00 1.00 1.00 1.00 Housing Magistrate 1.00 1.00 1.00 1.00 Housing Specialist - 2.00 2.00 2.00
91
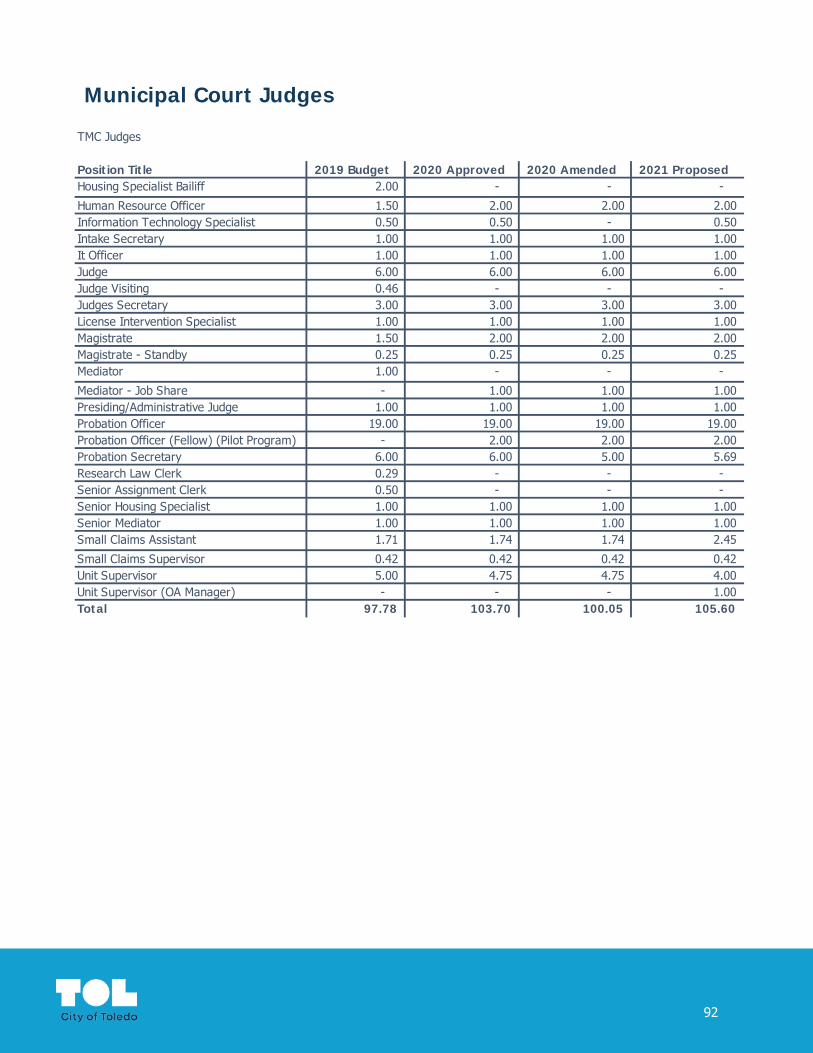
Municipal Court Judges
TMC Judges
Position Title 2019 Budget 2020 Approved 2020 Amended 2021 ProposedHousing Specialist Bailiff 2.00 - - -
Human Resource Officer 1.50 2.00 2.00 2.00 Information Technology Specialist 0.50 0.50 - 0.50 Intake Secretary 1.00 1.00 1.00 1.00 It Officer 1.00 1.00 1.00 1.00 Judge 6.00 6.00 6.00 6.00 Judge Visiting 0.46 - - - Judges Secretary 3.00 3.00 3.00 3.00 License Intervention Specialist 1.00 1.00 1.00 1.00 Magistrate 1.50 2.00 2.00 2.00 Magistrate - Standby 0.25 0.25 0.25 0.25 Mediator 1.00 - - -
Mediator - Job Share - 1.00 1.00 1.00 Presiding/Administrative Judge 1.00 1.00 1.00 1.00 Probation Officer 19.00 19.00 19.00 19.00 Probation Officer (Fellow) (Pilot Program) - 2.00 2.00 2.00 Probation Secretary 6.00 6.00 5.00 5.69 Research Law Clerk 0.29 - - - Senior Assignment Clerk 0.50 - - - Senior Housing Specialist 1.00 1.00 1.00 1.00 Senior Mediator 1.00 1.00 1.00 1.00 Small Claims Assistant 1.71 1.74 1.74 2.45
Small Claims Supervisor 0.42 0.42 0.42 0.42 Unit Supervisor 5.00 4.75 4.75 4.00 Unit Supervisor (OA Manager) - - - 1.00 Total 97.78 103.70 100.05 105.60
92

Municipal Court Judges
General Fund
Expenditure Category 2017 Actual 2018 Actual 2019 Actual 2020 Approved 2020 Amended 2021 ProposedLabor 3,936,599 3,959,654 4,342,410 5,358,514 4,989,800 5,620,425 Overtime - - - - - - Pension 544,477 551,182 602,778 749,997 698,377 786,859 Employment Taxes & Medical 1,197,233 1,078,356 1,229,511 1,420,366 1,366,293 1,447,307 Other Personnel 61,234 62,229 65,354 77,310 67,052 81,706 Supplies 111,680 125,551 94,163 181,300 151,300 162,250 Services 2,645,393 3,245,153 2,708,804 2,926,777 2,757,542 3,131,539 Capital - - - - - - Debt, Transfers & Other - - - - - - Total 8,496,616 9,022,126 9,043,019 10,714,265 10,030,364 11,230,087
Operation Grants
Expenditure Category 2017 Actual 2018 Actual 2019 Actual 2020 Approved 2020 Amended 2021 ProposedLabor 181,601 173,918 160,687 179,530 238,719 184,233 Overtime - - - - - - Pension 22,292 24,246 23,798 25,134 32,672 25,793 Employment Taxes & Medical 53,485 47,491 73,255 46,733 58,656 46,693 Other Personnel - - - - - - Supplies 16,877 21,814 4,150 - 28,785 - Services 529,558 480,489 836,994 - 933,660 - Capital - - - - - - Debt, Transfers & Other - - - - - - Total 803,812 747,959 1,098,884 251,397 1,292,492 256,719
93

Municipal Court Clerk
The Clerk of Toledo Municipal Court is responsible for maintaining the public record on all court cases in Toledo Municipal Court as well as collecting and distributing fines and fees associated with these cases. The Clerk strives to process all case filings in a timely manner and to provide excellent customer service to the public. The Clerk’s Office maintains all journals, records, books and papers belonging or pertaining to the Toledo Municipal Court. Additionally, the Clerk records the proceedings of the court, performs all other duties prescribed by the Judges Ohio Revised Code, and keeps a record of all receipts and disbursements, which are available for public inspection at all times.
Funding SourcesThe Clerk of Court’s 2021 proposed operating budget is supported 100% by the General Fund.
2021 HighlightsThe 2021 proposed budget supports 79.00 FTEs with a total labor cost of $5,110,308 and $2,395,260 for services and supplies.
The proposed budget for services has increased compared to prior years as a result of changes in the City’s traffic citation photo enforcement program, which will be coordinated through the Clerk of Court’s beginning in 2021.
TMC Clerk
Position Title 2019 Budget 2020 Approved 2020 Amended 2021 ProposedClerk Of Court 1.00 1.00 1.00 1.00 Deputy Clerk 79.00 79.00 76.67 78.00 Total 80.00 80.00 77.67 79.00
General Fund
Expenditure Category 2017 Actual 2018 Actual 2019 Actual 2020 Approved 2020 Amended 2021 ProposedLabor 3,111,635 3,132,046 3,236,982 3,421,869 3,239,887 3,467,911 Overtime 21,945 23,654 24,813 50,040 50,040 50,040 Pension 430,606 438,237 452,293 481,041 455,564 487,487 Employment Taxes & Medical 1,113,171 969,675 1,040,504 1,115,082 1,081,451 1,104,870 Other Personnel - - - - - - Supplies 353,422 578,412 510,502 491,200 479,500 447,100 Services 462,137 535,943 540,704 487,030 424,779 1,948,160 Capital - - - - - - Debt, Transfers & Other - - - - - - Total 5,492,916 5,677,968 5,805,798 6,046,262 5,731,220 7,505,568
94

Department of Development
The Department of Development implements programs and provides services to create employment opportunities through retention and growth of existing businesses and the attraction of new businesses, and to serve the public interest to protect the health, safety and welfare of our citizens by assuring that all buildings, structures, and related equipment are constructed, installed, and maintained in compliance with the standards contained within the currently adopted Ohio Building Codes and Toledo Municipal Code, while contributing to economic development.
The Department of Development is comprised of the Division of Economic Development and the Division of Building Inspection.
Economic Development
Division 2019 Budget 2020 Approved 2020 Amended 2021 Proposed16400-Economic Development 7.75 8.00 5.50 7.75 56300-Building Inspection 23.00 23.00 20.58 18.00 Total 30.75 31.00 26.08 25.75
Development
Position Title 2019 Budget 2020 Approved 2020 Amended 2021 Proposed
Administrative Analyst 2 0.75 - - - Administrative Specialist 2 - 2.00 0.50 - Administrative Specialist 3 1.00 1.00 1.00 1.00
Clerk Specialist 2 1.00 - - 1.00 Commissioner-Administrative Services 1.00 2.00 2.00 2.00 Director-Administrative Services - 1.00 - 0.75 Director-Neighborhoods & Business Development 1.00 - - - Manager-Administrative Services 2.00 2.00 2.00 2.00 Mayor's Assistant 2 1.00 - - 1.00 Total 7.75 8.00 5.50 7.75
95

Department of Development
Economic DevelopmentThe Division of Economic Development implements programs and provides services integral to achieving the goals of the City. The department assists in the attraction, growth and retention of private sector companies by eliminating barriers and providing financial resources and technical assistance. The Division also includes the Real Estate section, which is responsible for the management of the city’s real estate portfolio and disposition strategy for surplus property.
Funding SourcesThe Department of Development is funded primarily through General Fund dollars.
2021 HighlightsThe 2021 budget funds 8.00 FTEs with a total personnel cost of $811,348.
Funding for non-personnel expenditures totals $1,748,257 and supports costs for property tax payments and business incentive payments.
2021 Proposed Budget -Economic Development
Expenditure Category & Source of Funds General Fund
Special Revenue Funds
Debt Service Funds
Capital Projects Funds
Enterprise Funds
Internal Service Funds Total
Labor 1,712,896 9,188 - - 51,715 - 1,773,798
Overtime 70,000 - - - - - 70,000
Pension 249,605 1,286 - - 7,240 - 258,132
Employment Taxes & Medical 356,137 2,146 - - 12,077 - 370,360
Other Personnel 3,850 - - - - - 3,850
Supplies 35,400 - - - - - 35,400
Services 2,057,726 - - - - - 2,057,726
Capital - - - - - - -
Debt, Transfers & Other - - - - - - -
Total 4,485,614 12,620 - - 71,032 - 4,569,266
General Fund
Expenditure Category 2017 Actual 2018 Actual 2019 Actual 2020 Approved 2020 Amended 2021 Proposed
Labor 338,996 333,550 436,566 670,776 449,514 611,715
Overtime - - - 6,500 6,500 -
Pension 47,559 44,767 59,879 92,982 62,005 85,640
Employment Taxes & Medical 69,348 73,008 101,057 118,062 80,995 112,343
Other Personnel 770 1,100 1,100 1,650 1,100 1,650
Supplies 3,289 5,555 4,701 5,770 5,770 7,400
Services 793,457 798,444 1,173,566 1,427,709 1,529,286 1,740,857
Capital - - - - - -
Debt, Transfers & Other - - - - - -
Total 1,253,418 1,256,423 1,776,871 2,323,448 2,135,170 2,559,605
96

Department of Development
Building InspectionThe Division of Inspection is a state-certified building inspection department enforcing the building and zoning codes of the state of Ohio and the City of Toledo to ensure the safety of public structures. The division’s goal is to provide professional and efficient service to citizens while processing permits, reviewing plans, performing inspections and issuing certificates of occupancy.
Funding SourcesThe Department of Development is funded primarily through General Fund dollars.
2021 HighlightsThe 2021 proposed budget funds 18.00 FTEs with a total personnel cost of $1,618,999.
Inspection is continuing to implement a new licensing and permitting system in 2021 to enable the department to connect with citizens and streamline processes related to land management, asset management, licensing, and public health & safety. Initial implementation costs are supported by the CIP fund.
General Fund
Expenditure Category 2017 Actual 2018 Actual 2019 Actual 2020 Approved 2020 Amended 2021 Proposed
Labor 1,009,373 1,017,299 1,155,218 1,299,573 1,087,321 1,101,180
Overtime 82,503 67,940 76,047 71,500 71,500 70,000
Pension 155,590 170,188 164,288 200,042 168,647 163,965
Employment Taxes & Medical 294,061 284,551 290,931 315,858 316,373 243,794
Other Personnel 2,298 2,346 1,708 1,650 1,650 2,200
Supplies 36,134 31,751 25,563 36,500 36,500 28,000
Services 446,875 429,954 391,522 399,967 343,869 316,869
Capital - - - - - -
Debt, Transfers & Other - (1) - - - -
Total 2,026,834 2,004,028 2,105,277 2,325,090 2,025,859 1,926,009
Street Construction Maintenance & Repair
Expenditure Category 2017 Actual 2018 Actual 2019 Actual 2020 Approved 2020 Amended 2021 Proposed
Labor 7,786 7,898 8,015 8,266 8,266 9,188
Overtime 90 - 292 - - -
Pension 1,089 1,106 1,122 1,157 1,157 1,286
Employment Taxes & Medical 2,042 1,774 2,012 2,130 2,130 2,146
Other Personnel - - - - - -
Supplies - - - - - -
Services - - - - - -
Capital - - - - - -
Debt, Transfers & Other - - - - - -
Total 11,007 10,777 11,441 11,554 11,554 12,620
97

Department of Development
Building Inspection
Sewer
Expenditure Category 2017 Actual 2018 Actual 2019 Actual 2020 Approved 2020 Amended 2021 Proposed
Labor 7,786 7,898 8,015 8,266 8,266 9,188
Overtime 90 - 292 - - -
Pension 1,089 1,106 1,122 1,157 1,157 1,286
Employment Taxes & Medical 2,042 1,774 2,012 2,130 2,130 2,146
Other Personnel - - - - - -
Supplies - - - - - -
Services - - - - - -
Capital - - - - - -
Debt, Transfers & Other - - - - - -
Total 11,007 10,777 11,441 11,554 11,554 12,620
Utility Administration
Expenditure Category 2017 Actual 2018 Actual 2019 Actual 2020 Approved 2020 Amended 2021 Proposed
Labor 36,334 7,898 8,015 8,266 8,266 9,188
Overtime 90 - 292 - - -
Pension 1,089 1,106 1,122 1,157 1,157 1,286
Employment Taxes & Medical 2,042 1,774 2,012 2,130 2,130 2,146
Other Personnel - - - - - -
Supplies - - - - - -
Services - - - - - -
Capital - - - - - -
Debt, Transfers & Other - - - - - -
Total 39,555 10,777 11,441 11,554 11,554 12,620
98

Department of Finance
The Department of Finance is responsible for safeguarding the assets of the City of Toledo by providing effective stewardship of public funds, timely financial reporting, and commitment to excellence in public service. It is the responsibility of the department to continuously improve the coffers of the City by assisting and advising the operating divisions in their financial operations. The Department of Finance is comprised of the Divisions of Finance Administration, Financial Analysis, Treasury and Taxation, Accounts, Purchasing and Supplies, Debt Management and the ERP team.
Finance
Funds Center Name 2019 Budget 2020 Approved 2020 Amended 2021 Proposed11100-Financial Analysis 4.00 4.00 3.58 3.00 14100-Finance Administration 1.75 2.00 2.00 2.00 14200-Treasury 5.00 5.00 5.00 6.76 14400-Taxation 34.00 33.75 32.50 31.75 14600-Accounts 11.50 13.50 11.00 11.00 14700-Finance ERP 1.50 2.00 1.00 1.00
14800-Debt Management 2.00 2.00 2.00 1.25 17700-Purchasing & Supplies 5.10 6.85 5.43 4.75
Total 64.84 69.10 62.51 61.51
Financial Analysis
Position Title 2019 Budget 2020 Approved 2020 Amended 2021 ProposedAdministrative Analyst 3 2.00 2.00 2.00 2.00 Commissioner-Administrative Services 1.00 1.00 1.00 - Deputy Director - - - 1.00 Manager-Administrative Services 1.00 1.00 0.58 - Total 4.00 4.00 3.58 3.00
Finance Administration
Position Title 2019 Budget 2020 Approved 2020 Amended 2021 ProposedAdministrative Analyst 3 - 1.00 1.00 - Administrative Assistant - - - 1.00 Director-Administrative Services 1.00 1.00 1.00 1.00 Secretary 3 0.75 - - - Total 1.75 2.00 2.00 2.00
99

Department of Finance
Treasury
Position Title 2019 Budget 2020 Approved 2020 Amended 2021 ProposedAdministrative Analyst 1 - - - 0.75 Administrative Analyst 4 1.00 - - - Administrative Services Officer 2 1.00 2.00 2.00 2.00 Administrative Specialist 3 1.00 1.00 1.00 1.00 Clerk Specialist 2 2.00 2.00 2.00 2.00 Commissioner-Administrative Services - - - 1.00 Total 5.00 5.00 5.00 6.76
Taxation
Position Title 2019 Budget 2020 Approved 2020 Amended 2021 ProposedAdministrative Analyst 1 - 0.75 0.75 1.00 Administrative Services Officer 1 1.00 1.00 1.00 3.00 Administrative Specialist 2.00 2.00 2.00 - Administrative Specialist 2 10.00 18.00 18.00 20.75 Administrative Technician 1 1.00 1.00 1.00 - Administrator-Administrative Services 1 1.00 1.00 1.00 1.00 Clerk Specialist 1 2.00 - - - Clerk Specialist 2 5.00 - - -
Collector-Investigator 3.00 9.00 7.75 5.00 Commissioner-Administrative Services 1.00 1.00 1.00 1.00 Tax Auditor 8.00 - - - Total 34.00 33.75 32.50 31.75
Accounts
Position Title 2019 Budget 2020 Approved 2020 Amended 2021 ProposedAdministrative Analyst 3 2.50 3.00 2.33 2.00 Administrative Analyst 4 - - - 1.00 Administrative Services Officer 2 1.00 1.00 1.00 - Administrative Specialist 1 1.00 1.00 1.00 1.00 Administrative Technician 1.00 1.00 1.00 1.00 Clerk Specialist 2 4.00 4.83 3.00 3.00 Commissioner-Administrative Services 1.00 1.00 1.00 1.00 Manager-Administrative Services 1.00 1.67 1.67 2.00 Total 11.50 13.50 11.00 11.00
100

Department of Finance
Finance ERP
Position Title 2019 Budget 2020 Approved 2020 Amended 2021 ProposedAdministrative Analyst 2 0.50 1.00 - - Administrative Analyst 4 1.00 1.00 1.00 1.00 Total 1.50 2.00 1.00 1.00
Debt Management
Position Title 2019 Budget 2020 Approved 2020 Amended 2021 ProposedAdministrative Analyst 3 - 1.00 1.00 1.00 Administrator-Administrative Services 1 1.00 - - - Commissioner-Administrative Services 1.00 1.00 1.00 0.25 Total 2.00 2.00 2.00 1.25
Purchasing
Position Title 2019 Budget 2020 Approved 2020 Amended 2021 ProposedAdministrative Analyst 2 1.00 0.25 0.25 - Administrative Analyst 3 - - - 2.00 Administrative Analyst 4 - 3.00 2.00 - Buyer 1.00 1.00 1.00 1.00 Clerk Specialist 2 1.50 1.00 1.00 1.00 Commissioner-Administrative Services 1.00 1.00 1.00 0.75 Duplicating Technician 0.60 0.60 0.18 - Total 5.10 6.85 5.43 4.75
2021 Proposed Budget -Finance
Expenditure Category & Source of Funds General Fund
Special Revenue Funds
Debt Service Funds
Capital Projects Funds
Enterprise Funds
Internal Service Funds Total
Labor 3,721,052 218,375 - 55,129 - - 3,994,556 Overtime 49,440 7,500 - - - - 56,940 Pension 514,590 31,623 - 7,718 - - 553,930 Employment Taxes & Medical 825,169 41,978 - 10,816 - - 877,963 Other Personnel 14,905 1,265 - 330 - - 16,500 Supplies 146,385 200,800 - - - 230,800 577,985 Services 1,373,912 883,543 - 286,804 205,455 304,903 3,054,617 Capital - - - - - - - Debt, Transfers & Other 151,000 25,808,624 17,247,569 33,470,501 68,027,678 287,713 144,993,085 Total 6,796,453 27,193,708 17,247,569 33,831,298 68,233,133 823,416 154,125,577
101
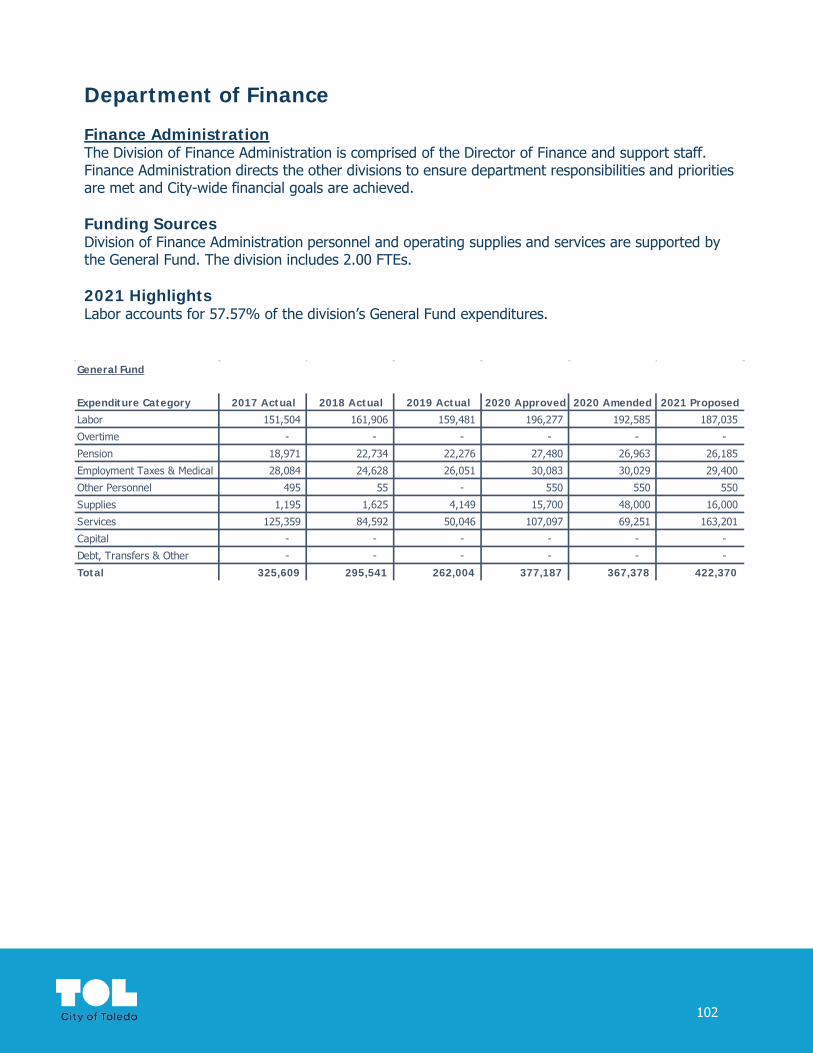
Department of Finance
Finance AdministrationThe Division of Finance Administration is comprised of the Director of Finance and support staff. Finance Administration directs the other divisions to ensure department responsibilities and priorities are met and City-wide financial goals are achieved.
Funding SourcesDivision of Finance Administration personnel and operating supplies and services are supported by the General Fund. The division includes 2.00 FTEs.
2021 HighlightsLabor accounts for 57.57% of the division’s General Fund expenditures.
General Fund
Expenditure Category 2017 Actual 2018 Actual 2019 Actual 2020 Approved 2020 Amended 2021 Proposed
Labor 151,504 161,906 159,481 196,277 192,585 187,035
Overtime - - - - - -
Pension 18,971 22,734 22,276 27,480 26,963 26,185
Employment Taxes & Medical 28,084 24,628 26,051 30,083 30,029 29,400
Other Personnel 495 55 - 550 550 550
Supplies 1,195 1,625 4,149 15,700 48,000 16,000
Services 125,359 84,592 50,046 107,097 69,251 163,201
Capital - - - - - -
Debt, Transfers & Other - - - - - -
Total 325,609 295,541 262,004 377,187 367,378 422,370
102
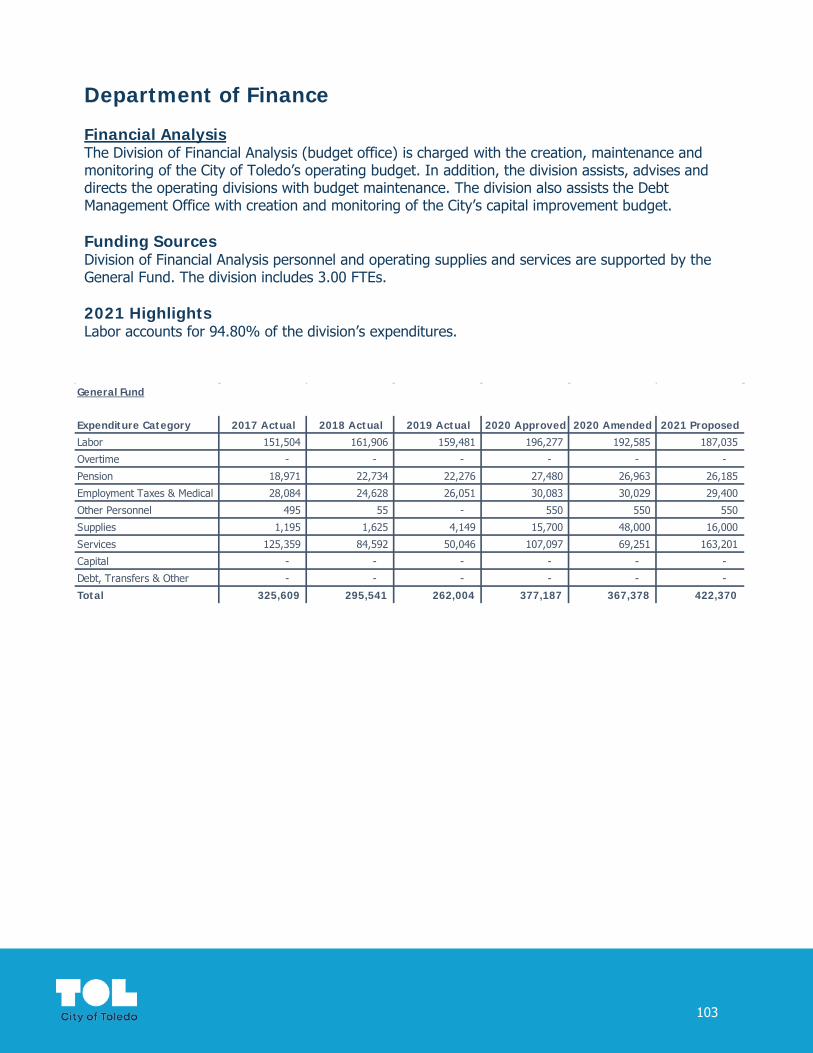
Department of Finance
Financial AnalysisThe Division of Financial Analysis (budget office) is charged with the creation, maintenance and monitoring of the City of Toledo’s operating budget. In addition, the division assists, advises and directs the operating divisions with budget maintenance. The division also assists the Debt Management Office with creation and monitoring of the City’s capital improvement budget.
Funding SourcesDivision of Financial Analysis personnel and operating supplies and services are supported by the General Fund. The division includes 3.00 FTEs.
2021 HighlightsLabor accounts for 94.80% of the division’s expenditures.
General Fund
Expenditure Category 2017 Actual 2018 Actual 2019 Actual 2020 Approved 2020 Amended 2021 Proposed
Labor 151,504 161,906 159,481 196,277 192,585 187,035
Overtime - - - - - -
Pension 18,971 22,734 22,276 27,480 26,963 26,185
Employment Taxes & Medical 28,084 24,628 26,051 30,083 30,029 29,400
Other Personnel 495 55 - 550 550 550
Supplies 1,195 1,625 4,149 15,700 48,000 16,000
Services 125,359 84,592 50,046 107,097 69,251 163,201
Capital - - - - - -
Debt, Transfers & Other - - - - - -
Total 325,609 295,541 262,004 377,187 367,378 422,370
103

Department of Finance
Treasury and TaxationThe Division of Treasury and Taxation is responsible for the collection, safekeeping, investment and disbursement of all public monies of the City. This division also encompasses the functions of business licensing and administration of the City’s special assessment program. The income tax section administers the City tax code in a manner that is accountable and responsive to the public for the purpose of generating revenue to finance city services. The section also collects delinquent City taxes in a way that balances both fiscal responsibility and fair collection practices.
Funding SourcesDivision of Treasury and Taxation personnel and operating supplies and services are supported by the General Fund and Special Assessment fund. The division includes 38.51 FTEs.
2021 HighlightsLabor accounts for 62.55% of Treasury’s General Fund expenditures and 86.58% of Taxation’s General Fund expenditures.
The budgeted transfer out of the Capital Improvements Fund is included in Treasury’s 2021 proposed budget. this amount is $11,000,000.
General Fund
Treasury Expenditure Category 2017 Actual 2018 Actual 2019 Actual 2020 Approved 2020 Amended 2021 Proposed
Labor 143,045 160,852 161,686 168,309 166,667 252,515
Overtime 22,393 12,836 12,501 16,000 16,000 16,000
Pension 22,525 24,199 24,231 25,803 25,573 37,592
Employment Taxes & Medical 40,872 36,629 40,797 44,154 44,131 62,003
Other Personnel 550 605 605 605 605 605
Supplies 10,285 9,332 16,368 20,972 16,972 15,500
Services 69,624 36,435 50,480 237,972 188,290 205,286
Capital - - - - - -
Debt, Transfers & Other - - - - - -
Total 309,295 280,888 306,669 513,815 458,238 589,501
Special Assessment
Treasury Expenditure Category 2017 Actual 2018 Actual 2019 Actual 2020 Approved 2020 Amended 2021 Proposed
Labor 127,679 116,151 120,450 130,583 130,583 181,692
Overtime 5,963 8,469 9,442 7,500 7,500 7,500
Pension 18,164 17,441 18,018 19,332 19,332 26,487
Employment Taxes & Medical 27,908 23,090 25,844 27,563 27,563 34,780
Other Personnel 1,100 1,595 1,045 1,045 1,045 1,045
Supplies 39,980 78,532 56,716 165,217 165,217 200,800
Services 331,627 585,470 543,742 957,270 957,270 806,150
Capital - - - 2,400 2,400 -
Debt, Transfers & Other 2,006,424 2,206,254 2,347,327 2,850,000 2,850,000 3,700,000
Total 2,558,845 3,037,002 3,122,584 4,160,910 4,160,910 4,958,453
104
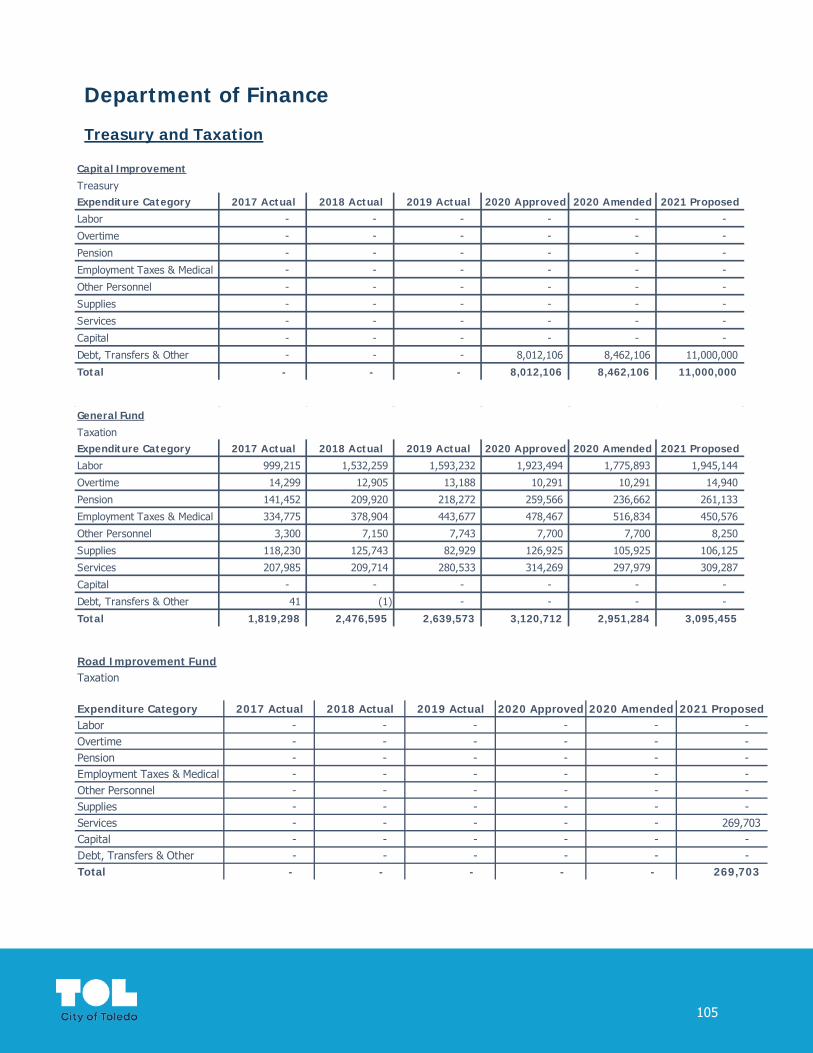
Department of Finance
Treasury and Taxation
Capital Improvement
Treasury Expenditure Category 2017 Actual 2018 Actual 2019 Actual 2020 Approved 2020 Amended 2021 Proposed
Labor - - - - - -
Overtime - - - - - -
Pension - - - - - -
Employment Taxes & Medical - - - - - -
Other Personnel - - - - - -
Supplies - - - - - -
Services - - - - - -
Capital - - - - - -
Debt, Transfers & Other - - - 8,012,106 8,462,106 11,000,000
Total - - - 8,012,106 8,462,106 11,000,000
General Fund
Taxation Expenditure Category 2017 Actual 2018 Actual 2019 Actual 2020 Approved 2020 Amended 2021 Proposed
Labor 999,215 1,532,259 1,593,232 1,923,494 1,775,893 1,945,144
Overtime 14,299 12,905 13,188 10,291 10,291 14,940
Pension 141,452 209,920 218,272 259,566 236,662 261,133
Employment Taxes & Medical 334,775 378,904 443,677 478,467 516,834 450,576
Other Personnel 3,300 7,150 7,743 7,700 7,700 8,250
Supplies 118,230 125,743 82,929 126,925 105,925 106,125
Services 207,985 209,714 280,533 314,269 297,979 309,287
Capital - - - - - -
Debt, Transfers & Other 41 (1) - - - -
Total 1,819,298 2,476,595 2,639,573 3,120,712 2,951,284 3,095,455
Road Improvement FundTaxation
Expenditure Category 2017 Actual 2018 Actual 2019 Actual 2020 Approved 2020 Amended 2021 ProposedLabor - - - - - - Overtime - - - - - - Pension - - - - - - Employment Taxes & Medical - - - - - - Other Personnel - - - - - - Supplies - - - - - - Services - - - - - 269,703 Capital - - - - - - Debt, Transfers & Other - - - - - - Total - - - - - 269,703
105

Department of Finance
AccountsThe Division of Accounts is charged with providing timely and accurate financial information to both internal and external users in accordance with Generally Accepted Accounting Principles (GAAP). Accounts also provides internal controls to insure the safeguarding of City assets. The division works closely with the budget office to prepare, distribute and present monthly financial information to City Council.
Funding SourcesDivision of Accounts personnel and operating supplies and services are supported by the General Fund. The division includes 11.00 FTEs.
2021 HighlightsLabor accounts for 70.92% of the division’s expenditures. The proposed annual budget for services includes funds for the City’s annual financial audit.
General Fund
Expenditure Category 2017 Actual 2018 Actual 2019 Actual 2020 Approved 2020 Amended 2021 Proposed
Labor 658,962 604,915 644,768 820,082 687,078 703,959
Overtime 12,847 4,529 3,464 11,000 11,000 11,000
Pension 82,224 83,343 90,562 113,476 94,856 100,094
Employment Taxes & Medical 164,961 141,683 151,185 189,512 154,209 157,139
Other Personnel 2,825 2,750 3,300 3,300 3,300 2,200
Supplies 2,455 5,619 5,604 2,820 3,020 3,500
Services 219,574 225,515 266,232 406,037 384,456 395,959
Capital - - - - - -
Debt, Transfers & Other - - - - - -
Total 1,143,848 1,068,355 1,165,114 1,546,227 1,337,919 1,373,851
106
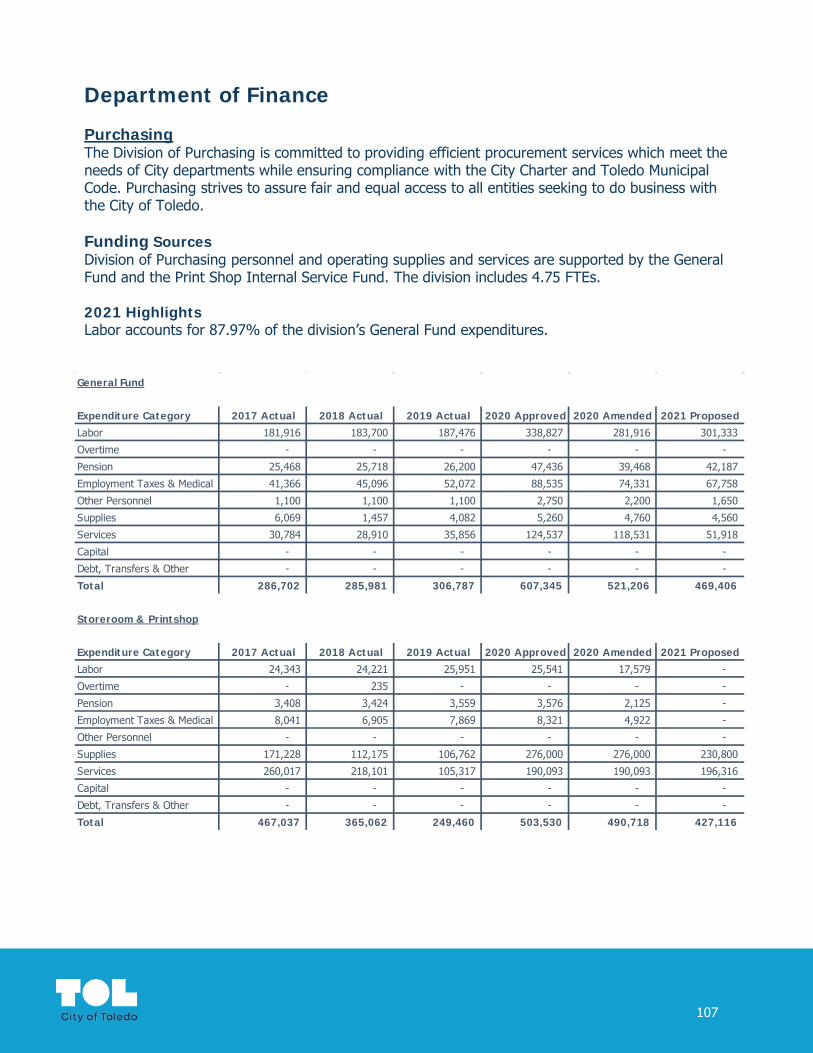
Department of Finance
PurchasingThe Division of Purchasing is committed to providing efficient procurement services which meet the needs of City departments while ensuring compliance with the City Charter and Toledo Municipal Code. Purchasing strives to assure fair and equal access to all entities seeking to do business with the City of Toledo.
Funding SourcesDivision of Purchasing personnel and operating supplies and services are supported by the General Fund and the Print Shop Internal Service Fund. The division includes 4.75 FTEs.
2021 HighlightsLabor accounts for 87.97% of the division’s General Fund expenditures.
General Fund
Expenditure Category 2017 Actual 2018 Actual 2019 Actual 2020 Approved 2020 Amended 2021 Proposed
Labor 181,916 183,700 187,476 338,827 281,916 301,333
Overtime - - - - - -
Pension 25,468 25,718 26,200 47,436 39,468 42,187
Employment Taxes & Medical 41,366 45,096 52,072 88,535 74,331 67,758
Other Personnel 1,100 1,100 1,100 2,750 2,200 1,650
Supplies 6,069 1,457 4,082 5,260 4,760 4,560
Services 30,784 28,910 35,856 124,537 118,531 51,918
Capital - - - - - -
Debt, Transfers & Other - - - - - -
Total 286,702 285,981 306,787 607,345 521,206 469,406
Storeroom & Printshop
Expenditure Category 2017 Actual 2018 Actual 2019 Actual 2020 Approved 2020 Amended 2021 Proposed
Labor 24,343 24,221 25,951 25,541 17,579 -
Overtime - 235 - - - -
Pension 3,408 3,424 3,559 3,576 2,125 -
Employment Taxes & Medical 8,041 6,905 7,869 8,321 4,922 -
Other Personnel - - - - - -
Supplies 171,228 112,175 106,762 276,000 276,000 230,800
Services 260,017 218,101 105,317 190,093 190,093 196,316
Capital - - - - - -
Debt, Transfers & Other - - - - - -
Total 467,037 365,062 249,460 503,530 490,718 427,116
107

Department of Finance
Debt Management The Debt Management Office must balance the financial needs of the City with the most economically and financially feasible methods of borrowing. The Debt Management Officer ensures that the City operates within strict debt guidelines to maintain and improve bond ratings. The Debt Management Office is also responsible for preparing and monitoring the City’s 5-Year Capital Improvement Plan.
Funding SourcesDivision of Debt management personnel and operating supplies and services are supported by the Special Assessment and Capital Improvement Funds. The division includes 1.25 FTEs.
2021 HighlightsNon-Debt expenditures for personnel and operating costs total $129,230.
General Fund
Expenditure Category 2017 Actual 2018 Actual 2019 Actual 2020 Approved 2020 Amended 2021 Proposed
Debt, Transfers & Other 4,656,575 722,927 711,195 721,000 721,000 151,000
Total 4,656,575 722,927 711,195 721,000 721,000 151,000
Right of Way
Expenditure Category 2017 Actual 2018 Actual 2019 Actual 2020 Approved 2020 Amended 2021 Proposed
Debt, Transfers & Other 225,000 225,000 225,000 225,000 225,000 225,000
Total 225,000 225,000 225,000 225,000 225,000 225,000
Street Construction, Maintenance & Repair
Expenditure Category 2017 Actual 2018 Actual 2019 Actual 2020 Approved 2020 Amended 2021 Proposed
Debt, Transfers & Other 462,202 463,123 462,200 862,202 862,202 797,960
Total 462,202 463,123 462,200 862,202 862,202 797,960
108

Department of Finance
Debt Management
General Obligation Debt Service
Expenditure Category 2017 Actual 2018 Actual 2019 Actual 2020 Approved 2020 Amended 2021 Proposed
Debt, Transfers & Other 15,788,078 15,779,643 20,601,926 15,988,400 15,988,400 16,612,859
Total 15,788,078 15,779,643 20,601,926 15,988,400 15,988,400 16,612,859
Jeep Municipal Improvement TIF
Expenditure Category 2017 Actual 2018 Actual 2019 Actual 2020 Approved 2020 Amended 2021 Proposed
Debt, Transfers & Other 3,598,351 3,492,439 4,862,322 719,000 719,000 643,250
Total 3,598,351 3,492,439 4,862,322 719,000 719,000 643,250
Capital Improvement
Expenditure Category 2017 Actual 2018 Actual 2019 Actual 2020 Approved 2020 Amended 2021 Proposed
Labor 87,070 80,552 87,763 89,799 89,799 55,129
Overtime 488 - 148 - - -
Pension 12,258 11,277 11,883 12,572 12,572 7,718
Employment Taxes & Medical 16,794 14,542 16,420 17,496 17,496 10,816
Other Personnel 330 330 330 330 330 330
Supplies - - - - - -
Services (18,487) 40 2,617 7,000 27,000 6,000
Capital - - - - - -
Debt, Transfers & Other 24,125,556 23,788,023 31,387,031 19,177,156 19,157,156 19,980,981
Total 24,224,008 23,894,764 31,506,191 19,304,352 19,304,352 20,060,974
Water
Expenditure Category 2017 Actual 2018 Actual 2019 Actual 2020 Approved 2020 Amended 2021 Proposed
Debt, Transfers & Other 25,849,346 26,375,436 26,515,266 27,608,000 27,608,000 27,188,425
Total 25,849,346 26,375,436 26,515,266 27,608,000 27,608,000 27,188,425
Sewer
Expenditure Category 2017 Actual 2018 Actual 2019 Actual 2020 Approved 2020 Amended 2021 Proposed
Debt, Transfers & Other 30,947,582 29,661,614 32,846,217 37,787,000 37,787,000 39,269,477
Total 30,947,582 29,661,614 32,846,217 37,787,000 37,787,000 39,269,477
109

Department of Finance
Debt Management Storm Water
Expenditure Category 2017 Actual 2018 Actual 2019 Actual 2020 Approved 2020 Amended 2021 Proposed
Debt, Transfers & Other 248,858 251,300 251,300 253,000 253,000 238,905
Total 248,858 251,300 251,300 253,000 253,000 238,905
Municipal Garage
Expenditure Category 2017 Actual 2018 Actual 2019 Actual 2020 Approved 2020 Amended 2021 Proposed
Debt, Transfers & Other 212,700 200,184 194,875 188,000 188,000 180,500
Total 212,700 200,184 194,875 188,000 188,000 180,500
Property Mangement
Expenditure Category 2017 Actual 2018 Actual 2019 Actual 2020 Approved 2020 Amended 2021 Proposed
Debt, Transfers & Other 1,303,404 1,249,639 1,270,435 1,333,000 1,333,000 1,150,371
Total 1,303,404 1,249,639 1,270,435 1,333,000 1,333,000 1,150,371
Facility Operations
Expenditure Category 2017 Actual 2018 Actual 2019 Actual 2020 Approved 2020 Amended 2021 Proposed
Debt, Transfers & Other 3,332,810 3,435,510 286,975 290,000 290,000 287,713
Total 3,332,810 3,435,510 286,975 290,000 290,000 287,713
110

Department of Finance
ERPThe ERP team operates, maintains and enhances the SAP-ERP accounting software system to provide accurate, real-time financial, procurement, payroll and HR information to all City departments. Additionally, the team is responsible for training system users city-wide.
Funding SourcesThe ERP team expenditures are distributed across all major operating funds. The division includes 1.00 FTE.
2021 HighlightsLabor accounts for 34.22% of the division’s expenditures.
General Fund
Expenditure Category 2017 Actual 2018 Actual 2019 Actual 2020 Approved 2020 Amended 2021 Proposed
Labor 173,408 68,571 69,576 134,905 70,199 87,069
Overtime 5,102 4,375 11,949 1,050 1,050 5,000
Pension 20,585 10,069 11,002 19,034 9,975 12,890
Employment Taxes & Medical 46,651 25,675 19,663 28,879 14,510 14,683
Other Personnel 550 550 550 1,100 550 550
Supplies 3,848 59 494 - - -
Services 118,377 376,133 259,499 201,539 231,046 231,090
Capital - - - - - -
Debt, Transfers & Other - - - - - -
Total 368,520 485,431 372,734 386,507 327,330 351,282
Finance ERP by Fund
Fund 2017 Actual 2018 Actual 2019 Actual 2020 Approved 2020 Amended 2021 ProposedGeneral 368,520 485,431 372,734 386,507 327,330 351,282 Street Construction, Maintenance & Repair 23,096 15,767 16,302 20,919 20,919 26,152 Federal Grants - - - 6,594 - - Special Assessment 90,094 64,503 54,331 69,718 69,718 51,241 Capital Improvement 77,599 54,336 30,601 39,267 39,267 11,101 Water 125,949 93,281 84,169 108,005 108,005 87,601 Sewer 123,556 89,972 86,582 111,102 111,102 76,029 Storm Water 12,806 9,908 9,538 12,239 12,239 15,335 Utility Administration 23,991 18,041 15,900 20,402 20,402 24,938 Municipal Tow Lot 4,146 2,934 2,799 3,592 3,592 1,552 Workers Compensation 14,672 9,471 7,035 9,027 9,027 10,250 Information & Communication Technology 8,575 6,956 5,475 7,026 7,026 10,452 Storeroom & Printshop 1,461 892 484 621 621 711 Municipal Garage 20,976 13,493 10,786 13,840 13,840 17,080 Facility Operations 11,298 7,937 3,267 4,192 4,192 4,675 Risk Management 3,279 2,684 2,175 2,791 2,791 4,553 Healthcare Internal Service - - - - - 60,866 Total 910,018 875,605 702,177 815,842 750,071 753,818
111
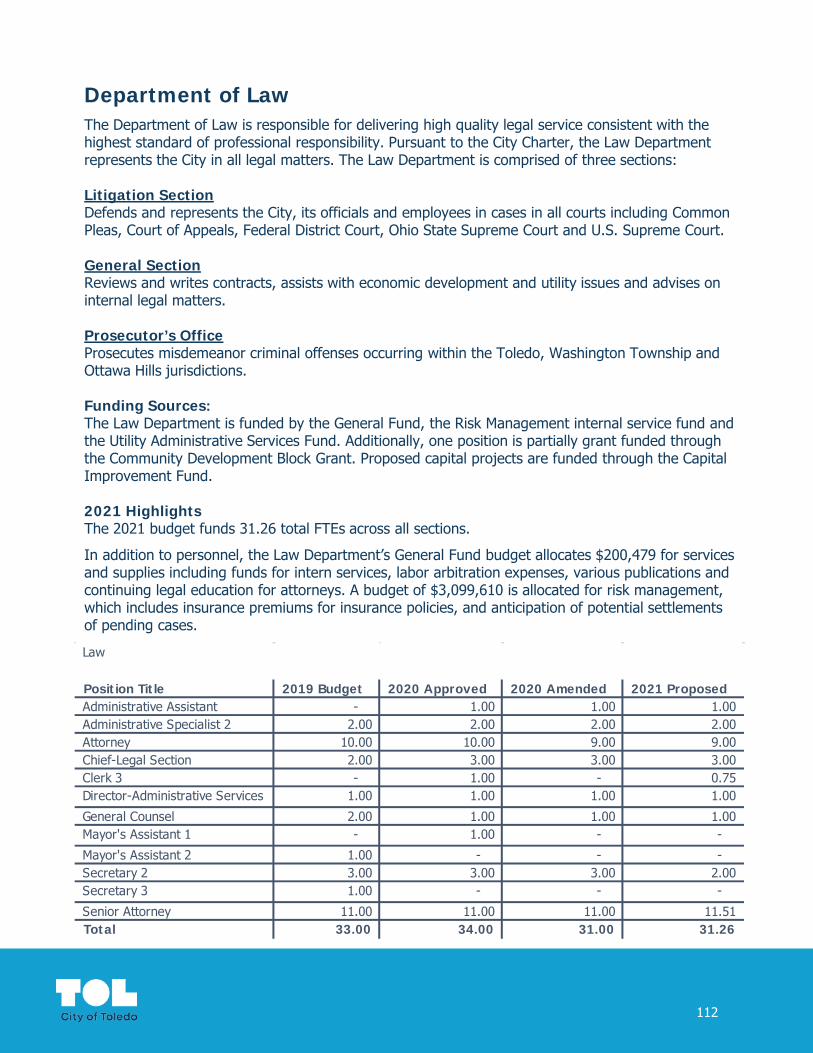
Department of LawThe Department of Law is responsible for delivering high quality legal service consistent with the highest standard of professional responsibility. Pursuant to the City Charter, the Law Department represents the City in all legal matters. The Law Department is comprised of three sections:
Litigation SectionDefends and represents the City, its officials and employees in cases in all courts including Common Pleas, Court of Appeals, Federal District Court, Ohio State Supreme Court and U.S. Supreme Court.
General SectionReviews and writes contracts, assists with economic development and utility issues and advises on internal legal matters.
Prosecutor’s OfficeProsecutes misdemeanor criminal offenses occurring within the Toledo, Washington Township and Ottawa Hills jurisdictions.
Funding Sources:The Law Department is funded by the General Fund, the Risk Management internal service fund and the Utility Administrative Services Fund. Additionally, one position is partially grant funded through the Community Development Block Grant. Proposed capital projects are funded through the Capital Improvement Fund.
2021 HighlightsThe 2021 budget funds 31.26 total FTEs across all sections.
In addition to personnel, the Law Department’s General Fund budget allocates $200,479 for services and supplies including funds for intern services, labor arbitration expenses, various publications and continuing legal education for attorneys. A budget of $3,099,610 is allocated for risk management, which includes insurance premiums for insurance policies, and anticipation of potential settlements of pending cases.
Law
Position Title 2019 Budget 2020 Approved 2020 Amended 2021 ProposedAdministrative Assistant - 1.00 1.00 1.00 Administrative Specialist 2 2.00 2.00 2.00 2.00 Attorney 10.00 10.00 9.00 9.00 Chief-Legal Section 2.00 3.00 3.00 3.00 Clerk 3 - 1.00 - 0.75 Director-Administrative Services 1.00 1.00 1.00 1.00
General Counsel 2.00 1.00 1.00 1.00 Mayor's Assistant 1 - 1.00 - -
Mayor's Assistant 2 1.00 - - - Secretary 2 3.00 3.00 3.00 2.00 Secretary 3 1.00 - - -
Senior Attorney 11.00 11.00 11.00 11.51 Total 33.00 34.00 31.00 31.26
112

Department of Law
General Fund
Expenditure Category 2017 Actual 2018 Actual 2019 Actual 2020 Approved 2020 Amended 2021 Proposed
Labor 1,769,457 1,563,588 1,614,321 1,838,075 1,413,145 1,550,331
Overtime - - - - - -
Pension 236,868 208,902 224,349 257,254 197,561 217,046
Employment Taxes & Medical 417,889 278,796 320,095 367,549 289,070 292,809
Other Personnel 6,160 1,210 1,375 1,760 1,760 1,485
Supplies 17,379 17,828 39,756 16,705 19,705 18,800
Services 113,888 97,789 136,649 177,382 145,936 181,679
Capital - - - - - -
Debt, Transfers & Other - - - - - -
Total 2,561,640 2,168,113 2,336,546 2,658,725 2,067,176 2,262,150
Federal Grants
Expenditure Category 2017 Actual 2018 Actual 2019 Actual 2020 Approved 2020 Amended 2021 Proposed
Labor 37,877 32,690 41,926 37,806 47,268 39,678
Overtime - - - - - -
Pension 5,276 4,660 5,806 5,293 17,203 5,555
Employment Taxes & Medical 9,368 8,520 14,878 9,246 24,936 9,219
Other Personnel - - - - - -
Supplies - - - - - -
Services - - - - - -
Capital - - - - - -
Debt, Transfers & Other - - - - - -
Total 52,521 45,870 62,610 52,345 89,406 54,453
113

Department of Law
Utility Administration
Expenditure Category 2017 Actual 2018 Actual 2019 Actual 2020 Approved 2020 Amended 2021 Proposed
Labor 175,274 203,207 211,254 179,469 179,469 188,316
Overtime - - - - - -
Pension 24,112 28,441 29,561 25,126 25,126 26,364
Employment Taxes & Medical 45,539 38,265 30,959 32,354 32,354 32,089
Other Personnel 550 550 550 - - -
Supplies - - - - - -
Services - - - - - -
Capital - - - - - -
Debt, Transfers & Other - - - - - -
Total 245,474 270,463 272,325 236,949 236,949 246,769
Risk Management
Expenditure Category 2017 Actual 2018 Actual 2019 Actual 2020 Approved 2020 Amended 2021 Proposed
Labor 201,464 241,147 294,432 405,238 581,689 653,074
Overtime - - - - - -
Pension 28,198 33,779 40,796 56,733 81,157 91,430
Employment Taxes & Medical 44,267 55,968 80,134 84,660 115,554 118,243
Other Personnel 990 990 825 1,540 1,540 1,265
Supplies - - - - - -
Services 779,150 1,583,650 1,209,314 1,627,210 2,106,940 2,235,597
Capital - - - - - -
Debt, Transfers & Other - - - - - -
Total 1,054,069 1,915,534 1,625,501 2,175,381 2,886,880 3,099,610
114
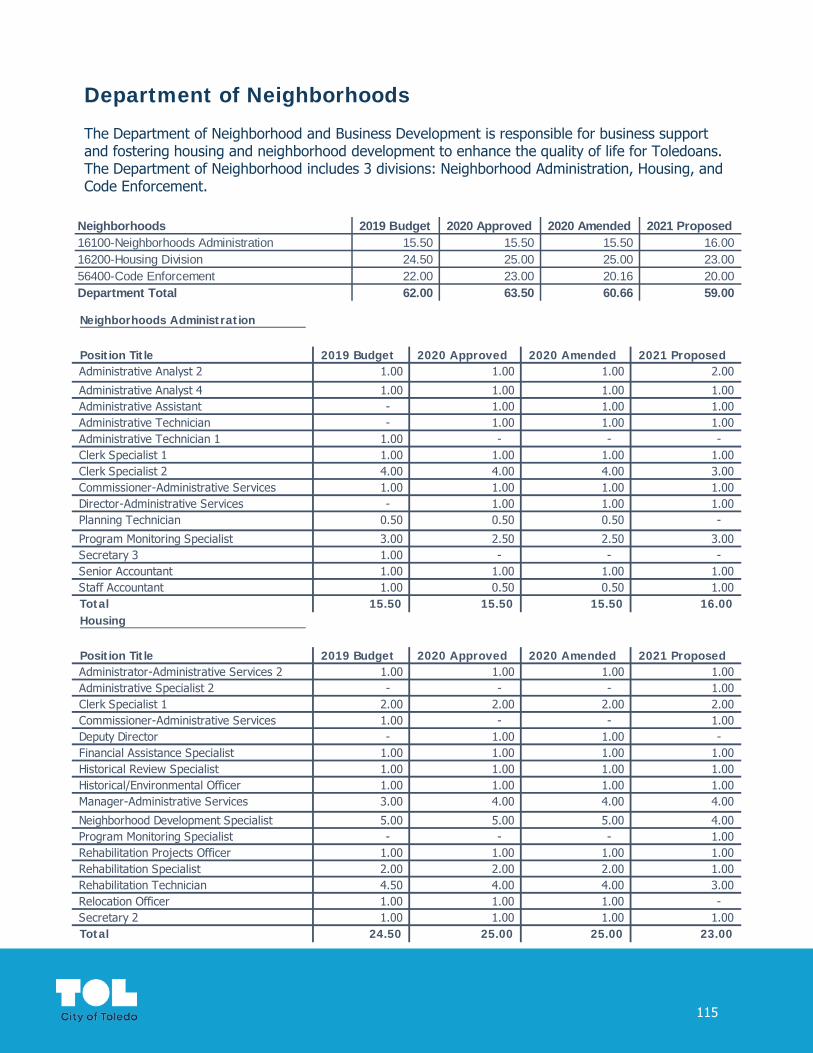
Department of Neighborhoods
The Department of Neighborhood and Business Development is responsible for business support and fostering housing and neighborhood development to enhance the quality of life for Toledoans. The Department of Neighborhood includes 3 divisions: Neighborhood Administration, Housing, and Code Enforcement.
Neighborhoods Administration
Position Title 2019 Budget 2020 Approved 2020 Amended 2021 ProposedAdministrative Analyst 2 1.00 1.00 1.00 2.00
Administrative Analyst 4 1.00 1.00 1.00 1.00 Administrative Assistant - 1.00 1.00 1.00 Administrative Technician - 1.00 1.00 1.00 Administrative Technician 1 1.00 - - - Clerk Specialist 1 1.00 1.00 1.00 1.00 Clerk Specialist 2 4.00 4.00 4.00 3.00 Commissioner-Administrative Services 1.00 1.00 1.00 1.00 Director-Administrative Services - 1.00 1.00 1.00 Planning Technician 0.50 0.50 0.50 -
Program Monitoring Specialist 3.00 2.50 2.50 3.00 Secretary 3 1.00 - - - Senior Accountant 1.00 1.00 1.00 1.00 Staff Accountant 1.00 0.50 0.50 1.00 Total 15.50 15.50 15.50 16.00 Housing
Position Title 2019 Budget 2020 Approved 2020 Amended 2021 ProposedAdministrator-Administrative Services 2 1.00 1.00 1.00 1.00 Administrative Specialist 2 - - - 1.00 Clerk Specialist 1 2.00 2.00 2.00 2.00 Commissioner-Administrative Services 1.00 - - 1.00 Deputy Director - 1.00 1.00 - Financial Assistance Specialist 1.00 1.00 1.00 1.00 Historical Review Specialist 1.00 1.00 1.00 1.00 Historical/Environmental Officer 1.00 1.00 1.00 1.00 Manager-Administrative Services 3.00 4.00 4.00 4.00
Neighborhood Development Specialist 5.00 5.00 5.00 4.00 Program Monitoring Specialist - - - 1.00 Rehabilitation Projects Officer 1.00 1.00 1.00 1.00 Rehabilitation Specialist 2.00 2.00 2.00 1.00 Rehabilitation Technician 4.50 4.00 4.00 3.00 Relocation Officer 1.00 1.00 1.00 - Secretary 2 1.00 1.00 1.00 1.00 Total 24.50 25.00 25.00 23.00
Neighborhoods 2019 Budget 2020 Approved 2020 Amended 2021 Proposed16100-Neighborhoods Administration 15.50 15.50 15.50 16.00 16200-Housing Division 24.50 25.00 25.00 23.00 56400-Code Enforcement 22.00 23.00 20.16 20.00 Department Total 62.00 63.50 60.66 59.00
115

Department of Neighborhoods
2021 Proposed Budget -Neighborhoods
Expenditure Category & Source of Funds General Fund
Special Revenue Funds
Debt Service Funds
Capital Projects Funds
Enterprise Funds
Internal Service Funds Total
Labor 829,570 2,668,252 - - - - 3,497,822
Overtime 5,000 - - - - - 5,000
Pension 116,840 370,992 - - - - 487,832
Employment Taxes & Medical 187,147 650,929 - - - - 838,076
Other Personnel 1,056 12,694 - - - - 13,750
Supplies 48,099 38,930 - - - - 87,029
Services 1,522,836 1,003,150 - - - - 2,525,986
Capital - - - - - - -
Debt, Transfers & Other 500,000 15,995,849 - - - - 16,495,849
Total 3,210,548 20,740,796 - - - - 23,951,344
Code Enforcement
Position Title 2019 Budget 2020 Approved 2020 Amended 2021 ProposedAdministrative Specialist 3 - 1.00 - - Administrative Technician 2 - 1.00 0.58 - Building And Grounds Maintenance Worker 1.00 - - - Clerk Specialist 1 1.00 1.00 1.00 1.00 Clerk Specialist 2 2.00 2.00 1.58 1.00
Code Compliance Inspector 1 6.00 6.00 6.00 6.00 Code Compliance Inspector 2 5.00 5.00 4.00 5.00 Commissioner-Public Services 1.00 1.00 1.00 1.00 Maintenance Worker 2 - - - 2.00 Maintenance Worker I 2.00 2.00 2.00 - Manager-Public Services 1.00 1.00 1.00 1.00 Supervisor-Code Compliance 1.00 3.00 3.00 3.00 Supervisor-Recreation 2.00 - - - Total 22.00 23.00 20.16 20.00
116

Department of Neighborhoods
Neighborhood AdministrationNeighborhood Administration provides administration and monitoring of CDBG, ESG, and other federal funds through the U.S. Department of Housing and Urban Development Community Block Grant Program (CDBG). Neighborhood Administration works with partner agencies to provide grant funded services. These annual grants are awarded to qualified cities, urban counties and states to develop viable urban communities. Divisional activities are primarily funded by these grants with additional support from General Fund for costs that are not grant funded.
Funding SourcesDivision of Division of Neighborhood Administration’s personnel and operating supplies and services are supported by the General Fund, CDBG Fund, and other operating grants. The division includes 16.00 FTEs.
2021 HighlightsLabor accounts for 33.20% of the division’s proposed 2021 General Fund expenditures.
General Fund
Expenditure Category 2017 Actual 2018 Actual 2019 Actual 2020 Approved 2020 Amended 2021 Proposed
Labor 7,896 9,627 7,572 125,506 125,416 139,036
Overtime - - - - - -
Pension 1,105 1,346 1,054 17,571 17,558 19,465
Employment Taxes & Medical 1,448 1,241 716 16,259 16,258 16,020
Other Personnel - - - - - -
Supplies - - - 6,000 6,000 6,000
Services - - - 45,000 45,000 363,291
Capital - - - - - -
Debt, Transfers & Other 35,000 (35,000) - - - -
Total 45,450 (22,786) 9,342 210,336 210,232 543,812
Federal Grants
Expenditure Category 2017 Actual 2018 Actual 2019 Actual 2020 Approved 2020 Amended 2021 Proposed
Labor 749,573 687,556 620,366 823,069 1,612,408 887,667
Overtime 1,023 (30) 290 - 397 -
Pension 105,677 95,350 86,308 114,100 421,086 121,710
Employment Taxes & Medical 188,915 200,407 174,103 205,424 547,019 212,378
Other Personnel 2,910 3,828 3,214 4,400 11,072 4,950
Supplies 15,091 5,026 (8,395) 4,200 21,229 3,113
Services 281,408 114,573 50,245 112,242 703,926 3,750
Capital - - - - - -
Debt, Transfers & Other 26,472 310 71 1,338,338 655,003 341,567
Total 1,371,069 1,107,021 926,202 2,601,773 3,972,140 1,575,135
117

Department of Neighborhoods
Neighborhood Administration
Operation Grants
Expenditure Category 2017 Actual 2018 Actual 2019 Actual 2020 Approved 2020 Amended 2021 Proposed
Labor 4,886 2,471 42 - - -
Overtime 11 5 - - - -
Pension 685 346 6 - - -
Employment Taxes & Medical 1,210 809 30 - - -
Other Personnel 22 22 11 - (11) -
Supplies - - - - - -
Services - 8,750 - - 122,643 -
Capital - - - - - -
Debt, Transfers & Other 473,541 925,489 655,069 632,768 3,585,147 4,352,295
Total 480,355 937,893 655,157 632,768 3,707,779 4,352,295
118
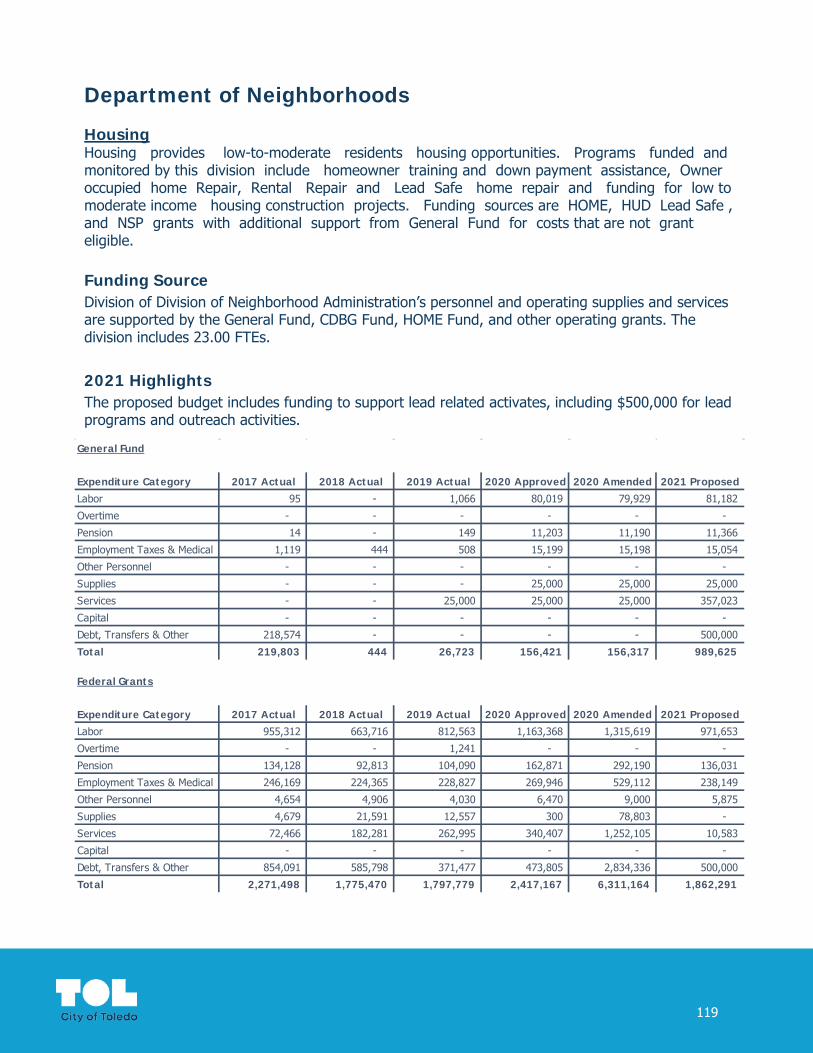
Department of Neighborhoods
HousingHousing provides low-to-moderate residents housing opportunities. Programs funded and monitored by this division include homeowner training and down payment assistance, Owner occupied home Repair, Rental Repair and Lead Safe home repair and funding for low to moderate income housing construction projects. Funding sources are HOME, HUD Lead Safe , and NSP grants with additional support from General Fund for costs that are not grant eligible.
Funding SourceDivision of Division of Neighborhood Administration’s personnel and operating supplies and services are supported by the General Fund, CDBG Fund, HOME Fund, and other operating grants. The division includes 23.00 FTEs.
2021 HighlightsThe proposed budget includes funding to support lead related activates, including $500,000 for lead programs and outreach activities.
General Fund
Expenditure Category 2017 Actual 2018 Actual 2019 Actual 2020 Approved 2020 Amended 2021 Proposed
Labor 95 - 1,066 80,019 79,929 81,182
Overtime - - - - - -
Pension 14 - 149 11,203 11,190 11,366
Employment Taxes & Medical 1,119 444 508 15,199 15,198 15,054
Other Personnel - - - - - -
Supplies - - - 25,000 25,000 25,000
Services - - 25,000 25,000 25,000 357,023
Capital - - - - - -
Debt, Transfers & Other 218,574 - - - - 500,000
Total 219,803 444 26,723 156,421 156,317 989,625
Federal Grants
Expenditure Category 2017 Actual 2018 Actual 2019 Actual 2020 Approved 2020 Amended 2021 Proposed
Labor 955,312 663,716 812,563 1,163,368 1,315,619 971,653
Overtime - - 1,241 - - -
Pension 134,128 92,813 104,090 162,871 292,190 136,031
Employment Taxes & Medical 246,169 224,365 228,827 269,946 529,112 238,149
Other Personnel 4,654 4,906 4,030 6,470 9,000 5,875
Supplies 4,679 21,591 12,557 300 78,803 -
Services 72,466 182,281 262,995 340,407 1,252,105 10,583
Capital - - - - - -
Debt, Transfers & Other 854,091 585,798 371,477 473,805 2,834,336 500,000
Total 2,271,498 1,775,470 1,797,779 2,417,167 6,311,164 1,862,291
119
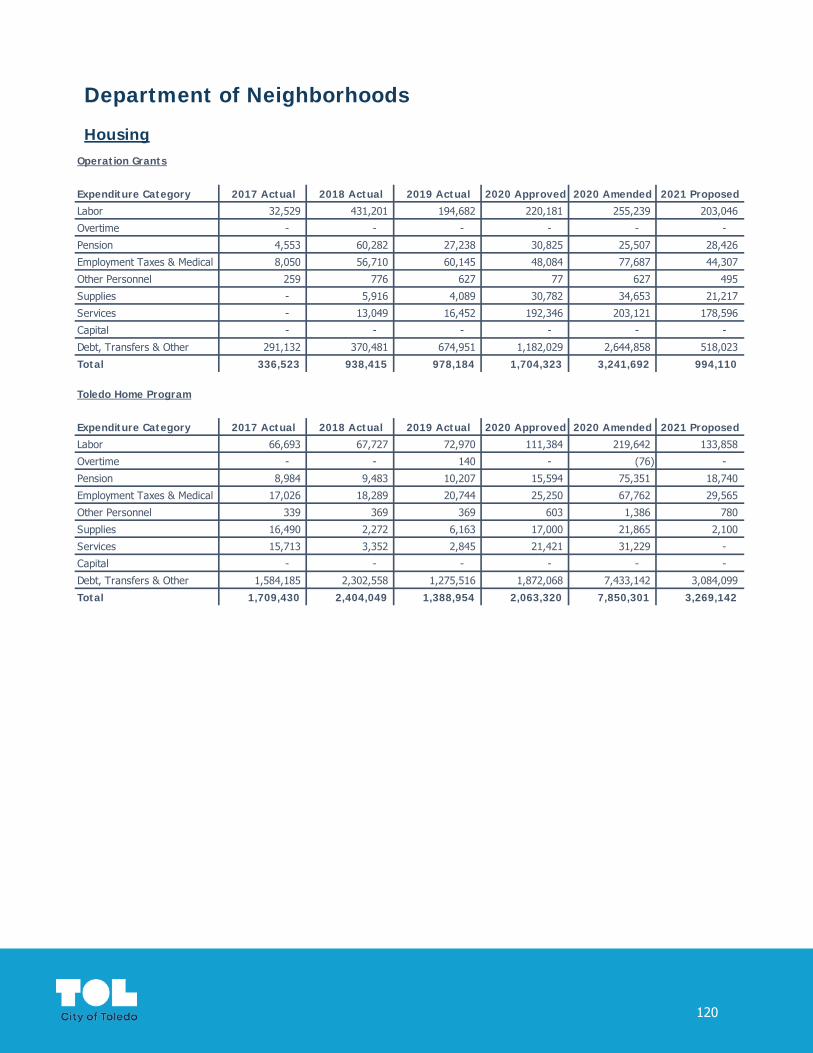
Department of Neighborhoods
HousingOperation Grants
Expenditure Category 2017 Actual 2018 Actual 2019 Actual 2020 Approved 2020 Amended 2021 Proposed
Labor 32,529 431,201 194,682 220,181 255,239 203,046
Overtime - - - - - -
Pension 4,553 60,282 27,238 30,825 25,507 28,426
Employment Taxes & Medical 8,050 56,710 60,145 48,084 77,687 44,307
Other Personnel 259 776 627 77 627 495
Supplies - 5,916 4,089 30,782 34,653 21,217
Services - 13,049 16,452 192,346 203,121 178,596
Capital - - - - - -
Debt, Transfers & Other 291,132 370,481 674,951 1,182,029 2,644,858 518,023
Total 336,523 938,415 978,184 1,704,323 3,241,692 994,110
Toledo Home Program
Expenditure Category 2017 Actual 2018 Actual 2019 Actual 2020 Approved 2020 Amended 2021 Proposed
Labor 66,693 67,727 72,970 111,384 219,642 133,858
Overtime - - 140 - (76) -
Pension 8,984 9,483 10,207 15,594 75,351 18,740
Employment Taxes & Medical 17,026 18,289 20,744 25,250 67,762 29,565
Other Personnel 339 369 369 603 1,386 780
Supplies 16,490 2,272 6,163 17,000 21,865 2,100
Services 15,713 3,352 2,845 21,421 31,229 -
Capital - - - - - -
Debt, Transfers & Other 1,584,185 2,302,558 1,275,516 1,872,068 7,433,142 3,084,099
Total 1,709,430 2,404,049 1,388,954 2,063,320 7,850,301 3,269,142
120

Department of Neighborhoods
Code EnforcementCode Enforcement manages the inspection, citation and remediation of code enforcement violations within the City of Toledo. This includes assisting with grass cutting program management, board-up and trash cleanup of properties in violation, and coordination of community cleanup and recycling events with community groups and organizational partners. Code Enforcement staff also provide administrative support for demolition activities.
Funding SourceThe Division of Code Enforcement personnel and operating supplies and services are supported by the General Fund and the CDBG Fund. The division includes 20.00 FTEs.
2021 HighlightsThe Division’s General Fund budget for labor expenditures totals 51.50% of its total operating budget. Code Enforcement’s non-labor budget includes funds for blight remediation and demolition activities.
General Fund
Expenditure Category 2017 Actual 2018 Actual 2019 Actual 2020 Approved 2020 Amended 2021 Proposed
Labor 467,896 493,626 630,495 712,791 595,497 609,352
Overtime 6,348 7,643 7,407 15,000 15,000 5,000
Pension 55,587 66,406 87,976 101,891 85,217 86,009
Employment Taxes & Medical 117,817 123,129 151,989 188,064 169,092 156,072
Other Personnel 55 385 462 1,562 1,012 1,056
Supplies 17,611 19,565 16,779 19,623 19,123 17,099
Services 375,231 946,872 1,005,077 594,122 552,572 790,485
Capital - - - - - -
Debt, Transfers & Other 117,797 - - - - -
Total 1,158,342 1,657,626 1,900,186 1,633,052 1,437,514 1,665,073
Federal Grants
Expenditure Category 2017 Actual 2018 Actual 2019 Actual 2020 Approved 2020 Amended 2021 Proposed
Labor 520,405 478,323 337,691 468,852 800,379 461,381
Overtime 6,644 3,792 5,093 - 980 -
Pension 74,458 67,791 29,553 65,639 303,085 64,593
Employment Taxes & Medical 127,947 128,587 118,818 130,014 312,385 123,040
Other Personnel 1,045 1,265 1,188 1,188 2,376 594
Supplies 25,101 15,323 5,635 12,500 33,010 12,500
Services 735,956 347,227 504,360 442,477 1,208,302 822,258
Capital - - - - - -
Debt, Transfers & Other - 366,023 - - 289,149 -
Total 1,491,555 1,408,330 1,002,338 1,120,670 2,949,665 1,484,366
121

Third Party Partners
Department of Neighborhoods
Code Enforcement
Expendable Trusts
Expenditure Category 2017 Actual 2018 Actual 2019 Actual 2020 Approved 2020 Amended 2021 Proposed
Labor - - - 18,707 - 10,649
Overtime - - - - - -
Pension - - - 2,619 - 1,491
Employment Taxes & Medical - - - 6,912 - 3,489
Other Personnel - - - - - -
Supplies - - - - - -
Services - - - - - -
Capital - - - - - -
Debt, Transfers & Other - - - - - -
Total - - - 28,238 - 15,629
Third Party Partners - Federal Grants
Expenditure Category 2017 Actual 2018 Actual 2019 Actual 2020 Approved 2020 Amended 2021 Proposed
Labor - - - - - -
Overtime - - - - - -
Pension - - - - - -
Employment Taxes & Medical - - - - - -
Other Personnel - - - - - -
Supplies - - - - - -
Services - - - - - -
Capital - - - - - -
Debt, Transfers & Other 1,664,815 2,082,871 2,400,582 2,587,638 7,672,087 7,199,865
Total 1,664,815 2,082,871 2,400,582 2,587,638 7,672,087 7,199,865
122

Department of Human ResourcesThe Human Resources Department supports its sister departments in all aspects of the employer-employee relationship. Responsible for employee selection and evaluation, benefits administration, union/employee relations, workers’ compensation, and training. The Human Resources Department facilitates the delivery of City services by selecting, developing, and retaining the City’s most valuable resource: a productive and competent workforce.
Funding Sources
The Department of Human Resources’ operating expenditures and personnel are funded primarily by the General Fund. Funding allocated in the Workers’ Compensation Fund covers the City’s payments to the State of Ohio. The department also funds a portion of its labor, services and supplies costs in this fund.
2021 Highlights
The 2021 budget funds 19.00 FTEs for the Department of Human Resources, including 3 members of the Civil Service Commission. Labor expenditures are 50.79% of the department’s General Fund Budget.
Non-personnel budget in the General Fund totals $1,038,763 and supports on-boarding costs for new employees, testing costs for promotions in the safety forces, training materials for all departments, as well as employee engagement activities.
HR
Position Title 2019 Budget 2020 Approved 2020 Amended 2021 ProposedAdministrative Analyst 1 - 4.00 3.00 - Administrative Analyst 2 7.00 2.00 2.00 4.00 Administrative Analyst 3 1.00 2.00 2.00 2.00 Administrative Analyst 4 - - - 1.00 Administrative Assistant - 1.00 1.00 1.00 Administrative Specialist 1 1.00 - - -
Administrative Specialist 2 - 1.00 1.00 - Administrative Specialist 3 - - - 1.00
Administrative Technician 2 1.00 1.00 0.58 - Board Member-Civil Service Commission 3.00 3.00 3.00 3.00 Chief-Bargaining & Representation 1.00 1.00 1.00 -
Clerk 3 - - - 1.00 Deputy Director - - - 1.00 Director-Administrative Services 1.00 1.00 1.00 1.00 Manager-Administrative Services 2.00 4.00 3.00 3.00 Senior Attorney - - - 1.00 Total 17.00 20.00 17.58 19.00
123

Department of Human Resources
2021 Proposed Budget -Human Resources
Expenditure Category & Source of Funds General Fund
Special Revenue Funds
Debt Service Funds
Capital Projects Funds
Enterprise Funds
Internal Service Funds Total
Labor 776,229 24,938 - - 49,875 336,540 1,187,582
Overtime 1,000 - - - - - 1,000
Pension 108,812 3,491 - - 6,983 47,116 166,402
Employment Taxes & Medical 182,737 4,364 - - 8,727 74,947 270,774
Other Personnel 3,300 - - - - 2,200 5,500
Supplies 41,550 - - - - 3,450 45,000
Services 997,213 - - - - 49,077,357 50,074,570
Capital - - - - - - -
Debt, Transfers & Other - - - - - - -
Total 2,110,840 32,792 - - 65,585 49,541,610 51,750,827
General
Expenditure Category 2017 Actual 2018 Actual 2019 Actual 2020 Approved 2020 Amended 2021 Proposed
Labor 554,512 476,475 471,734 748,114 612,318 776,229
Overtime 199 21 200 1,000 1,000 1,000
Pension 69,081 66,214 65,146 104,876 85,865 108,812
Employment Taxes & Medical 166,338 129,696 140,984 196,092 167,314 182,737
Other Personnel 3,740 2,420 3,300 4,400 3,850 3,300
Supplies 10,512 12,499 16,170 25,620 37,132 41,550
Services 361,179 422,996 371,399 754,006 623,149 997,213
Capital - - - - - -
Debt, Transfers & Other - - - - - -
Total 1,165,562 1,110,321 1,068,934 1,834,109 1,530,627 2,110,840
Street Construction, Maintenance & Repair
Expenditure Category 2017 Actual 2018 Actual 2019 Actual 2020 Approved 2020 Amended 2021 Proposed
Labor 11,949 12,643 14,393 14,695 14,695 16,625
Overtime - - - - - -
Pension 1,670 1,735 1,996 2,057 2,057 2,328
Employment Taxes & Medical 2,782 4,639 2,727 2,911 2,911 2,909
Other Personnel 110 110 - - - -
Supplies - - - - - -
Services - - - - - -
Capital - - - - - -
Debt, Transfers & Other - - - - - -
Total 16,511 19,127 19,115 19,664 19,664 21,862
124

Department of Human Resources
Utility Administration
Expenditure Category 2017 Actual 2018 Actual 2019 Actual 2020 Approved 2020 Amended 2021 Proposed
Labor 35,848 37,930 43,178 44,044 44,044 49,875
Overtime - - - - - -
Pension 5,010 5,204 5,987 6,166 6,166 6,983
Employment Taxes & Medical 8,296 9,440 8,183 8,726 8,726 8,727
Other Personnel 330 330 - - - -
Supplies - - - - - -
Services - - - - - -
Capital - - - - - -
Debt, Transfers & Other - - - - - -
Total 49,484 52,904 57,348 58,936 58,936 65,585
Workers' Compensation
Expenditure Category 2017 Actual 2018 Actual 2019 Actual 2020 Approved 2020 Amended 2021 Proposed
Labor 258,306 279,232 340,281 342,286 320,750 267,621
Overtime 802 - - - - -
Pension 27,624 35,914 41,577 47,920 44,345 37,467
Employment Taxes & Medical 46,475 49,357 71,995 75,509 69,724 60,599
Other Personnel 1,815 1,485 1,650 2,200 2,200 1,650
Supplies - 1,492 4,252 8,950 8,950 3,450
Services 6,615,740 5,491,385 5,555,413 6,923,164 6,923,164 6,608,099
Capital - - - - - -
Debt, Transfers & Other - - - - - -
Total 6,950,762 5,858,865 6,015,168 7,400,029 7,369,132 6,978,886
125

Department of Human Resources
Healthcare Internal Service
Expenditure Category 2017 Actual 2018 Actual 2019 Actual 2020 Approved 2020 Amended 2021 ProposedLabor - - - - - 68,919 Overtime - - - - - - Pension - - - - - 9,649 Employment Taxes & Medical - - - - - 14,347 Other Personnel - - - - - 550 Supplies - - - - - - Services - - - 42,450,000 42,450,000 42,469,258 Capital - - - - - - Debt, Transfers & Other - - - - - - Total - - - 42,450,000 42,450,000 42,562,723
126

Department of Information & Communications Technology
The Department of Information and Communications Technology (ICT) delivers enterprise software, infrastructure and security services for all City departments. Since 2020 the department has also included Engage Toledo.
Funding SourcesAs an internal service department, ICT is funded through user charges assessed to other departments and divisions for telecommunication and computer support services.
2021 HighlightsThe ICT 2021 budget supports 33.77 FTEs. ICT staff provide 24 hour support to the City’s departments and divisions that support the citizens of Toledo. The Engage Toledo staff provide 24/7/365 customer service for City service requests and issues.
Funds Center Name 2019 Budget 2020 Approved 2020 Amended 2021 Proposed17500-Information & Communications Technology 17.75 23.08 19.50 20.50 17600-Engage Toledo - 18.50 15.00 13.27 Total 17.75 41.59 34.50 33.77
Information & Communications Technology
Position Title 2019 Budget 2020 Approved 2020 Amended 2021 Proposed
Administrative Assistant - 1.00 1.00 1.00 Administrator-Administrative Services 1 - 0.75 - - Administrator-Administrative Services 2 3.00 3.00 3.00 3.00
Administrator-Administrative Services 3 - 1.00 1.00 1.00 Clerk Specialist 2 2.00 2.00 2.00 2.00 Commissioner-Administrative Services 1.00 - - - Data Communications Specialist 2.00 2.00 2.00 3.00 Data Communications Technician 1.00 1.00 1.00 - Deputy Director - 0.83 - - Director-Administrative Services 1.00 1.00 1.00 1.00 End User Support Technician - 0.50 0.50 0.50 Gis Analyst 1 3.00 3.00 2.00 2.00
Manager-Administrative Services 0.75 4.00 3.00 3.00 Manager-Public Services 1.00 1.00 1.00 1.00 Programmer/Analyst 1.00 1.00 1.00 1.00 Secretary 3 1.00 - - - Senior Professional Engineer 1.00 1.00 1.00 1.00 Software Support Specialist - - - 1.00 Total 17.75 23.08 19.50 20.50
Department of Information & Communications Technology Total
127

Department of Information & Communications TechnologyEngage Toledo
Position Title 2019 Budget 2020 Approved 2020 Amended 2021 ProposedCommissioner-Public Services - 1.00 1.00 0.50 Customer Service Contact Center Representative-Et - 15.00 13.00 11.77 Customer Service Contact Center Supervisor-Et - 2.00 1.00 1.00 Manager-Public Services - 0.50 - - Total - 18.50 15.00 13.27
2021 Proposed Budget -Information & Communications Technology
Expenditure Category & Source of Funds General Fund
Special Revenue Funds
Debt Service Funds
Capital Projects Funds
Enterprise Funds
Internal Service Funds Total
Labor 122,429 - - - - 1,476,410 1,598,839
Overtime 50,000 - - - - 25,000 75,000
Pension 24,540 - - - - 210,197 234,737
Employment Taxes & Medical 57,592 - - - - 295,332 352,924
Other Personnel 3,950 - - - - 6,338 10,288
Supplies 19,850 - - - - 304,600 324,450
Services 6,956 - - - - 4,820,979 4,827,935
Capital - - - 4,030,000 - - 4,030,000
Debt, Transfers & Other - - - - - - -
Total 285,317 - - 4,030,000 - 7,138,857 11,454,174
Capital Improvement
Expenditure Category 2017 Actual 2018 Actual 2019 Actual 2020 Approved 2020 Amended 2021 Proposed
Labor - - - - - -
Overtime - - - - - -
Pension - - - - - -
Employment Taxes & Medical - - - - - -
Other Personnel - - - - - -
Supplies - - - - - -
Services 197,038 263,043 653,292 - 2,829,409 -
Capital - - - 1,900,000 - 4,030,000
Debt, Transfers & Other - - - - - -
Total 197,038 263,043 653,292 1,900,000 2,829,409 4,030,000
128
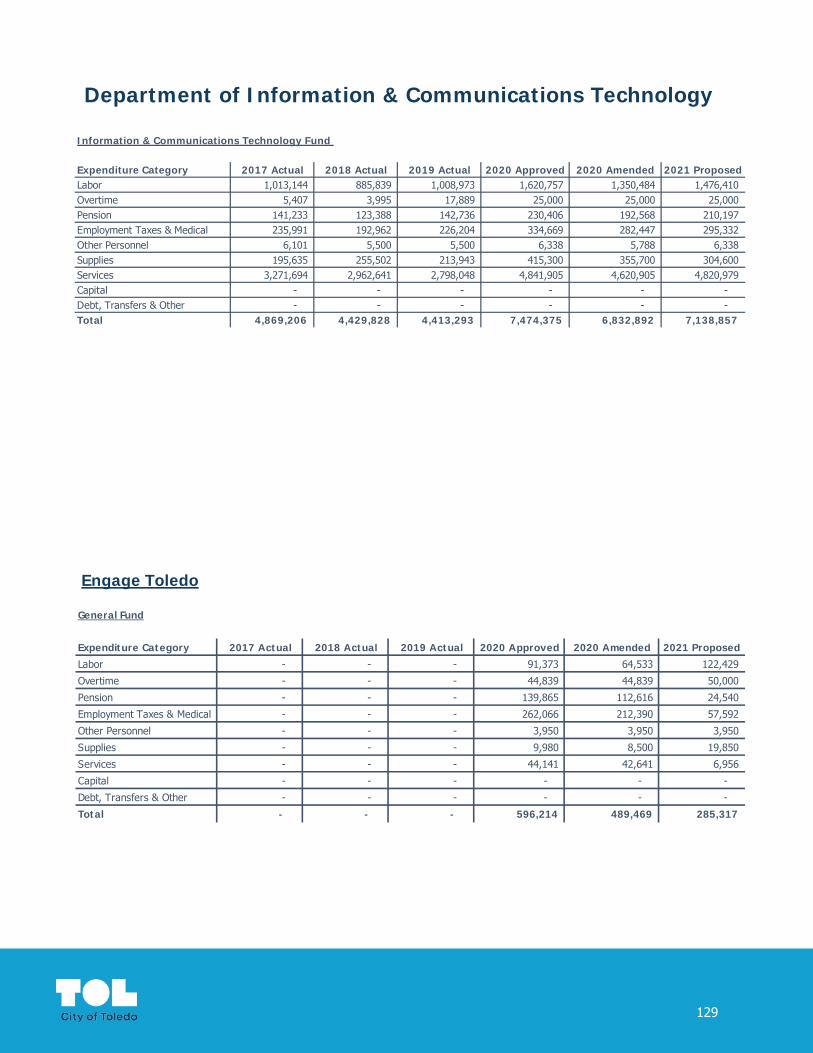
Department of Information & Communications Technology
General Fund
Expenditure Category 2017 Actual 2018 Actual 2019 Actual 2020 Approved 2020 Amended 2021 Proposed
Labor - - - 91,373 64,533 122,429
Overtime - - - 44,839 44,839 50,000
Pension - - - 139,865 112,616 24,540
Employment Taxes & Medical - - - 262,066 212,390 57,592
Other Personnel - - - 3,950 3,950 3,950
Supplies - - - 9,980 8,500 19,850
Services - - - 44,141 42,641 6,956
Capital - - - - - -
Debt, Transfers & Other - - - - - -
Total - - - 596,214 489,469 285,317
Engage Toledo
Information & Communications Technology Fund
Expenditure Category 2017 Actual 2018 Actual 2019 Actual 2020 Approved 2020 Amended 2021 ProposedLabor 1,013,144 885,839 1,008,973 1,620,757 1,350,484 1,476,410 Overtime 5,407 3,995 17,889 25,000 25,000 25,000 Pension 141,233 123,388 142,736 230,406 192,568 210,197 Employment Taxes & Medical 235,991 192,962 226,204 334,669 282,447 295,332 Other Personnel 6,101 5,500 5,500 6,338 5,788 6,338 Supplies 195,635 255,502 213,943 415,300 355,700 304,600 Services 3,271,694 2,962,641 2,798,048 4,841,905 4,620,905 4,820,979 Capital - - - - - - Debt, Transfers & Other - - - - - - Total 4,869,206 4,429,828 4,413,293 7,474,375 6,832,892 7,138,857
129
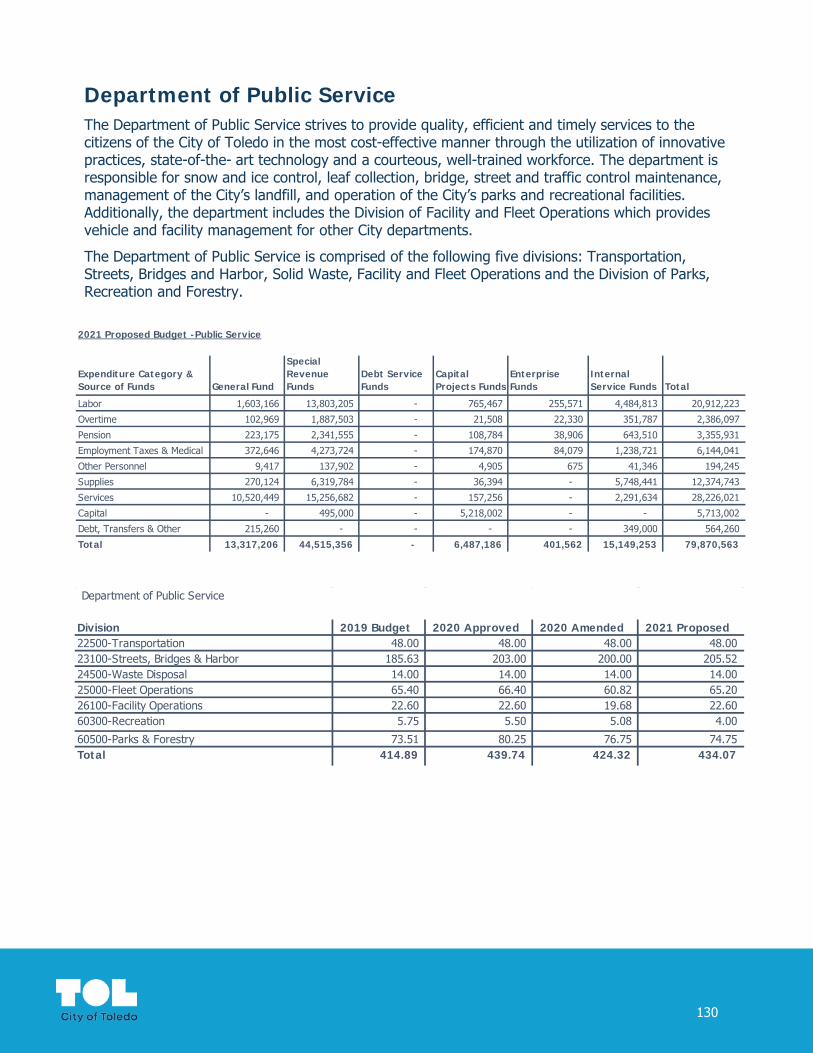
Department of Public ServiceThe Department of Public Service strives to provide quality, efficient and timely services to the citizens of the City of Toledo in the most cost-effective manner through the utilization of innovative practices, state-of-the- art technology and a courteous, well-trained workforce. The department is responsible for snow and ice control, leaf collection, bridge, street and traffic control maintenance, management of the City’s landfill, and operation of the City’s parks and recreational facilities. Additionally, the department includes the Division of Facility and Fleet Operations which provides vehicle and facility management for other City departments.
The Department of Public Service is comprised of the following five divisions: Transportation, Streets, Bridges and Harbor, Solid Waste, Facility and Fleet Operations and the Division of Parks, Recreation and Forestry.
Department of Public Service
Division 2019 Budget 2020 Approved 2020 Amended 2021 Proposed22500-Transportation 48.00 48.00 48.00 48.00 23100-Streets, Bridges & Harbor 185.63 203.00 200.00 205.52 24500-Waste Disposal 14.00 14.00 14.00 14.00 25000-Fleet Operations 65.40 66.40 60.82 65.20 26100-Facility Operations 22.60 22.60 19.68 22.60 60300-Recreation 5.75 5.50 5.08 4.00
60500-Parks & Forestry 73.51 80.25 76.75 74.75 Total 414.89 439.74 424.32 434.07
2021 Proposed Budget -Public Service
Expenditure Category & Source of Funds General Fund
Special Revenue Funds
Debt Service Funds
Capital Projects Funds
Enterprise Funds
Internal Service Funds Total
Labor 1,603,166 13,803,205 - 765,467 255,571 4,484,813 20,912,223
Overtime 102,969 1,887,503 - 21,508 22,330 351,787 2,386,097
Pension 223,175 2,341,555 - 108,784 38,906 643,510 3,355,931
Employment Taxes & Medical 372,646 4,273,724 - 174,870 84,079 1,238,721 6,144,041
Other Personnel 9,417 137,902 - 4,905 675 41,346 194,245
Supplies 270,124 6,319,784 - 36,394 - 5,748,441 12,374,743
Services 10,520,449 15,256,682 - 157,256 - 2,291,634 28,226,021
Capital - 495,000 - 5,218,002 - - 5,713,002
Debt, Transfers & Other 215,260 - - - - 349,000 564,260
Total 13,317,206 44,515,356 - 6,487,186 401,562 15,149,253 79,870,563
130

Department of Public ServiceTransportation
Position Title 2019 Budget 2020 Approved 2020 Amended 2021 ProposedAdministrative Operations Officer 1.00 1.00 1.00 1.00 Administrative Specialist - - - 1.00 Clerk Specialist 1 1.00 1.00 1.00 1.00 Clerk Specialist Ii - - - 1.00 Commissioner-Public Services 1.00 1.00 1.00 1.00 Drafter 1.00 - - - Engineering Associate 2.00 2.00 2.00 2.00 Equipment Operator 2.00 2.00 2.00 2.00
Intermediate Traffic Technician 1.00 1.00 1.00 1.00 Painter 3.00 3.00 3.00 3.00 Professional Engineer 1.00 - - - Secretary 2 1.00 1.00 1.00 - Senior Professional Engineer 2.00 2.00 2.00 2.00 Senior Storekeeper 1.00 1.00 1.00 1.00 Senior Traffic Signal Technician 3.00 3.00 3.00 3.00 Senior Traffic Technician 3.00 3.00 3.00 3.00 Sign Painter 2.00 2.00 2.00 2.00
Sign Poster 2.00 2.00 2.00 2.00 Staff Professional Engineer 1.00 2.00 2.00 2.00 Superintendent-Sign Shop 1.00 1.00 1.00 1.00 Superintendent-Traffic Signals 1.00 1.00 1.00 1.00 Supervisor-Instrumentation 1.00 1.00 1.00 1.00 Supervisor-Traffic Signs And Painting 1.00 1.00 1.00 1.00 Traffic Signal Technician 11.00 11.00 11.00 11.00 Traffic Technician 2.00 2.00 2.00 2.00 Utility Worker 3.00 4.00 4.00 3.00 Total 48.00 48.00 48.00 48.00
Streets, Bridges & Harbor
Position Title 2019 Budget 2020 Approved 2020 Amended 2021 ProposedAdministrative Assistant - 1.00 1.00 1.00 Administrative Operations Officer 1.00 1.00 1.00 1.00 Administrator-Public Services 1 1.00 - - - Bridge Mechanic 9.00 9.00 9.00 9.00 Bridge Operator 5.00 5.00 5.00 5.00 Building & Grounds Maintenance 1.00 2.00 2.00 2.00
Clerk Specialist 1 5.00 2.00 2.00 2.00 Clerk Specialist 2 1.00 1.00 1.00 2.00 Commissioner-Public Services 1.00 1.00 1.00 1.00 Deputy Director-Public Services - 1.00 - 1.00 Director-Public Services 1.00 1.00 1.00 1.00 Engineering Associate 1.00 1.00 1.00 1.00 Equipment And Records Technician 1.00 1.00 1.00 1.00
General Foreman-Streets 10.12 11.00 11.00 11.00 Gis Analyst 1 1.00 1.00 1.00 1.00 Heavy Equipment Operator 1 6.00 15.00 15.00 15.00 Heavy Equipment Operator 2 40.00 31.00 31.00 31.00
131

Department of Public ServicePosition Title 2019 Budget 2020 Approved 2020 Amended 2021 ProposedMail Clerk - 1.00 1.00 1.00 Maintenance Worker 2 - 84.00 84.00 84.00 Maintenance Worker I 69.40 - - 1.00 Manager-Administrative Services 1.00 1.00 - - Manager-Public Services 4.00 4.00 4.00 3.00 Professional Engineer 1.00 1.00 1.00 1.00 Public Information Officer - - - 0.50
Safety & Training Specialist 1.00 2.00 1.00 2.00 Secretary 2 1.00 1.00 1.00 1.00 Secretary 3 1.00 - - - Senior Bridge Mechanic 3.00 3.00 3.00 3.00 Senior Building And Grounds Maintenance Worker 1.00 1.00 1.00 1.00 Senior Construction Technician - 2.00 2.00 2.00 Senior Professional Engineer 1.00 1.00 1.00 1.00
Senior Storekeeper 2.00 2.00 2.00 2.00 Staff Professional Engineer 1.00 1.00 1.00 1.00 Storekeeper 1.00 1.00 1.00 1.00 Street Maintenance Technician 11.11 11.00 11.00 12.00 Superintendent-Streets 1.00 1.00 1.00 1.00 Supervisor-Bridge Maintenance 1.00 1.00 1.00 1.00 Supervisor-Storeroom - - - 1.00 Supervisor-Street Operations 1.00 1.00 1.00 1.00 Total 185.63 203.00 200.00 205.52
Waste Disposal
Position Title 2019 Budget 2020 Approved 2020 Amended 2021 ProposedAdministrative Specialist 1.00 1.00 1.00 1.00 Heavy Equipment Mechanic 1.00 1.00 1.00 1.00 Intermediate Clerk 1.00 1.00 1.00 1.00 Landfill Equipment Operator 6.00 6.00 6.00 6.00 Lead Landfill Equipment Operator - - - 0.50 Manager-Public Services 1.00 1.00 1.00 1.00 Senior Professional Engineer 1.00 1.00 1.00 1.00 Superintendent-Waste Disposal 1.00 1.00 1.00 0.50 Tandem Truck Driver 1.00 1.00 1.00 1.00 Utility Worker 1.00 1.00 1.00 1.00 Total 14.00 14.00 14.00 14.00
132
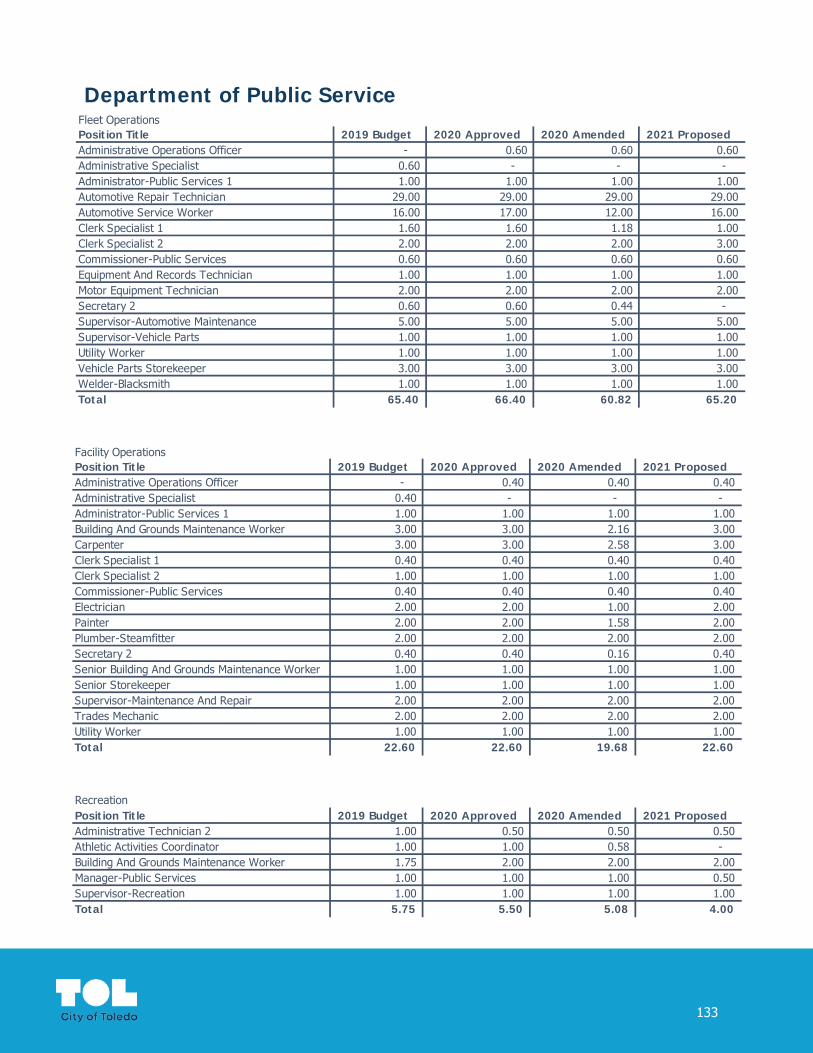
Department of Public ServiceFleet OperationsPosition Title 2019 Budget 2020 Approved 2020 Amended 2021 ProposedAdministrative Operations Officer - 0.60 0.60 0.60 Administrative Specialist 0.60 - - - Administrator-Public Services 1 1.00 1.00 1.00 1.00 Automotive Repair Technician 29.00 29.00 29.00 29.00 Automotive Service Worker 16.00 17.00 12.00 16.00 Clerk Specialist 1 1.60 1.60 1.18 1.00 Clerk Specialist 2 2.00 2.00 2.00 3.00 Commissioner-Public Services 0.60 0.60 0.60 0.60 Equipment And Records Technician 1.00 1.00 1.00 1.00 Motor Equipment Technician 2.00 2.00 2.00 2.00 Secretary 2 0.60 0.60 0.44 - Supervisor-Automotive Maintenance 5.00 5.00 5.00 5.00 Supervisor-Vehicle Parts 1.00 1.00 1.00 1.00 Utility Worker 1.00 1.00 1.00 1.00 Vehicle Parts Storekeeper 3.00 3.00 3.00 3.00 Welder-Blacksmith 1.00 1.00 1.00 1.00 Total 65.40 66.40 60.82 65.20
Facility OperationsPosition Title 2019 Budget 2020 Approved 2020 Amended 2021 ProposedAdministrative Operations Officer - 0.40 0.40 0.40 Administrative Specialist 0.40 - - - Administrator-Public Services 1 1.00 1.00 1.00 1.00 Building And Grounds Maintenance Worker 3.00 3.00 2.16 3.00 Carpenter 3.00 3.00 2.58 3.00 Clerk Specialist 1 0.40 0.40 0.40 0.40 Clerk Specialist 2 1.00 1.00 1.00 1.00 Commissioner-Public Services 0.40 0.40 0.40 0.40 Electrician 2.00 2.00 1.00 2.00 Painter 2.00 2.00 1.58 2.00 Plumber-Steamfitter 2.00 2.00 2.00 2.00 Secretary 2 0.40 0.40 0.16 0.40 Senior Building And Grounds Maintenance Worker 1.00 1.00 1.00 1.00 Senior Storekeeper 1.00 1.00 1.00 1.00 Supervisor-Maintenance And Repair 2.00 2.00 2.00 2.00 Trades Mechanic 2.00 2.00 2.00 2.00 Utility Worker 1.00 1.00 1.00 1.00 Total 22.60 22.60 19.68 22.60
RecreationPosition Title 2019 Budget 2020 Approved 2020 Amended 2021 ProposedAdministrative Technician 2 1.00 0.50 0.50 0.50 Athletic Activities Coordinator 1.00 1.00 0.58 - Building And Grounds Maintenance Worker 1.75 2.00 2.00 2.00 Manager-Public Services 1.00 1.00 1.00 0.50 Supervisor-Recreation 1.00 1.00 1.00 1.00 Total 5.75 5.50 5.08 4.00
133

Department of Public ServiceParks and Forestry Position Title 2019 Budget 2020 Approved 2020 Amended 2021 ProposedAdministrative Operations Officer - - - 1.00 Administrative Services Officer 1 0.77 - - - Administrative Specialist 1.00 1.00 1.00 - Administrative Specialist 2 - 1.00 1.00 1.00 Administrative Technician 0.75 1.00 0.58 - Administrative Technician 2 1.00 1.50 1.10 0.50 Building And Grounds Maintenance Worker 8.00 9.00 9.00 9.00 Cemeteries Maintenance Worker 2.00 2.00 1.16 - Clerk Specialist 1 - (1.00) (1.00) - Clerk Specialist 2 2.00 3.00 3.00 3.00 Commissioner-Public Services 1.00 1.00 1.00 1.00 Equipment Repair Technician 3.00 1.00 0.58 1.00 Foreman-Cemeteries 1.00 1.00 0.58 - Foreman-Forestry - 2.00 2.00 2.00 Foreman-Parks 3.00 3.00 3.00 3.00 Forestry Crew Leader 9.00 10.00 10.00 10.00 Forestry Inspector 1.00 1.00 1.00 1.00 General Foreman-Forestry - 1.00 1.00 1.00 Landscape Maintenance Worker 4.00 6.00 6.00 6.00 Manager-Public Services 1.00 1.75 1.75 1.50 Public Services Officer 1 - 1.00 - 0.75 Public Services Officer 3 - 1.00 1.00 1.00 Secretary 2 1.00 - - - Senior Building And Grounds Maintenance Worker - 1.00 1.00 1.00 Senior Equipment Repair Technician 1.00 1.00 1.00 1.00 Senior Landscape Maintenance Worker 2.00 2.00 2.00 2.00 Senior Park Planner - 1.00 1.00 1.00 Superintendent-Parks 1.00 1.00 1.00 1.00 Supervisor-Forestry 3.00 - - - Tandem Truck Driver 1.00 1.00 1.00 1.00 Tree Maintenance Worker 1.00 1.00 1.00 1.00 Tree Service Worker 20.00 20.00 20.00 20.00 Utility Worker 5.00 5.00 5.00 4.00 Total 73.51 80.25 76.75 74.75
134

Department of Public Service
Division of TransportationThe Division of Transportation provides and maintains safe and efficient traffic flow on public roadways in the City using accepted design practices and appropriate traffic control devices. The division is responsible for traffic control planning and design and operation and maintenance of traffic control devices and systems.
Funding Sources
Transportation is funded with general fund dollars, street construction, maintenance and repair (SCM&R) dollars and capital improvement dollars.
2021 Highlights
The Division of Transportation budget supports 48.00 FTEs with a total labor cost of $3,986,685 proposed for 2021.
Transportation’s 2021 proposed budget includes $150,000 for continuing the ToleGO bike share program.
General Fund
Expenditure Category 2017 Actual 2018 Actual 2019 Actual 2020 Approved 2020 Amended 2021 ProposedLabor - - - - - - Overtime - - - - - - Pension - - - - - - Employment Taxes & Medical - - - - - - Other Personnel - - - - - - Supplies - - - - - - Services - 112,500 200,000 150,000 150,000 150,000 Capital - - - - - - Debt, Transfers & Other - - - - - - Total - 112,500 200,000 150,000 150,000 150,000
Street Construction, Maintenance & Repair
Expenditure Category 2017 Actual 2018 Actual 2019 Actual 2020 Approved 2020 Amended 2021 ProposedLabor 1,772,598 1,851,585 1,830,815 2,409,244 2,409,244 2,277,878 Overtime 82,063 71,955 89,636 90,464 90,464 88,548 Pension 245,272 258,626 273,097 318,371 318,371 317,052 Employment Taxes & Medical 546,727 475,981 543,537 584,716 584,716 568,055 Other Personnel 6,637 9,212 9,501 15,127 15,127 14,907 Supplies 442,794 382,213 444,726 542,420 568,955 542,420 Services 1,047,596 929,352 999,862 1,034,861 1,034,861 1,159,068 Capital - 390,665 75,507 30,000 31,300 30,000 Debt, Transfers & Other - - - - - - Total 4,143,687 4,369,587 4,266,681 5,025,203 5,053,038 4,997,928
135
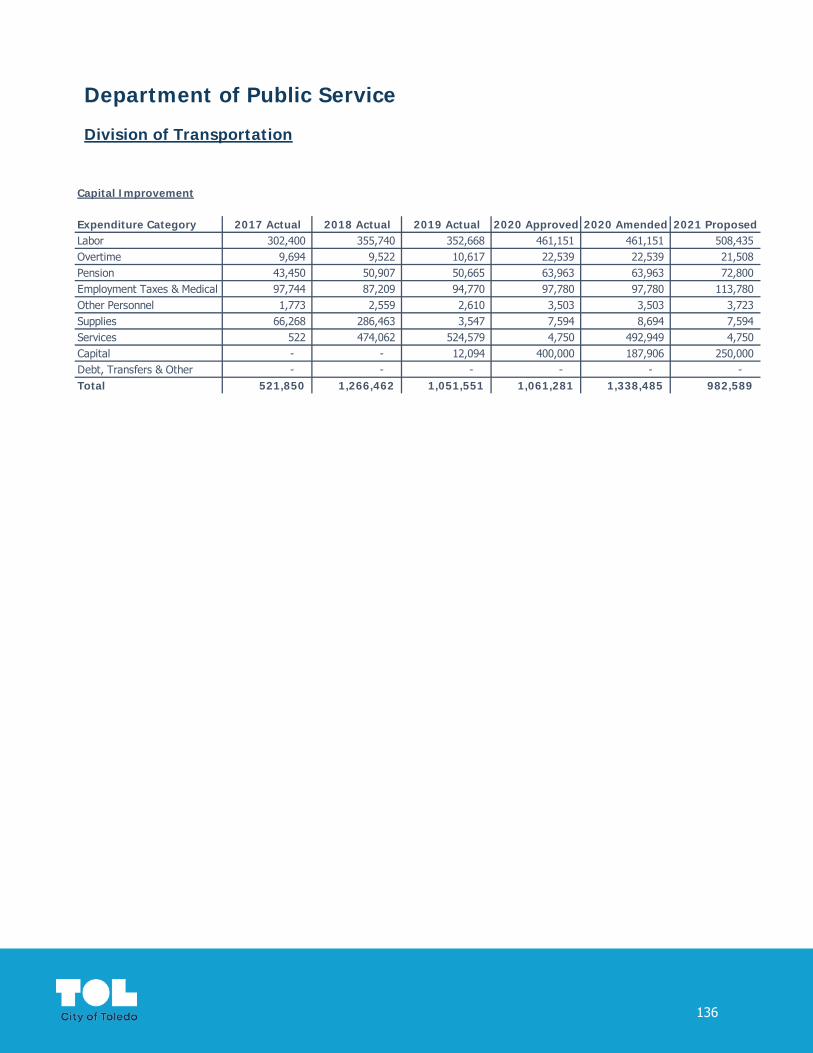
Department of Public Service
Division of Transportation
Capital Improvement
Expenditure Category 2017 Actual 2018 Actual 2019 Actual 2020 Approved 2020 Amended 2021 ProposedLabor 302,400 355,740 352,668 461,151 461,151 508,435 Overtime 9,694 9,522 10,617 22,539 22,539 21,508 Pension 43,450 50,907 50,665 63,963 63,963 72,800 Employment Taxes & Medical 97,744 87,209 94,770 97,780 97,780 113,780 Other Personnel 1,773 2,559 2,610 3,503 3,503 3,723 Supplies 66,268 286,463 3,547 7,594 8,694 7,594 Services 522 474,062 524,579 4,750 492,949 4,750 Capital - - 12,094 400,000 187,906 250,000 Debt, Transfers & Other - - - - - - Total 521,850 1,266,462 1,051,551 1,061,281 1,338,485 982,589
136
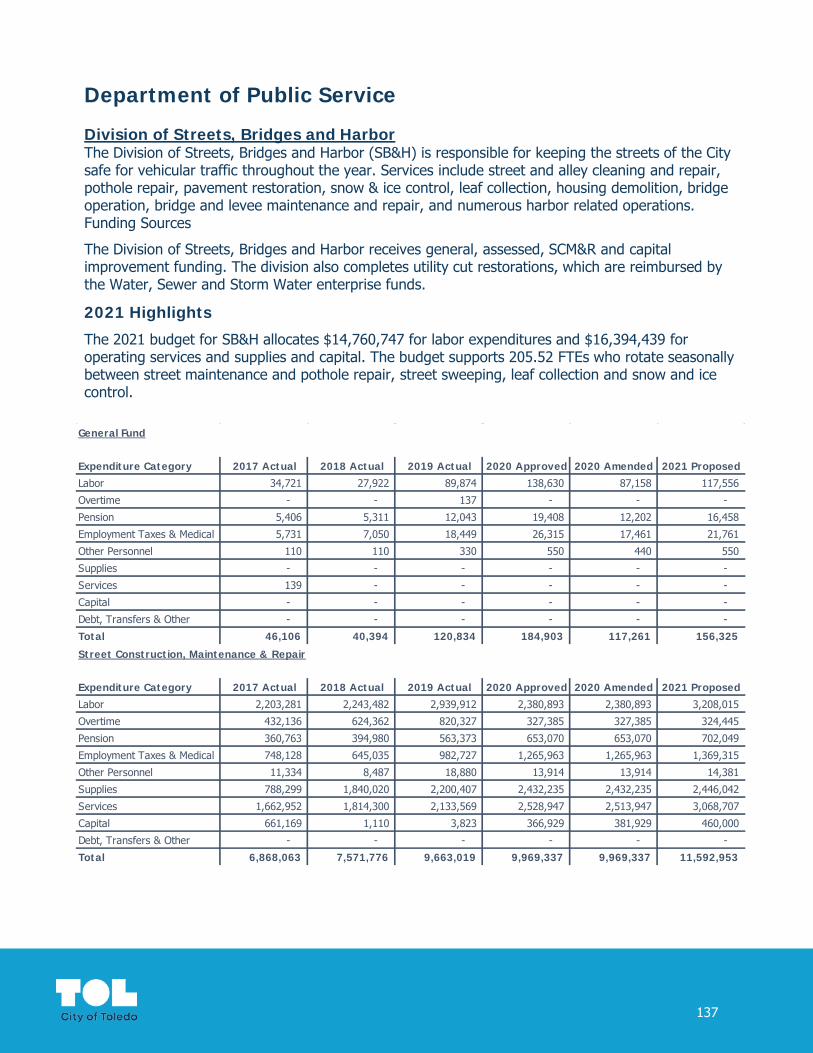
Department of Public Service
Division of Streets, Bridges and HarborThe Division of Streets, Bridges and Harbor (SB&H) is responsible for keeping the streets of the City safe for vehicular traffic throughout the year. Services include street and alley cleaning and repair, pothole repair, pavement restoration, snow & ice control, leaf collection, housing demolition, bridge operation, bridge and levee maintenance and repair, and numerous harbor related operations.Funding Sources
The Division of Streets, Bridges and Harbor receives general, assessed, SCM&R and capital improvement funding. The division also completes utility cut restorations, which are reimbursed by the Water, Sewer and Storm Water enterprise funds.
2021 Highlights
The 2021 budget for SB&H allocates $14,760,747 for labor expenditures and $16,394,439 for operating services and supplies and capital. The budget supports 205.52 FTEs who rotate seasonally between street maintenance and pothole repair, street sweeping, leaf collection and snow and ice control.
General Fund
Expenditure Category 2017 Actual 2018 Actual 2019 Actual 2020 Approved 2020 Amended 2021 Proposed
Labor 34,721 27,922 89,874 138,630 87,158 117,556
Overtime - - 137 - - -
Pension 5,406 5,311 12,043 19,408 12,202 16,458
Employment Taxes & Medical 5,731 7,050 18,449 26,315 17,461 21,761
Other Personnel 110 110 330 550 440 550
Supplies - - - - - -
Services 139 - - - - -
Capital - - - - - -
Debt, Transfers & Other - - - - - -
Total 46,106 40,394 120,834 184,903 117,261 156,325
Street Construction, Maintenance & Repair
Expenditure Category 2017 Actual 2018 Actual 2019 Actual 2020 Approved 2020 Amended 2021 Proposed
Labor 2,203,281 2,243,482 2,939,912 2,380,893 2,380,893 3,208,015
Overtime 432,136 624,362 820,327 327,385 327,385 324,445
Pension 360,763 394,980 563,373 653,070 653,070 702,049
Employment Taxes & Medical 748,128 645,035 982,727 1,265,963 1,265,963 1,369,315
Other Personnel 11,334 8,487 18,880 13,914 13,914 14,381
Supplies 788,299 1,840,020 2,200,407 2,432,235 2,432,235 2,446,042
Services 1,662,952 1,814,300 2,133,569 2,528,947 2,513,947 3,068,707
Capital 661,169 1,110 3,823 366,929 381,929 460,000
Debt, Transfers & Other - - - - - -
Total 6,868,063 7,571,776 9,663,019 9,969,337 9,969,337 11,592,953
137

Department of Public Service
Division of Streets, Bridges and HarborSpecial Assessment
Expenditure Category 2017 Actual 2018 Actual 2019 Actual 2020 Approved 2020 Amended 2021 Proposed
Labor 3,578,649 3,298,176 3,601,464 4,859,275 4,859,275 4,884,083
Overtime 966,119 1,009,172 1,431,653 1,214,804 1,214,804 1,200,542
Pension 663,238 651,882 661,395 818,704 818,704 830,740
Employment Taxes & Medical 1,358,862 1,203,191 1,221,703 1,379,763 1,379,763 1,403,211
Other Personnel 32,785 44,853 54,330 97,662 97,662 97,662
Supplies 489,827 2,426,200 2,487,882 2,666,098 2,249,398 2,624,085
Services 6,766,375 6,529,293 6,697,036 7,038,641 7,455,341 7,201,356
Capital 620 256 416 5,842 5,842 5,000
Debt, Transfers & Other - - - - - -
Total 13,856,474 15,163,023 16,155,879 18,080,789 18,080,789 18,246,678
Capital Improvement
Expenditure Category 2017 Actual 2018 Actual 2019 Actual 2020 Approved 2020 Amended 2021 Proposed
Labor 88,713 170,042 89,121 112,034 112,034 119,245
Overtime 21,725 45,931 39,967 - - -
Pension 25,581 24,286 17,930 15,685 15,685 16,694
Employment Taxes & Medical 66,529 37,756 29,652 31,007 31,007 32,397
Other Personnel 207 368 477 83 83 83
Supplies 550,798 102,518 36,886 28,800 91,218 28,800
Services 3,403,573 1,212,070 3,334,681 10,450 3,712,117 10,450
Capital - 547,239 929,348 1,600,000 502,606 550,000
Debt, Transfers & Other - - - - - -
Total 4,157,128 2,140,210 4,478,062 1,798,058 4,464,749 757,668
Sewer
Expenditure Category 2017 Actual 2018 Actual 2019 Actual 2020 Approved 2020 Amended 2021 Proposed
Labor 281,585 312,892 159,456 256,550 256,550 255,571
Overtime 118,502 132,436 35,954 22,330 22,330 22,330
Pension 41,040 58,146 27,888 39,043 39,043 38,906
Employment Taxes & Medical 137,392 121,743 66,686 83,915 83,915 84,079
Other Personnel 3,651 1,508 866 675 675 675
Supplies 138,000 145,947 70,077 1,100 1,100 -
Services 13,388 18,101 7,996 7,500 7,500 -
Capital - - - - - -
Debt, Transfers & Other - - - - - -
Total 733,559 790,774 368,923 411,113 411,113 401,562
138
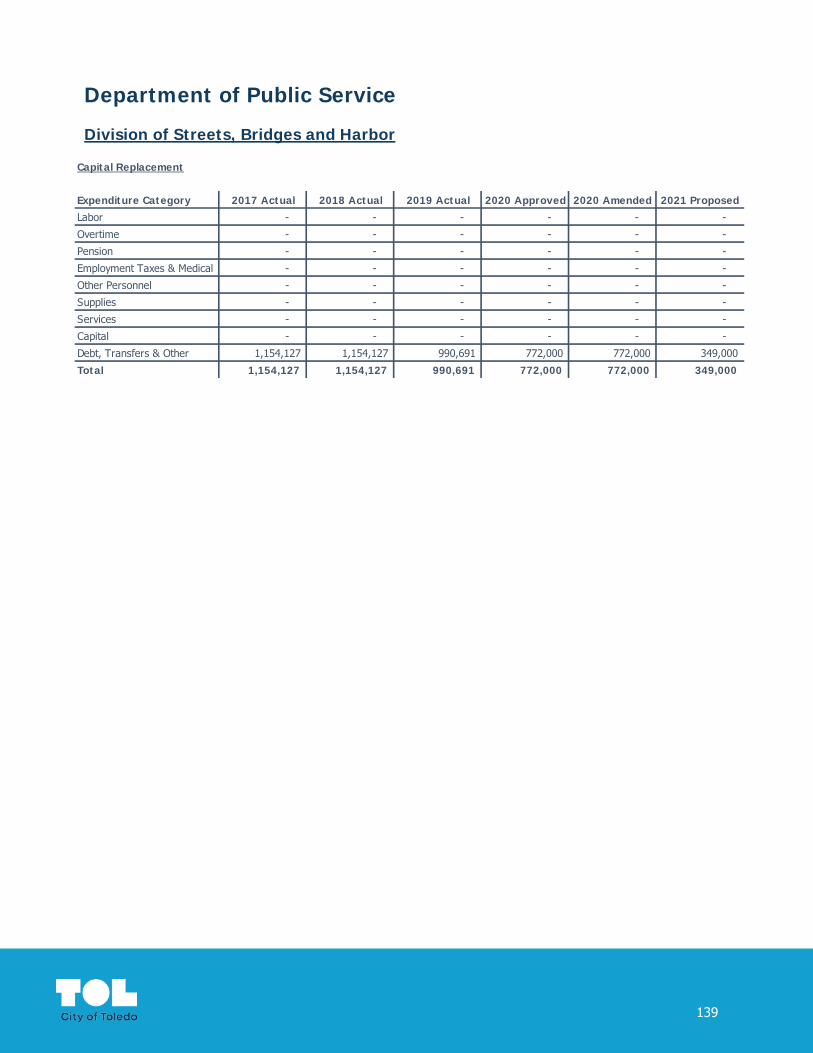
Department of Public Service
Division of Streets, Bridges and Harbor
Capital Replacement
Expenditure Category 2017 Actual 2018 Actual 2019 Actual 2020 Approved 2020 Amended 2021 Proposed
Labor - - - - - -
Overtime - - - - - -
Pension - - - - - -
Employment Taxes & Medical - - - - - -
Other Personnel - - - - - -
Supplies - - - - - -
Services - - - - - -
Capital - - - - - -
Debt, Transfers & Other 1,154,127 1,154,127 990,691 772,000 772,000 349,000
Total 1,154,127 1,154,127 990,691 772,000 772,000 349,000
139
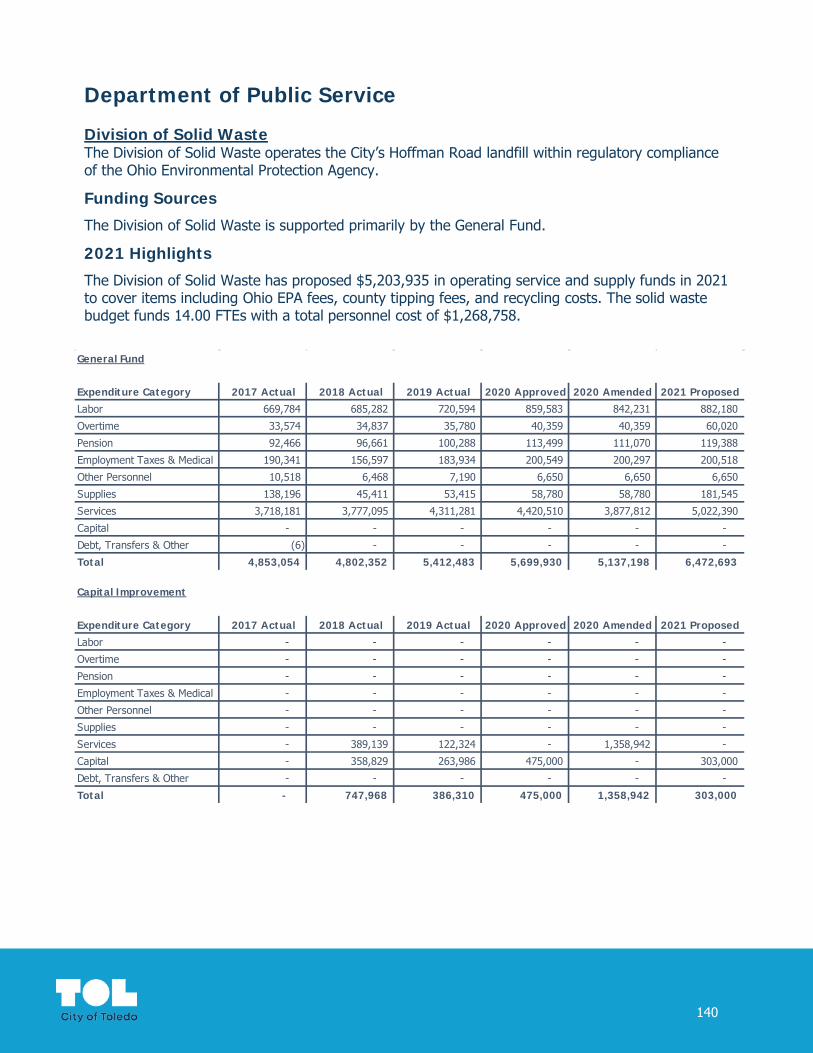
Department of Public Service
Division of Solid WasteThe Division of Solid Waste operates the City’s Hoffman Road landfill within regulatory compliance of the Ohio Environmental Protection Agency.
Funding Sources
The Division of Solid Waste is supported primarily by the General Fund.
2021 Highlights
The Division of Solid Waste has proposed $5,203,935 in operating service and supply funds in 2021 to cover items including Ohio EPA fees, county tipping fees, and recycling costs. The solid waste budget funds 14.00 FTEs with a total personnel cost of $1,268,758.
General Fund
Expenditure Category 2017 Actual 2018 Actual 2019 Actual 2020 Approved 2020 Amended 2021 Proposed
Labor 669,784 685,282 720,594 859,583 842,231 882,180
Overtime 33,574 34,837 35,780 40,359 40,359 60,020
Pension 92,466 96,661 100,288 113,499 111,070 119,388
Employment Taxes & Medical 190,341 156,597 183,934 200,549 200,297 200,518
Other Personnel 10,518 6,468 7,190 6,650 6,650 6,650
Supplies 138,196 45,411 53,415 58,780 58,780 181,545
Services 3,718,181 3,777,095 4,311,281 4,420,510 3,877,812 5,022,390
Capital - - - - - -
Debt, Transfers & Other (6) - - - - -
Total 4,853,054 4,802,352 5,412,483 5,699,930 5,137,198 6,472,693
Capital Improvement
Expenditure Category 2017 Actual 2018 Actual 2019 Actual 2020 Approved 2020 Amended 2021 Proposed
Labor - - - - - -
Overtime - - - - - -
Pension - - - - - -
Employment Taxes & Medical - - - - - -
Other Personnel - - - - - -
Supplies - - - - - -
Services - 389,139 122,324 - 1,358,942 -
Capital - 358,829 263,986 475,000 - 303,000
Debt, Transfers & Other - - - - - -
Total - 747,968 386,310 475,000 1,358,942 303,000
140
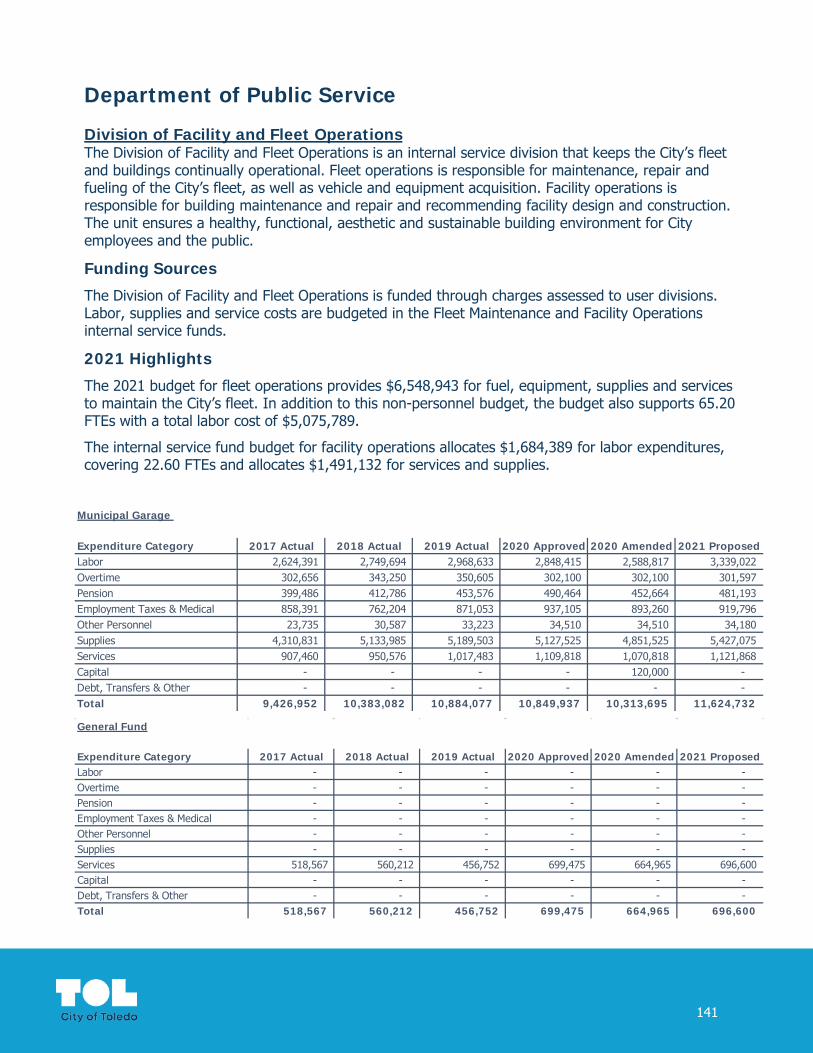
Department of Public Service
Division of Facility and Fleet OperationsThe Division of Facility and Fleet Operations is an internal service division that keeps the City’s fleet and buildings continually operational. Fleet operations is responsible for maintenance, repair and fueling of the City’s fleet, as well as vehicle and equipment acquisition. Facility operations is responsible for building maintenance and repair and recommending facility design and construction. The unit ensures a healthy, functional, aesthetic and sustainable building environment for City employees and the public.
Funding Sources
The Division of Facility and Fleet Operations is funded through charges assessed to user divisions. Labor, supplies and service costs are budgeted in the Fleet Maintenance and Facility Operations internal service funds.
2021 Highlights
The 2021 budget for fleet operations provides $6,548,943 for fuel, equipment, supplies and services to maintain the City’s fleet. In addition to this non-personnel budget, the budget also supports 65.20 FTEs with a total labor cost of $5,075,789.
The internal service fund budget for facility operations allocates $1,684,389 for labor expenditures, covering 22.60 FTEs and allocates $1,491,132 for services and supplies.
Municipal Garage
Expenditure Category 2017 Actual 2018 Actual 2019 Actual 2020 Approved 2020 Amended 2021 ProposedLabor 2,624,391 2,749,694 2,968,633 2,848,415 2,588,817 3,339,022 Overtime 302,656 343,250 350,605 302,100 302,100 301,597 Pension 399,486 412,786 453,576 490,464 452,664 481,193 Employment Taxes & Medical 858,391 762,204 871,053 937,105 893,260 919,796 Other Personnel 23,735 30,587 33,223 34,510 34,510 34,180 Supplies 4,310,831 5,133,985 5,189,503 5,127,525 4,851,525 5,427,075 Services 907,460 950,576 1,017,483 1,109,818 1,070,818 1,121,868 Capital - - - - 120,000 - Debt, Transfers & Other - - - - - - Total 9,426,952 10,383,082 10,884,077 10,849,937 10,313,695 11,624,732
General Fund
Expenditure Category 2017 Actual 2018 Actual 2019 Actual 2020 Approved 2020 Amended 2021 ProposedLabor - - - - - - Overtime - - - - - - Pension - - - - - - Employment Taxes & Medical - - - - - - Other Personnel - - - - - - Supplies - - - - - - Services 518,567 560,212 456,752 699,475 664,965 696,600 Capital - - - - - - Debt, Transfers & Other - - - - - - Total 518,567 560,212 456,752 699,475 664,965 696,600
141

Department of Public Service
Division of Facility and Fleet Operations
Capital Improvement
Expenditure Category 2017 Actual 2018 Actual 2019 Actual 2020 Approved 2020 Amended 2021 ProposedLabor - - - - - - Overtime - - - - - - Pension - - - - - - Employment Taxes & Medical - - - - - - Other Personnel - - - - - - Supplies 17,780 - (5,530) - 54,535 - Services 525,961 455,853 891,824 127,582 567,778 142,056 Capital - - - 250,000 14,984 2,600,000 Debt, Transfers & Other - - - - - - Total 543,741 455,853 886,294 377,582 637,297 2,742,056
Facility Operations
Expenditure Category 2017 Actual 2018 Actual 2019 Actual 2020 Approved 2020 Amended 2021 ProposedLabor 839,253 895,004 996,025 1,213,591 1,040,636 1,145,791 Overtime 51,837 56,431 48,713 50,325 50,325 50,190 Pension 121,584 131,984 144,718 164,219 137,541 162,317 Employment Taxes & Medical 286,333 252,045 300,159 320,117 348,831 318,925 Other Personnel 4,617 4,035 6,066 5,666 5,666 7,166 Supplies 320,959 343,285 296,010 327,354 298,723 321,366 Services 1,151,524 1,162,544 1,067,549 1,147,313 1,104,010 1,169,766 Capital - - - - - - Debt, Transfers & Other - - - - - - Total 2,776,107 2,845,327 2,859,240 3,228,585 2,985,733 3,175,521
142

Department of Public Service
Division of Parks, Recreation and ForestryThe Division of Parks, Recreation and Forestry is dedicated to the effective management of Toledo’s greenspaces thereby improving the quality of life for all citizens and visitors. Parks & Forestry is responsible for the maintenance and management of street trees, parks, boulevards & triangles, weed control and cemeteries. Recreation operates the City’s recreational facilities, maintains athletic fields, and administers programs and events including Pumpkinarama, the Fishing Rodeo, and concerts at Ottawa Park.
Funding Sources
The Division of Parks, Recreation and Forestry primarily uses General Fund and assessed dollars to support operations.
2021 Highlights
The 2021 proposed budget for the Division of Parks, Recreation & Forestry includes $6,216,170 for labor related expenditures and $9,274,826 for operating service and supply expenditures, including contractual and seasonal budget for mowing parks, boulevards, and triangles.
General Fund
Parks & ForestryExpenditure Category 2017 Actual 2018 Actual 2019 Actual 2020 Approved 2020 Amended 2021 Proposed
Labor 264,725 291,161 318,093 658,470 408,712 393,497
Overtime 19,924 18,792 23,505 23,915 23,915 15,949
Pension 39,408 42,862 50,066 93,647 56,933 54,158
Employment Taxes & Medical 60,979 62,136 135,574 184,649 233,804 93,554
Other Personnel 346 896 1,686 2,108 2,108 992
Supplies 63,474 60,672 58,474 54,750 54,750 39,341
Services 1,599,807 2,165,592 2,179,707 3,603,748 3,622,338 3,919,306
Capital - - - - - -
Debt, Transfers & Other - - - 40,000 115,000 40,000
Total 2,048,664 2,642,111 2,767,104 4,661,286 4,517,560 4,556,797
Special Assessment
Parks & ForestryExpenditure Category 2017 Actual 2018 Actual 2019 Actual 2020 Approved 2020 Amended 2021 Proposed
Labor 2,182,649 2,215,586 2,447,445 3,120,122 3,120,122 3,433,228
Overtime 262,685 214,406 350,824 256,944 256,944 273,969
Pension 344,043 357,874 396,883 457,000 457,000 491,715
Employment Taxes & Medical 916,319 748,834 834,059 907,208 907,208 933,144
Other Personnel 7,246 10,377 11,700 5,313 5,313 10,952
Supplies 107,056 140,403 219,545 240,902 240,902 251,487
Services 2,217,867 1,911,811 1,933,435 2,474,958 2,474,958 2,581,372
Capital 122,704 - - - - -
Debt, Transfers & Other - - - - - -
Total 6,160,569 5,599,291 6,193,890 7,462,448 7,462,448 7,975,867
143
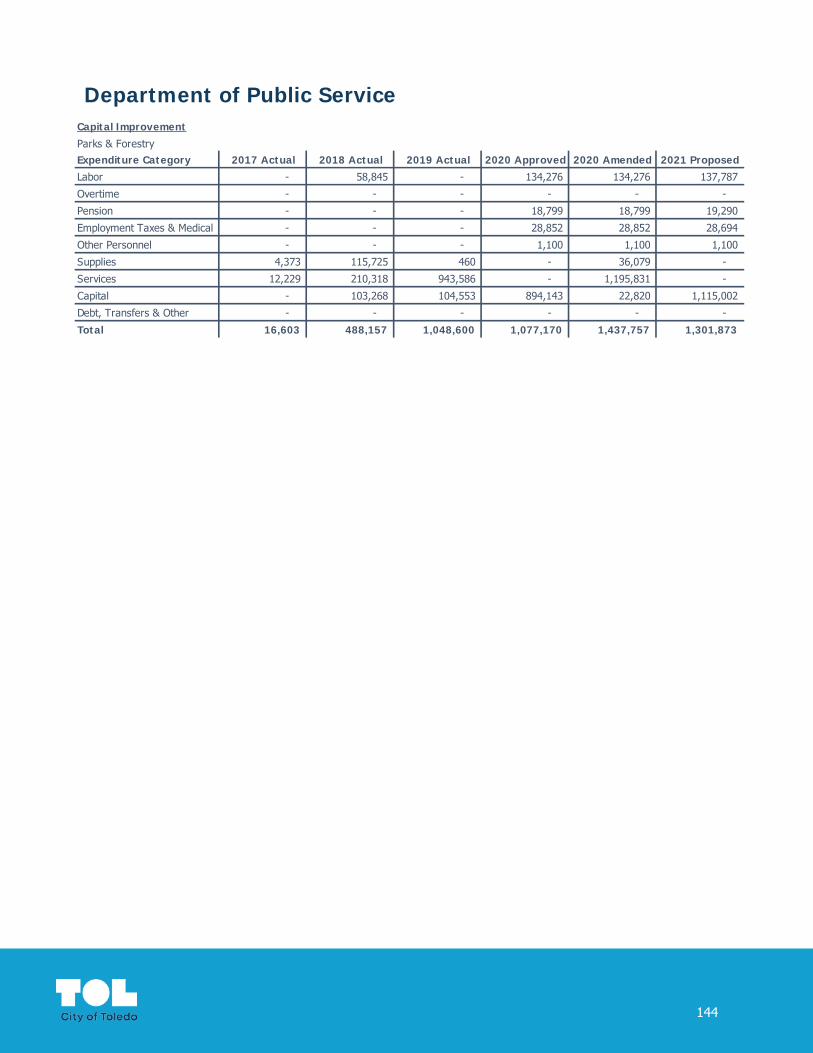
Department of Public ServiceCapital Improvement
Parks & ForestryExpenditure Category 2017 Actual 2018 Actual 2019 Actual 2020 Approved 2020 Amended 2021 Proposed
Labor - 58,845 - 134,276 134,276 137,787
Overtime - - - - - -
Pension - - - 18,799 18,799 19,290
Employment Taxes & Medical - - - 28,852 28,852 28,694
Other Personnel - - - 1,100 1,100 1,100
Supplies 4,373 115,725 460 - 36,079 -
Services 12,229 210,318 943,586 - 1,195,831 -
Capital - 103,268 104,553 894,143 22,820 1,115,002
Debt, Transfers & Other - - - - - -
Total 16,603 488,157 1,048,600 1,077,170 1,437,757 1,301,873
144

Department of Public ServiceGeneral Fund
RecreationExpenditure Category 2017 Actual 2018 Actual 2019 Actual 2020 Approved 2020 Amended 2021 Proposed
Labor 237,395 272,649 192,585 285,644 220,874 209,932
Overtime 20,792 19,019 4,248 27,000 27,000 27,000
Pension 35,139 38,964 27,248 43,770 33,582 33,171
Employment Taxes & Medical 95,626 73,912 74,116 76,657 95,972 56,813
Other Personnel 1,289 1,315 594 1,275 1,275 1,225
Supplies 29,702 39,099 46,219 49,787 17,287 49,238
Services 730,343 698,434 920,517 619,178 427,653 729,603
Capital - - - - - -
Debt, Transfers & Other (1) - 701,410 469,000 469,000 175,260
Total 1,150,284 1,143,392 1,966,937 1,572,312 1,292,643 1,282,241
Golf Improvements
RecreationExpenditure Category 2017 Actual 2018 Actual 2019 Actual 2020 Approved 2020 Amended 2021 Proposed
Labor - - - - - -
Overtime - - - - - -
Pension - - - - - -
Employment Taxes & Medical - - - - - -
Other Personnel - - - - - -
Supplies 50,893 47,288 163,692 619,247 619,247 455,750
Services - 10,000 1,237,190 1,373,769 1,373,769 1,229,510
Capital - - - - - -
Debt, Transfers & Other 300,000 - - - - -
Total 350,893 57,288 1,400,882 1,993,016 1,993,016 1,685,260
Marina Development
RecreationExpenditure Category 2017 Actual 2018 Actual 2019 Actual 2020 Approved 2020 Amended 2021 Proposed
Labor - - - - - -
Overtime - - - - - -
Pension - - - - - -
Employment Taxes & Medical - - - - - -
Other Personnel - - - - - -
Supplies - - - - - -
Services 10,831 15,622 15,867 9,097 9,097 19,220
Capital - - - - - -
Debt, Transfers & Other - - - - - -
Total 10,831 15,622 15,867 9,097 9,097 19,220
145

Department of Public ServiceCapital Improvement
RecreationExpenditure Category 2017 Actual 2018 Actual 2019 Actual 2020 Approved 2020 Amended 2021 Proposed
Labor - - - - - -
Overtime - - - - - -
Pension - - - - - -
Employment Taxes & Medical - - - - - -
Other Personnel - - - - - -
Supplies - 22,182 26,387 - 10,456 -
Services 395,869 846,871 237,546 - 967,751 -
Capital - - - 637,000 - 400,000
Debt, Transfers & Other - - - - - -
Total 395,869 869,054 263,933 637,000 978,206 400,000
146

Department of Public Utilities
As a customer-service organization, the Department of Public Utilities provides services which exceed expectations in regards to safe, economical and superior drinking water, drainage and waste water services, and an environmentally safe community.
The City owns and operates a waterworks system as a self-supporting enterprise that in 2019 produced an average of 73.4 million gallons of potable water per day, with a peak flow of 99.6 million gallons per day. Water is drawn from Lake Erie, treated at the City’s Collins Park Water Treatment Plant (the Plant), which has capacity to treat up to 130 million gallons of water per day, and then distributed through approximately 1,165 miles of water lines, over 50% of which were installed before 1930. The Water System is operated by the Division of Water Treatment and the Division of Water Distribution of the City’s Department of Public Utilities.
The City has maintained and used reserves to pay the costs of routine, ongoing maintenance, repairs, replacements of portions of the Water System. The City has spent an average of approximately $34.2 million annually for replacements, improvements and extensions for the Water System over the past 10 years.
The City owns and operates a sanitary sewage collection and treatment system (the Sewer System) as a self-supporting enterprise that in 2019 collected and treated approximately 73.4 million gallons of wastewater per day generated by residential, commercial, institutional and industrial users. Wastewater is collected by 1,027 miles of local and interceptor sanitary sewers owned by the City. The local sewers serving 77% of the City’s sewered area carry only sanitary sewage, while the remaining 23% of the City’s sewered area is served by combined sewers that carry sanitary sewage and, in wet weather, storm water. The local sewers flow into interceptor sewers that carry the wastewater to the City’s Bay View Wastewater Treatment Plant (the WWTP) for treatment.
The Department of Public Utilities includes the following divisions: Utilities Administration, Water Treatment, Water Distribution, Engineering Services, Water Reclamation, Sewer and Drainage Services and Environmental Services. The divisions are primarily supported by the Water and Sewer and Storm Water Funds, with very little General Fund support.
2021 Proposed Budget -Public Utilities
Expenditure Category & Source of Funds General Fund
Special Revenue Funds
Debt Service Funds
Capital Projects Funds
Enterprise Funds
Internal Service Funds Total
Labor 354,093 1,252,160 - 2,214,951 35,645,524 - 39,466,728 Overtime 14,990 47,500 - 158,717 2,692,590 - 2,913,797 Pension 38,990 181,179 - 312,110 5,063,339 - 5,595,618 Employment Taxes & Medical 62,461 262,691 - 329,145 9,155,037 - 9,809,333 Other Personnel 1,252 9,586 - 7,544 264,630 - 283,012 Supplies 14,655 12,625 - 216,330 20,718,111 - 20,961,721 Services 129,574 417,275 - 1,342,371 57,099,060 - 58,988,280 Capital - - - 28,045,101 6,107,280 - 34,152,381 Debt, Transfers & Other - - - - 75,794,399 - 75,794,399 Total 616,015 2,183,016 - 32,626,269 212,539,970 - 247,965,270
147

Department of Public UtilitiesWater, Sewer, and Storm Water Revenue
Fund Revenue Category 2017 Actual 2018 Actual 2019 Actual 2020 Approved 2020 Amended 2021 ProposedCharges for Services 80,065,090 81,270,178 80,145,882 87,005,139 87,005,139 89,262,500 Investment Earnings 2,602,163 3,976,195 4,695,289 1,785,000 1,785,000 408,000 Grants - - - - 120,487 - Other Revenue 380 52,528 11,627 - 120,000 - Issuance of Debt 1,511,425 800,000 46,795,188 - 165,774,044 - Premium (discount) on Bond 1,164,635 1,090,751 2,168,170 - - - Operating Transfers (net) 2,601,455 74,850 2,428,052 (147,910) (280,180) (145,481) Use of Fund Balance - - - - 81,395,782 -
Water Total 87,945,147 87,264,503 136,244,208 88,642,229 335,920,272 89,525,019
Fund Revenue Category 2017 Actual 2018 Actual 2019 Actual 2020 Approved 2020 Amended 2021 ProposedSpecial Assesments 7,913 2,954 2,375 2,400 2,400 - Licenses and Permits 83,810 81,130 57,625 76,500 76,500 68,500 Charges for Services 78,165,875 82,476,729 88,382,628 93,742,475 93,742,475 92,804,000 Investment Earnings 366,922 1,084,405 1,608,211 986,000 986,000 408,000 Grants 1,006,305 1,611,321 1,150,635 - 1,206,849 - Other Revenue 66,973 136,067 45,742 1,000 196,000 18,000 Issuance of Debt 25,639,782 44,917,384 24,992,353 - 86,876,074 - Premium (discount) on Bond 132,205 58,906 69,583 - - - Operating Transfers (net) 2,605,927 (30,200) 2,800,326 (75,000) 873,590 (75,000) Use of Fund Balance - - - - 498,713 -
Sewer Total 108,075,710 130,338,697 119,109,477 94,733,375 184,458,601 93,223,500
Fund Revenue Category 2017 Actual 2018 Actual 2019 Actual 2020 Approved 2020 Amended 2021 ProposedSpecial Assesments 3,014 2,346 2,346 2,800 2,800 - Charges for Services 10,098,833 9,986,946 10,255,255 9,652,490 9,652,490 9,803,000 Investment Earnings 138,423 455,137 810,658 510,000 510,000 204,000 Grants 172,396 76,875 556,967 - 290,000 - Other Revenue 12,835 12,886 8,361 13,000 17,884 13,000 Issuance of Debt 140,908 58,734 126,164 - - - Operating Transfers (net) 271,149 (75,000) 257,725 (75,000) (80,820) (75,000) Use of Fund Balance - - - - 4,825,701 1,243,316
Storm Water Total 10,837,558 10,517,923 12,017,477 10,103,290 15,218,055 11,188,316
*For presentation purposes, revenue from Operating Transfers In is reflected net of Operating Transfers Out
Water
Sewer
Storm Water
148
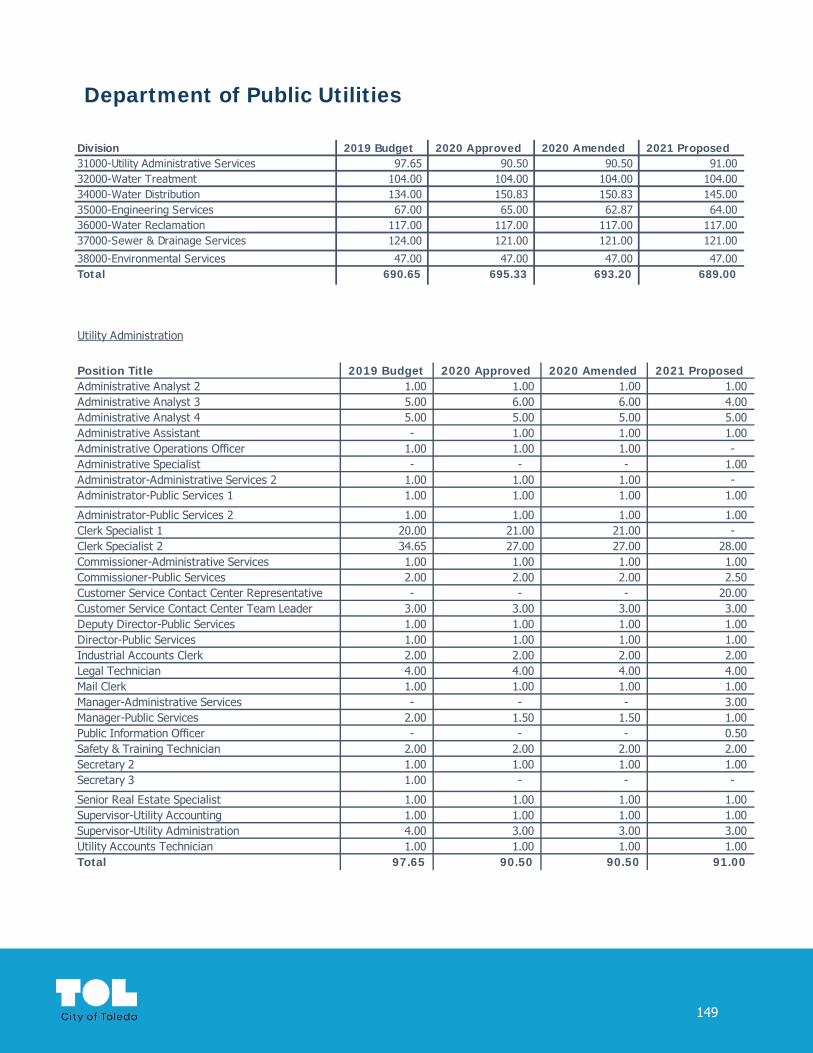
Department of Public Utilities
Division 2019 Budget 2020 Approved 2020 Amended 2021 Proposed31000-Utility Administrative Services 97.65 90.50 90.50 91.00 32000-Water Treatment 104.00 104.00 104.00 104.00 34000-Water Distribution 134.00 150.83 150.83 145.00 35000-Engineering Services 67.00 65.00 62.87 64.00 36000-Water Reclamation 117.00 117.00 117.00 117.00 37000-Sewer & Drainage Services 124.00 121.00 121.00 121.00
38000-Environmental Services 47.00 47.00 47.00 47.00 Total 690.65 695.33 693.20 689.00
Utility Administration
Position Title 2019 Budget 2020 Approved 2020 Amended 2021 ProposedAdministrative Analyst 2 1.00 1.00 1.00 1.00 Administrative Analyst 3 5.00 6.00 6.00 4.00 Administrative Analyst 4 5.00 5.00 5.00 5.00 Administrative Assistant - 1.00 1.00 1.00 Administrative Operations Officer 1.00 1.00 1.00 - Administrative Specialist - - - 1.00 Administrator-Administrative Services 2 1.00 1.00 1.00 - Administrator-Public Services 1 1.00 1.00 1.00 1.00
Administrator-Public Services 2 1.00 1.00 1.00 1.00 Clerk Specialist 1 20.00 21.00 21.00 - Clerk Specialist 2 34.65 27.00 27.00 28.00 Commissioner-Administrative Services 1.00 1.00 1.00 1.00 Commissioner-Public Services 2.00 2.00 2.00 2.50 Customer Service Contact Center Representative - - - 20.00 Customer Service Contact Center Team Leader 3.00 3.00 3.00 3.00 Deputy Director-Public Services 1.00 1.00 1.00 1.00 Director-Public Services 1.00 1.00 1.00 1.00 Industrial Accounts Clerk 2.00 2.00 2.00 2.00 Legal Technician 4.00 4.00 4.00 4.00 Mail Clerk 1.00 1.00 1.00 1.00 Manager-Administrative Services - - - 3.00 Manager-Public Services 2.00 1.50 1.50 1.00 Public Information Officer - - - 0.50 Safety & Training Technician 2.00 2.00 2.00 2.00 Secretary 2 1.00 1.00 1.00 1.00 Secretary 3 1.00 - - -
Senior Real Estate Specialist 1.00 1.00 1.00 1.00 Supervisor-Utility Accounting 1.00 1.00 1.00 1.00 Supervisor-Utility Administration 4.00 3.00 3.00 3.00 Utility Accounts Technician 1.00 1.00 1.00 1.00 Total 97.65 90.50 90.50 91.00
149
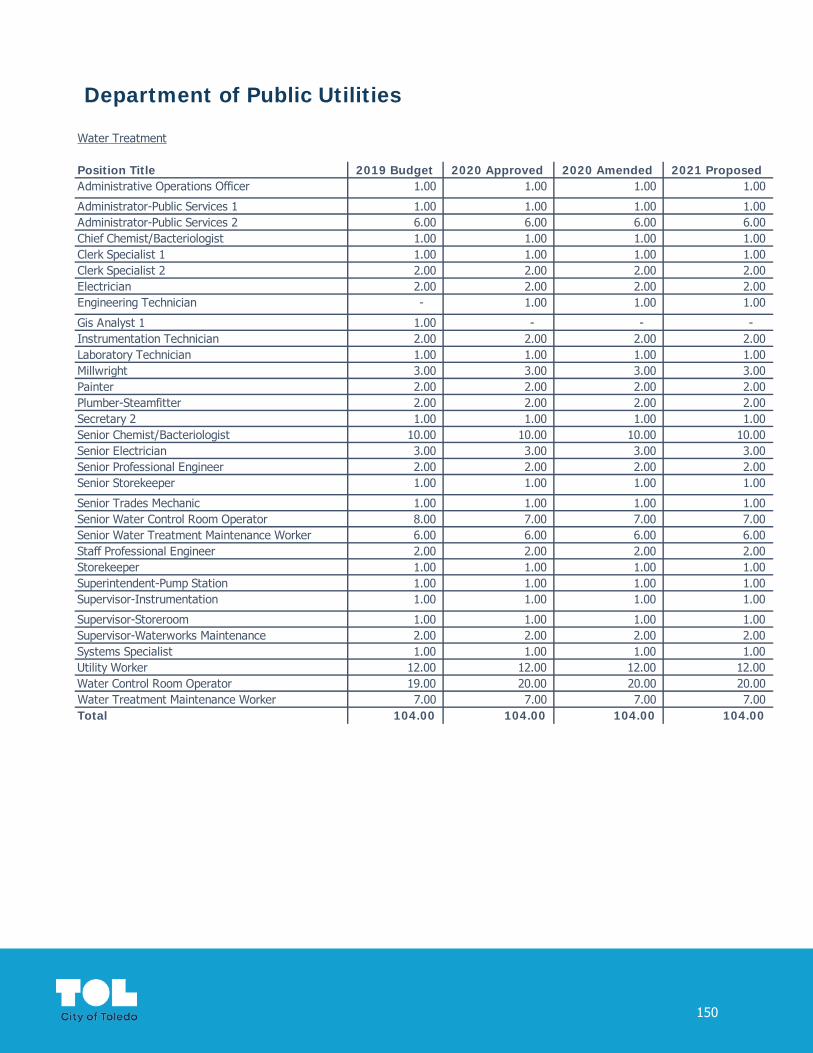
Department of Public Utilities
Water Treatment
Position Title 2019 Budget 2020 Approved 2020 Amended 2021 ProposedAdministrative Operations Officer 1.00 1.00 1.00 1.00
Administrator-Public Services 1 1.00 1.00 1.00 1.00 Administrator-Public Services 2 6.00 6.00 6.00 6.00 Chief Chemist/Bacteriologist 1.00 1.00 1.00 1.00 Clerk Specialist 1 1.00 1.00 1.00 1.00 Clerk Specialist 2 2.00 2.00 2.00 2.00 Electrician 2.00 2.00 2.00 2.00 Engineering Technician - 1.00 1.00 1.00
Gis Analyst 1 1.00 - - - Instrumentation Technician 2.00 2.00 2.00 2.00 Laboratory Technician 1.00 1.00 1.00 1.00 Millwright 3.00 3.00 3.00 3.00 Painter 2.00 2.00 2.00 2.00 Plumber-Steamfitter 2.00 2.00 2.00 2.00 Secretary 2 1.00 1.00 1.00 1.00 Senior Chemist/Bacteriologist 10.00 10.00 10.00 10.00 Senior Electrician 3.00 3.00 3.00 3.00 Senior Professional Engineer 2.00 2.00 2.00 2.00 Senior Storekeeper 1.00 1.00 1.00 1.00
Senior Trades Mechanic 1.00 1.00 1.00 1.00 Senior Water Control Room Operator 8.00 7.00 7.00 7.00 Senior Water Treatment Maintenance Worker 6.00 6.00 6.00 6.00 Staff Professional Engineer 2.00 2.00 2.00 2.00 Storekeeper 1.00 1.00 1.00 1.00 Superintendent-Pump Station 1.00 1.00 1.00 1.00 Supervisor-Instrumentation 1.00 1.00 1.00 1.00
Supervisor-Storeroom 1.00 1.00 1.00 1.00 Supervisor-Waterworks Maintenance 2.00 2.00 2.00 2.00 Systems Specialist 1.00 1.00 1.00 1.00 Utility Worker 12.00 12.00 12.00 12.00 Water Control Room Operator 19.00 20.00 20.00 20.00 Water Treatment Maintenance Worker 7.00 7.00 7.00 7.00 Total 104.00 104.00 104.00 104.00
150

Department of Public Utilities
Water Distribution
Position Title 2019 Budget 2020 Approved 2020 Amended 2021 ProposedAdministrative Specialist 1.00 1.00 1.00 1.00 Administrator-A.S. - - - 1.00 Administrator-Administrative Services 2 1.00 1.00 1.00 - Administrator-Public Services 2 1.00 1.00 1.00 1.00 Clerk Specialist 1 1.00 1.00 1.00 1.00 Clerk Specialist 2 9.00 11.00 11.00 10.00 Construction Technician 1.00 1.00 1.00 1.00 Engineering Technician 1.00 1.00 1.00 1.00 Equipment Repair Technician 1.00 1.00 1.00 1.00 Foreman-Field Services - 1.00 1.00 1.00 Foreman-Tapping And Construction - 5.00 5.00 5.00 Foreman-Water Distribution System 5.00 - - - General Foreman-Tapping And Construction - 3.00 3.00 3.00 General Foreman-Water Distribution System 3.00 - - - Heavy Equipment Operator 2 9.00 10.00 10.00 10.00 Manager-Public Services 1.00 1.00 1.00 1.00 Meter Reader 11.00 11.00 11.00 11.00 Professional Engineer 1.00 0.83 0.83 1.00 Secretary 2 1.00 1.00 1.00 1.00 Senior Professional Engineer 1.00 1.00 1.00 1.00 Senior Storekeeper 1.00 1.00 1.00 1.00 Supervisor-Collections - 1.00 1.00 1.00 Supervisor-Field Services - 1.00 1.00 1.00 Supervisor-Meter Reading And Inspection 1.00 - - - Supervisor-Utility Administration 1.00 - - - Supervisor-Utility Field Services 1.00 - - - Utility Service Locator 1.00 7.00 7.00 4.00 Water Emergency Repair Worker 5.00 5.00 5.00 5.00 Water Loss Equipment Technician 14.00 16.00 16.00 17.00 Water Service Technician 22.00 22.00 22.00 21.00 Watermain And Service Repair Worker 40.00 46.00 46.00 44.00 Total 134.00 150.83 150.83 145.00
151

Department of Public Utilities
Engineering ServicesPosition Title 2019 Budget 2020 Approved 2020 Amended 2021 ProposedAdministrative Specialist 1.00 1.00 1.00 1.00 Administrator-Administrative Services 1 1.00 1.00 1.00 1.00 Administrator-Public Services 2 4.00 4.00 4.00 4.00 Clerk Specialist 2 2.00 2.00 1.87 2.00 Construction Technician 12.00 12.00 10.00 11.00 Engineering Associate 6.00 6.00 6.00 6.00 Engineering Technician 4.00 4.00 4.00 4.00 Gis Analyst 1 3.00 3.00 3.00 3.00 Professional Engineer 3.00 3.00 3.00 3.00 Public Services Officer 3 1.00 - - - Secretary 2 1.00 1.00 1.00 1.00 Senior Construction Technician 5.00 5.00 5.00 5.00 Senior Drafter 4.00 4.00 4.00 4.00 Senior Engineering Aide 2.00 2.00 2.00 2.00 Senior Park Planner 1.00 - - - Senior Professional Engineer 6.00 6.00 6.00 6.00 Staff Professional Engineer 7.00 7.00 7.00 7.00 Supervisor-Surveyor 1.00 1.00 1.00 1.00 Supervisor-Utilities 1.00 1.00 1.00 1.00 Surveyor 1.00 1.00 1.00 1.00 Surveyor Associate 1.00 1.00 1.00 1.00 Total 67.00 65.00 62.87 64.00
152

Department of Public Utilities
Water Reclamation
Position Title 2019 Budget 2020 Approved 2020 Amended 2021 ProposedAdministrative Operations Officer 1.00 1.00 1.00 1.00 Administrator-Public Services 2 3.00 3.00 3.00 3.00 Automotive Repair Technician 1.00 1.00 1.00 1.00 Chemist-Bacteriologist 3.00 3.00 3.00 3.00 Data Communications Specialist 3.00 3.00 3.00 3.00 Electrician 3.00 3.00 3.00 3.00 Intermediate Clerk 1.00 1.00 1.00 1.00 Process Control Analyst 1.00 1.00 1.00 1.00 Professional Engineer 2.00 2.00 2.00 2.00 Safety And Training Specialist 1.00 1.00 1.00 1.00 Secretary 2 1.00 1.00 1.00 1.00 Senior Chemist/Bacteriologist 1.00 1.00 1.00 1.00 Senior Clerk 1.00 1.00 1.00 1.00 Senior Electrician 3.00 3.00 3.00 3.00 Senior Process Control Analyst 1.00 1.00 1.00 1.00 Senior Professional Engineer 1.00 1.00 1.00 1.00 Senior Storekeeper 1.00 1.00 1.00 1.00 Senior Supervisor-Water Reclamation Maintenance 3.00 3.00 3.00 3.00 Senior Water Reclamation Maintenance Worker 14.00 14.00 14.00 14.00 Staff Professional Engineer 2.00 2.00 2.00 2.00 Storekeeper 1.00 1.00 1.00 1.00 Superintendent-Water Treatment Plant 1.00 1.00 1.00 1.00 Supervisor-Instrumentation 1.00 1.00 1.00 1.00 Supervisor-Water Reclamation Operations 5.00 5.00 5.00 5.00 Supervisor-Water Reclamation Storeroom 1.00 1.00 1.00 1.00 Systems Specialist 1.00 1.00 1.00 1.00 Tandem Truck Driver 1.00 1.00 1.00 1.00 Trades Mechanic 1.00 1.00 1.00 1.00 Utility Worker 8.00 8.00 8.00 8.00 Water Reclamation Crane Opertor 1.00 1.00 1.00 1.00 Water Reclamation Maintenance Worker 14.00 14.00 14.00 14.00 Water Reclamation Operator 35.00 35.00 35.00 35.00 Total 117.00 117.00 117.00 117.00
153

Department of Public UtilitiesSewer & Drainage ServicesPosition Title 2019 Budget 2020 Approved 2020 Amended 2021 ProposedAdministrative Operations Officer 1.00 1.00 1.00 1.00 Administrator-Public Services 2 1.00 1.00 1.00 1.00 Building And Grounds Maintenance Worker 1.00 2.00 2.00 2.00 Clerk Specialist 1 4.00 4.00 4.00 4.00 Clerk Specialist 2 1.00 1.00 1.00 1.00 Construction Inspector 3.00 3.00 3.00 3.00 Crane Operator - - - 1.00 Engineering Technician 1.00 1.00 1.00 1.00 Foreman-Sewer Construction And Maintenance 8.00 8.00 8.00 8.00 General Foreman-Sewer Maintenance 2.00 2.00 2.00 2.00 Gis Analyst 1 1.00 - - - Gis Technician - 1.00 1.00 1.00 Heavy Equipment Operator 2 20.00 20.00 20.00 19.00 Manager-Public Services 1.00 1.00 1.00 1.00 Public Services Officer 3 1.00 1.00 1.00 1.00 Secretary 2 1.00 1.00 1.00 1.00 Senior Professional Engineer 1.00 1.00 1.00 1.00 Senior Sewer & Drainage Service Worker 14.00 14.00 14.00 14.00 Senior Storekeeper 1.00 1.00 1.00 1.00 Sewer & Drainage Service Worker 51.00 48.00 48.00 48.00 Storekeeper 1.00 1.00 1.00 1.00 Supervisor-Utilities 1.00 1.00 1.00 1.00 Telespection Technician 2.00 2.00 2.00 2.00 Utility Service Locator 1.00 - - - Utility Worker 6.00 6.00 6.00 6.00 Total 124.00 121.00 121.00 121.00
Environmental ServicesPosition Title 2019 Budget 2020 Approved 2020 Amended 2021 ProposedAdministrative Analyst 2 1.00 1.00 1.00 1.00 Administrative Specialist 1.00 1.00 1.00 1.00 Administrator-Public Services 2 2.00 2.00 2.00 2.00 Chemist-Bacteriologist 1.00 1.00 1.00 1.00 Clerk Specialist 1 1.00 1.00 1.00 1.00 Clerk Specialist 2 1.00 1.00 1.00 1.00 Engineering Associate 5.00 4.00 4.00 4.00 Environmental Services Technician 6.00 6.00 6.00 6.00 Environmental Specialist 7.00 7.00 7.00 7.00 Industrial Waste Control Specialist 2.00 2.00 2.00 2.00 Public Services Officer 3 4.00 4.00 4.00 4.00 Secretary 2 1.00 1.00 1.00 1.00 Senior Chemist/Bacteriologist 3.00 3.00 3.00 3.00 Senior Environmental Specialist 9.00 10.00 10.00 10.00 Staff Professional Engineer 2.00 2.00 2.00 2.00 Supervisor-Utility Accounting 1.00 1.00 1.00 1.00 Total 47.00 47.00 47.00 47.00
154

Department of Public Utilities
Utilities AdministrationThe Division of Utilities Administration provides comprehensive billing, collections and customer service in an efficient, cost-effective, and responsive manner to residents, businesses, and governmental jurisdictions within the greater Toledo metropolitan areas. Utilities Administration provides the primary administrative fiscal and operational control functions for the department. It consists of the sections of Accounting, Billing, Customer Service, Legal, DPU/SAP Support, Records, Engage Toledo, Administrative Support, Toledo Public Power (TPP) and the Toledo Waterways Initiative (TWI).
Funding SourcesThe Division of Public Utilities Administration is supported primarily by the Utility Administrative Services Fund. This fund receives revenues from the water, sewer and storm water utilities.
2021 HighlightsThe 2021 budget supports 91.00 FTEs with a total labor cost of $7,693,552. Non-labor operating budget for supplies and services totals $18,659,821 and supports administrative functions including the billing system and postage and mailing expenditures. The division has implemented a cost-effective on-line billing function to allow customers to view their bills and make payments electronically in “real time.”
Capital Improvement
Expenditure Category 2017 Actual 2018 Actual 2019 Actual 2020 Approved 2020 Amended 2021 Proposed
Labor - - - - - 11,755
Overtime - - - - - -
Pension - - - - - 1,646
Employment Taxes & Medical - - - - - 2,304
Other Personnel - - - - - -
Supplies - - - - - -
Services - - - - - -
Capital - - - - - -
Debt, Transfers & Other - - - - - -
Total - - - - - 15,705
155
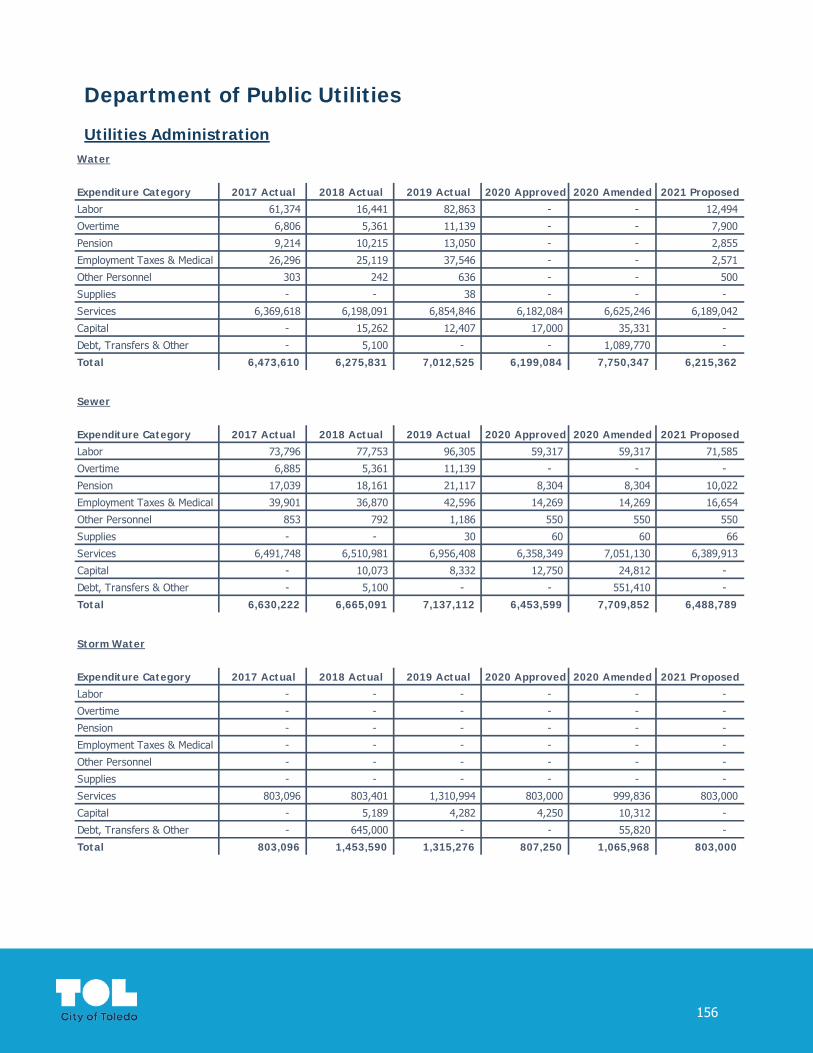
Department of Public Utilities
Utilities AdministrationWater
Expenditure Category 2017 Actual 2018 Actual 2019 Actual 2020 Approved 2020 Amended 2021 Proposed
Labor 61,374 16,441 82,863 - - 12,494
Overtime 6,806 5,361 11,139 - - 7,900
Pension 9,214 10,215 13,050 - - 2,855
Employment Taxes & Medical 26,296 25,119 37,546 - - 2,571
Other Personnel 303 242 636 - - 500
Supplies - - 38 - - -
Services 6,369,618 6,198,091 6,854,846 6,182,084 6,625,246 6,189,042
Capital - 15,262 12,407 17,000 35,331 -
Debt, Transfers & Other - 5,100 - - 1,089,770 -
Total 6,473,610 6,275,831 7,012,525 6,199,084 7,750,347 6,215,362
Sewer
Expenditure Category 2017 Actual 2018 Actual 2019 Actual 2020 Approved 2020 Amended 2021 Proposed
Labor 73,796 77,753 96,305 59,317 59,317 71,585
Overtime 6,885 5,361 11,139 - - -
Pension 17,039 18,161 21,117 8,304 8,304 10,022
Employment Taxes & Medical 39,901 36,870 42,596 14,269 14,269 16,654
Other Personnel 853 792 1,186 550 550 550
Supplies - - 30 60 60 66
Services 6,491,748 6,510,981 6,956,408 6,358,349 7,051,130 6,389,913
Capital - 10,073 8,332 12,750 24,812 -
Debt, Transfers & Other - 5,100 - - 551,410 -
Total 6,630,222 6,665,091 7,137,112 6,453,599 7,709,852 6,488,789
Storm Water
Expenditure Category 2017 Actual 2018 Actual 2019 Actual 2020 Approved 2020 Amended 2021 Proposed
Labor - - - - - -
Overtime - - - - - -
Pension - - - - - -
Employment Taxes & Medical - - - - - -
Other Personnel - - - - - -
Supplies - - - - - -
Services 803,096 803,401 1,310,994 803,000 999,836 803,000
Capital - 5,189 4,282 4,250 10,312 -
Debt, Transfers & Other - 645,000 - - 55,820 -
Total 803,096 1,453,590 1,315,276 807,250 1,065,968 803,000
156
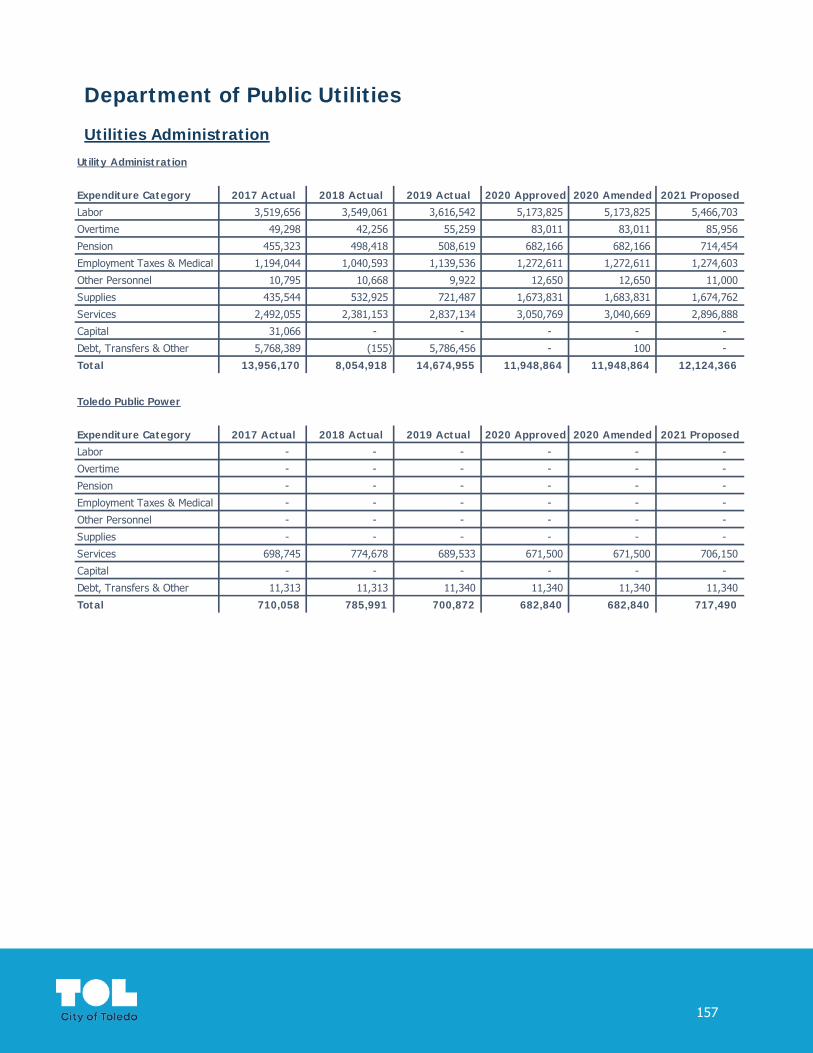
Department of Public Utilities
Utilities Administration
Utility Administration
Expenditure Category 2017 Actual 2018 Actual 2019 Actual 2020 Approved 2020 Amended 2021 Proposed
Labor 3,519,656 3,549,061 3,616,542 5,173,825 5,173,825 5,466,703
Overtime 49,298 42,256 55,259 83,011 83,011 85,956
Pension 455,323 498,418 508,619 682,166 682,166 714,454
Employment Taxes & Medical 1,194,044 1,040,593 1,139,536 1,272,611 1,272,611 1,274,603
Other Personnel 10,795 10,668 9,922 12,650 12,650 11,000
Supplies 435,544 532,925 721,487 1,673,831 1,683,831 1,674,762
Services 2,492,055 2,381,153 2,837,134 3,050,769 3,040,669 2,896,888
Capital 31,066 - - - - -
Debt, Transfers & Other 5,768,389 (155) 5,786,456 - 100 -
Total 13,956,170 8,054,918 14,674,955 11,948,864 11,948,864 12,124,366
Toledo Public Power
Expenditure Category 2017 Actual 2018 Actual 2019 Actual 2020 Approved 2020 Amended 2021 Proposed
Labor - - - - - -
Overtime - - - - - -
Pension - - - - - -
Employment Taxes & Medical - - - - - -
Other Personnel - - - - - -
Supplies - - - - - -
Services 698,745 774,678 689,533 671,500 671,500 706,150
Capital - - - - - -
Debt, Transfers & Other 11,313 11,313 11,340 11,340 11,340 11,340
Total 710,058 785,991 700,872 682,840 682,840 717,490
157
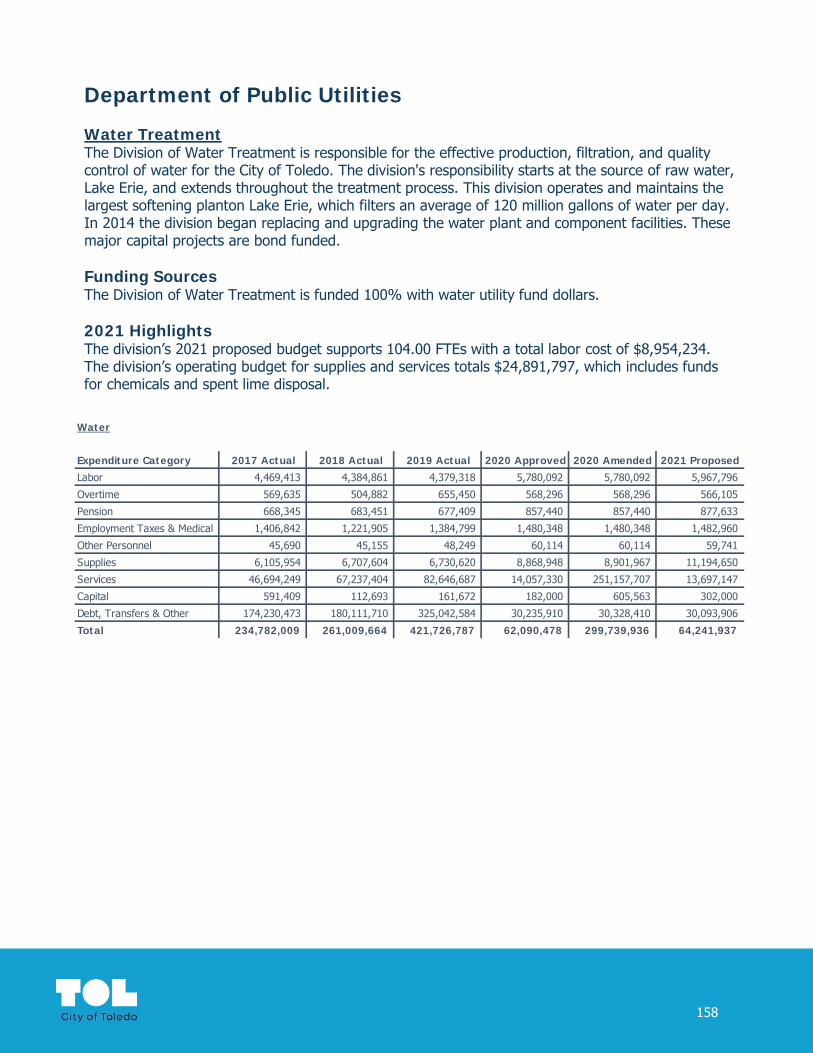
Department of Public Utilities
Water TreatmentThe Division of Water Treatment is responsible for the effective production, filtration, and quality control of water for the City of Toledo. The division's responsibility starts at the source of raw water, Lake Erie, and extends throughout the treatment process. This division operates and maintains the largest softening planton Lake Erie, which filters an average of 120 million gallons of water per day. In 2014 the division began replacing and upgrading the water plant and component facilities. These major capital projects are bond funded.
Funding SourcesThe Division of Water Treatment is funded 100% with water utility fund dollars.
2021 HighlightsThe division’s 2021 proposed budget supports 104.00 FTEs with a total labor cost of $8,954,234. The division’s operating budget for supplies and services totals $24,891,797, which includes funds for chemicals and spent lime disposal.
Water
Expenditure Category 2017 Actual 2018 Actual 2019 Actual 2020 Approved 2020 Amended 2021 Proposed
Labor 4,469,413 4,384,861 4,379,318 5,780,092 5,780,092 5,967,796
Overtime 569,635 504,882 655,450 568,296 568,296 566,105
Pension 668,345 683,451 677,409 857,440 857,440 877,633
Employment Taxes & Medical 1,406,842 1,221,905 1,384,799 1,480,348 1,480,348 1,482,960
Other Personnel 45,690 45,155 48,249 60,114 60,114 59,741
Supplies 6,105,954 6,707,604 6,730,620 8,868,948 8,901,967 11,194,650
Services 46,694,249 67,237,404 82,646,687 14,057,330 251,157,707 13,697,147
Capital 591,409 112,693 161,672 182,000 605,563 302,000
Debt, Transfers & Other 174,230,473 180,111,710 325,042,584 30,235,910 30,328,410 30,093,906
Total 234,782,009 261,009,664 421,726,787 62,090,478 299,739,936 64,241,937
158
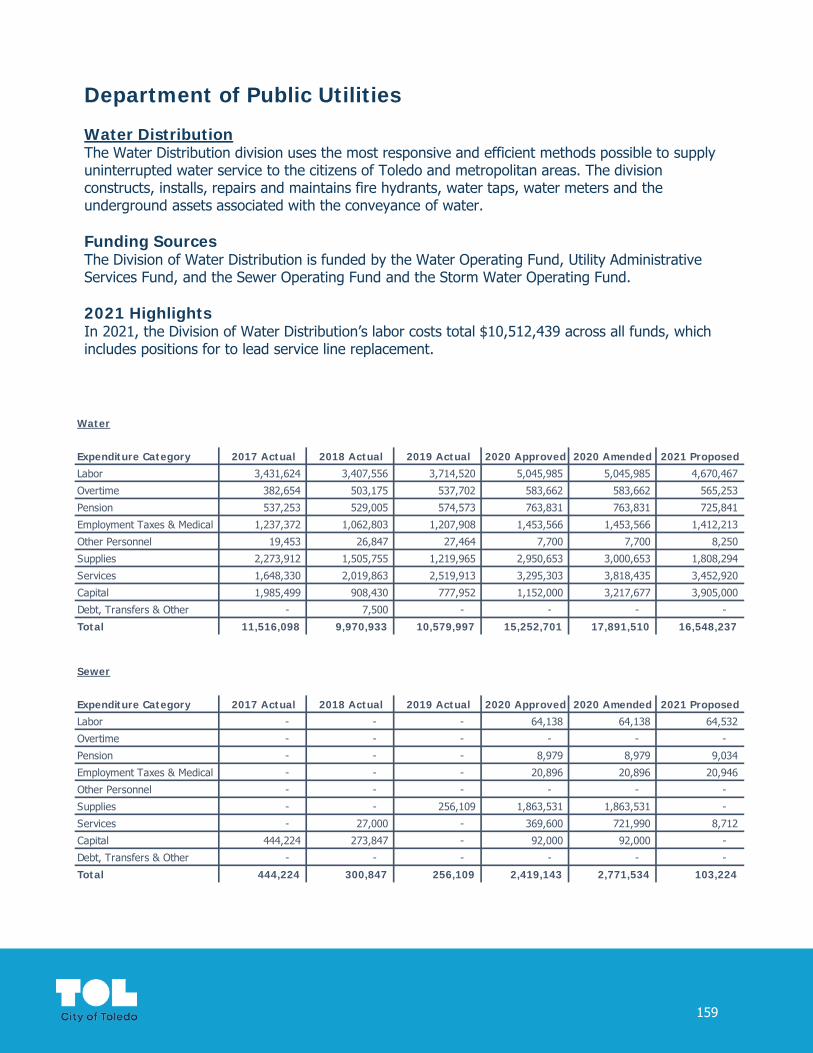
Department of Public Utilities
Water DistributionThe Water Distribution division uses the most responsive and efficient methods possible to supply uninterrupted water service to the citizens of Toledo and metropolitan areas. The division constructs, installs, repairs and maintains fire hydrants, water taps, water meters and the underground assets associated with the conveyance of water.
Funding SourcesThe Division of Water Distribution is funded by the Water Operating Fund, Utility Administrative Services Fund, and the Sewer Operating Fund and the Storm Water Operating Fund.
2021 HighlightsIn 2021, the Division of Water Distribution’s labor costs total $10,512,439 across all funds, which includes positions for to lead service line replacement.
Water
Expenditure Category 2017 Actual 2018 Actual 2019 Actual 2020 Approved 2020 Amended 2021 Proposed
Labor 3,431,624 3,407,556 3,714,520 5,045,985 5,045,985 4,670,467
Overtime 382,654 503,175 537,702 583,662 583,662 565,253
Pension 537,253 529,005 574,573 763,831 763,831 725,841
Employment Taxes & Medical 1,237,372 1,062,803 1,207,908 1,453,566 1,453,566 1,412,213
Other Personnel 19,453 26,847 27,464 7,700 7,700 8,250
Supplies 2,273,912 1,505,755 1,219,965 2,950,653 3,000,653 1,808,294
Services 1,648,330 2,019,863 2,519,913 3,295,303 3,818,435 3,452,920
Capital 1,985,499 908,430 777,952 1,152,000 3,217,677 3,905,000
Debt, Transfers & Other - 7,500 - - - -
Total 11,516,098 9,970,933 10,579,997 15,252,701 17,891,510 16,548,237
Sewer
Expenditure Category 2017 Actual 2018 Actual 2019 Actual 2020 Approved 2020 Amended 2021 Proposed
Labor - - - 64,138 64,138 64,532
Overtime - - - - - -
Pension - - - 8,979 8,979 9,034
Employment Taxes & Medical - - - 20,896 20,896 20,946
Other Personnel - - - - - -
Supplies - - 256,109 1,863,531 1,863,531 -
Services - 27,000 - 369,600 721,990 8,712
Capital 444,224 273,847 - 92,000 92,000 -
Debt, Transfers & Other - - - - - -
Total 444,224 300,847 256,109 2,419,143 2,771,534 103,224
159
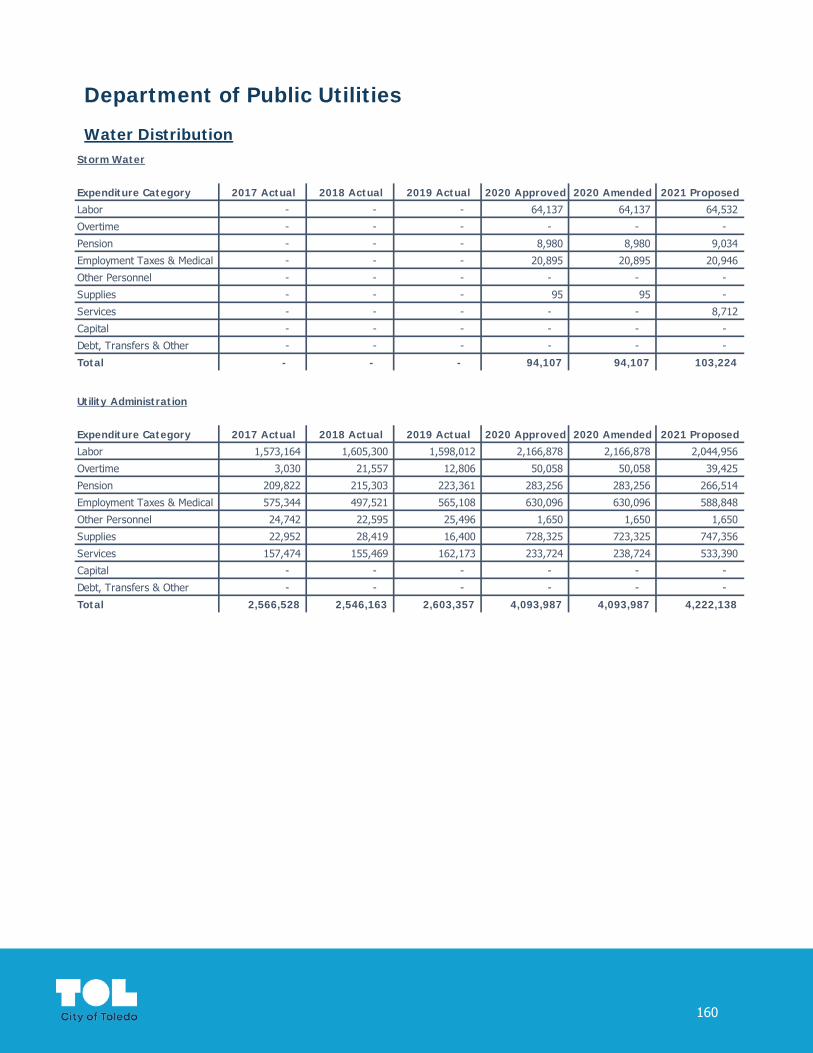
Department of Public Utilities
Water DistributionStorm Water
Expenditure Category 2017 Actual 2018 Actual 2019 Actual 2020 Approved 2020 Amended 2021 Proposed
Labor - - - 64,137 64,137 64,532
Overtime - - - - - -
Pension - - - 8,980 8,980 9,034
Employment Taxes & Medical - - - 20,895 20,895 20,946
Other Personnel - - - - - -
Supplies - - - 95 95 -
Services - - - - - 8,712
Capital - - - - - -
Debt, Transfers & Other - - - - - -
Total - - - 94,107 94,107 103,224
Utility Administration
Expenditure Category 2017 Actual 2018 Actual 2019 Actual 2020 Approved 2020 Amended 2021 Proposed
Labor 1,573,164 1,605,300 1,598,012 2,166,878 2,166,878 2,044,956
Overtime 3,030 21,557 12,806 50,058 50,058 39,425
Pension 209,822 215,303 223,361 283,256 283,256 266,514
Employment Taxes & Medical 575,344 497,521 565,108 630,096 630,096 588,848
Other Personnel 24,742 22,595 25,496 1,650 1,650 1,650
Supplies 22,952 28,419 16,400 728,325 723,325 747,356
Services 157,474 155,469 162,173 233,724 238,724 533,390
Capital - - - - - -
Debt, Transfers & Other - - - - - -
Total 2,566,528 2,546,163 2,603,357 4,093,987 4,093,987 4,222,138
160

Department of Public Utilities
Engineering ServicesEngineering Services provides planning, engineering and construction administration for major infrastructure improvements and assists in supporting other operating divisions with their engineering needs. The division is responsible for coordinating the replacement and upgrade of the city’s utility distribution and transportation systems. This includes water lines, sanitary sewers and storm water facilities, public sidewalks, pedestrian ramps, streets and alleys. In addition, Engineering Services is responsible for street lighting, plan reviews and inspection of construction within the public rights of way.
Funding SourcesThe Division of Engineering Services receives support from several funds. This includes SCM&R, capital improvement, sewer operating, water operating and general fund dollars.
2021 HighlightsThe budget for Engineering Service funds supports 64.00 FTEs with a total labor cost of $7,140,871. Non personnel expenditures for supplies and services total $3,916,224. In 2021, the proposed budget includes $28,177,781 for capital expenditures including major and residential road paving.
General Fund
Expenditure Category 2017 Actual 2018 Actual 2019 Actual 2020 Approved 2020 Amended 2021 Proposed
Labor 68,352 71,050 161,112 232,564 123,718 180,159
Overtime 421 2,186 4,600 2,725 2,725 4,500
Pension 7,692 10,265 22,999 32,526 17,702 25,498
Employment Taxes & Medical 14,332 20,869 51,950 62,116 32,092 46,439
Other Personnel 248 271 578 694 694 702
Supplies - - - 9,455 9,623 9,455
Services 30,346 29,014 51,968 114,521 104,373 117,074
Capital - - - - - -
Debt, Transfers & Other - - - - - -
Total 121,390 133,655 293,206 454,601 290,927 383,827
Street Construction, Maintenance & Repair
Expenditure Category 2017 Actual 2018 Actual 2019 Actual 2020 Approved 2020 Amended 2021 Proposed
Labor 431,937 409,790 425,276 654,700 654,700 598,953
Overtime 37,031 55,690 42,080 46,600 46,600 45,000
Pension 64,579 64,183 64,130 87,486 87,486 89,490
Employment Taxes & Medical 94,032 83,175 99,012 117,437 117,437 117,379
Other Personnel 3,178 3,227 3,796 4,361 4,361 4,372
Supplies - - - 12,625 12,935 12,625
Services 311,083 221,837 213,783 287,281 1,886,971 397,275
Capital - - - - - -
Debt, Transfers & Other - - - - - -
Total 941,841 837,902 848,077 1,210,490 2,810,490 1,265,095
161

Department of Public Utilities
Engineering ServicesSpecial Assessment
Expenditure Category 2017 Actual 2018 Actual 2019 Actual 2020 Approved 2020 Amended 2021 Proposed
Labor 53,884 56,779 57,624 65,716 65,716 68,981
Overtime 4 424 1,077 585 585 2,500
Pension 7,466 7,979 8,191 9,178 9,178 9,897
Employment Taxes & Medical 13,667 11,909 13,462 15,676 15,676 16,046
Other Personnel 550 550 550 586 586 594
Supplies - - - - - -
Services 31,941 28,214 23,650 10,000 10,000 20,000
Capital - - - - - -
Debt, Transfers & Other - - - - - -
Total 107,511 105,855 104,553 101,741 101,741 118,018
Special Assessment Improvement
Expenditure Category 2017 Actual 2018 Actual 2019 Actual 2020 Approved 2020 Amended 2021 Proposed
Labor 57,524 73,895 76,094 89,094 89,094 -
Overtime 546 - 472 - - -
Pension 14,293 10,382 11,024 12,318 12,318 -
Employment Taxes & Medical 21,982 17,233 20,076 23,341 23,341 -
Other Personnel 581 275 286 331 331 -
Supplies - - - - - -
Services 249,529 358,845 468,147 500,000 1,906,309 750,000
Capital - - - - - -
Debt, Transfers & Other - - - - - -
Total 344,456 460,629 576,099 625,084 2,031,392 750,000
Capital Improvement
Expenditure Category 2017 Actual 2018 Actual 2019 Actual 2020 Approved 2020 Amended 2021 ProposedLabor 928,416 965,580 940,092 2,147,053 2,139,847 2,203,196 Overtime 89,410 151,164 146,520 126,924 126,924 158,717 Pension 140,067 152,915 147,452 291,793 291,793 310,464 Employment Taxes & Medical 264,900 241,066 265,498 309,375 309,375 326,840 Other Personnel 4,718 5,695 6,607 6,771 6,771 7,544 Supplies - - - 36,210 37,022 216,330 Services 21,175,891 31,933,490 29,581,713 751,101 76,327,047 592,371 Capital - - 1,224,866 12,025,000 55,050 9,370,590 Debt, Transfers & Other - - - - - - Total 22,603,403 33,449,910 32,312,747 15,694,227 79,293,828 13,186,052
162

Department of Public Utilities
Engineering ServicesWater
Expenditure Category 2017 Actual 2018 Actual 2019 Actual 2020 Approved 2020 Amended 2021 Proposed
Labor 395,292 446,046 473,774 623,149 623,149 638,877
Overtime 24,515 35,607 26,372 32,000 32,000 25,351
Pension 58,058 61,088 68,412 90,808 90,808 91,625
Employment Taxes & Medical 92,180 87,430 118,284 139,305 139,305 138,646
Other Personnel 2,059 2,123 2,911 3,209 3,209 3,333
Supplies - - - 95,725 96,084 135,785
Services 5,725,687 9,385,265 8,588,028 336,242 11,098,372 353,425
Capital - - 60,193 - 46,851 57,100
Debt, Transfers & Other - - - - - -
Total 6,297,791 10,017,560 9,337,974 1,320,437 12,129,777 1,444,142
Sewer
Expenditure Category 2017 Actual 2018 Actual 2019 Actual 2020 Approved 2020 Amended 2021 Proposed
Labor 959,940 1,045,513 1,111,606 514,019 514,019 997,415
Overtime 54,916 63,650 77,423 46,028 46,028 76,537
Pension 128,181 150,443 163,400 135,377 135,377 143,992
Employment Taxes & Medical 229,294 246,509 258,332 202,728 202,728 201,761
Other Personnel 5,530 6,940 7,503 6,094 6,094 5,970
Supplies 98,260 108,820 119,284 158,580 159,106 157,560
Services 5,148,780 8,684,020 1,946,820 687,137 23,356,529 529,708
Capital - - 20,284 - 22,065 34,900
Debt, Transfers & Other 266,554 81,851 147,879 100,000 985,891 100,000
Total 6,891,455 10,387,747 3,852,531 1,849,962 25,427,837 2,247,843
Storm Water
Expenditure Category 2017 Actual 2018 Actual 2019 Actual 2020 Approved 2020 Amended 2021 Proposed
Labor 271,653 268,145 244,497 425,253 425,253 435,955
Overtime 4,639 4,098 10,438 3,185 3,185 13,000
Pension 38,050 37,821 42,578 59,421 59,421 62,356
Employment Taxes & Medical 67,054 61,037 72,610 86,151 86,151 86,028
Other Personnel 1,796 1,796 1,870 2,748 2,748 2,752
Supplies - - - 63,585 63,788 126,580
Services 1,168,782 2,263,062 2,730,102 206,700 3,981,849 498,036
Capital - - 2,205,868 - 26,022 40,680
Debt, Transfers & Other 237,361 53,269 615,115 200,000 200,000 400,000
Total 1,789,335 2,689,227 5,923,077 1,047,044 4,848,417 1,665,387
163

Department of Public Utilities
Engineering ServicesRoad Improvements
Expenditure Category 2017 Actual 2018 Actual 2019 Actual 2020 Approved 2020 Amended 2021 Proposed
Labor - - - - - -
Overtime - - - - - -
Pension - - - - - -
Employment Taxes & Medical - - - - - -
Other Personnel - - - - - -
Supplies - - - - - -
Services - - - - - -
Capital - - - - - 18,674,511
Debt, Transfers & Other - - - - - -
Total - - - - - 18,674,511
164

Department of Public Utilities
Water ReclamationThe Division of Water Reclamation works to protect and enhance public health, property and the environment through the efficient and progressive treatment of wastewater in compliance with the state of Ohio and national standards. The major function of Water Reclamation is the operation and maintenance of the Bay View Wastewater Treatment Plant. The facility provides treatment services to an area of approximately 100 square miles, of which 84 miles are located within the City of Toledo. The population of the service area is approximately 320,000 people.
Funding SourcesThe Division of Water Reclamation is funded largely with sewer operating dollars. A portion of funding comes from the Storm Water Fund.
2021 HighlightsThe 2021 budget for Water Reclamation supports 117.00 FTEs with a total labor cost of $9,498,560. Non- personnel expenditures for operating supplies and services totals $13,243,719 of total budget and includes bulk treatment chemicals, spent lime disposal and electricity costs for the plant.
Sewer
Expenditure Category 2017 Actual 2018 Actual 2019 Actual 2020 Approved 2020 Amended 2021 Proposed
Labor 4,948,122 5,100,298 4,981,261 6,218,054 6,540,213 6,218,054
Overtime 453,021 435,932 552,001 515,129 523,881 515,129
Pension 722,142 743,032 758,117 913,129 979,554 913,129
Employment Taxes & Medical 1,568,558 1,427,042 1,545,588 1,648,703 1,761,009 1,645,897
Other Personnel 122,743 106,112 110,410 127,818 127,818 127,818
Supplies 1,644,307 1,559,486 1,729,158 2,697,926 2,697,926 2,697,926
Services 41,547,274 39,840,244 33,339,730 10,467,090 64,446,756 10,538,994
Capital 96,201 100,468 4,390,161 234,750 632,587 -
Debt, Transfers & Other 304,696,332 361,305,605 723,512,259 41,090,010 51,009,661 43,475,248
Total 355,798,699 410,618,219 770,918,685 63,912,609 128,719,405 66,132,195
Storm Water
Expenditure Category 2017 Actual 2018 Actual 2019 Actual 2020 Approved 2020 Amended 2021 Proposed
Labor 45,863 134,716 21,832 50,360 50,360 50,360
Overtime 3,026 - 1,957 5,000 5,000 5,000
Pension 7,111 2,307 5,760 7,610 7,610 7,610
Employment Taxes & Medical 13,665 11,342 13,216 14,175 14,175 14,163
Other Personnel 1,800 1,000 400 1,400 1,400 1,400
Supplies - - - - - -
Services 6,668 2,386 5,323 6,799 6,799 6,799
Capital - - 61,702 97,250 274,181 -
Debt, Transfers & Other - - - - - -
Total 78,133 151,752 110,192 182,594 359,525 85,333
165

Department of Public Utilities
Sewer & Drainage ServicesThe Division of Sewer and Drainage Services operates and maintains the sanitary sewer, storm sewer and ditch drainage systems, providing innovative, cost effective, uninterrupted service to the citizens of the City of Toledo. There are five sections in the division: Cleaning, Construction, Ditch Maintenance, Engineering and Inspection, and Administration. Together these sections are responsible for maintaining sanitary sewer and storm sewer drainage systems. This involves routine cleaning and repair, maintaining the proper flow of the City’s 64 miles of open ditch drainage systems and providing direct support to field personal engaged in the cleaning and repair of storm and sanitary sewers and ditches.
Funding SourcesThe Division of Sewer & Drainage Services is supported by the Sewer Operating and Storm Water Operating Funds. Additionally, a small amount of water operating funding supports operations.
2021 HighlightsThe Division of Sewer and Drainage Services 2021 budget supports 121.00 FTEs. Labor expenditures total $10,007,417 in the proposed budget.
Water
Expenditure Category 2017 Actual 2018 Actual 2019 Actual 2020 Approved 2020 Amended 2021 Proposed
Labor - 82 21,817 24,682 24,682 35,375
Overtime - 11 1,752 1,635 1,635 3,040
Pension - - 3,201 3,684 3,684 3,749
Employment Taxes & Medical - 99 5,119 6,139 6,139 6,289
Other Personnel - - 66 96 96 96
Supplies - - - - - -
Services 61,630 290,340 82,688 190,399 190,399 190,779
Capital - - - - - -
Debt, Transfers & Other - - - - - -
Total 61,630 290,532 114,643 226,635 226,635 239,328
Sewer
Expenditure Category 2017 Actual 2018 Actual 2019 Actual 2020 Approved 2020 Amended 2021 Proposed
Labor 3,125,403 3,355,747 3,508,210 3,834,465 3,834,465 4,042,333
Overtime 453,352 475,032 503,254 375,104 375,104 481,613
Pension 445,451 421,793 499,516 546,980 546,981 566,127
Employment Taxes & Medical 998,997 866,385 875,846 1,030,367 1,030,367 1,030,041
Other Personnel 11,269 15,410 11,299 18,335 18,335 18,335
Supplies 581,324 500,703 695,475 1,310,060 1,336,490 1,469,674
Services 3,149,586 3,360,424 4,004,107 9,934,444 10,114,944 8,199,475
Capital 790,359 787,617 1,504,826 903,210 2,144,403 1,223,660
Debt, Transfers & Other - 7,500 - - - -
Total 9,555,741 9,790,611 11,602,534 17,952,966 19,401,089 17,031,258
166

Department of Public Utilities
Sewer & Drainage Services
Storm Water
Expenditure Category 2017 Actual 2018 Actual 2019 Actual 2020 Approved 2020 Amended 2021 Proposed
Labor 1,342,992 1,281,573 1,576,177 2,437,929 2,437,929 2,495,762
Overtime 114,174 86,207 108,056 257,974 257,974 276,375
Pension 237,467 288,775 273,645 344,832 344,832 352,343
Employment Taxes & Medical 616,617 543,453 476,532 678,405 678,405 684,584
Other Personnel 3,523 2,894 4,037 11,355 11,355 11,355
Supplies 413,787 208,693 193,788 365,435 365,435 471,758
Services 322,815 273,601 418,526 647,093 938,833 783,672
Capital 261,127 372,518 707,614 476,170 974,790 513,940
Debt, Transfers & Other 37,943,805 42,230,942 83,825,664 1,228,000 1,228,000 1,713,905
Total 41,256,308 45,288,656 87,584,038 6,447,192 7,237,553 7,303,693
167

Department of Public Utilities
Environmental ServicesThe Environmental Services’ goal is to ensure environmentally safe air and water for the Toledo metropolitan area. The division takes pride in serving as an environmental consultant for the City’s other departments and divisions. The division performs, coordinates and oversees environmental site assessments and environmental cleanup projects for city owned parcels and city redevelopment projects. The division promotes a better understanding and awareness of the challenges that exist in air and water pollution in Toledo through numerous community outreach programs such as Clean Your Streams Day and the Household Hazardous Materials Program.
Funding SourcesThe Division of Environmental Services receives support from general and utility operating fund dollars, as well as state grant awards. The division annually receives state water and air grants that support personnel and other services. The General Fund provides a local match for these dollars.
2021 HighlightsThe 2021 Environmental Services budget funds 47.00 FTEs across several funds. Labor expenditures account for $4,261,416 of the division’s total proposed budget.
General Fund
Expenditure Category 2017 Actual 2018 Actual 2019 Actual 2020 Approved 2020 Amended 2021 Proposed
Labor 113,361 112,427 110,135 166,483 164,677 173,934
Overtime 22 26 469 10,272 10,272 10,490
Pension 15,869 15,703 15,517 13,710 13,457 13,492
Employment Taxes & Medical 24,493 26,438 27,342 16,136 16,110 16,022
Other Personnel 606 688 688 550 550 550
Supplies - - - 6,500 5,651 5,200
Services 12,600 14,900 17,000 10,500 10,500 12,500
Capital - - - - - -
Debt, Transfers & Other - - - - - -
Total 166,951 170,182 171,152 224,151 221,217 232,188
Operation Grants
Expenditure Category 2017 Actual 2018 Actual 2019 Actual 2020 Approved 2020 Amended 2021 Proposed
Labor 523,680 529,425 536,521 608,483 993,377 584,226
Overtime 5,576 2,934 2,327 1,276 9,595 -
Pension 73,673 74,336 82,945 79,801 144,999 81,792
Employment Taxes & Medical 129,857 53,637 170,459 130,396 347,777 129,265
Other Personnel 5,022 4,373 4,923 4,620 10,639 4,620
Supplies 13,713 20,278 36,280 - 123,244 -
Services 766,962 474,682 964,911 - 2,431,181 -
Capital - - - - 235,301 -
Debt, Transfers & Other - - - - - -
Total 1,518,483 1,159,664 1,798,365 824,576 4,296,112 799,903
168

Department of Public Utilities
Environmental ServicesWater
Expenditure Category 2017 Actual 2018 Actual 2019 Actual 2020 Approved 2020 Amended 2021 Proposed
Labor 213,147 263,571 234,974 651,528 651,528 684,780
Overtime 181 636 2,594 5,804 5,804 9,349
Pension 32,843 34,471 34,858 84,261 84,261 86,532
Employment Taxes & Medical 57,489 58,699 63,973 150,924 150,924 151,069
Other Personnel 1,595 1,210 1,661 3,085 3,085 3,085
Supplies - 1,159 18,970 213,630 213,550 68,445
Services 174,274 203,133 41,940 145,453 145,533 154,242
Capital - - - - 17,615 -
Debt, Transfers & Other - - - - - -
Total 479,528 562,880 398,970 1,254,685 1,272,300 1,157,502
Sewer
Expenditure Category 2017 Actual 2018 Actual 2019 Actual 2020 Approved 2020 Amended 2021 Proposed
Labor 849,356 956,894 800,441 804,563 804,563 826,476
Overtime 6,402 11,805 17,341 28,515 28,515 12,246
Pension 122,900 121,547 109,007 109,427 109,427 109,077
Employment Taxes & Medical 228,478 198,028 211,314 188,136 188,136 187,869
Other Personnel 6,385 5,698 6,144 4,410 4,410 4,410
Supplies 66,118 66,802 50,918 72,550 72,970 67,950
Services (98,644) (41,545) 461,607 588,583 588,163 617,085
Capital - - 36,208 45,540 120,607 22,500
Debt, Transfers & Other - 7,500 - - - -
Total 1,180,994 1,326,729 1,692,980 1,841,725 1,916,792 1,847,613
Storm Water
Expenditure Category 2017 Actual 2018 Actual 2019 Actual 2020 Approved 2020 Amended 2021 Proposed
Labor 476,964 564,833 654,732 765,225 773,644 792,137
Overtime 8,088 10,839 12,175 23,171 23,171 10,314
Pension 70,304 80,519 89,894 102,302 103,481 102,320
Employment Taxes & Medical 121,389 123,385 161,161 174,884 177,302 174,661
Other Personnel 1,820 2,893 3,702 3,835 3,835 3,835
Supplies - - 30,490 93,080 93,080 94,555
Services 513,352 531,414 226,956 473,411 884,564 492,278
Capital - - 18,120 - 46,990 7,500
Debt, Transfers & Other - 74,200 55,000 - - -
Total 1,191,917 1,388,084 1,252,229 1,635,908 2,106,067 1,677,600
169

Department of Public Utilities
Environmental ServicesUtility Administration
Expenditure Category 2017 Actual 2018 Actual 2019 Actual 2020 Approved 2020 Amended 2021 Proposed
Labor - - 42,889 63,285 63,285 64,934
Overtime - - - - - -
Pension - - 5,935 8,860 8,860 9,091
Employment Taxes & Medical - 1,004 10,636 14,349 14,349 14,290
Other Personnel - - - 550 550 550
Supplies - - (1,578) 2,000 2,000 2,750
Services - - 4,755 17,644 17,644 48,693
Capital - - - - - -
Debt, Transfers & Other - - - - - -
Total - 1,004 62,638 106,688 106,688 140,308
170
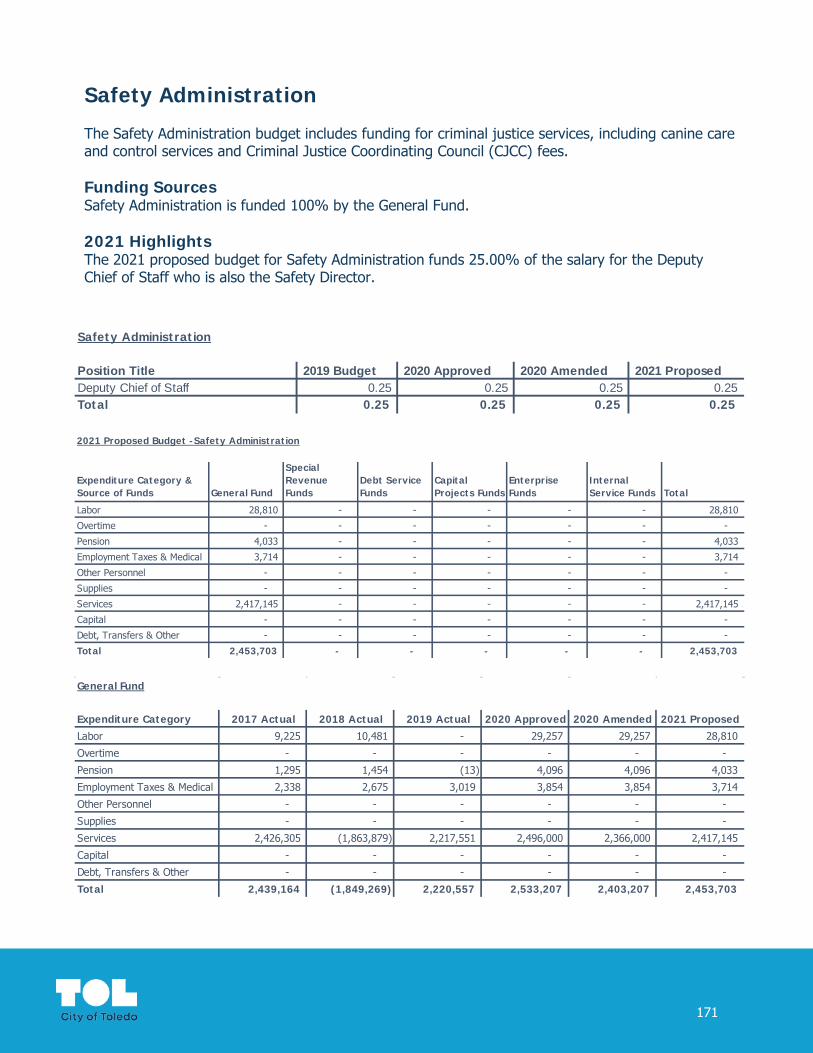
Safety Administration
The Safety Administration budget includes funding for criminal justice services, including canine care and control services and Criminal Justice Coordinating Council (CJCC) fees.
Funding SourcesSafety Administration is funded 100% by the General Fund.
2021 HighlightsThe 2021 proposed budget for Safety Administration funds 25.00% of the salary for the Deputy Chief of Staff who is also the Safety Director.
Safety Administration
Position Title 2019 Budget 2020 Approved 2020 Amended 2021 ProposedDeputy Chief of Staff 0.25 0.25 0.25 0.25 Total 0.25 0.25 0.25 0.25
2021 Proposed Budget -Safety Administration
Expenditure Category & Source of Funds General Fund
Special Revenue Funds
Debt Service Funds
Capital Projects Funds
Enterprise Funds
Internal Service Funds Total
Labor 28,810 - - - - - 28,810
Overtime - - - - - - -
Pension 4,033 - - - - - 4,033
Employment Taxes & Medical 3,714 - - - - - 3,714
Other Personnel - - - - - - -
Supplies - - - - - - -
Services 2,417,145 - - - - - 2,417,145
Capital - - - - - - -
Debt, Transfers & Other - - - - - - -
Total 2,453,703 - - - - - 2,453,703
General Fund
Expenditure Category 2017 Actual 2018 Actual 2019 Actual 2020 Approved 2020 Amended 2021 Proposed
Labor 9,225 10,481 - 29,257 29,257 28,810
Overtime - - - - - -
Pension 1,295 1,454 (13) 4,096 4,096 4,033
Employment Taxes & Medical 2,338 2,675 3,019 3,854 3,854 3,714
Other Personnel - - - - - -
Supplies - - - - - -
Services 2,426,305 (1,863,879) 2,217,551 2,496,000 2,366,000 2,417,145
Capital - - - - - -
Debt, Transfers & Other - - - - - -
Total 2,439,164 (1,849,269) 2,220,557 2,533,207 2,403,207 2,453,703
171

Toledo Police
Toledo Police Department enhances the quality of life in Toledo by working in partnership with the community to preserve life, enforce the law, provide quality services, reduce the fear of crime, and promote joint problem-solving for safe, secure neighborhoods. The Police Department is committed to working with the community to identify and solve problems as an aid in the reduction of crime. The department's policing practices and tactics complement the needs of Toledo neighborhoods. Toledo Police Officers work to:
• Prevent or reduce crime and disorder and proactively enforce the law through patrol and answering calls for service
• Apprehend violators of the law through investigation and the collection of evidence• Safeguard property and return lost or stolen property to the rightful owner• Preserve individual rights through mediation, advice, and preventative presence and enforcement• Provide for the safe flow of traffic throughout the city through enforcement of traffic laws• Maintain a high degree of police-community interaction• Ensure a high level of departmental and individual performance through training and supervisory
control• Provide employee safety and well-being through training, equipment and supply acquisition and
administrative and technical support; 911 dispatching; and repository of criminal records and property
Funding SourcesThe Toledo Police Department is funded 95.14% by the General Fund. The department also has CIP funding for capital projects, funding from municipal tow lot operations, and SCM&R.
2021 HighlightsThe 2021 Police Department budget supports 679.46 FTEs, including a budgeted class of 31 new officers scheduled to start in October. Labor costs constitute the largest portion of the department’s proposed budget, with a total cost of $76,359,151
The 2021 proposed General Fund supplies and services budget of $7,670,856 will support current operations, as well as programs and initiatives such as continued support of Data Driven Policing.
172

Toledo PolicePolice
Position Title 2019 Budget 2020 Approved 2020 Amended 2021 ProposedAdministrative Analyst 1 1.00 2.00 2.00 2.00 Administrative Analyst 4 1.00 1.00 1.00 1.00 Administrative Assistant - 0.62 0.62 0.62 Administrative Specialist 2.00 2.00 2.00 2.00 Administrative Technician 1 2.00 2.00 2.00 2.00 Administrator-Administrative Services 2 - 0.67 - -
Administrator-Public Services 2 1.00 1.00 1.00 1.00 Clerk Specialist 2 1.00 1.00 1.00 1.00
Criminalist 2.00 2.00 1.42 - Director-Public Services 1.00 1.00 1.00 1.00 Police - Secretary 1.00 1.00 1.00 1.00
Police Captain 6.00 7.00 7.00 7.00 Police Data Control Clerk 1.00 1.00 1.00 1.00 Police Data Entry Clerk 6.00 6.00 4.58 4.00 Police Deputy Chief - Pro Tem 3.00 3.00 3.00 3.00 Police Lieutenant 28.00 28.00 28.00 28.00 Police Officer 506.73 515.85 495.43 493.84 Police Records Clerk 42.00 42.00 31.00 31.00 Police Sergeant 97.00 96.00 96.00 96.00 Secretary 1 1.00 0.62 0.21 -
Secretary 3 0.62 - - - Senior Criminalist 1.00 1.00 1.00 1.00 Staff Criminalist - - - 1.00 Traffic Aide 3.00 3.00 2.16 1.00 Utility Worker 1.00 1.00 1.00 1.00 Grand Total 708.35 718.76 683.42 679.46
2021 Proposed Budget -Police
Expenditure Category & Source of Funds General Fund
Special Revenue Funds
Debt Service Funds
Capital Projects Funds
Enterprise Funds
Internal Service Funds Total
Labor 52,465,374 97,902 - - - - 52,563,276
Overtime 3,127,190 - - - - - 3,127,190
Pension 10,360,515 13,706 - - - - 10,374,221
Employment Taxes & Medical 9,848,502 28,100 - - - - 9,876,602
Other Personnel 557,570 - - - - - 557,570
Supplies 1,000,533 - - - 41,610 - 1,042,143
Services 8,120,323 - - - 1,012,599 - 9,132,922
Capital - - - 1,105,500 - - 1,105,500
Debt, Transfers & Other - - - 300,000 1,601,511 - 1,901,511
Total 85,480,006 139,708 - 1,405,500 2,655,720 - 89,680,934
173

Toledo PoliceGeneral Fund
Expenditure Category 2017 Actual 2018 Actual 2019 Actual 2020 Approved 2020 Amended 2021 Proposed
Labor 49,070,520 48,364,106 51,289,302 54,823,256 53,565,214 52,465,374
Overtime 3,049,610 2,968,685 2,936,356 3,042,720 3,042,720 3,127,190
Pension 9,528,958 9,721,236 10,101,507 10,766,353 10,551,144 10,360,515
Employment Taxes & Medical 9,256,906 8,237,104 9,429,735 10,513,864 10,197,887 9,848,502
Other Personnel 421,688 422,365 436,705 557,570 497,570 557,570
Supplies 1,681,772 1,300,026 1,167,114 1,257,300 937,077 1,000,533
Services 4,922,422 4,666,587 5,895,296 5,957,151 5,642,398 8,120,323
Capital - - - - - -
Debt, Transfers & Other - 35,000 - - - -
Total 77,931,875 75,715,109 81,256,016 86,918,214 84,434,010 85,480,006
Street Construction, Maintenance & Repair
Expenditure Category 2017 Actual 2018 Actual 2019 Actual 2020 Approved 2020 Amended 2021 Proposed
Labor 68,520 54,391 38,142 115,003 115,003 39,505
Overtime 1,102 313 - - - -
Pension 9,747 7,181 5,340 16,100 16,100 5,531
Employment Taxes & Medical 39,221 33,891 38,421 41,525 41,525 13,913
Other Personnel - - - - - -
Supplies - - - - - -
Services 5,200 - - - - -
Capital - - - - - -
Debt, Transfers & Other - - - - - -
Total 123,789 95,777 81,903 172,629 172,629 58,948
Operation Grants
Expenditure Category 2017 Actual 2018 Actual 2019 Actual 2020 Approved 2020 Amended 2021 Proposed
Labor 119,023 (139,636) - - 124,127 58,397
Overtime 196,398 158,297 107,228 - 315,119 -
Pension 46,435 4,729 24,154 - 44,516 8,176
Employment Taxes & Medical 45,226 78,740 5,895 - 39,422 14,187
Other Personnel - - - - - -
Supplies 300,484 242,470 604,373 - 756,027 -
Services 154,247 132,272 74,057 - 445,113 -
Capital - - - - - -
Debt, Transfers & Other - - - - - -
Total 861,813 476,872 815,708 - 1,724,323 80,760
174

Toledo PoliceCapital Improvement
Expenditure Category 2017 Actual 2018 Actual 2019 Actual 2020 Approved 2020 Amended 2021 Proposed
Labor - - - - - -
Overtime - - - - - -
Pension - - - - - -
Employment Taxes & Medical - - - - - -
Other Personnel - - - - - -
Supplies 77,641 228,332 114,002 - 168,998 -
Services 71,664 - 430,033 - 1,557,768 -
Capital 1,285,872 21,394 763,656 1,796,320 65,747 1,105,500
Debt, Transfers & Other 748,183 748,183 748,183 - - 300,000
Total 2,183,360 997,909 2,055,874 1,796,320 1,792,513 1,405,500
Municipal Tow Low
Expenditure Category 2017 Actual 2018 Actual 2019 Actual 2020 Approved 2020 Amended 2021 Proposed
Labor - - - - - -
Overtime - - - - - -
Pension - - - - - -
Employment Taxes & Medical - - - - - -
Other Personnel - - - - - -
Supplies 31,866 43,941 41,700 39,910 39,910 41,610
Services 865,945 885,982 962,061 1,061,582 1,061,582 1,012,599
Capital - - - - - -
Debt, Transfers & Other 1,064,800 1,288,134 1,469,693 1,396,916 1,396,916 1,601,511
Total 1,962,612 2,218,057 2,473,453 2,498,408 2,498,408 2,655,720
175
Toledo Fire and Rescue
Mission StatementThe mission of the Toledo Fire and Rescue Department is the protection of the community from fire and other emergencies through education, fire prevention code enforcement, emergency disaster planning, and the response of highly trained personnel.
Since 1837, Toledo Firefighters have been protecting the citizens of Toledo first as volunteers, then in 1868 as paid Firefighters. The first fire station was located on Cherry St. in 1837. Much has changed since those early years. Now, the Toledo Fire and Rescue Department has 18 fire stations located strategically throughout the city. In addition to responding to fires, all Toledo firefighters are trained Emergency Medical Technicians and many are also certified Paramedics. Each year the Toledo Fire Department responds to over 60,000 emergency incidents. These incidents include fire, medical, hazardous materials incidents, water rescue, confined space rescue, homeland security and any other necessary emergency responses.
The Toledo Fire and Rescue Department is organized into the following bureaus:
Fire Communications Bureau – Dispatches all emergency and non-emergency incidents for the department; coordinates communications between field operations personnel, staff and outside agencies, other city emergency personnel, the airport and the National Weather Service; maintains a record of all radio communications for Police and Fire departments; oversees the repairs and maintenance of the 800 Mhz radio system and all radio communication equipment used by police, fire and public works.
Emergency Medical Services (EMS) –Monitors and assists in the EMT recertification for all members; coordinates with Lucas County personnel to staff City of Toledo/Lucas County Paramedic Life Squads; schedules and monitors attendance at mandatory paramedic continuing education; provides Q/A, Q/I for ALS and BLS response; order, distribute and maintain EMS supplies; review and recommend revisions to EMS protocols; acquire and maintain EMS records; review and revise BLS protocols; oversees the Community Paramedicine Program; locates and acquires State and Federal EMS grants; acts as a liaison with relevant community agencies and governmental agencies.
Field Operations - Responds to over 60,000 incidents annually that include all fires, medical emergencies, confined space and high angle rescues, hazardous material emergencies, water (dive) rescues, flooding emergencies, homeland security concerns and any other responses as deemed necessary. Field Operations monitors the fire ground for safety concerns and oversees line Safety Officers, investigates and reviews firefighter injuries, and oversees the department’s fleet and building maintenance programs.
176

Toledo Fire and Rescue
Safety Bureau – Responsible for keeping Toledo firefighters safe in the dynamic and ever-evolving fire service through development and management of safety training for personnel. The Safety Bureau helps to reduce injuries and protect the firefighters through training sessions that focus on high risk activity.
Building Maintenance Bureau – Enables the Fire Department to perform ‘in-house’ maintenance and repair of the fire stations and facilities. Building maintenance is conducted in a systematic and planned manner by the department’s Operations Bureau with the work of two civilian building trades employees. The department’s Building Maintenance personnel conduct minor repairs and preventative maintenance on equipment. Larger repairs are being completed by utilizing outside vendors that are registered with the City of Toledo. Large projects such as carpet and station remodeling are being addressed through the Capital Improvement Funding.
Fleet Maintenance Bureau –Responsible for the repair and maintenance of all department vehicles, apparatus, tools and equipment; tests for safety, performance and reliability of all department equipment; writes specifications and evaluates all new apparatus and equipment; distributes tools and equipment to all fire stations; maintains, distributes and inventories all safety clothing worn by firefighters. Works with the City’s Fleet Department on repair and maintenance of fire vehicles.
Fire Prevention Bureau (FPB) – Inspection of buildings, structures, and premises for fire hazards and the enforcement of the Fire Prevention Codes; distribution of smoke detectors; repository for all fire reports; provides public education on fire safety; reviews plans for new buildings and alterations to existing buildings for code compliance; contributes to the city’s building permit issuing process; inspects buildings that require annual permits and high hazard occupancies. This bureau interacts with the following city departments and governmental agencies: Building Inspection, Plan Commission, Water Department, Traffic Engineering, Health Department, Lucas County Building Regulations, State of Ohio Industrial Commission and Fire Marshal.
177

Toledo Fire and Rescue
Special Operations Bureau – Responsible for the department’s preparedness and ability to recognize and respond appropriately to traditional and non-traditional threats within our community; oversee specialized training in confined space rescue, high angle rope rescue, water rescue, dive rescue, and vehicle accident extrication; regional coordinator of the Northwest Ohio Urban Search and Rescue (USAR); involved in the following grants: Urban Area Security Initiative, Metropolitan Medical Response System (MMRS), Regional Medical Response System(RMRS), and State Homeland Security; coordinates RMRS & MMRS steering committees; leadership positions with Ohio Medical Technical Advisory Committee, Ohio Haz Mat/Decon Technical Advisory Committee, Ohio USAR Technical Advisory Committee. This bureau interacts with the Police Department, Ohio Emergency Management Agency (OEMA), Lucas County Emergency Management Agency (LCEMA) as well as nearly all of the top management of all City departments and City administration. Coordinate mutual aid agreements with 22 surrounding communities.
Fire Investigation Unit - Investigates the origin, cause and circumstances of fires that are of undetermined or incendiary in nature. Members of the Fire Investigation Unit are trained Arson Investigators with police powers. The Fire Investigation Unit is also tasked with investigating fires where there is serious injury or death in accordance with the laws of the City of Toledo and the State of Ohio.
Professional Standards Bureau - Maintains the highest level of integrity and professionalism for all employees of the department. The Professional Standards Bureau will respond to any credible information concerning misconduct by department employees, and is charged with the responsibility of investigating any serious allegations of misconduct involving an employee. Through the use of various investigative techniques, the Professional Standards Bureau gathers the necessary information needed to determine the truth surrounding an allegation. The employee’s rights are important and are protected through any investigation, along with the integrity and confidentiality of the investigation itself.
Training Bureau –Maintains training charters and accreditations as required by the State of Ohio; provides fire training for new recruits; coordinates and provides continuing fire training for all firefighters; provides re-entry training for firefighters who have been off work or away from regular fire duties for more than 6 months; provides initial EMT-B training for all members of the department; provides refresher training for all EMT-B’s; provides CPR training for all members; develops and updates department training manual; provides the department’s testing and evaluations of tools and equipment and provides paramedic training for department personnel. This bureau has offices at Owens Community College and the University of Toledo Medical Center. The Training Bureau also interacts with the Ohio Fire Academy through the State Fire Marshal’s office.
178

Toledo Fire and Rescue
Community Engagement – Engages the community through community outreach and public education; coordinates with Human Resources, Diversity and Inclusion, Law Department and other city departments and community organizations to develop effective public safety recruiting campaigns.
Support Services Bureau – Budget preparation and monitoring, purchasing, payroll, scheduling, timekeeping, human resource activities, contracts and ordinances. This bureau works as the liaison with the city’s departments of Information & Communication Technology, Human Resources, Purchasing, Affirmative Action, Treasury, Budgeting and Accounts
Funding SourcesThe Fire Department is funded 99.54% by the General Fund.
2021 HighlightsThe 2021 Fire & Rescue Department budget supports 662.19 FTEs, including a class of 50 firefighters budgeted to start in March. Labor costs constitute the largest portion of the department’s General Fund budget with a proposed total of $70,374,268.
Budget for supplies and services totals $6,002,600 and supports current operating expenditures including equipment and clothing purchase, training, contractual tuition obligations, building maintenance and fleet and fuel costs.
179

Toledo Fire and RescueFire
Position Title 2019 Budget 2020 Approved 2020 Amended 2021 ProposedAdministrative Analyst 2 1.00 1.00 1.00 1.00 Administrative Assistant - 1.00 1.00 1.00 Administrative Specialist 1.00 1.00 1.00 1.00 Administrative Technician 1 1.00 1.00 - - Administrative Technician 2 - 0.50 0.50 0.50 Building And Grounds Maintenance Worker 1.00 1.00 1.00 1.00
Chief Financial Officer 1.00 1.00 1.00 1.00 Clerk Specialist 2 3.00 3.00 2.58 2.00
Director-Public Services 1.00 1.00 1.00 1.00 Fire - Maintenance Bureau 1.00 - - - Fire - Maintenance Bureau Supervisor - 1.00 1.00 1.00
Fire Battalion Chief 16.00 18.00 18.00 18.00 Fire Captain 13.00 16.00 16.00 13.00 Fire Captain (Medic 8%) 1.00 1.00 1.00 1.00 Fire Captain (Medic) 19.00 21.00 21.00 19.00 Fire Captain Maintenance Supervisor (Medic) 1.00 1.00 1.00 1.00
Position Title 2019 Budget 2020 Approved 2020 Amended 2021 ProposedFire Communications Specialist 22.00 21.00 21.00 21.00 Fire Deputy Chief 4.00 4.00 4.00 4.00
Fire Fighter 209.94 203.49 199.10 212.69 Fire Fighter/Paramedic 194.00 181.99 181.99 189.00 Fire Fighter/Paramedic (8%) 3.00 2.00 2.00 2.00 Fire Inspector 6.00 8.00 6.58 6.00 Fire Lieutenant 43.00 36.00 36.00 33.00 Fire Lieutenant (Medic) 42.00 41.00 41.00 53.00 Fire Lieutenant/Paramedic - 6.00 6.00 - Fire Plans Examiner 1 1.00 1.00 1.00 1.00 Fire Plans Examiner 2 1.00 1.00 1.00 1.00
Manager-Administrative Services - 1.00 1.00 1.00 Medical Quality Control Billing Clerk 1.00 1.00 0.58 - Police Communications Specialist 1 31.00 32.00 32.00 32.00 Police Communications Specialist 2 30.00 30.00 30.00 30.00 Secretary 2 1.00 1.00 0.58 - Secretary 3 1.00 - - - Senior Trades Mechanic - 1.00 1.00 1.00 Supervisor-Communications 8.00 - - - Supervisor-Fire Communications - 6.00 6.00 6.00 Supervisor-Police Communications - 8.00 8.00 8.00 Trades Mechanic 1.00 - - -
Total 658.94 653.98 645.91 662.19
180
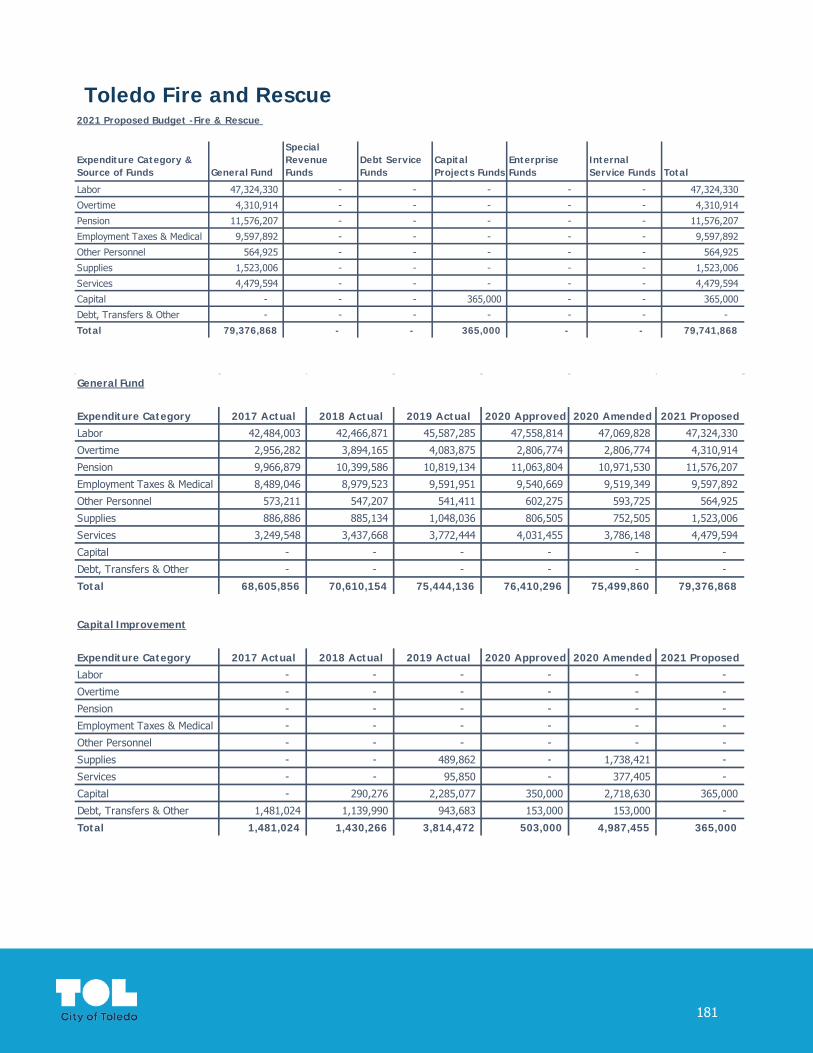
Toledo Fire and Rescue2021 Proposed Budget -Fire & Rescue
Expenditure Category & Source of Funds General Fund
Special Revenue Funds
Debt Service Funds
Capital Projects Funds
Enterprise Funds
Internal Service Funds Total
Labor 47,324,330 - - - - - 47,324,330
Overtime 4,310,914 - - - - - 4,310,914
Pension 11,576,207 - - - - - 11,576,207
Employment Taxes & Medical 9,597,892 - - - - - 9,597,892
Other Personnel 564,925 - - - - - 564,925
Supplies 1,523,006 - - - - - 1,523,006
Services 4,479,594 - - - - - 4,479,594
Capital - - - 365,000 - - 365,000
Debt, Transfers & Other - - - - - - -
Total 79,376,868 - - 365,000 - - 79,741,868
General Fund
Expenditure Category 2017 Actual 2018 Actual 2019 Actual 2020 Approved 2020 Amended 2021 Proposed
Labor 42,484,003 42,466,871 45,587,285 47,558,814 47,069,828 47,324,330
Overtime 2,956,282 3,894,165 4,083,875 2,806,774 2,806,774 4,310,914
Pension 9,966,879 10,399,586 10,819,134 11,063,804 10,971,530 11,576,207
Employment Taxes & Medical 8,489,046 8,979,523 9,591,951 9,540,669 9,519,349 9,597,892
Other Personnel 573,211 547,207 541,411 602,275 593,725 564,925
Supplies 886,886 885,134 1,048,036 806,505 752,505 1,523,006
Services 3,249,548 3,437,668 3,772,444 4,031,455 3,786,148 4,479,594
Capital - - - - - -
Debt, Transfers & Other - - - - - -
Total 68,605,856 70,610,154 75,444,136 76,410,296 75,499,860 79,376,868
Capital Improvement
Expenditure Category 2017 Actual 2018 Actual 2019 Actual 2020 Approved 2020 Amended 2021 Proposed
Labor - - - - - -
Overtime - - - - - -
Pension - - - - - -
Employment Taxes & Medical - - - - - -
Other Personnel - - - - - -
Supplies - - 489,862 - 1,738,421 -
Services - - 95,850 - 377,405 -
Capital - 290,276 2,285,077 350,000 2,718,630 365,000
Debt, Transfers & Other 1,481,024 1,139,990 943,683 153,000 153,000 -
Total 1,481,024 1,430,266 3,814,472 503,000 4,987,455 365,000
181
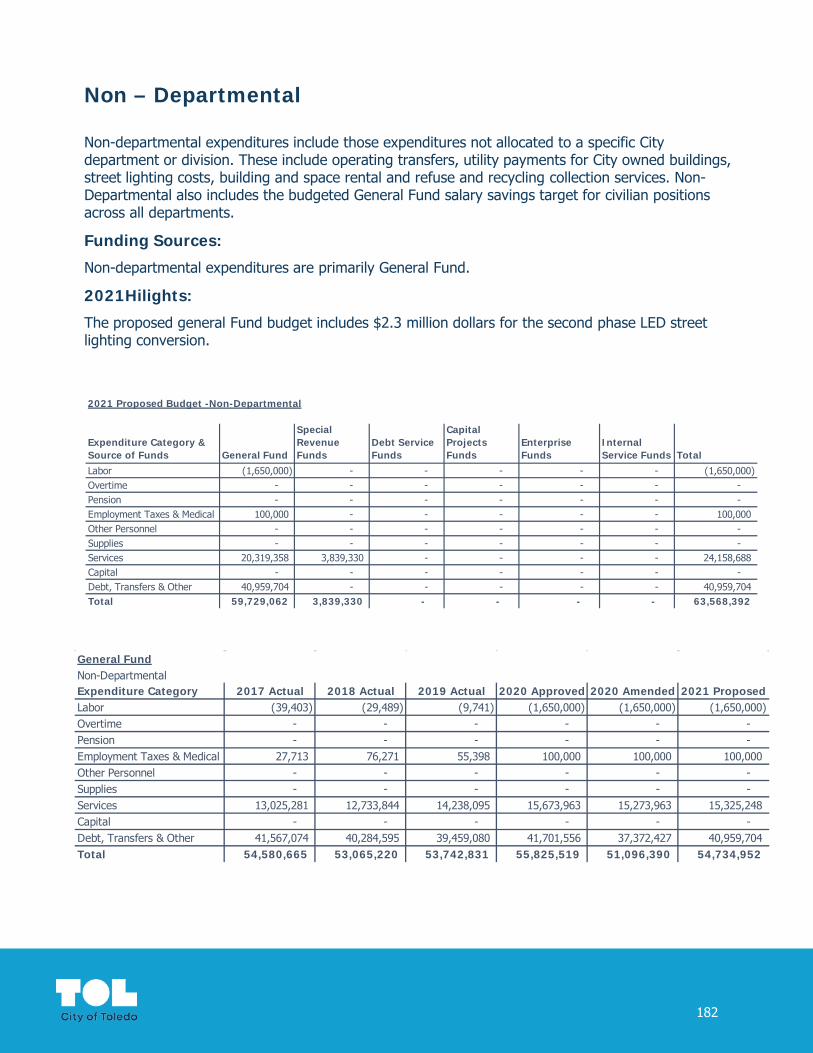
Non – Departmental
Non-departmental expenditures include those expenditures not allocated to a specific City department or division. These include operating transfers, utility payments for City owned buildings, street lighting costs, building and space rental and refuse and recycling collection services. Non-Departmental also includes the budgeted General Fund salary savings target for civilian positions across all departments.
Funding Sources:
Non-departmental expenditures are primarily General Fund.
2021Hilights:
The proposed general Fund budget includes $2.3 million dollars for the second phase LED street lighting conversion.
2021 Proposed Budget -Non-Departmental
Expenditure Category & Source of Funds General Fund
Special Revenue Funds
Debt Service Funds
Capital Projects Funds
Enterprise Funds
Internal Service Funds Total
Labor (1,650,000) - - - - - (1,650,000) Overtime - - - - - - - Pension - - - - - - - Employment Taxes & Medical 100,000 - - - - - 100,000 Other Personnel - - - - - - - Supplies - - - - - - - Services 20,319,358 3,839,330 - - - - 24,158,688 Capital - - - - - - - Debt, Transfers & Other 40,959,704 - - - - - 40,959,704 Total 59,729,062 3,839,330 - - - - 63,568,392
General FundNon-DepartmentalExpenditure Category 2017 Actual 2018 Actual 2019 Actual 2020 Approved 2020 Amended 2021 ProposedLabor (39,403) (29,489) (9,741) (1,650,000) (1,650,000) (1,650,000) Overtime - - - - - - Pension - - - - - - Employment Taxes & Medical 27,713 76,271 55,398 100,000 100,000 100,000 Other Personnel - - - - - - Supplies - - - - - - Services 13,025,281 12,733,844 14,238,095 15,673,963 15,273,963 15,325,248 Capital - - - - - - Debt, Transfers & Other 41,567,074 40,284,595 39,459,080 41,701,556 37,372,427 40,959,704 Total 54,580,665 53,065,220 53,742,831 55,825,519 51,096,390 54,734,952
182
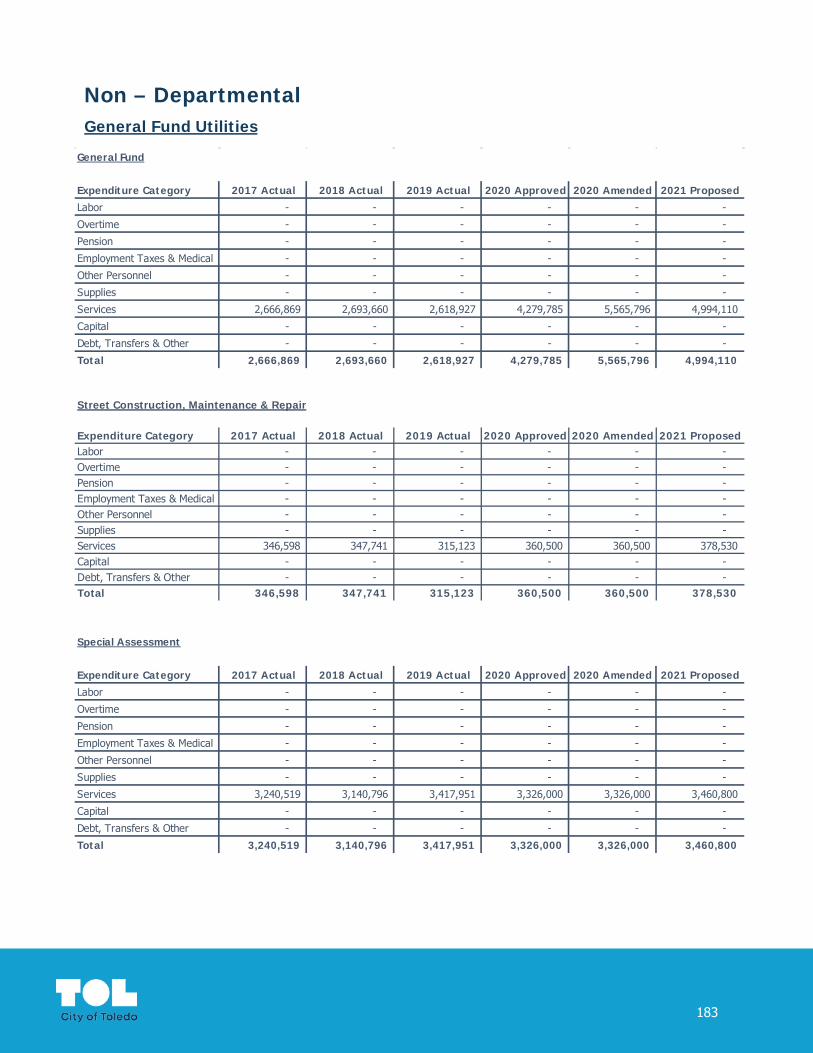
Non – DepartmentalGeneral Fund Utilities
General Fund
Expenditure Category 2017 Actual 2018 Actual 2019 Actual 2020 Approved 2020 Amended 2021 Proposed
Labor - - - - - -
Overtime - - - - - -
Pension - - - - - -
Employment Taxes & Medical - - - - - -
Other Personnel - - - - - -
Supplies - - - - - -
Services 2,666,869 2,693,660 2,618,927 4,279,785 5,565,796 4,994,110
Capital - - - - - -
Debt, Transfers & Other - - - - - -
Total 2,666,869 2,693,660 2,618,927 4,279,785 5,565,796 4,994,110
Special Assessment
Expenditure Category 2017 Actual 2018 Actual 2019 Actual 2020 Approved 2020 Amended 2021 Proposed
Labor - - - - - -
Overtime - - - - - -
Pension - - - - - -
Employment Taxes & Medical - - - - - -
Other Personnel - - - - - -
Supplies - - - - - -
Services 3,240,519 3,140,796 3,417,951 3,326,000 3,326,000 3,460,800
Capital - - - - - -
Debt, Transfers & Other - - - - - -
Total 3,240,519 3,140,796 3,417,951 3,326,000 3,326,000 3,460,800
Street Construction, Maintenance & Repair
Expenditure Category 2017 Actual 2018 Actual 2019 Actual 2020 Approved 2020 Amended 2021 ProposedLabor - - - - - - Overtime - - - - - - Pension - - - - - - Employment Taxes & Medical - - - - - - Other Personnel - - - - - - Supplies - - - - - - Services 346,598 347,741 315,123 360,500 360,500 378,530 Capital - - - - - - Debt, Transfers & Other - - - - - - Total 346,598 347,741 315,123 360,500 360,500 378,530
183

Appendix

Fiscal Plan & Projections
185

Introduction The City’s first long-term Fiscal Plan and Projection (The Plan) was instituted with the Approved FY 2020 Budget. The Plan is intended to guide decision-making around the achievement of balanced annual budgets, establishment and maintenance of strategic, prudent reserve funds, responsible reinvestment in capital infrastructure, and efficient use of resources.
The Plan was updated during the summer of 2020 to reflect revised revenue and expenditure projections necessitated by the economic impacts of the COVID-19 pandemic.
The Fiscal Plan and Projection included in this Proposed FY 2021 Budget builds on the planning efforts started in 2020, while recognizing the challenges of optimizing service delivery during a period of economic uncertainty and scare resources.
This document is intended to serve as a summary of the detailed planning efforts that have been undertaken as part of this strategic planning process. An effort has been made to provide readers with a summary key process descriptions, assumptions, guiding principles, and forecasts.
Key financial assumptions and targets have been superimposed on baseline financial data.
Revenue and Expenditure Assumptions
2020 Summary: Revenues and expenditures forecasts for fiscal year 2020 are based on analysis of prior year and year-to-date performance (through September 2020) and incorporate the projected positive impacts of CARES Act funding and State of Ohio workers’ compensation rebates received in 2020. The General Fund budget, amended in July, projected a spend-down of fund balance of approximately $19.1 million. As a result of the CARES Act funds and workers’ compensation rebates, the current General Fund projections estimate an increase to fund balance of approximately $23.8 million.
186

2021 Summary: Revenues and expenditures have been forecasted based on prior year and year-to-date analysis, while also reflecting the new ¼% income tax rate and projected collections, which will be used for roadway improvements.
Income Tax revenues are expected to grow approximately 1.7% in total over current year projections, prior to accounting for the new ¼% income tax. This estimate reflects projected growth in withholding collections, while decreases are estimated in business net profit and individual collections compared to 2020 projections.
Factoring in the new ¼% income tax, which is expected to generate in excess of $19.0 million annually for road improvements beginning in 2022, total income tax collections in 2021 are projected to exceed currently estimated 2020 collections by 11.3%.
Other revenues are expected to grow approximately 4% over current year projections, which reflects a partial rebound in revenues from the levels experienced during the COVID-19 pandemic in spring and early summer 2020.
Operating Transfer revenues projected for 2021 include a transfer in from the Capital Improvement Fund of $11.0 million.
2022-2029 Summary:
Income Tax revenue is projected to grow by an average of approximately 2.8%. The Finance Department’s Division of Taxation is reorganizing in order to more effectively utilize federal income tax data to identify income for which taxes have not yet been paid. It is estimated that a structural increase of 1% or more can be realized from a more effective approach.
Other revenue is slated to grow at a pace of approximately 2%.
Operating Transfer from the Capital Improvement Fund is expected to be $16.5 million annually to provide sufficient resources to maintain City operations, including essential public safety services.
Salary and fringe expenses are projected to grow by 1% annually in order to maintain reserves in the fund balance.
Supplies and services expenses are anticipated to grow at a pace of approximately 1% in order to maintain reserves in the fund balance.
187

Financial Targets and Other Criteria
Several key indicators establish the overarching fiscal goals that serve as a foundation for the Plan. The targets identified below are consistent with those commonly practiced by municipal enterprise funds, and reflect the entrepreneurial nature of the Plan. Each is designed to address specific objectives to ensure the fiscal health of the organization.
Fund Balance: the City’s long-term goal is to achieve an unreserved fund balance of $40 million in the General Fund. This fund balance is designed to address short-term operating fluctuations and provide liquidity when receipts are lagging targets or when unanticipated expenditures occur. The targeted metric is equivalent to approximately 1½ months of operating expense, consistent with sound financial planning for many entities. Although current projections for 2020 indicate a year-ending fund balance in excess of the target, a spend-down in reserves is expected through 2025.
CIP Funding: It is necessary that the City ensure adequate replacement of its infrastructure, which is vital to the long-term needs of its constituents. The goal for CIP funding will result in a level of annual investment (as measured by actual revenue financed capital and principal paid on debt) that is at least equal to the depreciation expense of our infrastructure. In this manner we are ensuring that the City’s equity in its assets is not depleted.
Annual New Road & Bridge Matches & Planning Projects: the City’s major road and bridge system is vital to sustaining major industrial activity, as well as the access of our residents to major employers, shopping, and other commercial opportunities, as well as to regional and interstate highway and transportation systems. The City has access to federal and state funding to maintain these systems as long as the City commits a certain amount of matching funding. The Plan reflects currently expected Matches & Planning funds for 2021-2025.
Annual New Buildings, Machinery and Equipment Projects: the cost-effective delivery of City services relies on the maintenance of facilities, fleet and major equipment, including buildings, heating and cooling systems, police patrol cars and tactical units, fire trucks and ambulances, heavy duty trucks for snow plowing, public works, utility system maintenance, and light-duty staff vehicles, which support various City departmental needs.
188

Financial Targets and Other Considerations
CIP Funding (continued):
Annual New Residential Road Projects: the City’s Residential Road system is currently declining due to a lack of adequate repair and replacement. The passage of an additional ¼% income tax in November 2020 will provide over $19.0 million for roadway improvements. The Plan assumes renewal of the temporary ¼% in future years in order to continue critical investments in road infrastructure.
Debt Financing for Capital Improvements: This target refers to creating mechanisms to address the capital needs of the City in the most responsible and efficient manner possible. It includes establishing the optimal balance of debt and revenue to balance the current and long-term financing responsibility. This approach is designed to assure that the City’s equity position in its infrastructure is sound, to provide a stable source of funds for routine replacement capital expenses. The goal would be to achieve investment targets for CIP, while maintaining outstanding debt at levels that are acceptable. The City would not exceed the 5.5% limit for non-voted General Obligation debt as imposed by State Law.
Bond Ratings: One of the overarching principles embedded within The Plan is to achieve and maintain excellent bond ratings. The reserve fund and capital financing strategies identified above are intended to directly impact this metric. In addition to the direct impact of lower borrowing costs on future debt issuances, improved bond ratings have the indirect impact of enhancing community pride and the marketability to new commerce.
189

City of Toledo Performance Plan
190

City of Toledo Performance PlanBasic Services
Priority No.
Department Strategic Priority
Objective Activity Performance Indicator
1 D&I Basic Services
Ensure prompt response to employee concerns of harassment and
discrimination.
Hire investigative staff to reduce complaint investigation period.
Investigate new complaints within 45 days
1 D&I Basic Services
Ensure prompt response to calls for accessible services across the city.
Investigate and coordinate city resources to ensure compliance with
Title II
Investigate new requests and resolve within 45 days
1 D&I Basic Services
Ensure prompt response to employee concerns of harassment and
discrimination.
Hire investigative staff to reduce complaint investigation period.
Resolve outstanding complaints byDecember 2021
1 DPS Basic Services
Prove quality city services such as trash collection and solid waste management
services that encourage community-wide recycling, reuse, and waste reduction.
Solid waste recycling and waste collection
.05% increase in waste compacted
1 DPS Basic Services
Prove quality city services such as trash collection and solid waste management
services that encourage community-wide recycling, reuse, and waste reduction.
Solid waste recycling and waste collection
0.86 AUF waste compacted
1 DPS Basic Services
Prove quality city services such as trash collection and solid waste management
services that encourage community-wide recycling, reuse, and waste reduction.
Solid waste recycling and waste collection
10% decrease in contaminated recyclable shipped for processing
from a baseline of 4,312
1 DPS Basic Services
Ensure prompt response to calls for service across the city.
Continue the expansion and effective mobilization of programming/services
(mowing, potholes, cleaning, compaction)
2 day decrease response time to service requests
1 DPS Basic Services
Ensure prompt response to calls for service across the city.
Continue the expansion and effective mobilization of programming/services
(mowing, potholes, cleaning, compaction)
5% decrease grass related code enforcement complaints
1 DPU Basic Services
Predict locations of lead service lines forfuture replacement.
Complete lead line replacement study.
100% completion of lead line replacement study by 2nd
quarter.1 DPU Basic
ServicesEnsure customers have easy access to their accounts and several bill paying
methods.
Implement Customer Self Service Portalwhich will open up several
communication channels to both provide and gather information from
customers to improve service.
Decrease average calls per call center representative by 10%
1 Economic Development
Basic Services
Ensure prompt response to calls for service across the city.
Implement CityWorks PLL into Building Inspection
June-22
1 Economic Development
Basic Services
Ensure prompt response to calls for service across the city.
Cross train employee to reduce delays 100% of employees cross trained by December 2021
1 Economic Development
Basic Services
Ensure prompt response to calls for service across the city.
Ensure development and construction timeframes are as short as possible to
support ease of doing business with the city
12 average number of days for building plan review
1 Economic Development
Basic Services
Ensure prompt response to calls for service across the city.
Ensure development and construction timeframes are as short as possible to
support ease of doing business with the city
90% of office calls answered within 3 minutes
1 Economic Development
Basic Services
Ensure prompt response to calls for service across the city.
Ensure development and construction timeframes are as short as possible to
support ease of doing business with the city
90% of voicemails and emails responded to within 3 days
1 Economic Development
Basic Services
Ensure prompt response to calls for service across the city.
Ensure development and construction timeframes are as short as possible to
support ease of doing business with the city
98% of building plans reviewed within 12 days
1 Economic Development
Basic Services
Ensure prompt response to calls for service across the city.
Ensure development and construction timeframes are as short as possible to
support ease of doing business with the city
98% of commercial inspections complete within 3 days
1 Economic Development
Basic Services
Ensure prompt response to calls for service across the city.
Ensure development and construction timeframes are as short as possible to
support ease of doing business with the city
98% of inspections complete within 1 hours (drive time,
inspection & results)
1 Economic Development
Basic Services
Ensure prompt response to calls for service across the city.
Ensure development and construction timeframes are as short as possible to
support ease of doing business with the city
98% of inspections completed within 4 days
191

Priority No.
Department Strategic Priority
Objective Activity Performance Indicator
1 Economic Development
Basic Services
Ensure prompt response to calls for service across the city.
Ensure development and construction timeframes are as short as possible to
support ease of doing business with the city
98% of resident inspections complete within 3 days
1 Finance Basic Services
Ensure the efficient and effective use oftax-payer dollars in providing city
services.
Develop and implement plan to respond to audit findings
March-21
1 Finance Basic Services
Ensure the efficient and effective use oftax-payer dollars in providing city
services.
Support implementation of OpenGov budget and performance tracking software for greater transparency, performance management, and
reporting.
June-21
1 Finance Basic Services
Ensure the efficient and effective use oftax-payer dollars in providing city
services.
Conduct cost allocation study of City-wide internal support services and related costs to determine most
appropriate allocation on indirect costs to various city funds
September-21
1 Finance Basic Services
Ensure the efficient and effective use oftax-payer dollars in providing city
services.
Reclassify positions to maximize income tax collections and grow
General Fund balance
$500,000 in additional income tax revenue (contingent upon
division reclassification)
1 Fire Basic Services
Ensure the efficient and effective use oftax-payer dollars in providing City
services.
Disaggregate BLS data to identify opportunities to reduce runs to provide
more efficient and effective service.
June-21
1 Fire Basic Services
Ensure the efficient and effective use oftax-payer dollars in providing City
services.
Insure working smoke alarms are installed in all occupied homes
# of functional smoke detectors found in structure fires
1 Fire Basic Services
Ensure the efficient and effective use oftax-payer dollars in providing City
services.
Insure working smoke alarms are installed in all occupied homes
60% increase in the number of functional smoke detectors found
in structure fires1 Fire Basic
ServicesEnsure response to calls for service
across the city.Achieve a satisfactory level of performance relating to the
organization and deployment of Advanced Life Support (ALS)
Incidents at the 90th percentile
90% of Advanced Life Support runs arrive 5 minutes or less
(dispatch to arrival)
1 Fire Basic Services
Ensure response to calls for service across the city.
Achieve a satisfactory level of performance relating to the organization and deployment of Basic Life Support (BLS) Incidents at the 90th percentile
90% of Basic Life Support runs arrive 5 minutes or less (dispatch
to arrival)
1 ICT Basic services
Maintain, preserve, and manage City records and information/data with clear,forward-looking plans so that data willbe a readily accessible resource that
contributes to community goals.
Manage risk (security and reliability) byimplementing secondary data center.
September-21
1 ICT Basic services
Maintain, preserve, and manage City records and information/data with clear,forward-looking plans so that data willbe a readily accessible resource that
contributes to community goals.
Manage risk by eliminating W7 extended support
December-21
1 ICT Basic services
Maintain, preserve, and manage City records and information/data with clear,forward-looking plans so that data willbe a readily accessible resource that
contributes to community goals.
Manage Risk through continued Cybersecurity awareness and testing
program
December-21
1 ICT Basic services
Ensure prompt response to calls for service across the city.
Establish a plan to improve application support beyond
Cityworks/GIS & End User Support Staff levels
December-21
1 ICT Basic services
Maintain, preserve, and manage City records and information/data with clear,forward-looking plans so that data willbe a readily accessible resource that
contributes to community goals.
Manage risk by eliminating W7 extended support
85% of W7 machines replaced
1 ICT Basic services
Maintain, preserve, and manage City records and information/data with clear,forward-looking plans so that data willbe a readily accessible resource that
contributes to community goals.
Manage Risk through continued Cybersecurity awareness and testing
program
90% of employees pass phishing test”
1 ICT Basic services
Maintain, preserve, and manage City records and information/data with clear,forward-looking plans so that data willbe a readily accessible resource that
contributes to community goals.
Manage risk (security and reliability) byimplementing secondary data center.
Annual recovery test completed
192

Priority No.
Department Strategic Priority
Objective Activity Performance Indicator
1 ICT Basic services
Ensure prompt response to calls for service across the city.
Establish a plan to improve application support beyond
Cityworks/GIS & End User Support Staff levels
Staffing model and job descriptions complete
1 Neighborhood s
Basic Services
Ensure prompt response to calls for service across the city
Revise EngageToledo Service Level Agreement (SLA) to streamline
constituent calls for service
January-21
1 Neighborhood s
Basic Services
Ensure prompt response to calls for service across the city
Implement call-tracking software for the Division of Code Enforcement for
prompt intake and communication to citizens
July-21
1 Neighborhood s
Basic Services
Maintain, preserve and manage City records and information/data with
clear, forward-looking plans so that data will be a readily accessible
resource that contributes to communitygoals
Interface with other Divisions on the platform consistent with safe data-
sharing
December-21
1 Neighborhood s
Basic Services
Ensure the efficient and effective use oftax-payer dollars in providing City
services.
Continue to closely monitor all CDBG and ESG funded activities on a monthly
basis for HUD compliance.
Clean annual audit review from HUD/June 2021
1 Neighborhood s
Basic Services
Maintain, preserve and manage City records and information/data with
clear, forward-looking plans so that data will be a readily accessible
resource that contributes to communitygoals
Develop external dashboards for greatertransparency of performance outcomes
Dashboards March 2021
1 Neighborhood s
Basic Services
Ensure the efficient and effective use oftax-payer dollars in providing City
services.
Continue to account for all federal dollars, draw down from HUD timely and reconcile all grants on an annual
basis.
Zero Findings from the City outside auditor/June 2021
1 Plan Commission
Basic Services
Ensure prompt response to calls for service
Perform research, conduct data analysis, and create maps to convey
planning information.
25 request for maps or research topics for various City departments
and neighborhood groups
1 Plan Commission
Basic Services
Ensure prompt response to calls for service
Review compliance with the zoning code and any applicable case
requirements which require involves communication with developers, property owners, and other city
agencies
70% of agency reviews within 14days average business days foragency review comments
1 Plan Commission
Basic Services
Ensure prompt response to calls for service
Review compliance with the zoning code and any applicable case
requirements which require involves communication with developers, property owners, and other city
agencies
75% of applications review within 14 business days
1 Plan Commission
Basic Services
Ensure prompt response to calls for service
Review compliance with the zoning code and any applicable case
requirements which require involves communication with developers, property owners, and other city
agencies
average processing days by application type
1 Plan Commission
Basic Services
Maintain, preserve, and manage City records and information/data with clear,forward-looking plans so that data willbe a readily accessible resource that
contributes to community goals.
Comprehensive plan May 2023 completion
1 Police Basic Services
Ensure public safety employees are well-trained, equipped, accountable,
transparent, and respectable.
Purchase body warn cameras June-21
1 Police Basic Services
Ensure prompt response to calls for service
Introduce false alarm ordinance to reduce burglary and robbery alarms
December-21
1 Police Basic Services
Ensure prompt response to calls for service
Purchase 13 new vehicles % of vehicles over five years old
1 Police Basic Services
Ensure public safety employees are well-trained, equipped, accountable,
transparent, and respectable.
Work with the program manager for the Mayor’s Initiative to Reduce Gun
Violence on strategies to reduce gun violence.
1% decrease in ShotSpotter notifications
1 Police Basic Services
Ensure public safety employees are well-trained, equipped, accountable,
transparent, and respectable.
Invest resources into officer training and development
10 cadet volunteer training hours per week in high risk
neighborhoods
1 Police Basic Services
Ensure public safety employees are well-trained, equipped, accountable,
transparent, and respectable.
Purchase body warn cameras 100% of officers with cameras
193
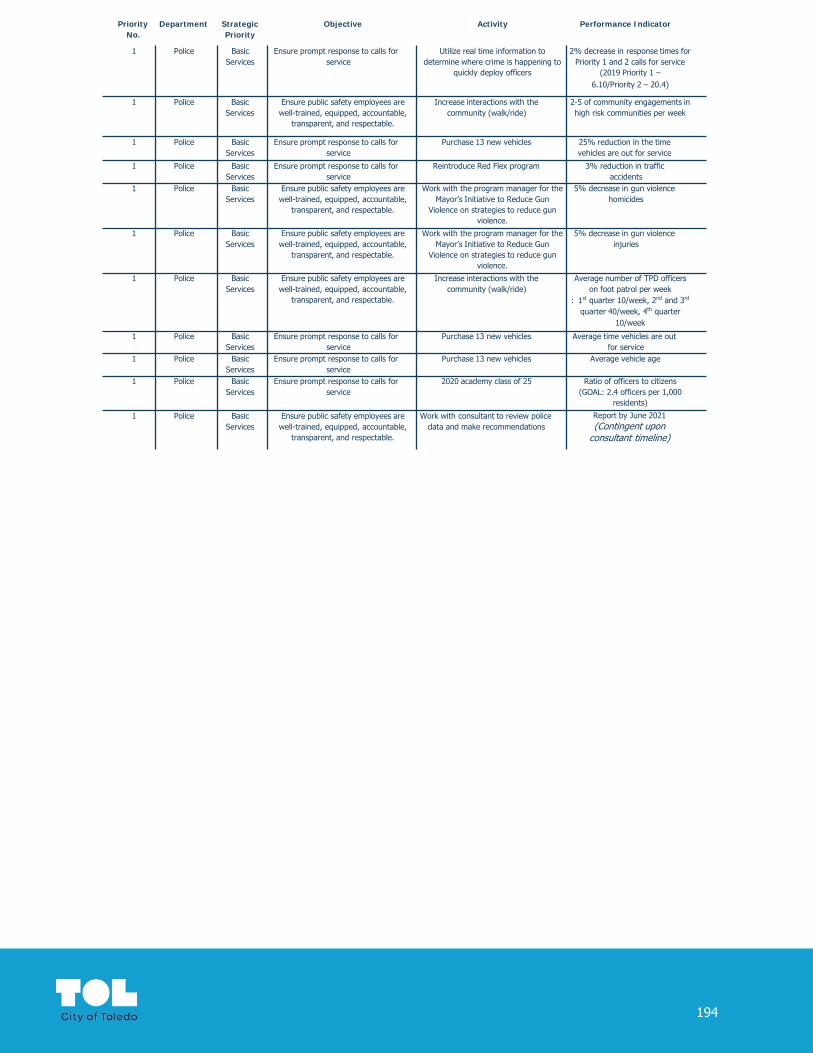
Priority No.
Department Strategic Priority
Objective Activity Performance Indicator
1 Police Basic Services
Ensure prompt response to calls for service
Utilize real time information to determine where crime is happening to
quickly deploy officers
2% decrease in response times forPriority 1 and 2 calls for service
(2019 Priority 1 –6.10/Priority 2 – 20.4)
1 Police Basic Services
Ensure public safety employees are well-trained, equipped, accountable,
transparent, and respectable.
Increase interactions with the community (walk/ride)
2-5 of community engagements in high risk communities per week
1 Police Basic Services
Ensure prompt response to calls for service
Purchase 13 new vehicles 25% reduction in the time vehicles are out for service
1 Police Basic Services
Ensure prompt response to calls for service
Reintroduce Red Flex program 3% reduction in traffic accidents
1 Police Basic Services
Ensure public safety employees are well-trained, equipped, accountable,
transparent, and respectable.
Work with the program manager for the Mayor’s Initiative to Reduce Gun
Violence on strategies to reduce gun violence.
5% decrease in gun violence homicides
1 Police Basic Services
Ensure public safety employees are well-trained, equipped, accountable,
transparent, and respectable.
Work with the program manager for the Mayor’s Initiative to Reduce Gun
Violence on strategies to reduce gun violence.
5% decrease in gun violence injuries
1 Police Basic Services
Ensure public safety employees are well-trained, equipped, accountable,
transparent, and respectable.
Increase interactions with the community (walk/ride)
Average number of TPD officers on foot patrol per week
: 1st quarter 10/week, 2nd and 3rd
quarter 40/week, 4th quarter 10/week
1 Police Basic Services
Ensure prompt response to calls for service
Purchase 13 new vehicles Average time vehicles are out for service
1 Police Basic Services
Ensure prompt response to calls for service
Purchase 13 new vehicles Average vehicle age
1 Police Basic Services
Ensure prompt response to calls for service
2020 academy class of 25 Ratio of officers to citizens (GOAL: 2.4 officers per 1,000
residents)
1 Police Basic Services
Ensure public safety employees are well-trained, equipped, accountable,
transparent, and respectable.
Work with consultant to review police data and make recommendations
Report by June 2021 (Contingent upon
consultant timeline)
194

City of Toledo Performance PlanEnvironment
Priority No.
Department Strategic Priority
Objective Activity Performance Indicator
2 DPS Environmen t
Promote conservation of natural resources by incentivizing and
implementing sustainable practices, energy efficiency, and alternative
energy solutions.
Incorporate environmental resource conservation messaging in city parks.
2% of park space
2 DPS Environmen t
Promote and implement sustainability practices within the organization.
Improve health of tree canopy while also addressing residents’ concerns.
5% increase year-over-year in trees planted
2 DPS Environmen t
Promote and implement sustainability practices within the organization.
Improve health of tree canopy while also addressing residents’ concerns.
665 trees planted
2 DPS Environmen t
Promote and implement sustainability practices within the organization.
Maintain the Hoffman Road Landfill within Ohio EPA and Lucas County HD
regulatory requirements within Notice ofViolations (NOVs)
Tons of cubic yards 0.86
2 DPU Environmen t
Maintain reliable utility infrastructure to deliver safe and clean water to all residents and facilitate wastewater
treatment and storm water management.
Continue to target a reduction in total phosphorus and e-coli count in the
plant’s final effluent
<0.6 mg/l for phosphorous (limit 1.0) <100 count per 100 ml fore-coli (limit 126 for the month)
2 DPU Environmen t
Maintain public infrastructure thatserves the needs of the communityincluding utilities and water supply.
Reduce backlog of jobs in the Division ofSewers and Water Distribution to address
Top 3 City Works complaints
10% reduction in work order backlog in both divisions
2 DPU Environmen t
Operate water, sewer, and storm water utilities in a manner which
provides for the health of the community and protects and
promotes environmental sustainability.
Implement current Green Infrastructure Maintenance
100% complete by 4th quarter
195

City of Toledo Performance PlanQuality Investment
Priority No.
Department Strategic Priority
Objective Activity Performance Indicator
3 D&I Quality Investment
Encourage entrepreneurship with local,minority, and women business owners by supporting access to contracting
opportunities and counseling services within the City.
Complete disparity study December-21
3 DPS Quality Investment
Develop and sustain public infrastructure that services the needs of the community
including roads, parks, green spaces,facilities, and Wi- Fi
Continue the expansion and effective mobilization of programming/services
(mowing, potholes, cleaning, compaction)
119.52 miles of alleys cleaned
3 DPS Quality Investment
Develop and sustain public infrastructure that services the needs of the community
including roads, parks, green spaces,facilities, and Wi- Fi
Continue the expansion and effective mobilization of programming/services
(mowing, potholes, cleaning, compaction)
1,660.09 centerline miles of leaf removal - 100% of lane
miles of leaf removal
3 DPS Quality Investment
Develop and sustain public infrastructure that services the needs of the community
including roads, parks, green spaces,facilities, and Wi- Fi
Continue the expansion and effective mobilization of programming/services
(mowing, potholes, cleaning, compaction)
100% alleys cleaned
3 DPS Quality Investment
Develop and sustain public infrastructure that services the needs of the community
including roads, parks, green spaces,facilities, and Wi- Fi
Continue the expansion and effective mobilization of programming/services
(mowing, potholes, cleaning, compaction)
100% of utility restorations complete
3 DPS Quality Investment
Develop and sustain public infrastructure that services the needs of the community
including roads, parks, green spaces,facilities, and Wi- Fi
Convert all Toledo Edison and COT owned streetlights to LED
28,000 streetlight converted by December 2021
3 DPS Quality Investment
Develop and sustain public infrastructure that services the needs of the community
including roads, parks, green spaces,facilities, and Wi- Fi
Update city buildings, procurement and equipment through energy
efficiencies and savings
5% decrease in annual utility billexpenses based on pending
contract with Leopardo
3 DPS Quality Investment
Develop and sustain public infrastructure that services the needs of the community
including roads, parks, green spaces,facilities, and Wi- Fi
Continue the expansion and effective mobilization of programming/services
(mowing, potholes, cleaning, compaction)
5% decrease of grass related code enforcement complaints
3 DPS Quality Investment
Develop and sustain public infrastructure that services the needs of the community
including roads, parks, green spaces,facilities, and Wi- Fi
Continue the expansion and effective mobilization of programming/services
(mowing, potholes, cleaning, compaction)
850 of utility restorations
3 DPS Quality Investment
Develop and sustain public infrastructure that services the needs of the community
including roads, parks, green spaces,facilities, and Wi- Fi
Continue the expansion and effective mobilization of programming/services
(mowing, potholes, cleaning, compaction)
Decrease response time to service requests by two days
3 DPS Quality Investment
Provide and support availability of high quality, affordable recreational
programming and activities that appealto people of all demographics.
Maintain current, and increase new program partner relationships
Increase from 14 to 18collaborative partners. (29%)
3 DPU Quality Investment
Implement a $19.5 million residential road resurfacing program
Complete the construction program in 2021.
Complete resurfacing, reconstruction or reclamation on
42 miles of residential roads
3 Economic Development
Quality Investment
Use investment incentives, policies, andmaintain updated marketing materials,
engagement strategies and development review processes to invite investment andreinvestment by offering consistent and
transparent processes to developers.
Invest in due diligence items for the Spitzer and Nicholas buildings with economic development partners to position them for redevelopment.
December-21
3 Economic Development
Quality Investment
Use investment incentives, policies, andmaintain updated marketing materials,
engagement strategies and development review processes to invite investment andreinvestment by offering consistent and
transparent processes to developers.
Create an economic development strategic plan
December-21
196

Priority No.
Department Strategic Priority
Objective Activity Performance Indicator
3 Economic Development
Quality Investment
Enforce regulations to ensure home andpublic spaces are structurally secure,
clean, visually appealing, and promote community well-being
Work with sign code taskforce to complete a new draft sign code,
permit forms, and procedures, and enforcement policies.
December-21
3 Economic Development
Quality Investment
Encourage entrepreneurship with local,minority, and women business owners by supporting access to counseling,
capital, and contracting opportunities.
Complete the Disparity Study December-21
3 Economic Development
Quality Investment
Encourage entrepreneurship with local,minority, and women business owners by supporting access to counseling,
capital, and contracting opportunities.
Support NRSA by identifying, mapping,and conducting outreach to businesses in
target areas, connecting businesses to COT and community programs and
incentives that support retention andgrowth
# of businesses served by target area
3 Economic Development
Quality Investment
Encourage entrepreneurship with local,minority, and women business owners by supporting access to counseling,
capital, and contracting opportunities.
Support NRSA by identifying, mapping,and conducting outreach to businesses in
target areas, connecting businesses to COT and community programs and
incentives that support retention andgrowth
$ invested to support business growth
3 Economic Development
Quality Investment
Use investment incentives, policies, andmaintain updated marketing materials,
engagement strategies and development review processes to invite investment andreinvestment by offering consistent and
transparent processes to developers.
Leverage City incentives and resources to drive job creation, retention and capital investment
$1,065,365 investment from the Toledo Expansion Incentive
program created 4,365 new jobs and generated $4,102,690 in new
income tax. (2020 Baseline)
3 Economic Development
Quality Investment
Encourage entrepreneurship with local,minority, and women business owners by supporting access to counseling,
capital, and contracting opportunities.
Provide technical assistance to local W/MBE companies
$1,347,500 of EDL loans
3 Economic Development
Quality Investment
Use investment incentives, policies, andmaintain updated marketing materials,
engagement strategies and development review processes to invite investment andreinvestment by offering consistent and
transparent processes to developers.
Leverage City incentives and resources to drive capital investment, eliminate
blight, decrease vacancy, and improve the condition of the commercial and
industrial building stock.
$353,462 investment from the Business Incentive Grant program
leveraged $706,924 in private investment. (2020 Baseline)
3 Economic Development
Quality Investment
Encourage entrepreneurship with local,minority, and women business owners by supporting access to counseling,
capital, and contracting opportunities.
Support NRSA by identifying, mapping,and conducting outreach to businesses in
target areas, connecting businesses to COT and community programs and
incentives that support retention andgrowth
% revenue growth as a result ofassistance (2021 Baseline)
3 Economic Development
Quality Investment
Use investment incentives, policies, andmaintain updated marketing materials,
engagement strategies and development review processes to invite investment andreinvestment by offering consistent and
transparent processes to developers.
Leverage city-owned real estate, not needed for a municipal purpose, to attract new jobs and investment.
10 of acres of properties sold
3 Economic Development
Quality Investment
Encourage entrepreneurship with local,minority, and women business owners by supporting access to counseling,
capital, and contracting opportunities.
Provide technical assistance to local W/MBE companies
21 small business expand their operations
3 Economic Development
Quality Investment
Use investment incentives, policies, andmaintain updated marketing materials,
engagement strategies and development review processes to invite investment andreinvestment by offering consistent and
transparent processes to developers.
Proactively conduct Business Retention and Expansion (BRE) visits with existing
companies
25 of BRE Visits
3 Economic Development
Quality Investment
Use investment incentives, policies, andmaintain updated marketing materials,
engagement strategies and development review processes to invite investment andreinvestment by offering consistent and
transparent processes to developers.
Leverage city-owned real estate, not needed for a municipal purpose, to attract new jobs and investment.
3 of properties sold
197

Priority No.
Department Strategic Priority
Objective Activity Performance Indicator
3 Neighborhood s
Quality Investment
Proactively (re)invest in neighborhoods through support of programs andencourage sustainable community(re)development and rehabilitation practices that address blight, and
preserve and protect historic properties.
Complete City of Toledo Neighborhood Capacity Building Institute (NCBI) curriculum and
framework.
January-21
3 Neighborhood s
Quality Investment
Proactively (re)invest in neighborhoods through support of programs andencourage sustainable community(re)development and rehabilitation practices that address blight, and
preserve and protect historic properties.
Lead Poisoning Prevention Communication Plan
January-21
3 Neighborhood s
Quality Investment
Proactively (re)invest in neighborhoods through support of programs andencourage sustainable community(re)development and rehabilitation practices that address blight, and
preserve and protect historic properties.
Partner with Division of Housing to coordinate education and outreach
activities to educate property owners on available resources
January-21
3 Neighborhood s
Quality Investment
Enforce regulations to ensure home andpublic spaces are structurally secure,
clean, visually appealing, and promote community well-being.
Center for Community Progress Code Enforcement Assessment
January-21
3 Neighborhood s
Quality Investment
Enforce regulations to ensure home andpublic spaces are structurally secure,
clean, visually appealing, and promote community well-being.
Establish workgroup including mayoralstaff, Council, DON and Land Bank to
implement CCP Assessment Recommendations
January-21
3 Neighborhood s
Quality Investment
Proactively (re)invest in neighborhoods through support of programs andencourage sustainable community(re)development and rehabilitation practices that address blight, and
preserve and protect historic properties.
Recruit and begin yearlong training forfirst NCBI cohort (18 organizations and
leaders)
March-21
3 Neighborhood s
Quality Investment
Enforce regulations to ensure home andpublic spaces are structurally secure,
clean, visually appealing, and promote community well-being.
Coordinate with stakeholder organizations to develop a community focusedapproach to nuisance abatement
March-21
3 Neighborhood s
Quality Investment
Enforce regulations to ensure home andpublic spaces are structurally secure,
clean, visually appealing, and promote community well-being.
Update Code Enforcement legislation forgreater enforcement capacity
March-21
3 Neighborhood s
Quality Investment
Enforce regulations to ensure home andpublic spaces are structurally secure,
clean, visually appealing, and promote community well-being.
-part of the review & assessment from the CCP
March-21
3 Neighborhood s
Quality Investment
Enforce regulations to ensure home andpublic spaces are structurally secure,
clean, visually appealing, and promote community well-being.
-review current registration & enforcement non-lead property
maintenance code for re-assignment to other Divisions
March-21
3 Neighborhood s
Quality Investment
Proactively (re)invest in neighborhoods through support of programs andencourage sustainable community(re)development and rehabilitation practices that address blight, and
preserve and protect historic properties.
Complete capacity building plan and strategy for the Frederick Douglas
Center Board.
July-21
3 Neighborhood s
Quality Investment
Proactively (re)invest in neighborhoods through support of programs andencourage sustainable community(re)development and rehabilitation practices that address blight, and
preserve and protect historic properties.
Comprehensive Housing Study completion
July-21
198

Priority No.
Department Strategic Priority
Objective Activity Performance Indicator
3 Neighborhood s
Quality Investment
Enforce regulations to ensure home andpublic spaces are structurally secure,
clean, visually appealing, and promote community well-being.
Complete and fund proactive dumping“hot spots ” plan including cameras,
monitoring, dumpsters, scheduledpick-ups, etc.
July-21
3 Neighborhood s
Quality Investment
Proactively (re)invest in neighborhoods through support of programs andencourage sustainable community(re)development and rehabilitation practices that address blight, and
preserve and protect historic properties.
Establishment of Comprehensive Housing Study Action Plan work
group.
August-21
3 Neighborhood s
Quality Investment
Proactively (re)invest in neighborhoods through support of programs andencourage sustainable community(re)development and rehabilitation practices that address blight, and
preserve and protect historic properties.
Complete NRSA plan development andHUD approval process
(Junction/Englewood/East Toledo/Old South End)
December-21
3 Neighborhood s
Quality Investment
Enforce regulations to ensure home andpublic spaces are structurally secure,
clean, visually appealing, and promote community well-being.
Develop a strategy for enforcement on the Lead Safe Ordinance and rental
registry program
December-21
3 Neighborhood s
Quality Investment
Proactively (re)invest in neighborhoods through support of programs andencourage sustainable community(re)development and rehabilitation practices that address blight, and
preserve and protect historic properties.
Develop vacant land strategy in partnership with Land Bank, Economic Development, Code Enforcement and
Plan Commission to be included in Comprehensive Housing Strategy and
Comprehensive Plan.
July-22
3 Neighborhood s
Quality Investment
Proactively (re)invest in neighborhoods through support of programs andencourage sustainable community(re)development and rehabilitation practices that address blight, and
preserve and protect historic properties.
HOME and CDBG gap financing for construction and rehabilitation of
rental and homebuyer units
10 homebuyer units/December2021
3 Neighborhood s
Quality Investment
Proactively (re)invest in neighborhoods through support of programs andencourage sustainable community(re)development and rehabilitation practices that address blight, and
preserve and protect historic properties.
HOME funding for Tenant Based Rental Assistance TPS homeless
families
10 Homeless families assisted with TBRA/December 2021
3 Neighborhood s
Quality Investment
Proactively (re)invest in neighborhoods through support of programs andencourage sustainable community(re)development and rehabilitation practices that address blight, and
preserve and protect historic properties.
Blight removal through strategic residential property demolition
10 units/ December 2021
3 Neighborhood s
Quality Investment
Proactively (re)invest in neighborhoods through support of programs andencourage sustainable community(re)development and rehabilitation practices that address blight, and
preserve and protect historic properties.
Continued implementation of theHOME At Last down payment andclosing costs assistance program.
100 new homeowners assisted
3 Neighborhood s
Quality Investment
Proactively (re)invest in neighborhoods through support of programs andencourage sustainable community(re)development and rehabilitation practices that address blight, and
preserve and protect historic properties.
Funding homeownership counseling in partnership with NODA and NTR
100 new homeowners assisted
3 Neighborhood s
Quality Investment
Proactively (re)invest in neighborhoods through support of programs andencourage sustainable community(re)development and rehabilitation practices that address blight, and
preserve and protect historic properties.
Elimination of lead-based paint through the Lead Paint Hazard
Control Grant.
125 properties receiving lead remediation/ December 2021
199

Priority No.
Department Strategic Priority
Objective Activity Performance Indicator
3 Neighborhood s
Quality Investment
Proactively (re)invest in neighborhoods through support of programs andencourage sustainable community(re)development and rehabilitation practices that address blight, and
preserve and protect historic properties.
Implement In Rem Housing Repair (tax-foreclosed housing) in partnership
with Lucas County Land Bank.
15 units/December 2021
3 Neighborhood s
Quality Investment
Proactively (re)invest in neighborhoods through support of programs andencourage sustainable community(re)development and rehabilitation practices that address blight, and
preserve and protect historic properties.
Fund programs/activities with the use ofCDBG and ESG that address community
(re) development, rehabilitation andblight in neighborhoods, youth
programming, homelessness and otherpublic services.
19,000 persons/July 2021
3 Neighborhood s
Quality Investment
Enforce regulations to ensure home andpublic spaces are structurally secure,
clean, visually appealing, and promote community well-being.
Increase staff training opportunities 2 of staff training opportunities each
3 Neighborhood s
Quality Investment
Proactively (re)invest in neighborhoods through support of programs andencourage sustainable community(re)development and rehabilitation practices that address blight, and
preserve and protect historic properties.
Blight removal through strategic industrial/commercial property
demolition
2 structures (Driggs Diary N and one other TBD)
3 Neighborhood s
Quality Investment
Proactively (re)invest in neighborhoods through support of programs andencourage sustainable community(re)development and rehabilitation practices that address blight, and
preserve and protect historic properties.
Implement City of Toledo Net Zero Energy Design Build competition for
Junction and Old South End
2 units/December 2021
3 Neighborhood s
Quality Investment
Proactively (re)invest in neighborhoods through support of programs andencourage sustainable community(re)development and rehabilitation practices that address blight, and
preserve and protect historic properties.
Lead worker/contractor outreach and training initiative with TPS.
20 new lead workers recruited and trained in partnership with
TPS construction trades curriculum/December 2021
3 Neighborhood s
Quality Investment
Proactively (re)invest in neighborhoods through support of programs andencourage sustainable community(re)development and rehabilitation practices that address blight, and
preserve and protect historic properties.
Implementation of Emergency Repair Program for Seniors in partnership with
East Toledo Senior Center.
25 units/December 2021
3 Neighborhood s
Quality Investment
Proactively (re)invest in neighborhoods through support of programs andencourage sustainable community(re)development and rehabilitation practices that address blight, and
preserve and protect historic properties.
HOME and CDBG gap financing for construction and rehabilitation of
rental and homebuyer units
60 rental units/July 2022
3 Neighborhood s
Quality Investment
Proactively (re)invest in neighborhoods through support of programs andencourage sustainable community(re)development and rehabilitation practices that address blight, and
preserve and protect historic properties.
Elimination of lead based paint hazard through the DON Landlord Early Bird
Lead Grant
75 rental properties assisted/December 2021
200
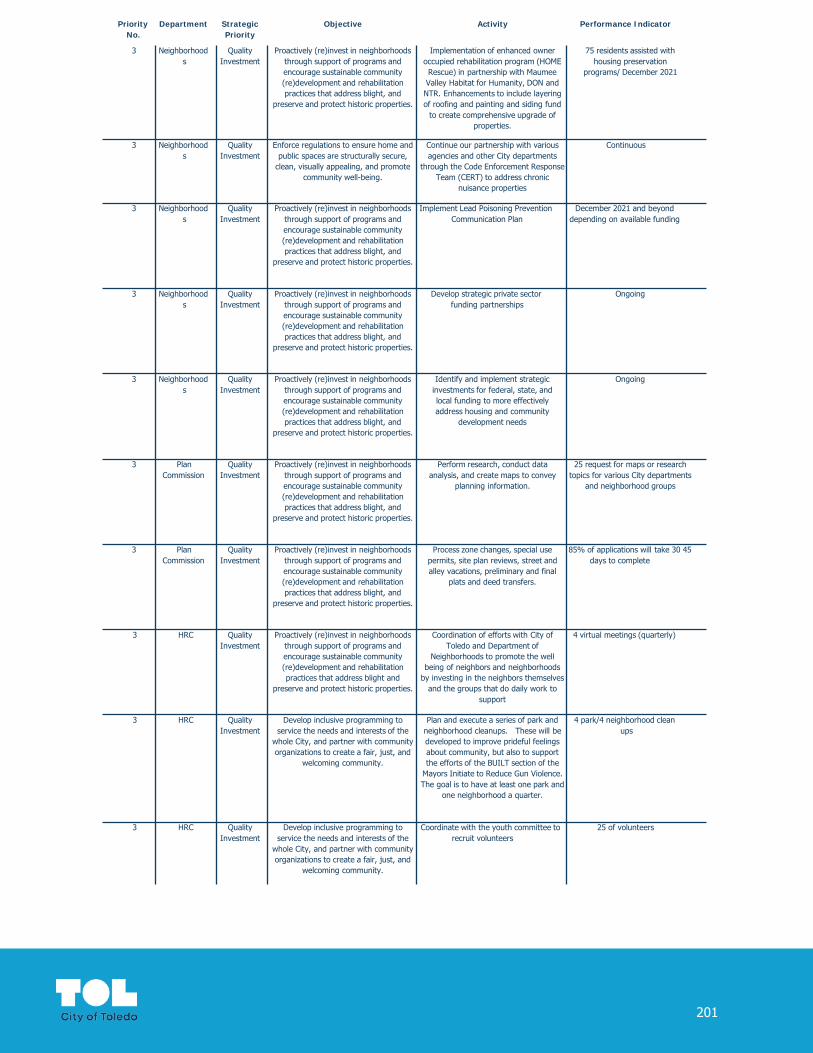
Priority No.
Department Strategic Priority
Objective Activity Performance Indicator
3 Neighborhood s
Quality Investment
Proactively (re)invest in neighborhoods through support of programs andencourage sustainable community(re)development and rehabilitation practices that address blight, and
preserve and protect historic properties.
Implementation of enhanced owner occupied rehabilitation program (HOME Rescue) in partnership with Maumee Valley Habitat for Humanity, DON andNTR. Enhancements to include layeringof roofing and painting and siding fund
to create comprehensive upgrade ofproperties.
75 residents assisted with housing preservation
programs/ December 2021
3 Neighborhood s
Quality Investment
Enforce regulations to ensure home andpublic spaces are structurally secure,
clean, visually appealing, and promote community well-being.
Continue our partnership with various agencies and other City departments
through the Code Enforcement Response Team (CERT) to address chronic
nuisance properties
Continuous
3 Neighborhood s
Quality Investment
Proactively (re)invest in neighborhoods through support of programs andencourage sustainable community(re)development and rehabilitation practices that address blight, and
preserve and protect historic properties.
Implement Lead Poisoning Prevention Communication Plan
December 2021 and beyond depending on available funding
3 Neighborhood s
Quality Investment
Proactively (re)invest in neighborhoods through support of programs andencourage sustainable community(re)development and rehabilitation practices that address blight, and
preserve and protect historic properties.
Develop strategic private sector funding partnerships
Ongoing
3 Neighborhood s
Quality Investment
Proactively (re)invest in neighborhoods through support of programs andencourage sustainable community(re)development and rehabilitation practices that address blight, and
preserve and protect historic properties.
Identify and implement strategic investments for federal, state, and local funding to more effectively address housing and community
development needs
Ongoing
3 Plan Commission
Quality Investment
Proactively (re)invest in neighborhoods through support of programs andencourage sustainable community(re)development and rehabilitation practices that address blight, and
preserve and protect historic properties.
Perform research, conduct data analysis, and create maps to convey
planning information.
25 request for maps or research topics for various City departments
and neighborhood groups
3 Plan Commission
Quality Investment
Proactively (re)invest in neighborhoods through support of programs andencourage sustainable community(re)development and rehabilitation practices that address blight, and
preserve and protect historic properties.
Process zone changes, special use permits, site plan reviews, street and alley vacations, preliminary and final
plats and deed transfers.
85% of applications will take 30 45days to complete
3 HRC Quality Investment
Proactively (re)invest in neighborhoods through support of programs andencourage sustainable community(re)development and rehabilitation practices that address blight and
preserve and protect historic properties.
Coordination of efforts with City of Toledo and Department of
Neighborhoods to promote the well being of neighbors and neighborhoods
by investing in the neighbors themselves and the groups that do daily work to
support
4 virtual meetings (quarterly)
3 HRC Quality Investment
Develop inclusive programming to service the needs and interests of the
whole City, and partner with communityorganizations to create a fair, just, and
welcoming community.
Plan and execute a series of park and neighborhood cleanups. These will be developed to improve prideful feelings about community, but also to support the efforts of the BUILT section of the
Mayors Initiate to Reduce Gun Violence. The goal is to have at least one park and
one neighborhood a quarter.
4 park/4 neighborhood clean ups
3 HRC Quality Investment
Develop inclusive programming to service the needs and interests of the
whole City, and partner with communityorganizations to create a fair, just, and
welcoming community.
Coordinate with the youth committee to recruit volunteers
25 of volunteers
201

Priority No.
Department Strategic Priority
Objective Activity Performance Indicator
3 HRC Quality Investment
Facilitate timely and effective communication throughout the public through a variety of media modes.
Highlight residents of Toledo who are doing things for the community in Project Humanity video series. The
series is being filmed by CREADIO andwill consist of six videos.
6 videos
3 HRC Quality Investment
Facilitate timely and effective communication throughout the public through a variety of media modes.
Highlight residents of Toledo who are doing things for the community to stop
violence in Project Humanity video series. The series is being filmed by CREADIO
and will consist of six videos.
5,000 of video views
3 HRC Quality Investment
Develop inclusive programming to service the needs and interests of the
whole City, and partner with communityorganizations to create a fair, just, and
welcoming community.
Collaborate with neighborhood leaders and former gang members to improve relationships with police and youth.
5 events (1 per day)
3 HRC Quality Investment
Develop inclusive programming to service the needs and interests of the
whole City, and partner with communityorganizations to create a fair, just, and
welcoming community.
Continued improvement of community/resident mediation programby marketing services to the community
200 of mediations
3 HRC Quality Investment
Develop inclusive programming to service the needs and interests of the
whole City, and partner with communityorganizations to create a fair, just, and
welcoming community.
Relaunch mediation program March-21
3 HRC Quality Investment
Provide access to high-quality education/resources to prepare residents including youth, for
career/education beyond a high school diploma.
Work to develop programs for youth who are seeking employment.
Partner with other agencies working with youth to coordinate efforts.
500 of youth employed
3 HRC Quality Investment
Provide access to high-quality education/resources to prepare residents including youth, for
career/education beyond a high school diploma.
Develop action plan in response to 2020 youth survey.
Dec-21
3 HRC Quality Investment
Develop inclusive programming to service the needs and interests of the
whole City, and partner with communityorganizations to create a fair, just, and
welcoming community.
A TikTok challenge will be employed forthe MLK day event in 2021. We goal is
to double the number of essay submissions by including this technology.
15 of essay submissions
3 HRC Quality Investment
Develop inclusive programming to service the needs and interests of the
whole City, and partner with communityorganizations to create a fair, just, and
welcoming community.
Host additional web series on the YOUTH experience in Toledo. The
video on this topic in 2020 has 4200 views on Facebook.
35% increase in viewer ship or number of episodes in series
3 HRC Quality Investment
Develop inclusive programming to service the needs and interests of the
whole City, and partner with communityorganizations to create a fair, just, and
welcoming community.
The exec committee will host the National Night out event. It is a national
event in August to improve the relationships between neighbors and
police. The event was canceled in 2020due to COVID, but the 2019 events were
highly successful with 15 communitypartners participating.
15 of community partners
3 HRC Quality Investment
Develop inclusive programming to service the needs and interests of the
whole City, and partner with communityorganizations to create a fair, just, and
welcoming community.
The exec committee will host WelcomingWeek, in partnership with Welcome TLC.
This event is in partnership with the TLCPL and will largely be virtual in 2021.
5 events sponsored by 5 community partners
3 HRC Quality Investment
Develop inclusive programming to service the needs and interests of the
whole City, and partner with communityorganizations to create a fair, just, and
welcoming community.
Continue the “what to do if” social media program. It discusses a variety of topics
as we go through the year includingvoting, kindness awareness, or any
community topic that comes up.
35% increase in viewer ship or number of episodes in series
3 HRC Quality Investment
Develop inclusive programming to service the needs and interests of the
whole City, and partner with communityorganizations to create a fair, just, and
welcoming community.
The SJ committee will partner with organizations on LGBTQ issues,
including PRIDE events
25 volunteers/5,000 participants
202

Priority No.
Department Strategic Priority
Objective Activity Performance Indicator
3 HRC Quality Investment
Develop inclusive programming to service the needs and interests of the
whole City, and partner with communityorganizations to create a fair, just, and
welcoming community.
Work with community partners on Domestic Violence, community violence
and all items to support the Mayor’s Initiative to end Gun Violence
4 events (1 quarterly)
203

City of Toledo Performance PlanCustomer Service
Priority No.
Department Strategic Priority
Objective Activity Performance Indicator
4 DPS Customer Service
Leverage technology and data throughout the organization for
efficient service delivery.
Enable CityWorks tablets for improved field management services
119.52 miles of alleys cleaned
4 DPS Customer Service
Leverage technology and data throughout the organization for
efficient service delivery.
Provide equipment and service order tracking
119.52 miles of alleys cleaned
4 DPS Customer Service
Leverage technology and data throughout the organization for
efficient service delivery.
Provide equipment and service order tracking
1,660.09 centerline miles of leaf removal
4 DPS Customer Service
Leverage technology and data throughout the organization for
efficient service delivery.
Enable CityWorks tablets for improved field management services
1,660.09 centerline miles of leaf removal - 100% of lane
miles of leaf removal4 DPS Customer
ServiceLeverage technology and data throughout the organization for
efficient service delivery.
Enable CityWorks tablets for improved field management services
100% alleys cleaned
4 DPS Customer Service
Leverage technology and data throughout the organization for
efficient service delivery.
Provide equipment and service order tracking
100% alleys cleaned
4 DPS Customer Service
Leverage technology and data throughout the organization for
efficient service delivery.
Provide equipment and service order tracking
100% of lane miles of leaf removal
4 DPS Customer Service
Leverage technology and data throughout the organization for
efficient service delivery.
Enable CityWorks tablets for improved field management services
100% of utility restorations complete
4 DPS Customer Service
Leverage technology and data throughout the organization for
efficient service delivery.
Provide equipment and service order tracking
100% of utility restorations complete
4 DPS Customer Service
Leverage technology and data throughout the organization for
efficient service delivery.
Enable CityWorks tablets for improved field management services
5% decrease of grass related code enforcement complaints
4 DPS Customer Service
Leverage technology and data throughout the organization for
efficient service delivery.
Provide equipment and service order tracking
5% decrease of grass related code enforcement complaints
4 DPS Customer Service
Leverage technology and data throughout the organization for
efficient service delivery.
Provide equipment and service order tracking
80% of repairs complete within 26hours
4 DPS Customer Service
Leverage technology and data throughout the organization for
efficient service delivery.
Enable CityWorks tablets for improved field management services
850 of utility restorations
4 DPS Customer Service
Leverage technology and data throughout the organization for
efficient service delivery.
Provide equipment and service order tracking
850 of utility restorations
4 DPS Customer Service
Leverage technology and data throughout the organization for
efficient service delivery.
Provide equipment and service order tracking
Average repair time
4 DPS Customer Service
Leverage technology and data throughout the organization for
efficient service delivery.
Enable CityWorks tablets for improved field management services
Decrease response time to service requests by two days
4 DPS Customer Service
Leverage technology and data throughout the organization for
efficient service delivery.
Provide equipment and service order tracking
Decrease response time to service requests by two days
4 DPU Customer Service
Leverage technology and data throughout the organization for more
efficient service delivery.
Complete infrastructure improvements needed for AMI network – base
stations and towers
100% completion by 3rd
quarter
4 DPU Customer Service
Leverage technology and data throughout the organization for more
efficient service delivery.
Complete installation of new large meters
100% completion by 4th
quarter
4 DPU Customer Service
Respond to growing service demands through collaboration, innovation, and
outcome management.
Work with Affordability Study consultant to further enhance DPU’s Customer
Assistance Program initiatives to improve water affordability and improve
delinquency rates.
5% decrease in monthly delinquency rate
4 Economic Development
Customer Service
Respond to growing service demand through collaboration, innovation, and
outcome management.
Invest in promotional and educational materials for City and department
resources and processes.
December-21
4 Economic Development
Customer Service
Respond to growing service demand through collaboration, innovation, and
outcome management.
Utilize pre-development meetings to bring relevant departments and
agencies together with developers, business owners and contractors to
prevent delays and miscommunication and manage expectations.
10 of total projects assisted with predevelopment meetings
204
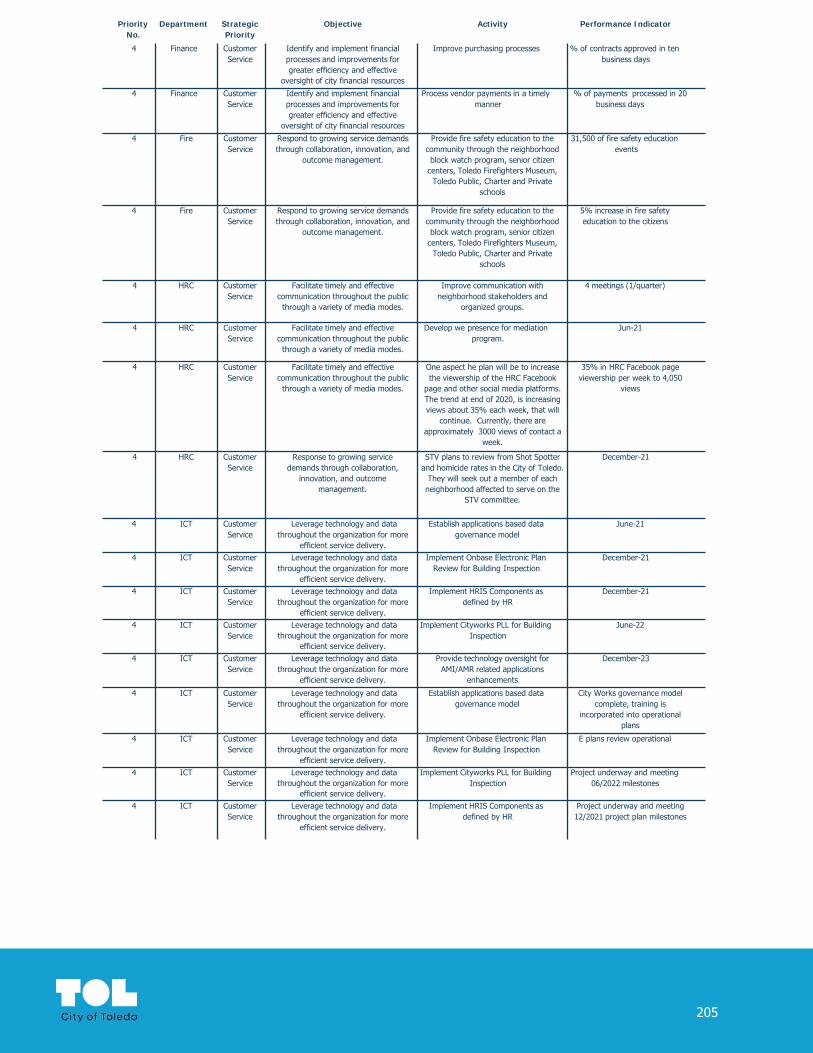
Priority No.
Department Strategic Priority
Objective Activity Performance Indicator
4 Finance Customer Service
Identify and implement financial processes and improvements for greater efficiency and effective
oversight of city financial resources
Improve purchasing processes % of contracts approved in ten business days
4 Finance Customer Service
Identify and implement financial processes and improvements for greater efficiency and effective
oversight of city financial resources
Process vendor payments in a timely manner
% of payments processed in 20business days
4 Fire Customer Service
Respond to growing service demands through collaboration, innovation, and
outcome management.
Provide fire safety education to the community through the neighborhood block watch program, senior citizen
centers, Toledo Firefighters Museum, Toledo Public, Charter and Private
schools
31,500 of fire safety education events
4 Fire Customer Service
Respond to growing service demands through collaboration, innovation, and
outcome management.
Provide fire safety education to the community through the neighborhood block watch program, senior citizen
centers, Toledo Firefighters Museum, Toledo Public, Charter and Private
schools
5% increase in fire safety education to the citizens
4 HRC Customer Service
Facilitate timely and effective communication throughout the public through a variety of media modes.
Improve communication with neighborhood stakeholders and
organized groups.
4 meetings (1/quarter)
4 HRC Customer Service
Facilitate timely and effective communication throughout the public through a variety of media modes.
Develop we presence for mediation program.
Jun-21
4 HRC Customer Service
Facilitate timely and effective communication throughout the public through a variety of media modes.
One aspect he plan will be to increase the viewership of the HRC Facebook
page and other social media platforms.The trend at end of 2020, is increasingviews about 35% each week, that will
continue. Currently, there are approximately 3000 views of contact a
week.
35% in HRC Facebook page viewership per week to 4,050
views
4 HRC Customer Service
Response to growing service demands through collaboration,
innovation, and outcome management.
STV plans to review from Shot Spotterand homicide rates in the City of Toledo.
They will seek out a member of each neighborhood affected to serve on the
STV committee.
December-21
4 ICT Customer Service
Leverage technology and data throughout the organization for more
efficient service delivery.
Establish applications based data governance model
June-21
4 ICT Customer Service
Leverage technology and data throughout the organization for more
efficient service delivery.
Implement Onbase Electronic Plan Review for Building Inspection
December-21
4 ICT Customer Service
Leverage technology and data throughout the organization for more
efficient service delivery.
Implement HRIS Components as defined by HR
December-21
4 ICT Customer Service
Leverage technology and data throughout the organization for more
efficient service delivery.
Implement Cityworks PLL for Building Inspection
June-22
4 ICT Customer Service
Leverage technology and data throughout the organization for more
efficient service delivery.
Provide technology oversight for AMI/AMR related applications
enhancements
December-23
4 ICT Customer Service
Leverage technology and data throughout the organization for more
efficient service delivery.
Establish applications based data governance model
City Works governance model complete, training is
incorporated into operational plans
4 ICT Customer Service
Leverage technology and data throughout the organization for more
efficient service delivery.
Implement Onbase Electronic Plan Review for Building Inspection
E plans review operational
4 ICT Customer Service
Leverage technology and data throughout the organization for more
efficient service delivery.
Implement Cityworks PLL for Building Inspection
Project underway and meeting 06/2022 milestones
4 ICT Customer Service
Leverage technology and data throughout the organization for more
efficient service delivery.
Implement HRIS Components as defined by HR
Project underway and meeting 12/2021 project plan milestones
205

City of Toledo Performance PlanWorkplace Culture
Priority No.
Department Strategic Priority
Objective Activity Performance Indicator
5 ICT Workplace Culture
Attract, develop, motivate, and retain a diverse, high quality, engaged, and
productive workforce.
Improve staff performance by working with HR to establish job descriptions for all employees.
December-21
5 ICT Workplace Culture
Attract, develop, motivate, and retain a diverse, high quality, engaged, and
productive workforce.
Improve staff performance by working with HR to establish job descriptions for all employees.
3/5 customer satisfaction rating on closed tickets
5 ICT Workplace Culture
Attract, develop, motivate, and retain a diverse, high quality, engaged, and
productive workforce.
Improve staff performance by working with HR to establish job descriptions for all employees.
50% tickets closed in priority level time frame
5 D&I Workplace Culture
Attract, develop, motivate, and retain a diverse, high quality, engaged, and
productive workforce.
Hire DEI consultant to develop the city’s DEI strategy and anti-
discrimination and implicit bias training curriculum.
January-21
5 D&I Workplace Culture
Attract, develop, motivate, and retain a diverse, high quality, engaged, and
productive workforce.
Centralize ADA accommodation request process and inventory
equipment.
January-21
5 D&I Workplace Culture
Attract, develop, motivate, and retain a diverse, high quality, engaged, and
productive workforce.
Develop certification curriculum for HR interview panel DEI representative
June-21
5 D&I Workplace Culture
Attract, develop, motivate, and retain a diverse, high quality, engaged, and
productive workforce.
Develop HR interview questions June-21
5 D&I Workplace Culture
Attract, develop, motivate, and retain a diverse, high quality, engaged, and
productive workforce.
Develop intervention strategy to ensure equitable discipline
June-21
5 D&I Workplace Culture
Use data to evaluate service delivery based on clearly defined expectations
and focused on service excellence.
Develop placement goals (recruitment,promotion), and succession planningstrategy based on affirmative action
study.
June-21
5 D&I Workplace Culture
Attract, develop, motivate, and retain a diverse, high quality, engaged, and
productive workforce.
Relocate to central location of equipment
December-21
5 D&I Workplace Culture
Attract, develop, motivate, and retain a diverse, high quality, engaged, and
productive workforce.
Investigate and resolve reasonable accommodation grievances
30 days to investigate/30 days to process reasonable
accommodation
5 D&I Workplace Culture
Attract, develop, motivate, and retain a diverse, high quality, engaged, and
productive workforce.
Develop certification process Certify one officer from each department
5 DPS Workplace Culture
Attract, develop, motivate, and retain a diverse, high quality, engaged, and
productive workforce.
Hire consultant to evaluate data associated with D&I complaints and grievances filed and create training
and development plan.
January-21
5 DPS Workplace Culture
Attract, develop, motivate, and retain a diverse, high quality, engaged, and
productive workforce.
Develop and implement classroom andfield training programs for employees to
be able to grow within the division (includes leadership and safety)
100% training to all field employees
5 DPS Workplace Culture
Attract, develop, motivate, and retain a diverse, high quality, engaged, and
productive workforce.
Develop and implement classroom andfield training programs for employees to
be able to grow within the division (includes leadership and safety)
100% training to all seasonal employees
5 DPS Workplace Culture
Attract, develop, motivate, and retain a diverse, high quality, engaged, and
productive workforce.
Develop and implement classroom andfield training programs for employees to
be able to grow within the division (includes leadership and safety)
300 or 386 DPS employees trained
5 DPS Workplace Culture
Attract, develop, motivate, and retain a diverse, high quality, engaged, and
productive workforce.
Reduce backlog of jobs in the Division ofSewers and Water Distribution
5% reduction in job backlog
5 DPS Workplace Culture
Attract, develop, motivate, and retain a diverse, high quality, engaged, and
productive workforce.
Develop and implement classroom andfield training programs for employees to
be able to grow within the division (includes leadership and safety)
75% of all employees trained
206

Priority No.
Department Strategic Priority
Objective Activity Performance Indicator
5 DPU Workplace Culture
Attract, develop, motivate, and retain a diverse, high quality, engaged, and
productive workforce.
Develop department succession plan to identify leadership opportunities andnew career pathways for employees.
100% completion by 4th
quarter
5 DPU Workplace Culture
Attract, develop, motivate, and retain a diverse, high quality, engaged, and
productive workforce.
Hire consultant to evaluate data associated with D&I complaints and grievances filed and create training
and development plan.
Decrease D&I complaints by 10%
5 Economic Development
Workplace Culture
Attract, develop, motivate, and retain a diverse, high quality, engaged, and
productive workforce.
Invest in economic development certification, training and professional
development for department staff.
20 hours of continuing education/professional
development hours completed bystaff
5 Finance Workplace Culture
Attract, develop, motivate, and retain a diverse, high quality, engaged, and
productive workforce.
Develop career ladder plans for team December-21
5 Fire Workplace Culture
Attract, develop, motivate, and retain a diverse, high quality, engaged, and
productive workforce.
Include implicit bias and anti-discrimination curriculum in cadet
training curriculum
December-21
5 Fire Workplace Culture
Attract, develop, motivate, and retain a diverse, high quality, engaged, and
productive workforce.
Develop a department culture that embraces values, versus rules and
policies to achieve overall excellence.
100% of firefighters participate in implicit bias and anti-
discrimination training by December 2021
5 Fire Workplace Culture
Attract, develop, motivate, and retain a diverse, high quality, engaged, and
productive workforce.
Recruit a diverse and capable workforce that reflects the city it
serves.
25% of women cadets
5 Fire Workplace Culture
Attract, develop, motivate, and retain a diverse, high quality, engaged, and
productive workforce.
Recruit a diverse and capable workforce that reflects the city it
serves.
27% of African American cadets
5 Fire Workplace Culture
Attract, develop, motivate, and retain a diverse, high quality, engaged, and
productive workforce.
Recruit a diverse and capable workforce that reflects the city it
serves.
7% of Hispanic cadets
5 Fire Workplace Culture
Attract, develop, motivate, and retain a diverse, high quality, engaged, and
productive workforce.
Reduce Total Number of Sick Hours by10% (35,000 to 31,500)
Reduce Overtime Hours by 10% (50,000 to 45,000)
5 Fire Workplace Culture
Attract, develop, motivate, and retain a diverse, high quality, engaged, and
productive workforce.
Reduce Total Number of Sick Hours by10% (35,000 to 31,500)
Reduce Total Number of Sick Hours by 10% (35,000 to
31,500)
5 Human Resources
Workplace Culture
Attract, develop, motivate, and retain a diverse high quality, engaged and
product workforce.
Healthcare Plan assessment June-21
5 Human Resources
Workplace Culture
Attract, develop, motivate, and retain a diverse high quality, engaged and
product workforce.
Implementation of updated recruitment process
80% of positions filled within 90days
5 Human Resources
Workplace Culture
Attract, develop, motivate, and retain a diverse high quality, engaged and
product workforce.
Updated onboarding/off-boarding process
80% of positions filled within 90days
5 Human Resources
Workplace Culture
Attract, develop, motivate, and retain a diverse high quality, engaged and
product workforce.
Updated onboarding/off-boarding process
80% percentage of employees that would recommend COT to
others5 Human
ResourcesWorkplace
CultureAttract, develop, motivate, and retain a
diverse high quality, engaged and product workforce.
Employee recognition and engagement program
80% percentage of employees that would recommend COT to
others to5 Human
ResourcesWorkplace
CultureAttract, develop, motivate, and retain a
diverse high quality, engaged and product workforce.
Implementation of updated recruitment process
Number of job offers declined
5 Human Resources
Workplace Culture
Attract, develop, motivate, and retain a diverse high quality, engaged and
product workforce.
City-wide succession plan Number of job offers declined and reason for decline
5 Human Resources
Workplace Culture
Attract, develop, motivate, and retain a diverse high quality, engaged and
product workforce.
Administrative police review, revision, creation
Number of policies reviewed
5 Human Resources
Workplace Culture
Attract, develop, motivate, and retain a diverse high quality, engaged and
product workforce.
City-wide succession plan Percentage of positions vacant less than 60 days
5 Human Resources
Workplace Culture
Attract, develop, motivate, and retain a diverse high quality, engaged and
product workforce.
HRIS implementation TBD – 12/31/2023 (contingent upon RFP process and timeline
for selected vendor)
5 Human Resources
Workplace Culture
Attract, develop, motivate, and retain a diverse high quality, engaged and
product workforce.
Training and development plan and implementation
Training and Development plan by6/30/2021 (Contingent upon
resources)
5 Police Workplace Culture
Attract, develop, motivate, and retain a diverse, high quality, engaged, and
productive workforce.
Increase diversity in the department and leadership
10% of women (leadership/officers/recruits)
207

Priority No.
Department Strategic Priority
Objective Activity Performance Indicator
5 Police Workplace Culture
Attract, develop, motivate, and retain a diverse, high quality, engaged, and
productive workforce.
Purchase tool to support physical and mental wellness
15% reduction in workplace injuries
5 Police Workplace Culture
Attract, develop, motivate, and retain a diverse, high quality, engaged, and
productive workforce.
Increase diversity in the department and leadership
5% AA(leadership/officers/recruits)
5 Police Workplace Culture
Attract, develop, motivate, and retain a diverse, high quality, engaged, and
productive workforce.
Increase diversity in the department and leadership
5% Hispanics/Latino (leadership/officers/recruits)
5 Police Workplace Culture
Attract, develop, motivate, and retain a diverse, high quality, engaged, and
productive workforce.
Purchase tool to support physical and mental wellness
5% reduction in sick hours
5 Police Workplace Culture
Attract, develop, motivate, and retain a diverse, high quality, engaged, and
productive workforce.
Purchase tool to support physical and mental wellness
50% of officers participating
208
Capital Improvement Plan – Project Detail
209
Capital Improvements PlanThe 2021 Proposed Capital Improvement Plan (CIP) is funded from income taxes allocated to the Capital Improvement Fund, grant and loan proceeds and an estimated fund balance carryover from 2020. Certain road and bridge projects receive match funding through federal andstate programs.
The goals of the Capital Improvement Plan are to provide funding for projects related to thepreservation of assets and infrastructure and to maximize matching funds. The CIP plan includes:
Sources of Funds
Income Taxes: Total amount of Income taxes allocated to CIP based on estimated annual collections
Transfers In: Transfers from other sources to cover associated debt service
Interest: Estimated interest earnings on investments
Proceeds from Financing: Anticipated new financing to finance capital projects.
Grand and Loan Proceeds: Federal and State funding awarded for major street paving and bridge construction.
Uses of Funds
Debt Service: General, loan and note obligations and associated debt service charges
Lease Payments: Current obligations for vehicles and other equipment
Project Support: Operating budget fixed personnel and non-labor costs
1% for the Arts: Municipal Code required contribution to The Toledo Arts Commission
Transfers Out: Budgeted transfer to General Fund
New projects: Capital projects approved for funding over the five-year capital plan, including bridge and major street paving, sidewalks, and residential street paving and repair
210
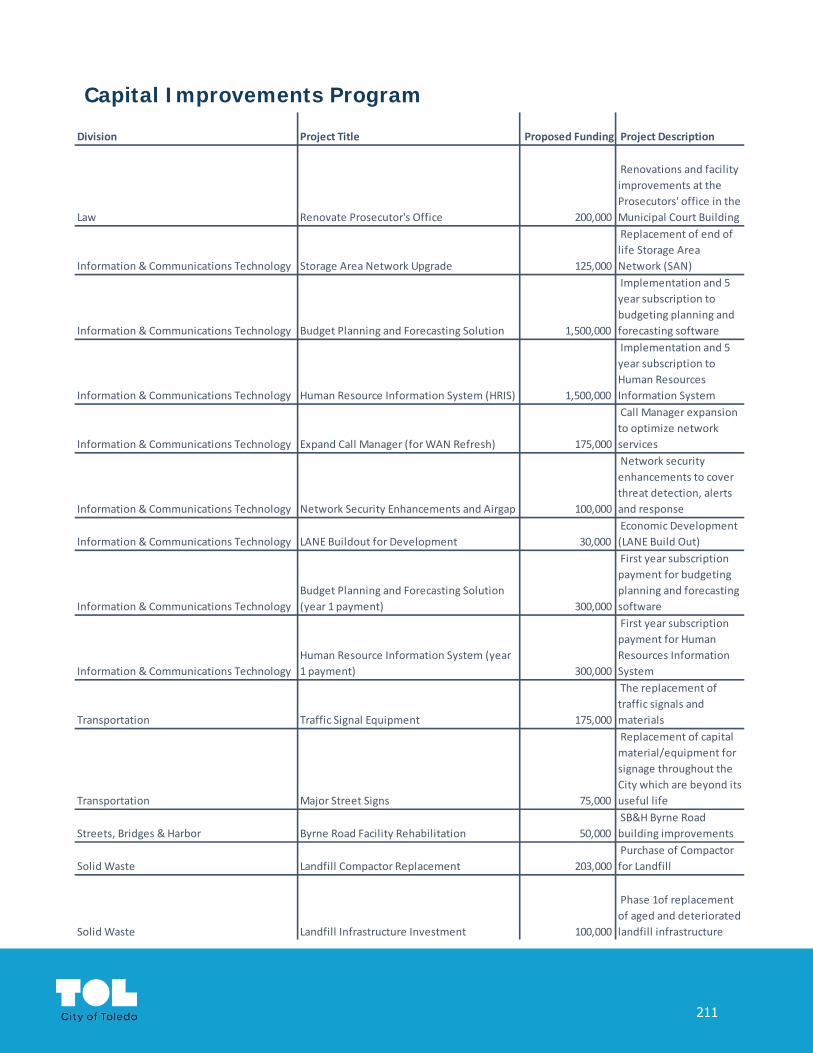
Capital Improvements Program
Division Project Title Proposed Funding Project Description
Law Renovate Prosecutor's Office 200,000
Renovations and facility improvements at the Prosecutors' office in the Municipal Court Building
Information & Communications Technology Storage Area Network Upgrade 125,000
Replacement of end of life Storage Area Network (SAN)
Information & Communications Technology Budget Planning and Forecasting Solution 1,500,000
Implementation and 5 year subscription to budgeting planning and forecasting software
Information & Communications Technology Human Resource Information System (HRIS) 1,500,000
Implementation and 5 year subscription to Human Resources Information System
Information & Communications Technology Expand Call Manager (for WAN Refresh) 175,000
Call Manager expansion to optimize network services
Information & Communications Technology Network Security Enhancements and Airgap 100,000
Network security enhancements to cover threat detection, alerts and response
Information & Communications Technology LANE Buildout for Development 30,000 Economic Development (LANE Build Out)
Information & Communications TechnologyBudget Planning and Forecasting Solution (year 1 payment) 300,000
First year subscription payment for budgeting planning and forecasting software
Information & Communications TechnologyHuman Resource Information System (year 1 payment) 300,000
First year subscription payment for Human Resources Information System
Transportation Traffic Signal Equipment 175,000
The replacement of traffic signals and materials
Transportation Major Street Signs 75,000
Replacement of capital material/equipment for signage throughout the City which are beyond its useful life
Streets, Bridges & Harbor Byrne Road Facility Rehabilitation 50,000 SB&H Byrne Road building improvements
Solid Waste Landfill Compactor Replacement 203,000 Purchase of Compactor for Landfill
Solid Waste Landfill Infrastructure Investment 100,000
Phase 1of replacement of aged and deteriorated landfill infrastructure
211
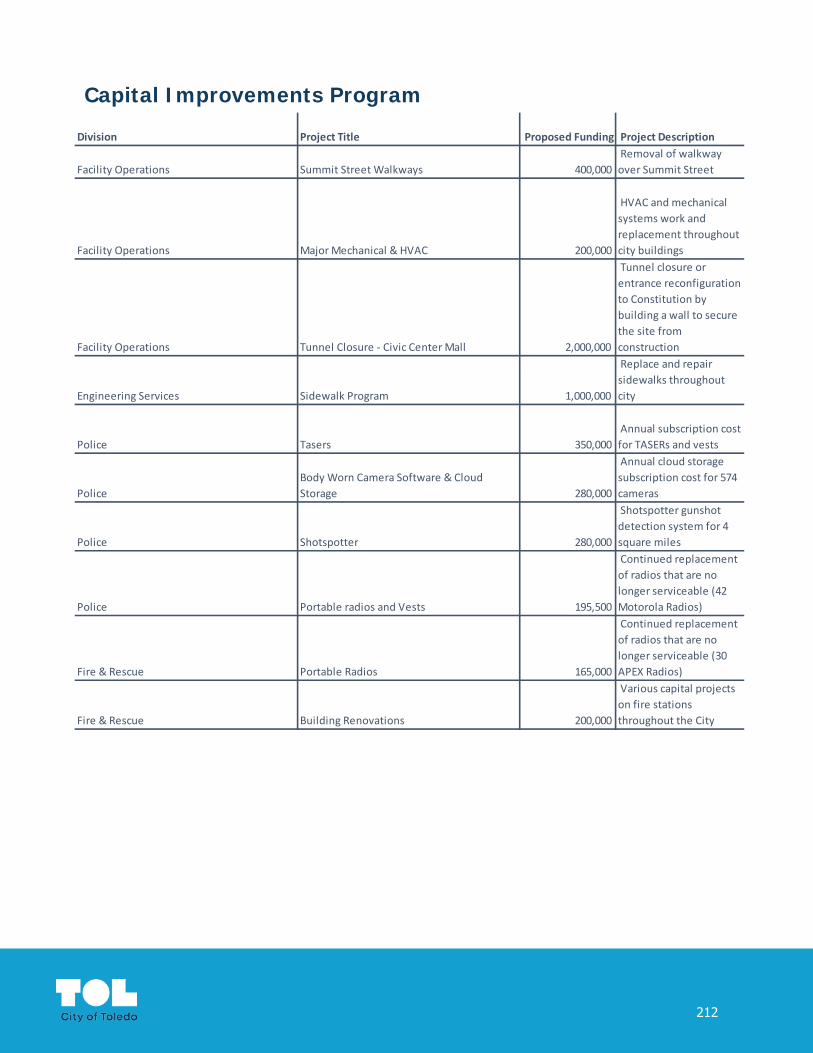
Capital Improvements Program
Division Project Title Proposed Funding Project Description
Facility Operations Summit Street Walkways 400,000 Removal of walkway over Summit Street
Facility Operations Major Mechanical & HVAC 200,000
HVAC and mechanical systems work and replacement throughout city buildings
Facility Operations Tunnel Closure - Civic Center Mall 2,000,000
Tunnel closure or entrance reconfiguration to Constitution by building a wall to secure the site from construction
Engineering Services Sidewalk Program 1,000,000
Replace and repair sidewalks throughout city
Police Tasers 350,000 Annual subscription cost for TASERs and vests
PoliceBody Worn Camera Software & Cloud Storage 280,000
Annual cloud storage subscription cost for 574 cameras
Police Shotspotter 280,000
Shotspotter gunshot detection system for 4 square miles
Police Portable radios and Vests 195,500
Continued replacement of radios that are no longer serviceable (42 Motorola Radios)
Fire & Rescue Portable Radios 165,000
Continued replacement of radios that are no longer serviceable (30 APEX Radios)
Fire & Rescue Building Renovations 200,000
Various capital projects on fire stations throughout the City
212

Capital Improvements Program
Division Project Title Proposed Funding Project Description
Recreation Playground Replacement 300,000
Replacement and improvements to playground equipment in various city parks
Recreation Tennis Court Resurfacing 100,000
Improvements to tennis courts in various city parks
Parks & Forestry Revitalization of Park Infrastructure 477,500
Infrastructure improvements to support the parks
Parks & Forestry Harvard Overlook Improvements 150,000
Infrastructure Improvements at Harvard Overlook
Parks & Forestry Mower with Mulching Head 160,000 Forestry Mower w/ mulching head
Total 11,091,000
213

Labor Contract Summaries
214

The City had 2,680 full-time and part-time employees as of September 15, 2020. That number ofemployees has increased by approximately 67 since 2014. The City also utilizes seasonal workersand temporary workers for specific projects from time to time on a contract basis. The State’s publicemployee collective bargaining law applies generally to public employee relations and collectivebargaining of the City and other political subdivisions statewide.
The vast majority of City employees hold position classifications that are in collective bargainingunits. The full-time employees in those classifications are represented by the following bargainingunits:
Bargaining UnitApproximate Number of Employees
Labor Agreement Expiration
Ohio Council 8 of the American Federation of State, County and Municipal Employees (AFSCME), Local 7
750 June 30, 2020(a)(b)
Ohio Council 8 of AFSCME, Local 7, Communications Operators
72 June 30, 2020(a)(b)
Toledo Police Patrolman’s Association 481 December 31, 2020(c)
International Association of Fire Fighters, Local 92 502 December 31, 2020(c)
International Brotherhood of Teamsters, Local 20 83 December 31, 2021
Ohio Council 8 of AFSCME, Local 2058, Supervisors 224 May 31, 2021
Ohio Council 8 of AFSCME, Local 2058, Communication Supervisors
6 May 31, 2021
Toledo Police Command Officers’ Association 132 December 31, 2020(c)
United Auto Workers, Local 12 (Clerk of Courts – Supervision)
8 December 31, 2022
Ohio Council 8 of AFSCME, Local 3411 (Clerk of Court – Deputy Clerks)
64 December 31, 2021
Toledo Fire Chiefs’ Association 23 December 31, 2020(c)
(a) Due to disruptions caused by COVID-19, the City and these bargaining units entered into extensions of their laboragreements through August 31, 2020. Negotiations for new one year agreements have commenced and are ongoing.(b) Employees are continuing to work under the terms of the prior agreement.(c) Negotiations for new one year agreements have commenced and are ongoing.
215
The remaining City employees hold positions in the civil service classified exempt classification, have not formed a bargaining unit, or are not authorized to form or join a bargaining unit because they hold elective office or are confidential or management-level employees (exempt personnel).
Generally, wages and other economic benefits for City employees have been derived through negotiations with the bargaining units. In negotiating their most recent three-year contracts, the City and its bargaining units have successfully utilized a collaborative interest-based bargaining process.
In 2017, the City and the AFSCME Local 7 unit, currently representing approximately 750 City employees, entered into a new three-year collective bargaining agreement through June 30, 2020. Under the terms of that agreement, employees in AFSCME Local 7 received a 1% pay increase on January 1, 2018, a 1.5% pay increase on January 1, 2019, and a 2.5% pay increase on January 1, 2020. The agreement also provided substantially strengthened rights for City management to discipline employees and to create incentives for productive employees who meet attendance goals and other requirements.
In 2017, the City and the AFSCME Local 7 Communication Operators unit, currently representing approximately 72 City employees, entered into a new three-year collective bargaining agreement through June 30, 2020. Under that agreement, employees in that bargaining unit were and are not to receive any percentage pay increases. However, the agreement provided salary group upgrades to certain classifications of employees within the unit to make the salaries provided by the City for employees in those classifications competitive those offered others in similar positions in the Toledo MSA and in other locations in the State. The agreement also provided substantially strengthened City management’s control over the employees’ work schedules.
In 2018, the City entered into new three-year collective bargaining agreements through December 31, 2020, with the Toledo Police Patrolman’s Association (TPPA), currently representing approximately 489 City employees, the International Association of Fire Fighters, Local 92 (Local 92) currently representing approximately 507 City employees, and the Toledo Police Command Officers’ Association (TPCOA) currently representing approximately 132 City employees. Under the terms of those agreements, employees in the TPPA, Local 92 and the TPCOA received 1.5% pay increases in January 2018, 2.5% pay increases in January 2019, and 3% pay increases in January 2020. The agreement with the TPPA provided City management with discretion and flexibility in the process used in filling vacancies, and the agreement with Local 92 provided for the civilianization of positions in the Fire Communications Bureau. Under the terms of the agreement with the TPCOA, the salary spread between command officers and patrolmen was eliminated.
In 2018, the City also entered into a new three-year collective bargaining agreement through December 31, 2020 with the Toledo Fire Chiefs’ Association (TFCA) currently representing approximately 23 City employees. Under the terms of that agreement, the City maintained the salary spread between various classifications of employees in the TFCA. In addition, the agreement established a five (5) year timeframe during which the City may recoup educational expenses from those employees who take advantage of that benefit, but choose to leave the City upon completion of their studies.
216

In 2018, the City and AFSCME Local 2058 unit, currently representing approximately 231 City supervisory employees, entered into a new three-year collective bargaining agreement through May 31, 2021. Under the terms of that agreement, employees in Local 2058 received a 1.5% pay increase effective in January 2018, a 2.5% pay increase effective in January 2019, and a 3% pay increase effective in January 2020. The agreement also clarified the overtime process for on-call personnel and provided a more efficient progressive disciplinary process that serves to streamline the timeframes for City managers, administrators, and commissioners.
In 2018, the City and the AFSCME Local 2058 Communications Supervisors’ unit, currently representing six City employees entered into a new collective bargaining agreement for the period from June 1, 2018 through May 31, 2021. Under that agreement, employees in that bargaining unit were and are not to receive any percentage pay increases. However, the agreement provided salary group upgrades to certain classifications of employees within the unit to make the salaries provided by the City for employees in those classifications competitive those offered others in similar positions in the Toledo MSA and in other locations in the State. The agreement also provides for a more efficient progressive disciplinary process, which will streamline the timeframes for City administrators.
In January 2019, the City and the AFSCME Local 3411, currently representing 65 City employees, entered into a new three-year collective bargaining agreement through December 31, 2021.
Under the terms of that agreement, employees in AFSCME Local 3411 received a 1.5% pay increase in January 2019, a 2.5% pay increase in January 2020, and are to receive a 3% pay increase in January 2021. Additionally, the pay rate for new employees in this unit was increased to maintain compliance with the City’s living wage ordinance. Other provisions included an extension to the employees’ lunch period and increase in the co-payment for which they are responsible for emergency room visits.
In the judgment of the City, its labor and employee relations are generally good and productive. The City has not gone to fact-finding with any bargaining unit since 2015 and no bargaining unit has filed an unfair labor practice against the City in several years.
217

Pension Description
218

Present and retired employees of the City are covered under two statewide public employee retirement (including disability retirement) systems. The Ohio Police and Fire Pension Fund (OP&F) covers uniformed members of the police and fire departments. All other eligible City employees are covered by the Ohio Public Employees Retirement System (OPERS).
OPERS and OP&F are two of five statewide public employee retirement systems created by and operating pursuant to Ohio law, all of which currently have unfunded actuarial accrued liabilities. The General Assembly has the power to amend the format of those systems and to revise rates and methods of contributions to be made by public employers and their employees and eligibility criteria, benefits or benefit levels for employee members. In 2012, the General Assembly passed five separate pension reform measures intended to assist each of the five retirement systems in addressing its unfunded actuarial accrued liabilities. The reform legislation passed with respect to OPERS and OP&F provided for (i) no change in the City contribution rates with respect to its employees’ earnable salaries, (ii) no change in OPERS employee contribution rate, and (iii) an increase in the OP&F employee contribution rate from 10% to 12.25% in annual increments of 0.75% that began on July 2, 2013. With certain transition provisions applicable to certain current employees, the reform legislation has, among other changes, increased minimum age and service requirements for retirement and disability benefits, revised the calculation of an employee’s final average salary on which pension benefits are based to include the five highest years (rather than the three highest years), provided for OPERS pension benefits to be calculated on a lower, fixed formula, changed provisions with respect to future cost-of-living adjustments to limit those adjustments to the lesser of any increase in the Consumer Price Index or three percent. The OP&F reform legislation also authorizes the OP&F board to further adjust member contribution rates or further adjust age and service requirements after November 1, 2017, if, after an actuarial investigation, the board determines that an adjustment is appropriate.
Plan Description – Ohio Public Employees Retirement System (OPERS)
City employees, other than full-time police and firefighters, participate in the Ohio Public Employees Retirement System (OPERS). OPERS administers three separate pension plans. The Traditional Pension Plan is a cost-sharing, multiple-employer defined benefit pension plan. The Member-Directed Plan is a defined contribution plan and the Combined Plan is a cost-sharing, multiple-employer defined benefit pension plan with defined contribution features. While members (e.g., City employees) may elect the Member-Directed Plan and the Combined Plan, substantially all employee members are in OPERS’ Traditional Pension Plan.
Plan Description – Ohio Police & Fire Pension Fund (OP&F)
City full-time police and firefighters participate in Ohio Police and Fire Pension Fund (OP&F), a cost-sharing, multiple-employer defined benefit pension plan administered by OP&F. OP&F provides retirement and disability pension benefits, annual cost-of-living adjustments, and death benefits to plan members and beneficiaries. Benefit provisions are established by the Ohio State Legislature and are codified in Chapter 742 of the Ohio Revised Code. OP&F issues a publicly available financial report that includes financial information and required supplementary information and detailed information about OP&F fiduciary net position.
219

Position Comparison – FTEs by Department and Division
220

City Council and Auditor 2019 Budget 2020 Approved 2020 Amended 2021 Proposed10100-City Council 22.10 22.00 22.00 25.50 10300-Auditor 1.00 1.00 1.00 1.00 Department Total 23.10 23.00 23.00 26.50
Office of the Mayor 2019 Budget 2020 Approved 2020 Amended 2021 Proposed10200-Office Of The Mayor 11.25 12.25 10.25 10.25 Department Total 11.25 12.25 10.25 10.25
Toledo Lucas County Plan Commission 2019 Budget 2020 Approved 2020 Amended 2021 Proposed10400-Plan Commission 11.00 14.00 11.00 12.67 Department Total 11.00 14.00 11.00 12.67
Human Relations Commission 2019 Budget 2020 Approved 2020 Amended 2021 Proposed10600-Human Relations Commission 1.00 1.00 1.00 2.00 Department Total 1.00 1.00 1.00 2.00
Diversity & Inclusion 2019 Budget 2020 Approved 2020 Amended 2021 Proposed10700-Diversity & Inclusion 5.75 7.00 5.17 9.00 Department Total 5.75 7.00 5.17 9.00
Toledo Municipal Court 2019 Budget 2020 Approved 2020 Amended 2021 Proposed10800-Municipal Court Judges 97.78 103.70 100.05 105.60 10900-Clerk of Municipal Court 80.00 80.00 77.67 79.00 Department Total 177.78 183.70 177.71 184.60
Law 2019 Budget 2020 Approved 2020 Amended 2021 Proposed12000-Law 33.00 34.00 31.00 31.26 Department Total 33.00 34.00 31.00 31.26
Finance 2019 Budget 2020 Approved 2020 Amended 2021 Proposed11100-Financial Analysis 4.00 4.00 3.58 3.00 14100-Finance Administration 1.75 2.00 2.00 2.00 14200-Treasury 5.00 5.00 5.00 6.76 14400-Taxation 34.00 33.75 32.50 31.75 14600-Accounts 11.50 13.50 11.00 11.00 14700-Finance ERP 1.50 2.00 1.00 1.00 14800-Debt Management 2.00 2.00 2.00 1.25 17700-Purchasing & Supplies 5.10 6.85 5.43 4.75 Department Total 64.84 69.10 62.51 61.51
Human Resources 2019 Budget 2020 Approved 2020 Amended 2021 Proposed17100-Human Resources 17.00 20.00 17.58 19.00 Department Total 17.00 20.00 17.58 19.00
Information & Communications Technology 2019 Budget 2020 Approved 2020 Amended 2021 Proposed17500-Information & Communications Technology 17.75 23.08 19.50 20.50 17600-Engage Toledo - 18.50 15.00 13.27 Department Total 17.75 41.59 34.50 33.77
221
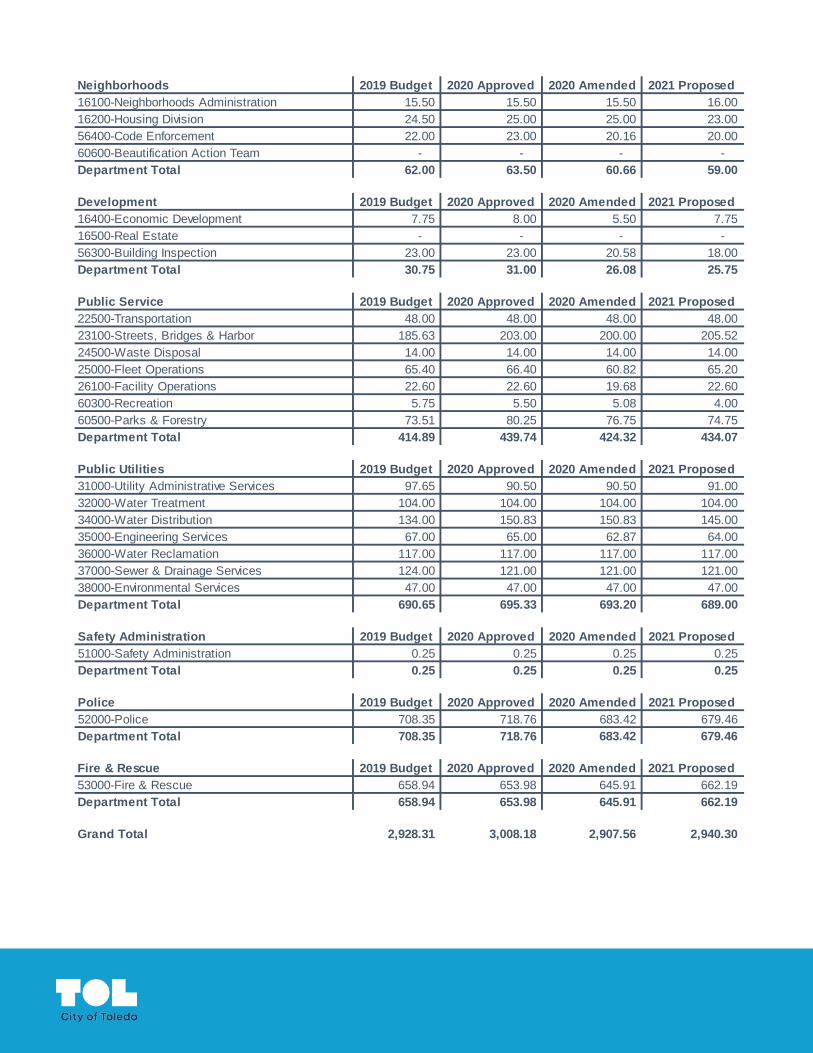
Neighborhoods 2019 Budget 2020 Approved 2020 Amended 2021 Proposed16100-Neighborhoods Administration 15.50 15.50 15.50 16.00 16200-Housing Division 24.50 25.00 25.00 23.00 56400-Code Enforcement 22.00 23.00 20.16 20.00 60600-Beautification Action Team - - - - Department Total 62.00 63.50 60.66 59.00
Development 2019 Budget 2020 Approved 2020 Amended 2021 Proposed16400-Economic Development 7.75 8.00 5.50 7.75 16500-Real Estate - - - - 56300-Building Inspection 23.00 23.00 20.58 18.00 Department Total 30.75 31.00 26.08 25.75
Public Service 2019 Budget 2020 Approved 2020 Amended 2021 Proposed22500-Transportation 48.00 48.00 48.00 48.00 23100-Streets, Bridges & Harbor 185.63 203.00 200.00 205.52 24500-Waste Disposal 14.00 14.00 14.00 14.00 25000-Fleet Operations 65.40 66.40 60.82 65.20 26100-Facility Operations 22.60 22.60 19.68 22.60 60300-Recreation 5.75 5.50 5.08 4.00 60500-Parks & Forestry 73.51 80.25 76.75 74.75 Department Total 414.89 439.74 424.32 434.07
Public Utilities 2019 Budget 2020 Approved 2020 Amended 2021 Proposed31000-Utility Administrative Services 97.65 90.50 90.50 91.00 32000-Water Treatment 104.00 104.00 104.00 104.00 34000-Water Distribution 134.00 150.83 150.83 145.00 35000-Engineering Services 67.00 65.00 62.87 64.00 36000-Water Reclamation 117.00 117.00 117.00 117.00 37000-Sewer & Drainage Services 124.00 121.00 121.00 121.00 38000-Environmental Services 47.00 47.00 47.00 47.00 Department Total 690.65 695.33 693.20 689.00
Safety Administration 2019 Budget 2020 Approved 2020 Amended 2021 Proposed51000-Safety Administration 0.25 0.25 0.25 0.25 Department Total 0.25 0.25 0.25 0.25
Police 2019 Budget 2020 Approved 2020 Amended 2021 Proposed52000-Police 708.35 718.76 683.42 679.46 Department Total 708.35 718.76 683.42 679.46
Fire & Rescue 2019 Budget 2020 Approved 2020 Amended 2021 Proposed53000-Fire & Rescue 658.94 653.98 645.91 662.19 Department Total 658.94 653.98 645.91 662.19
Grand Total 2,928.31 3,008.18 2,907.56 2,940.30

toledo.oh.gov
Thank you.