proposed 2022 operating budget, two-year financial plan
TRANSCRIPT
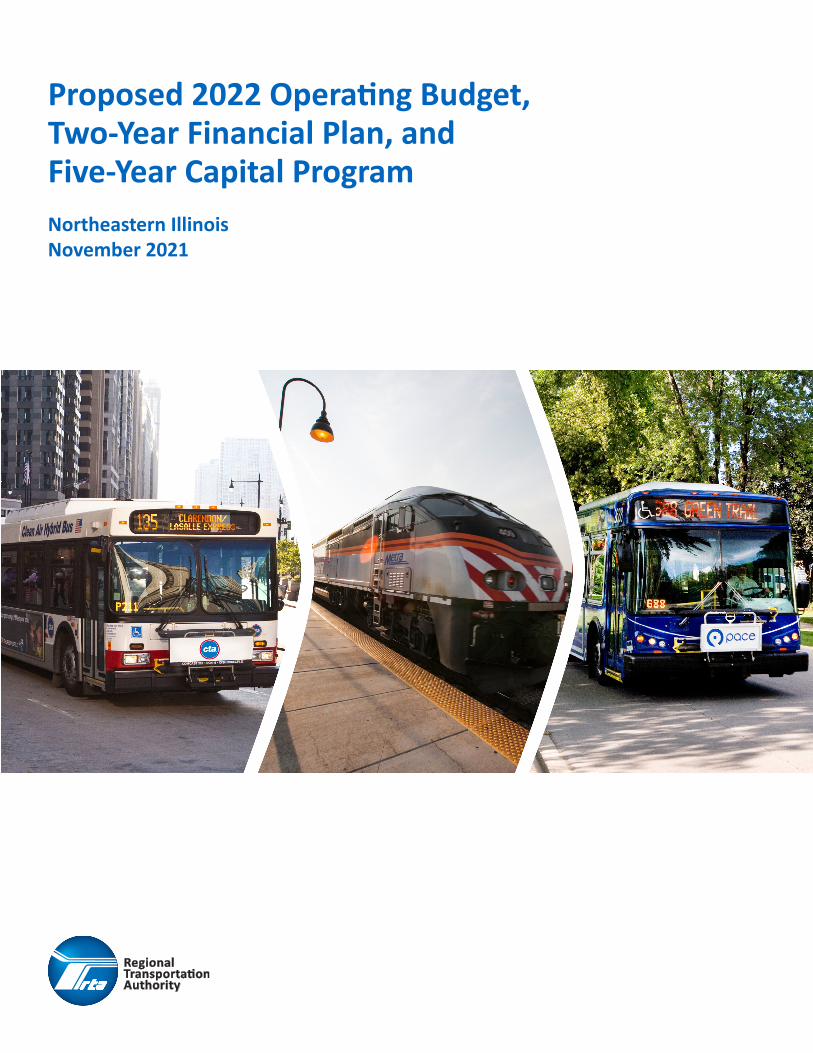
Northeastern IllinoisNovember 2021
Proposed 2022 Operating Budget, Two-Year Financial Plan, and Five-Year Capital Program

Kirk DillardChairman
David R. AndalcioDirector – DuPage County
Mary Beth CantyDirector – Suburban Cook County
Pat CareyDirector – Lake County
William R. CoulsonDirector – Suburban Cook County
Phil FuentesDirector – City of Chicago
Jamie GathingDirector – Suburban Cook County
Christopher J. GrovenDirector – Kane County
Elizabeth D. GormanDirector – Suburban Cook County
Alexandra HoltDirector – City of Chicago
Thomas J. KotelDirector – City of Chicago
Michael W. LewisDirector – Suburban Cook County
Christopher C. Melvin, Jr.Director – City of Chicago
Sarah PangDirector – City of Chicago
J.D. RossDirector – Will County
Brian SagerDirector – McHenry County
Leanne P. ReddenExecutive Director
Leanne P. ReddenExecutive Director
This document contains the proposed 2022 regional and Service Board operating budgets and capital programs, to be considered for adoption by the RTA Board on December 16, 2021.
Board of Directors

Proposed 2022 Operating Budget, Page 1 of 99 Two-Year Financial Plan, and Five-Year Capital Plan
Contents Regional transit begins 2022 poised for recovery, anticipating long-term challenges .............. 2
Federal relief sustains transit through the pandemic .................................................................... 3
Transit’s value beyond ridership ..................................................................................................... 4
2022 will be a year of action, while planning for the future of transit ..................................... 4
Forward, for all ................................................................................................................................ 5
A transit system ready to act and innovate .................................................................................... 6
Regional Operations .............................................................................................................. 8
Regional Operating Budget ............................................................................................................. 8
CTA Operating Budget .................................................................................................................. 17
Metra Operating Budget ............................................................................................................... 23
Pace Operating Budget ................................................................................................................. 29
Pace ADA Paratransit Operating Budget ...................................................................................... 36
RTA Agency Operating Budget ...................................................................................................... 42
Regional Capital Program .................................................................................................... 45
Related Legislation ........................................................................................................................ 46
Progress Toward Transparency and Performance-Based Programming in Capital Investment .. 48
Goals and Requirements for the Five-Year Regional Capital Program ......................................... 49
2022-2026 Regional Capital Program and 2022 Regional Capital Program ................................. 51
Long-Term Funding Need ............................................................................................................. 56
CTA Capital Program ..................................................................................................................... 57
Metra Capital Program ................................................................................................................. 73
Pace Suburban Service Capital Program ....................................................................................... 92
RTA Capital Program ..................................................................................................................... 99

Proposed 2022 Operating Budget, Page 2 of 99 Two-Year Financial Plan, and Five-Year Capital Plan
Regional transit begins 2022 poised for recovery, anticipating long-term challenges The Regional Transportation Authority (RTA) has a responsibility to fund, plan with, and advocate for CTA, Metra, and Pace— known as the “Service Boards” — and to be candid with them and the public about financial challenges. Annually, all four transit agencies collaborate to develop the Operating Budget, Two-Year Financial Plan, and Five-Year Capital Program. Preparation of these crucial materials has now taken place in two consecutive years of disruption and uncertainty caused by the COVID-19 pandemic. In 2021, the regional transit system of northeastern Illinois, like many across the country, continued to experience lower-than-normal ridership. Meanwhile, the transit agencies have continued to foster a culture of COVID prevention, and our region’s trains and buses have never been cleaner and safer to ride. CTA, Metra, and Pace have continued providing safe, reliable trips to meet dramatically shifting customer needs and demand for travel. Their employees have performed heroically, by transporting workers to essential jobs each day since the pandemic began. However, the decrease in riders has had a considerable impact on revenue generated from fares. Meanwhile, monthly revenue generated from the RTA sales tax has exceeded budgeted expectations and reached record levels. This unique situation has created an asymmetry in the regional funding model that aims to balance revenue from fares with revenue from public funding to cover operating expenses, measured by the recovery ratio. In late 2021, the RTA acted swiftly to seek temporary recovery ratio relief from the Illinois legislature because of the ongoing pandemic. The RTA led the region’s transit system through this difficult time by allocating funds from three
major federal relief packages to allow transit operations to continue in 2020 and 2021,
analyzing data, communicating transparently about the state of the crisis, and taking action to
address the immediate needs of the Service Boards. These actions have put the region’s transit
system in a more stable position than one year ago, but many challenges remain.
This document describes a 2022 budget that includes $3.405 billion in operating expenses for northeastern Illinois’ transit system, an increase of 4.6% over the financial plan for 2022 adopted pre-COVID. It also details the 2022-2026 Regional Capital Program of $5.261 billion, which is 17.1% less than the 2021-2025 Capital Program. The decrease is because Rebuild Illinois bond funds – more than $2 billion -- were programmed and granted to the Service Boards in 2020 and 2021, though projects will continue to be delivered over the next five years. As the Rebuild Illinois bond funding is drawn down, the RTA will need to explore other reliable capital funds to maintain the region’s transit system.

Proposed 2022 Operating Budget, Page 3 of 99 Two-Year Financial Plan, and Five-Year Capital Plan
As we begin 2022, we recognize this is a time of urgency and uncertainty. We know transit is essential to our region’s success, but the timeline of recovery is outside our control. To help answer the many questions about the future of transit in northeastern Illinois, the RTA has begun development of the next regional transit strategic plan, the successor to Invest in Transit. The bulk of the planning and engagement will occur in 2022, after which the efforts of many will be required to implement it.
Federal relief sustains transit through the pandemic The Proposed 2022 Operating Budget, Two-Year Financial Plan, and Five-Year Capital Program fund reliable regional transit through 2022 as detailed in the following sections of this document. In large part, that has been made possible by three federal relief packages providing unprecedented support to public transit operations during the pandemic. Over the past two years, the RTA has allocated $3.37 billion in federal relief to the Service Boards to make up for lost public funding and operating revenues resulting from the COVID-19 pandemic. This total includes $1.4 billion from the Coronavirus Aid, Relief, and Economic Security Act (CARES Act), $486 million from the Coronavirus Response and Relief Supplemental Appropriations Act (CRRSAA), and $1.5 billion from the American Rescue Plan (ARP). The allocations to the Service Boards are highlighted in Table 1. Additional allocations included $28 million to RTA in CARES Act funding and $20 million to Pace ADA services in CRRSAA funding.
Table 1: Combined CARES Act, CRRSSAA, and ARP Funding to the Service Boards (in millions)
CTA Metra Pace Total
CARES Act $817.5
(58%)
$479.2
(34%)
$112.8
(8%) $1,409.5
CRRSAA $361.3
(77%)
$83.4
(18%)
$21.4
(5%) $466.2
ARP Act $912.1
(61%)
$513.6
(34%)
$71.3
(5%) $1,497.0
Total Combined Relief Allocations $2,090.9 $1,076.3 $205.5 $3,372.6
Share of All 3 Federal Relief Packages 62.0% 31.9% 6.1% 100%
With these relief allocations, the RTA estimates that operating budgets for CTA, Metra, and Pace will be stabilized through the third quarter of 2025, removing the region from the emergency funding mode it has experienced since the beginning of the pandemic. However, those dollars will not be able to sustain the regional transit network indefinitely. It is imperative that, using the regional transit strategic plan as a guide, the RTA and Service Boards chart a course toward reliable and sustainable transit funding.

Proposed 2022 Operating Budget, Page 4 of 99 Two-Year Financial Plan, and Five-Year Capital Plan
Transit’s value beyond ridership An RTA survey of riders in 2021 found that a majority of lapsed riders planned to return when the pandemic receded, but ridership gains have been stymied by rising COVID cases from emerging variants, vaccine hesitancy, and the resulting changes in office re-opening plans. System ridership realized only modest gains from 2020 to 2021 and is projected to end the year at nearly 40 percent of pre-pandemic levels. Transit ridership around the country, and in northeastern Illinois, had experienced several years of decline before 2020. Trends like remote work that began before the pandemic have become even more prevalent and are likely here to stay. It’s clear that the transit agencies will need to face a near-term reality of lower ridership and fare revenue while still operating a robust transit system for the region. We know that the value of transit extends far beyond the number of people riding buses and trains each day. Unfortunately, in recent months we have seen more residents choose to drive, which could have dangerous, expensive, and unhealthy outcomes for the region. Modeling data from the Chicago Metropolitan Agency for Planning (CMAP) shows that if one in four previous transit trips is replaced with a car trip, drivers throughout the region would spend an extra 193,000 hours on the road each weekday, costing more than $1.2 billion annual in productivity. The path to economic recovery is not through increasing congestion on our roads. The pandemic also provided a lesson about who relies on transit the most. The RTA rider survey found that those who continued to ride transit during the pandemic were most likely to be essential workers, African Americans, or residents with low incomes, reinforcing the role transit plays in providing access to opportunity for all. Understanding the needs of current riders and desires of lapsed riders is part of the long-term work of strategic planning for the transit system.
2022 will be a year of action, while planning for the future of transit The pandemic has proven that not only are changes to the status quo possible, they are necessary. The crisis has forced the RTA to act decisively and make difficult decisions with overall regional impact in mind. In October 2020, RTA outlined a Three-Step COVID Recovery Strategy. The first two steps focused on near-term decisions that were confronting the RTA Board: to pass a 2021 budget and sustain critical transit during the first waves of the pandemic. The third step of the recovery strategy, to “Engage in Strategic Recovery Planning,” is an opportunity for the RTA to set a longer-term vision with an update of the regional transit strategic plan that will have an outlook of 2023 and beyond. Priorities the RTA identified as important during recovery – funding,

Proposed 2022 Operating Budget, Page 5 of 99 Two-Year Financial Plan, and Five-Year Capital Plan
service, and transparency – will continue to lead our efforts during the strategic planning process.
Forward, for all The RTA believes public transit is the key to moving the region forward, for all. Northeastern Illinois must build on the power of transit to help achieve solutions to our region’s biggest challenges such as inequitable access to opportunity, climate change, and stalled economic growth. The RTA has a responsibility to keep the region’s public transit system viable into the next generation and leverage it to help tackle these challenges, but to do so will require a plan. Development of the next regional transit strategic plan will occur along the three tracks described below.
Figure 1: Regional Transit Strategic Plan Timeline
The financial planning track includes 2022 and 2023 budget development while also conducting longer-term financial planning culminating with a 10-year financial plan to accompany the strategic plan. The purpose of this task is to proactively prepare the region and decision-makers for future actions that may need to be taken to ensure financial sustainability of transit when the federal relief dollars are expended. The strategic planning track provides a forum for the RTA Board and stakeholders to set a new vision for the transit system; to identify the capital projects and other supporting elements needed to achieve that vision; and to have insightful conversations about the trade-offs between visionary ideals and funding realities. The purpose of this task is to develop a new regional transit strategic plan that outlines a shared vision of priorities for the transit systems in 2023 and beyond.

Proposed 2022 Operating Budget, Page 6 of 99 Two-Year Financial Plan, and Five-Year Capital Plan
There are difficult decisions for the transit system ahead, but the RTA will not make those decisions alone. The communications and engagement track will ensure that the RTA Board, stakeholders, and the public remain informed about the process, have opportunities to engage, and are made aware of outcomes. Work on this track is already underway with an engagement effort called Making a Plan, which includes a series of guest speakers at RTA Board of Directors meetings, a public survey, stakeholder workshops, and a guest blog series on the RTA blog, Connections. There will be more opportunities for engagement throughout 2022. Subscribe to the Regional Transit Update newsletter for the latest updates on recovery, strategic planning, and more from the RTA.
A transit system ready to act and innovate Amid this crisis, there is no time to waste. While the RTA will be developing a vision by engaging the many audiences who care passionately about transit throughout the strategic planning process, we know we cannot wait until the plan is adopted to take action for transit’s future. There are already several examples of innovation happening across the transit system. In its regional governance role, RTA worked with the Service Boards and stakeholders to create transparent and timely methods for allocating aforementioned federal relief funds received in 2021. The RTA used planning data to understand the people who needed transit the most during the pandemic and allocated the CRRSAA relief funding in way that prioritized preserving service in those areas of critical need. The RTA used financial data to understand the Service Boards’ likely budgetary needs for the next several years to allocate the ARP funds. These regional decisions made it possible for all three Service Boards to continue to operate critical services for their unique rider markets in 2021 and will empower them to operate with stability over the next several years. In operations, the Service Boards are planning for 2022 service plans that offer the most robust
service levels in the region since early 2020. The budgeted service levels are intended to meet
the needs of those riding today and plan for the return of those lapsed riders who will continue
to return to transit over the next year. The Service Boards are also exploring new ideas in fare
products, service delivery, partnerships, and more. This budget supports many of those pilots,
which will change and improve the way riders experience transit and point the way toward
scalable solutions.
In capital programming, the RTA Board passed a new performance-based capital allocation
structure that for the first time sets specific targets to ensure infusions of funding, such as that
from the Rebuild Illinois legislation passed in 2019, are spent efficiently and effectively, while
also prioritizing specific regional policy goals such as equity and accessibility. The capital
program in this document includes highlights about equity and accessibility projects as well as
the other key regional goals, requirements and priorities that are being advanced through
strategic investment in the transit network.

Proposed 2022 Operating Budget, Page 7 of 99 Two-Year Financial Plan, and Five-Year Capital Plan
These actions show that the RTA and Service Boards are open to new ideas while recognizing
that our region needs sustained investment in the transit system to support its role in
improving northeastern Illinois’ economy, environment, and quality of life. Building on this
innovation and laying out path of bold but realistic actions is our commitment in the year
ahead.
“In 2022, the RTA and Service Boards will do the work to plan for the future of transit in northeastern Illinois in a time when the challenges and opportunities facing our system have never been greater. There are many unknowns ahead, but with our collective effort, I’m confident our region will thrive with a public transit system that provides adequate, accessible, and equitable mobility options for all.”
– Leanne Redden, RTA Executive Director

Proposed 2022 Operating Budget, Page 8 of 99 Two-Year Financial Plan, and Five-Year Capital Plan
Regional Operations This section summarizes the proposed 2022 Regional Operating Budget and Two-Year Financial Plan, which comprises each Service Boards’ respective operating budget combined with the budget requirements of the RTA Agency. While this first section of the document contains high-level summaries of the proposed regional budget, more complete details may be found in the CTA, Metra, Pace Suburban Service, ADA Paratransit, and RTA Agency sections that follow it. The proposed budgets will be presented by the leadership and staff of the RTA, CTA, Metra, and Pace at the RTA Board meeting on November 18, 2021. Following the public comment period — which includes an RTA virtual public hearing on December 1 — the RTA Board will consider adoption of the regional operating budget and capital program at its final meeting of the year on December 16, 2021.
Regional Operating Budget The onset of the COVID-19 pandemic in March 2020 had a profound effect on the RTA regional operating budget, particularly RTA sales tax receipts and Service Board fare revenue. The Service Boards’ fare revenue remains severely depressed, primarily due to the slow return of riders to public transit. In response to this sudden and lingering revenue loss, the federal government has provided three tranches of much-needed relief funding for transit via the CARES Act, CRRSAA, and American Rescue Plan (ARP) Act. This critical funding, totaling over $3.4 billion, has enabled the RTA system to operate transit during the height of the pandemic and ongoing recovery, providing critical service to those who need it the most. The RTA system ridership recovery over the course of 2021 has been slow, but steady. The Service Boards have proposed 2022 operating budgets that bring the transit system closer to the overall service level provided before the pandemic struck. Service levels in the proposed budgets have been maintained at CTA and continue to be restored at Metra and Pace, with Pace also introducing some new service. Such service increases come at a cost, and as a result the proposed regional operating budget has grown to $3.405 billion, which exceeds the expense level anticipated by the pre-COVID adopted 2022 Financial Plan. Although RTA sales tax performance has rebounded strongly, supporting the proposed Service Board expense levels through 2024 will require the allocation of additional federal relief funding made available by ARP, and then some. No fare increases are contained in the proposed budgets, and price reductions on select passes and new pass options have been introduced to encourage riders to return to the transit system. Unless otherwise noted, most growth rates in this document are calculated by comparing 2022 Budget figures to 2021 Estimate figures, which the Service Board finance teams have reforecast based on the most recent financial results, ridership, and operating trends of the current year. Such a comparison generally provides a more useful and meaningful view than comparing the proposed (2022) budgets to the prior year (2021) budget.
Proposed 2022 Operating Budget, Page 9 of 99 Two-Year Financial Plan, and Five-Year Capital Plan
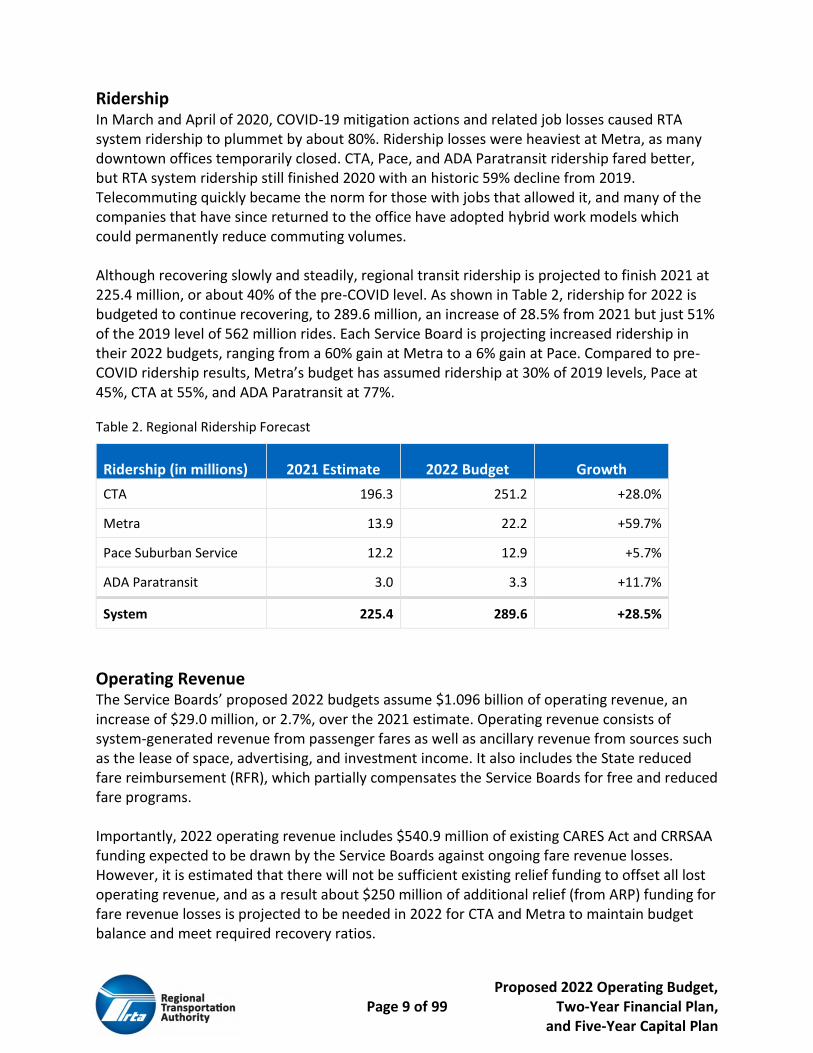
Ridership In March and April of 2020, COVID-19 mitigation actions and related job losses caused RTA system ridership to plummet by about 80%. Ridership losses were heaviest at Metra, as many downtown offices temporarily closed. CTA, Pace, and ADA Paratransit ridership fared better, but RTA system ridership still finished 2020 with an historic 59% decline from 2019. Telecommuting quickly became the norm for those with jobs that allowed it, and many of the companies that have since returned to the office have adopted hybrid work models which could permanently reduce commuting volumes. Although recovering slowly and steadily, regional transit ridership is projected to finish 2021 at 225.4 million, or about 40% of the pre-COVID level. As shown in Table 2, ridership for 2022 is budgeted to continue recovering, to 289.6 million, an increase of 28.5% from 2021 but just 51% of the 2019 level of 562 million rides. Each Service Board is projecting increased ridership in their 2022 budgets, ranging from a 60% gain at Metra to a 6% gain at Pace. Compared to pre-COVID ridership results, Metra’s budget has assumed ridership at 30% of 2019 levels, Pace at 45%, CTA at 55%, and ADA Paratransit at 77%.
Table 2. Regional Ridership Forecast
Ridership (in millions) 2021 Estimate 2022 Budget Growth
CTA 196.3 251.2 +28.0%
Metra 13.9 22.2 +59.7%
Pace Suburban Service 12.2 12.9 +5.7%
ADA Paratransit 3.0 3.3 +11.7%
System 225.4 289.6 +28.5%
Operating Revenue The Service Boards’ proposed 2022 budgets assume $1.096 billion of operating revenue, an increase of $29.0 million, or 2.7%, over the 2021 estimate. Operating revenue consists of system-generated revenue from passenger fares as well as ancillary revenue from sources such as the lease of space, advertising, and investment income. It also includes the State reduced fare reimbursement (RFR), which partially compensates the Service Boards for free and reduced fare programs. Importantly, 2022 operating revenue includes $540.9 million of existing CARES Act and CRRSAA funding expected to be drawn by the Service Boards against ongoing fare revenue losses. However, it is estimated that there will not be sufficient existing relief funding to offset all lost operating revenue, and as a result about $250 million of additional relief (from ARP) funding for fare revenue losses is projected to be needed in 2022 for CTA and Metra to maintain budget balance and meet required recovery ratios.

Proposed 2022 Operating Budget, Page 10 of 99 Two-Year Financial Plan, and Five-Year Capital Plan
When operating revenue and the additional relief funding need discussed above are combined with public funding, resulting total revenue of $3.412 billion is anticipated to be available to support the proposed level of 2022 service and associated operating expenses, as shown in Figure 2. Operating revenue accounts for 32.1% of the total revenue budget, and the additional relief funding need, 7.3%, with the balance coming from public funding sources.
Figure 2. 2022 Revenues: $3.412 Billion
Public Funding Overall public funding in 2022 is projected at $2.067 billion, an increase of $7.5 million or 0.4% from the 2021 estimate. About 41% of the region’s revenue for operations is budgeted to come from the regional sales tax imposed at 1.25% in Cook County and 0.5% in the collar counties. RTA sales tax receipts are expected to finish 2021 at $1.379 billion, after rebounding 19.8% from COVID-impacted 2020 results. Better than expected sales tax performance in 2021 has been primarily driven by changes in State law which took effect in January, resulting in RTA sales tax applying to more online purchases. Sales tax is assumed to grow by 1.0% in 2022, to $1.393 billion. Sales tax is then forecast to increase by an average of 2.6% in 2023 and 2024, finishing the planning period at $1.469 billion. An existing State surcharge of 1.5% on RTA sales tax collections is assumed to remain in place indefinitely, reducing RTA and Service Board funding by approximately $20 million per year. The majority of State funding received by the RTA is based on a 30% match of RTA sales tax and Real Estate Transfer Tax (RETT) receipts. The match funding comes from the State’s Public Transportation Fund (PTF), which is expected to provide $442.9 million for 2022 operations. The PTF forecast reflects the July 2021 discontinuation of a previous 5% State cut which had been in place since 2017. RETT receipts in 2022 are expected to increase by 1.0% to $65.6 million, in line with the sales tax growth assumption. Continued State Financial Assistance (ASA/AFA) of $130.3 million for reimbursement of debt service on RTA Strategic Capital Improvement Program (SCIP) bonds is budgeted for 2022, as is $8.4 million of State funding to

Proposed 2022 Operating Budget, Page 11 of 99 Two-Year Financial Plan, and Five-Year Capital Plan
support Pace ADA Paratransit service. Other miscellaneous revenue sources comprise the remaining 1% of total revenue.
Service Levels and Expenses As shown in Figure 3, Service Board operating expenses comprise about 92% of the RTA Regional Budget and are largely driven by planned service levels. CTA’s proposed budget continues to incorporate full pre-pandemic service levels, while the proposed Metra and Pace budgets continue to restore many of the significant service reductions implemented by both agencies as ridership plunged in the immediate aftermath of the COVID-19 outbreak. Each of the Service Boards anticipates significant 2022 operating expense growth relative to their 2021 estimates. CTA projects an 8.8% increase, driven primarily by labor and material expenses. Metra operating costs are expected to increase by 16.3% as service levels continue to be restored to near pre-pandemic levels. Pace anticipates 13.4% expense growth driven by ongoing route reinstatements and the commencement of new service including the Dempster Avenue Pulse ART route and TNC pilot projects. ADA Paratransit expenses are projected to increase by 16.9% due to continuing ridership recovery and contractual price increases including new minimum wage requirements for drivers.
Figure 3. 2022 Expenses: $3.405 Billion
RTA Agency and Regional Programs expenses are budgeted at $46.6 million, an increase of 18.7% from the 2021 estimate. However, much of that growth is due to an expected increase in grant-funded programs which also provide grant revenue to the Agency. It is important to note that the 2022 RTA Agency net expense, or funding requirement, is unchanged from the pre-COVID level of $35.2 million. The RTA Agency budget represents 1.4% of RTA system expenses. Other regional expenses, which include debt service on bonds issued for Service Board capital funding and Joint Self Insurance Fund (JSIF) premiums, comprise the remaining 6.3% of regional expenses. The projected 2022 RTA debt service level of $203.2 million includes principal and interest expense on existing long-term bonds and interest on short-term borrowing to manage any delays in payments from the State of Illinois. No new RTA bond issuances are planned for 2022.
Proposed 2022 Operating Budget, Page 12 of 99 Two-Year Financial Plan, and Five-Year Capital Plan
When RTA and regional expenses are combined with Service Board operating expenses, total 2022 expenses for the RTA system are projected at $3.405 billion, an increase of 9.1% over the 2021 estimate. This represents an increase of $151 million, or 4.6%, from the pre-COVID 2022 Plan adopted with the original 2020 budget. Total regional operating expenses are subsequently projected to increase by 3.5% and 4.0% in 2023 and 2024, respectively, reaching $3.665 billion by the end of the planning period.
Federal Relief and Additional Funding Need A total of $1.438 billion of federal CARES Act relief funding was approved for the RTA region in March 2020, followed by $486.2 million of CRRSAA funding in January 2021 and $1.5 billion of ARP funding in March 2021. The proposed Service Board and RTA budgets estimate that $1.308 billion or 68% of the combined CARES Act and CRRSAA funding will have been drawn down by the close of 2021. The CTA and Metra budgets project that their remaining CARES Act and CRRSAA funding will be exhausted in the second half of 2022, and as a result their 2022 budgets call for ARP allocations of $156.2 million (CTA) and $92.8 million (Metra) to balance proposed expense levels. The proposed Pace budget projects that existing CARES Act and CRRSAA funding should last well into 2023. Furthermore, the proposed CTA, Metra, and Pace 2023-2024 financial plans require additional relief funding or budget balancing actions of $981.6 million, $409.9 million, and $68.3 million, respectively, resulting in a total 2022 to 2024 combined stated Service Board funding need of $1.709 billion, about $200 million higher than the Region’s ARP apportionment. ARP allocations approved by the RTA Board on November 8, 2021, are expected to address most of this need, and sales tax performance above the adopted RTA funding marks could also help close the projected gaps. If the approved ARP allocations and sales tax results do not fully cover the estimated additional funding needs, unspecified budget balancing actions may be required by the Service Boards to bring operating expenses back into balance and optimize the longevity of the remaining federal relief funding. Incorporation of the approved ARP allocations into the Service Board operating budgets is expected to be accomplished with a 2022 budget amendment in response to an RTA funding amendment anticipated to take place during the first quarter of 2022.
Net Result and Recovery Ratios As shown in Table 3, the regional operating budget and financial plan is balanced in 2022, 2023, and 2024, with a net result of zero contingent upon additional relief funding or budget balancing actions, shown in red. The RTA Act requires the RTA Board to set a system-generated revenue recovery ratio for each Service Board, as well as requiring that the combined revenues from RTA operations cover at least 50% of system operating expenses, with approved adjustments. This requirement excludes ADA Paratransit service, for which the Act mandates a 10% recovery ratio.

Proposed 2022 Operating Budget, Page 13 of 99 Two-Year Financial Plan, and Five-Year Capital Plan
By including $541 million of CARES Act and CRRSAA funding and $249 million of additional relief funding need in operating revenue, as authorized by the RTA Board, the CTA, Metra, and Pace proposed 2022 operating budgets meet or exceed their individual RTA-specified recovery ratios of 54.75%, 52.5%, and 30.3%, respectively. As a result, the RTA regional recovery ratio for 2022 is projected at 51.9%, in compliance with the RTA Act. The ADA Paratransit budget also meets the required recovery ratio of 10%, after authorized expense exclusions.

Proposed 2022 Operating Budget, Page 14 of 99 Two-Year Financial Plan, and Five-Year Capital Plan
Table 3. Statement of Regional Revenues and Expenses (dollars in thousands)

Proposed 2022 Operating Budget, Page 15 of 99 Two-Year Financial Plan, and Five-Year Capital Plan
ICE Funding and Proposed Projects Innovation, Coordination, and Enhancement (ICE) funding of $14.2 million to $14.9 million was allocated to the Service Boards in the adopted 2022-2024 funding amounts, contingent upon RTA Board approval of proposed ICE projects. Table 4 summarizes the proposed Service Board uses and amounts of these ICE funds. Only the 2022 proposed uses are currently subject to approval by the RTA Board. Metra and Pace intend to use ICE funding for capital projects, while CTA has proposed operating projects.
Table 4. Proposed Uses of ICE Funding (dollars in thousands)

Proposed 2022 Operating Budget, Page 16 of 99 Two-Year Financial Plan, and Five-Year Capital Plan
Primary RTA Public Funding Sources
RTA Sales Tax Part I: The original RTA sales tax, levied at 1.0% in Cook County and 0.25% in the collar counties of DuPage, Kane, Lake, McHenry, and Will. 85% of Sales Tax I receipts are distributed to the Service Boards according to a statutory formula. The remaining 15% of Sales Tax I is initially retained by the RTA to fund regional and agency expenses before being allocated at the direction of the RTA Board. RTA Sales Tax Part II: Authorized by the 2008 funding reform, an additional sales tax of 0.25% in all six counties of the RTA region. Sales Tax II is distributed to the Service Boards according to a statutory formula after deducting funds for ADA Paratransit, Pace Suburban Community Mobility (SCMF), and RTA Innovation, Coordination, and Enhancement (ICE). After these deductions, CTA receives 48%, Metra 39%, and Pace 13%. Real Estate Transfer Tax (RETT): The 2008 funding reform also increased the City of Chicago RETT by $1.50 per $500 of property transferred and dedicated this additional tax revenue to directly fund CTA operating expenses. Public Transportation Fund (PTF) Part I: PTF Part I is State-provided funding comprised of a 25% match of Sales Tax I receipts. 100% of PTF I is retained by the RTA and combined with 15% of Sales Tax I to form the basis for funding to be allocated at the direction of the RTA Board. Public Transportation Fund (PTF) Part II: PTF Part II, authorized by the 2008 funding reform, is State-provided funding equal to a 5% match of Sales Tax I receipts and a 30% match of Sales Tax II receipts and RETT receipts. After allocating 5/6 of the PTF on RETT receipts to CTA, the remaining PTF II is distributed to the Service Boards by the same statutory formula used to allocate Sales Tax II. State Financial Assistance: State-provided assistance to reimburse the RTA’s debt service on Strategic Capital Improvement Program (SCIP) bonds. It consists of two components: Additional State Assistance (ASA) and Additional Financial Assistance (AFA). State Reduced Fare Reimbursement: State-provided reimbursement to the Service Boards, via the RTA, to partially offset the cost of providing reduced fare and free ride programs mandated by law, including those for seniors and disabled persons.

Proposed 2022 Operating Budget, Page 17 of 99 Two-Year Financial Plan, and Five-Year Capital Plan
CTA Operating Budget CTA’s proposed budget reflects the continued operation of the full service levels which were maintained to support essential workers during the height of the pandemic, and now during the recovery. CTA projects that all available CARES Act and CRSSAA funding will exhaust sometime next year, and clearly quantifies the need for $156.2 million of additional relief funding to balance the proposed 2022 budget. Over the broader 2022-2024 period, CTA’s proposed operating budget and financial plan requires more than $1.1 billion of additional relief funding to support projected expense levels.
“Despite the many challenges of the recent past, we have not lost sight of the principles that guide us as an agency as well as me personally: equity, inclusion, and diversity. The pandemic strongly reaffirmed the importance of transit to many in our city, including some of our most vulnerable populations for who transit was, and is, a lifeline.” Dorval R. Carter Jr., CTA President
Ridership Ridership has shown steady growth since the City of Chicago moved into its fifth and final stage of reopening, but customer travel patterns have changed with respect to peak travel times and frequency of passenger trips. CTA’s total 2021 ridership is projected to end the year at 196.3 million, or about 43% of 2019 ridership. The 2022 budget anticipates ridership growth of 28% from the 2021 estimate to 251.2 million rides, or about 55% of pre-COVID levels. Further recovery is anticipated for 2023 and 2024, with ridership assumed to reach 65% of normal for both bus and rail by the end of the planning period.
Figure 4. CTA Ridership (millions)
Proposed 2022 Operating Budget, Page 18 of 99 Two-Year Financial Plan, and Five-Year Capital Plan
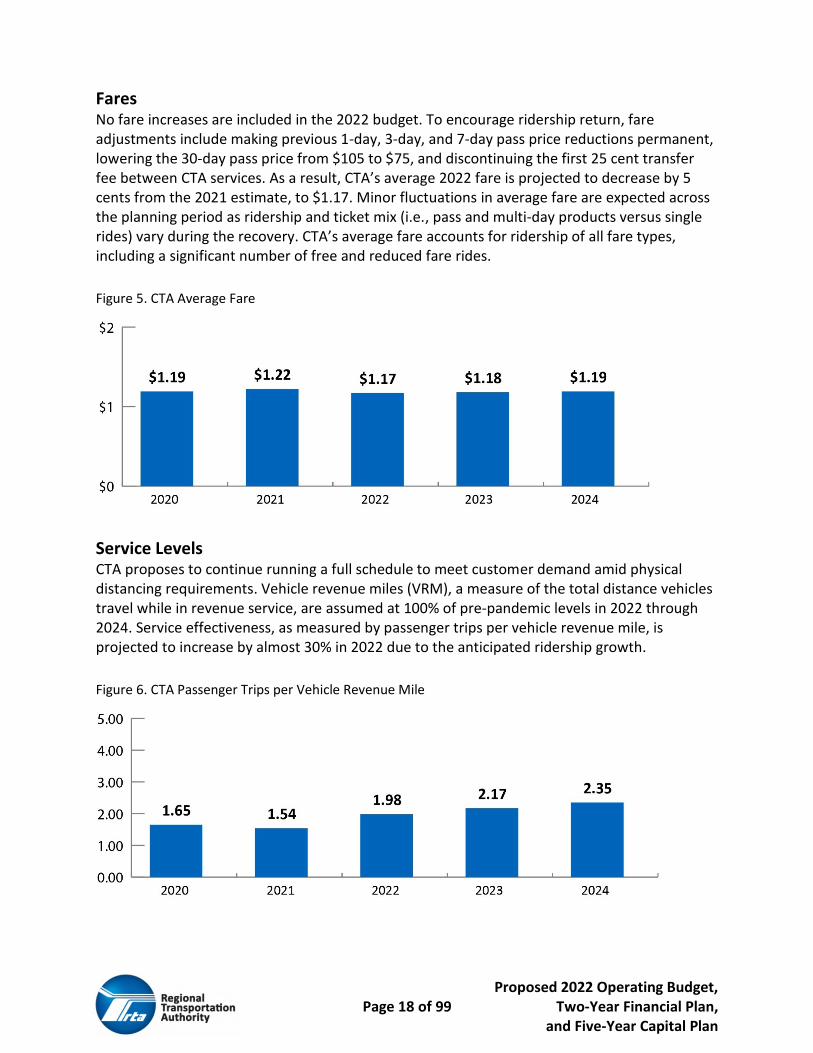
Fares No fare increases are included in the 2022 budget. To encourage ridership return, fare adjustments include making previous 1-day, 3-day, and 7-day pass price reductions permanent, lowering the 30-day pass price from $105 to $75, and discontinuing the first 25 cent transfer fee between CTA services. As a result, CTA’s average 2022 fare is projected to decrease by 5 cents from the 2021 estimate, to $1.17. Minor fluctuations in average fare are expected across the planning period as ridership and ticket mix (i.e., pass and multi-day products versus single rides) vary during the recovery. CTA’s average fare accounts for ridership of all fare types, including a significant number of free and reduced fare rides.
Figure 5. CTA Average Fare
Service Levels CTA proposes to continue running a full schedule to meet customer demand amid physical distancing requirements. Vehicle revenue miles (VRM), a measure of the total distance vehicles travel while in revenue service, are assumed at 100% of pre-pandemic levels in 2022 through 2024. Service effectiveness, as measured by passenger trips per vehicle revenue mile, is projected to increase by almost 30% in 2022 due to the anticipated ridership growth.
Figure 6. CTA Passenger Trips per Vehicle Revenue Mile

Proposed 2022 Operating Budget, Page 19 of 99 Two-Year Financial Plan, and Five-Year Capital Plan
Operating Revenue Total operating revenue is projected to increase by 16.3% in 2022 to $824.4 million and continues to include federal relief funding to cover fare revenue shortfalls. Passenger fare revenue is budgeted to grow by 22.3%, in line with increasing ridership and the lower average fare. CTA’s share of the State reduced fare reimbursement remains at $14.6 million in 2022 and the planning years. CTA’s Other Revenue category is expected to grow by 3.7% to $60.4 million and reflects elimination of City of Chicago ride-hailing fee revenue. Importantly, CTA’s operating revenue projection includes $299.3 million of CARES Act and CRRSAA funding, and an additional relief funding need of $156.2 million, required to maintain budget balance. Inclusion of relief funding in operating revenue has been authorized by the RTA Board for purposes of meeting the required recovery ratio. CTA’s total operating revenue projection, including existing and additional relief funding, represents 47.2% of total revenue, as shown below.
Figure 7. CTA 2022 Revenues: $1.747 Billion
Public Funding Due to improving sales tax performance, total public funding for CTA operations in 2022 is projected at $922.4 million, 2.8% higher than the 2021 estimate. CTA’s funding assumptions for 2022 through 2024 match the RTA Board adopted marks for sales tax, PTF, RTA non-statutory funding, and ICE funding. These amounts include Chicago RETT receipts projected at $65.6 million to $69.2 million. ICE funding for 2022 totals $6.8 million and will be used for operations, with proposed uses shown above in the Regional Operating Budget section.
Expenses CTA’s proposed 2022 expense level is $1.747 billion, an increase of $140.6 million or 8.8% from the 2021 estimate, and an increase of 6.2% from CTA’s pre-COVID 2022 Plan. Cost drivers include contractual wage increases, facility leases, equipment rentals, and contracted services. Labor, CTA’s largest expense category, is budgeted to increase by 7.4% to $1.241 billion. The second-largest category, material expenses, is expected to grow by 14.5% due to expiring

Proposed 2022 Operating Budget, Page 20 of 99 Two-Year Financial Plan, and Five-Year Capital Plan
warranties and new overhaul work. Total expenses are forecast to grow by 4.7% and 4.5% in 2023 and 2024, respectively, reaching $1.911 billion by the end of the planning period. The 2022-2026 capital program includes proposed CTA bond issuances of $840 million, and CTA has provided estimated financing parameters as required by the Budget Call. CTA’s proposed 2022 capital program contains approximately $332 million of annual debt service expense.
Figure 8. CTA 2022 Expenses: $1.747 Billion
CTA has advance purchased about 75% of its 2022 fuel requirements. Fuel expense of $35.4 million represents 2.0% of CTA’s total expense, and is budgeted at $2.13 per gallon, 9 cents lower than the 2021 estimate. CTA is currently in the procurement process for diesel fuel supply and delivery in 2023 through 2025 and therefore has not yet locked in pricing for those years. The planning period assumes a higher price per gallon and unchanged fuel consumption levels as some of CTA’s oldest diesel buses are expected to be replaced.
Figure 9. CTA Fuel Price Per Gallon
Cost efficiency is shown in the next chart by cost per vehicle revenue mile, which is projected to grow at an average annual rate of 4.0% across the five-year period as expenses increase with inflation while service levels remain essentially flat. Cost effectiveness, represented by cost per passenger trip, peaks at $8.18 due to low ridership in 2021 and then improves steadily with the assumed ridership recovery, reaching $6.43 by 2024.

Proposed 2022 Operating Budget, Page 21 of 99 Two-Year Financial Plan, and Five-Year Capital Plan
Figure 10. CTA Cost Efficiency and Effectiveness
Federal Relief and Additional Funding Need CTA was allocated a total of $1.179 billion of combined CARES Act and CRRSAA federal relief funding to help offset fare revenue and RTA funding losses due to the COVID-19 pandemic. To balance expenses and meet its required recovery ratio, CTA’s proposed budget exhausts the remainder of its existing federal funding and relies on a potential ARP allocation of $156.2 million in order to maintain balance and meet the required recovery ratio in 2022. CTA’s ARP allocation, approved by the RTA Board on November 8, 2021, is expected to fill the 2022 budget gap. At adopted RTA funding levels, a total of $1.138 billion of additional relief funding would be required to fully balance CTA’s proposed budget and two-year financial plan over the broader 2022 through 2024 period. CTA’s approved ARP allocation of $912.1 million is sufficient to cover most of this projected three-year shortfall. If favorable sales tax variances do not address the remaining gap, CTA may need to implement budget balancing actions which could include service reductions and fare adjustments.
Net Result and Recovery Ratio As shown in Table 5, CTA’s operating budget is balanced in 2022 through 2024 by the additional relief funding need, shown in red. Revenues equal expenditures, producing a net result of zero. CTA’s 2022 recovery ratio of 56.9%, calculated by dividing total operating revenue by total operating expenditures, with approved adjustments, meets the RTA Board adopted requirement of 54.75%. CTA has properly included CARES Act funding, CRRSAA funding, and the additional required relief funding in operating revenue for the purpose of meeting the required recovery ratio, as authorized by the RTA Board.

Proposed 2022 Operating Budget, Page 22 of 99 Two-Year Financial Plan, and Five-Year Capital Plan
Table 5. CTA 2022 Budget and 2023-2024 Financial Plan (dollars in thousands)

Proposed 2022 Operating Budget, Page 23 of 99 Two-Year Financial Plan, and Five-Year Capital Plan
Metra Operating Budget Metra’s proposed operating budget reflects service levels restored to near pre-COVID levels in 2022 to ensure it remains a safe and reliable option to returning passengers, while also adapting to their changing travel patterns. Metra’s proposed 2022 budget calls for additional relief funding of $92.8 million above and beyond that provided by CARES Act and CRRSAA funding, and a total of $502.8 million of additional relief funding or budget balancing actions through 2024 to maintain a full-service schedule.
“Access to Metra services has provided growth and opportunity for communities and businesses across our region. As the Chicago region recovers and returns to traveling for work and pleasure, rest assured that My Metra will continue to be there for you.” Jim Derwinski, Metra CEO/Executive Director
Ridership Metra ridership has recovered slower than originally anticipated and is projected to end 2021 at 13.9 million, or about 19% of 2019 levels. The 2022 budget anticipates higher ridership of 22.2 million, or about 30% of pre-COVID levels, an increase of 60.2% from the 2021 estimate. Steady recovery is anticipated in 2023 and 2024, with ridership assumed to reach 73% of pre-COVID levels in the final year of the planning period.
Figure 11. Metra Ridership (millions)
Fares No fare increases are proposed for 2022. Metra will introduce a $6 short-distance day pass as a pilot program, good for travel within any three contiguous fare zones, complementing the $10 all-zone day pass introduced in 2021. In addition, the validity period of the 10-Ride and One-Way tickets will be shortened from one year to 90 days and from 90 days to 14 days, respectively. Metra’s average fare is budgeted at $4.94 in 2022 and is assumed to remain flat through the planning period.

Proposed 2022 Operating Budget, Page 24 of 99 Two-Year Financial Plan, and Five-Year Capital Plan
Figure 12. Metra Average Fare
Service Levels Since implementing a sharply reduced schedule in response to the onset of the pandemic, Metra has gradually restored service over the course of the last year and a half. Metra’s 2022 budget reflects ongoing service restorations on all 11 lines, including re-engineered schedules that are easy to understand and new express and reverse-commute services, where possible. Metra’s budget reflects the strategy that train schedules need to be re-established so that service is in place when riders are ready to return, and that having sufficient service in place should encourage customers to begin riding again, provided that they feel safe doing so. Service effectiveness, as measured by passenger trips per VRM, declined sharply as ridership bottomed out in 2021. Since ridership is assumed to recover steadily in 2022 through 2024, effectiveness is projected to increase across the two-year planning period but remain below the pre-COVID level of about 1.7 trips per VRM.
Figure 13. Metra Passenger Trips Per Vehicle Revenue Mile

Proposed 2022 Operating Budget, Page 25 of 99 Two-Year Financial Plan, and Five-Year Capital Plan
Operating Revenue Metra anticipates that total 2022 operating revenues will increase by 43.9% from the 2021 estimate, to $441.2 million. Fare revenue is budgeted to increase in line with ridership and thus approaches 73% of 2019 levels by the end of the planning period. Metra’s remaining $202.0 balance of CARES Act and CRRSAA funding is included in Metra’s operating revenue for 2022, as is an additional $92.8 million of relief funding required to balance Metra’s 2022 operating budget and meet the recovery ratio requirement. Metra’s $1.6 million share of the State reduced fare reimbursement and other revenue of $35.0 million round out the operating revenue picture. Other revenue includes lease of space, advertising income, and fees for track usage by other railroads. Operating revenues, including the additional funding need, comprise about 49% of Metra’s total revenue for operations, with the balance provided by public funding sources.
Figure 14. Metra 2022 Revenues: $905.5 Million
Public Funding Metra’s total 2022 public funding is projected at $464.3 million, a decrease of 1.7% from 2021 due primarily to lower Sales Tax II as 2022 RTA funding for ADA Paratransit increases from 2021. The return of non-statutory funding for Metra from RTA Sales Tax I, in the amount of $12.1 million, is expected to offset some of the projected decline in Sales Tax II funding.
Expenses Total 2022 operating expenses are proposed to increase by 16.3% from the 2021 estimate, driven primarily by the continued restoration of service levels to near pre-pandemic levels on all 11 Metra lines. Metra’s overall 2022 budgeted expenses of $900.0 million are 1.9% higher than their pre-pandemic 2022 Plan and include inflationary and contractual cost increases as well as headcount additions related to new mandated safety, security, and asset management regulations. It is important to note that the proposed 2022 budget does not include the impact of the potential transfer of the three Union Pacific-operated lines to Metra service. Metra’s overall expenses are expected to increase by 3.3% and 3.2% in 2023 and 2024, respectively, reflecting inflationary increases.

Proposed 2022 Operating Budget, Page 26 of 99 Two-Year Financial Plan, and Five-Year Capital Plan
Figure 15. Metra 2022 Expenses: $900.0 Million
Diesel fuel expenditures comprise about 5.5% Metra’s total operating expenses and are expected to increase by 4.6% in 2022 to $49.7 million, in line with increased consumption related to service restorations. Metra has locked in a majority of its 2022 fuel requirements at favorable rates. Fuel price is budgeted at $1.87 per gallon, representing a 12-cent increase from the 2021 estimate. Electricity expense for the Metra Electric District line is budgeted to increase by 5.1% in 2022, to $4.1 million.
Figure 16. Metra Fuel Price Per Gallon
Cost efficiency is shown in the next chart by cost per vehicle revenue mile, which is projected to decrease to $22.37 in 2022 as fixed costs are spread over more vehicle revenue miles due to increased service levels. Cost effectiveness, shown as cost per passenger trip, is also expected to improve in 2022, to $40.51, after spiking when ridership bottomed out in 2021. Cost effectiveness is projected to improve further in 2023 and 2024 due to the ongoing restoration of service and the assumed continuation of the ridership recovery.

Proposed 2022 Operating Budget, Page 27 of 99 Two-Year Financial Plan, and Five-Year Capital Plan
Figure 17. Metra Cost Efficiency and Effectiveness
Federal Relief and Additional Funding Need Metra was allocated a total of $562.6 million in CARES Act and CRRSAA federal relief funding to help offset fare revenue and public funding losses brought on by the COVID-19 pandemic. Metra’s proposed 2022 budget exhausts its remaining CARES and CRRSAA balance of $202.0 million and relies on a potential ARP allocation of $92.8 million to achieve balance and meet its required recovery ratio. Metra’s ARP allocation, approved by the RTA Board on November 8, 2021, is expected to fill the 2022 budget gap. At adopted RTA funding levels, a total of $502.8 million of additional relief funding would be required to fully balance Metra’s proposed 2022-2024 budget and plan. Metra’s approved ARP allocation of $513.6 million is sufficient to cover this projected three-year shortfall.
Net Result and Recovery Ratio As shown in Table 6, Metra’s operating budget is balanced in 2022 through 2024 by including the additional funding need, shown in red. Revenues equal expenditures, producing a net result of zero after accounting for the transfer of ICE funding to the 2022-2026 capital program. Metra does not plan to transfer any fare revenue to the capital program through the planning period. Metra’s 2022 through 2024 recovery ratios, calculated by dividing total operating revenue by total operating expenditures, with approved adjustments, exceed the RTA Board adopted requirement of 52.5%. Metra has properly included CARES Act funding, CRRSAA funding, and the additional required relief funding in operating revenue for the purpose of meeting the required recovery ratio, as authorized by the RTA Board.

Proposed 2022 Operating Budget, Page 28 of 99 Two-Year Financial Plan, and Five-Year Capital Plan
Table 6. Metra 2022 Budget and 2023-2024 Financial Plan (dollars in thousands)

Proposed 2022 Operating Budget, Page 29 of 99 Two-Year Financial Plan, and Five-Year Capital Plan
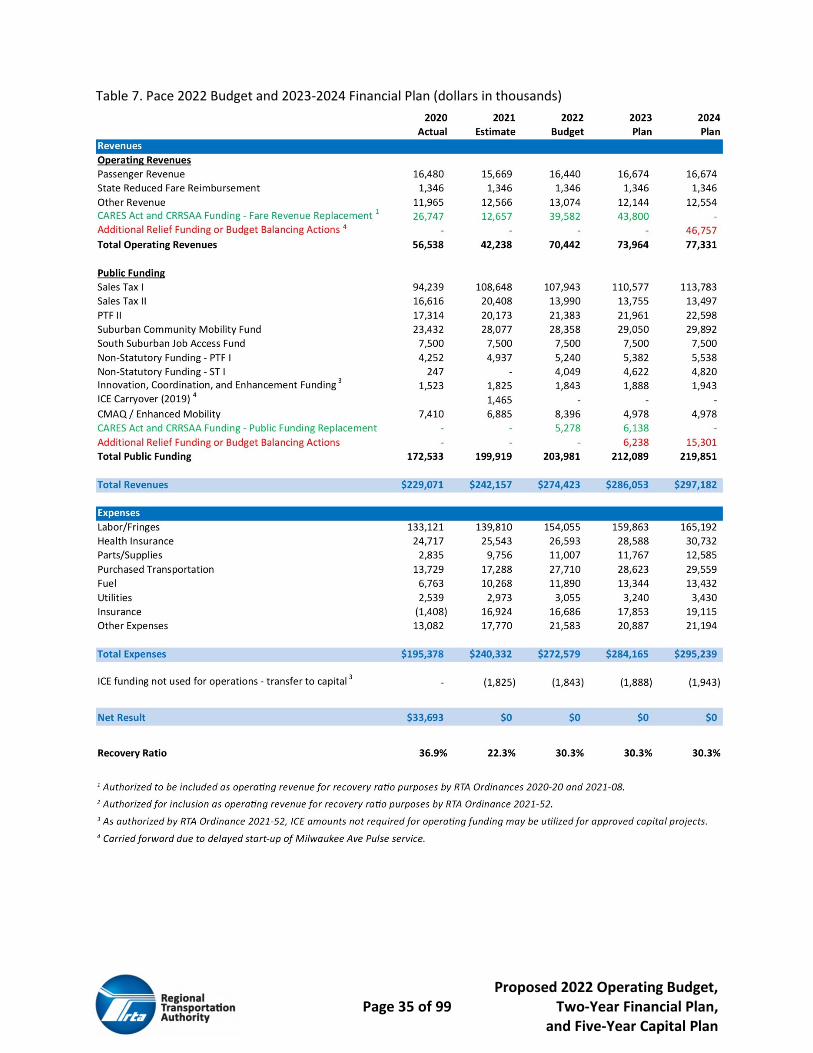
Pace Operating Budget Pace’s proposed 2022 operating budget anticipates the ongoing restoration of fixed routes suspended following the onset of the COVID-19 pandemic, as well as significant new service offerings including the start-up of Pace’s second Pulse arterial rapid transit (ART) route, along Dempster Avenue. At the resulting higher expense levels, maintaining balance will require an additional $68.3 million of relief funding.
“Thanks to help from local, state, and federal officials as well as strategic expense reductions over the last 18 months, we are able to reverse many of the service suspensions we implemented, introduce new service, and make a historic investment in our infrastructure. This marks the beginning of Pace’s promise to build back better with a more robust, sustainable, and equitable network of public transportation services.” Richard Kwasneski, Pace Board Chairman
Ridership Following the onset of the COVID-19 pandemic in March 2020, Pace ridership declined to about 25% of 2019 levels before beginning a slow but steady recovery. Pace ridership is estimated to finish 2021 at 12.2 million, or about 43% of pre-COVID levels. Combined ridership for Pace’s three Suburban Service modes is budgeted to increase by 5.4% in 2022 to 12.9 million, or about 45% of 2019 levels. Little further recovery is assumed for 2023 and 2024, with ridership expected to remain around 13 million per year, or 46% of Pace’s pre-COVID levels.
Figure 18. Pace Ridership (millions)
Fares Pace last implemented a general 25 cent fare increase in January 2018, and the 2022 budget does not contain any proposed fare adjustments. Pace’s average fare across all fare and pass types dropped to $1.13 in 2020 as fares were waived for a period during the height of the pandemic. Average fare is projected to remain steady at $1.28 across the budget and planning period.

Proposed 2022 Operating Budget, Page 30 of 99 Two-Year Financial Plan, and Five-Year Capital Plan
Figure 19. Pace Average Fare
Service Levels In response to COVID-19-related ridership declines, Pace suspended or significantly reduced service on almost 100 bus routes in May 2020. Gradual restoration of those service reductions is ongoing, with eight routes reinstated in 2021 and another seven routes planned to be reinstated in 2022. In addition to those fixed-route restorations, Pace’s proposed budget includes increased demand response service, the launch of Pace’s second Pulse arterial rapid transit route on Dempster Avenue, and transportation network company (TNC) pilot projects. Total VRM are budgeted to increase by 8.6% in 2022 but remain well below pre-COVID levels. Service effectiveness, as measured by passenger trips per VRM, is projected to decline across the budget and planning period as service is restored and service levels grow at a faster rate than the assumed ridership recovery.

Proposed 2022 Operating Budget, Page 31 of 99 Two-Year Financial Plan, and Five-Year Capital Plan
Figure 20. Pace Passenger Trips Per Vehicle Revenue Mile
Operating Revenue Pace projects that total 2022 operating revenues will increase to $70.4 million, including $39.6 million of projected CARES Act funding drawdowns. As authorized by the RTA Board, federal CARES Act and CRRSAA funding requisitioned to address ongoing fare revenue losses may continue to be included in operating revenue for the purpose of meeting required recovery ratios. Pace expects passenger fare revenue to increase by 4.9% to $16.4 million in 2022 as ridership continues to recover slowly and customers respond to the new service offerings. Pace’s $1.3 million share of the State reduced fare reimbursement and other revenue of $13.1 million round out the operating revenue picture. Other revenue includes investment income, advertising income, and local government contributions for specific Pace services. Operating revenue comprises about 26% of Pace’s total revenue for operations, with the balance provided by public funding sources.
Figure 21. Pace 2022 Revenues: $274.4 Million

Proposed 2022 Operating Budget, Page 32 of 99 Two-Year Financial Plan, and Five-Year Capital Plan
Public Funding Due to improving RTA sales tax performance, Pace’s total 2022 public funding is projected to increase by 2.0% from the 2021 estimate, to $204.0 million. In addition to statutory and non-statutory sales tax and PTF components, Pace’s public funding total includes $5.6 million of projected CARES Act funding drawdowns required to achieve a balanced budget. Pace’s public funding assumptions match the RTA Board adopted marks for sales tax, PTF, Suburban Community Mobility Funds, South Suburban Job Access Funds, RTA non-statutory funding, and ICE funding. Pace’s share of the 2022-2024 ICE funding is allocated to the capital program, with proposed uses shown in Table 4 of the Regional Operating section. In addition to RTA funding, Pace anticipates $8.4 million of federal Congestion Mitigation and Air Quality Improvement Program (CMAQ)/Enhanced Mobility funding for operations in 2022.
Expenses Pace projects that 2022 operating expenditures will increase from the 2021 estimate by 13.4%, to $272.6 million, an increase of about 10% from Pace’s pre-COVID 2022 Plan. Labor, Pace’s largest expense category, is expected to increase by 10.2% to $154.1 million, driven by ongoing service restorations and the new service offerings. Fuel, Materials and Purchased Transportation are also budgeted to increase significantly in 2022 due to higher service levels. Administrative expenses related to higher health insurance costs, project management consulting, and the ending of the Pace HQ staff hiring freeze comprise the balance of Pace’s $32 million projected expense increase versus the 2021 estimate.
Figure 22. Pace 2022 Expenses: $272.6 Million
Pace’s fuel expense is projected to grow by 15.8% to $11.9 million. Consumption is expected to increase by about 9% in 2022 due to service expansion, and diesel fuel price is assumed at $1.93 per gallon, up 9 cents from the 2021 estimate.

Proposed 2022 Operating Budget, Page 33 of 99 Two-Year Financial Plan, and Five-Year Capital Plan
Figure 23. Pace Fuel Price Per Gallon
Cost efficiency is shown in the next chart by cost per VRM, which grows at an average rate of 8.9% per year across the five-year period. Cost effectiveness is shown as cost per passenger trip, which rises above $20 in 2022 as service-related costs increase while ridership is assumed to recover more slowly.
Figure 24. Pace Cost Efficiency and Effectiveness
Federal Relief and Additional Funding Need Pace was allocated $112.8 million of CARES Act and $21.4 million of CRRSAA funding to offset fare revenue and public funding losses due to the COVID-19 pandemic. Pace’s budget projects that, at adopted RTA funding levels, this existing federal relief funding will last well into 2023, at which point a potential ARP funding allocation would need to be made available to support proposed expense levels. To fully balance Pace’s projected 2023 and 2024 expense levels, additional relief funding of $68.3 million would be required. Pace’s ARP allocation of $71.3 million, approved by the RTA Board on November 8, 2021, is sufficient to cover this projected three-year shortfall.

Proposed 2022 Operating Budget, Page 34 of 99 Two-Year Financial Plan, and Five-Year Capital Plan
Net Result and Recovery Ratio As shown in Table 7, Pace’s operating budget is balanced in 2022 through 2024 by including the additional funding need, shown in red. Revenues equal expenditures, producing a net result of zero after accounting for the transfer of ICE funding to the 2022-2026 capital program. Pace’s 2022 through 2024 recovery ratios, calculated by dividing total operating revenue by total operating expenditures, with approved adjustments, exactly meet the RTA Board adopted requirement of 30.3%, achieved by including the additional funding need in operating revenue, as authorized by RTA Funding Amounts Ordinance 2021-52, in a similar manner as the existing CARES Act and CRRSAA funding.
Proposed 2022 Operating Budget, Page 35 of 99 Two-Year Financial Plan, and Five-Year Capital Plan
Table 7. Pace 2022 Budget and 2023-2024 Financial Plan (dollars in thousands)

Proposed 2022 Operating Budget, Page 36 of 99 Two-Year Financial Plan, and Five-Year Capital Plan
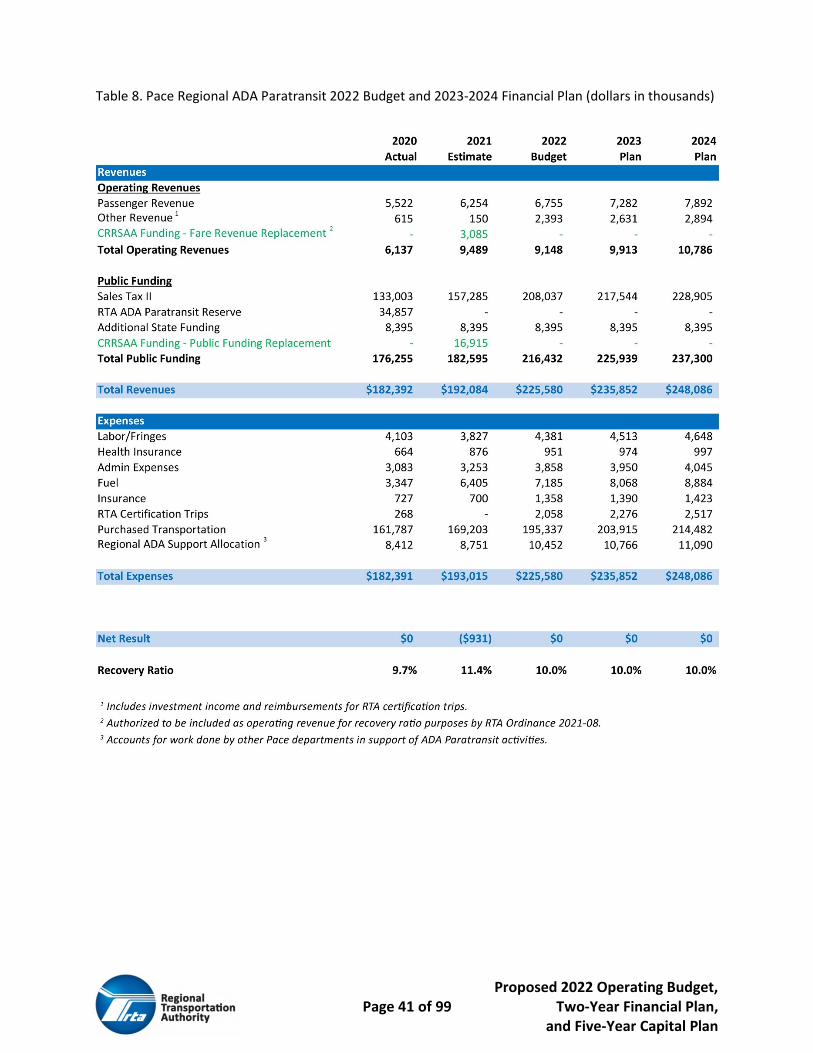
Pace ADA Paratransit Operating Budget The COVID-19 pandemic had an immediate and outsized impact on Pace’s ADA Paratransit operation. To protect customers from the risk of infection, Pace suspended shared rides, which effectively undid years of efficiency gains which Pace had achieved. Although shared rides are being gradually restored, ADA Paratransit contractor expenses have increased significantly due to new minimum wage requirements in the City of Chicago, resulting in a cost per ride projection which is well above pre-COVID levels. To mitigate the impact of this, Pace has placed renewed emphasis on the lower cost Taxi Access Program (TAP), maintaining free fares to divert some demand away from the more expensive traditional ADA Paratransit service. Although the RTA ADA Paratransit reserve was tapped in 2020 to maintain a sufficient level of overall funding due to the impact of the pandemic, only Sales Tax II and State funding are utilized to meet Pace’s ADA Paratransit funding requirements for the 2022 budget and 2023-2024 planning period.
Ridership ADA Paratransit ridership declined sharply at the onset of the COVID-19 pandemic and stay-at-home order in March 2020, and finished 2020 at about 60% of 2019 levels. Ridership in 2021 has recovered to 70% of pre-COVID levels, and Pace’s proposed budget projects that ADA Paratransit ridership, including companions, will rebound further in 2022 to 3.3 million, or about 77% of pre-COVID annual ridership. Total ridership is projected to continue recovering in 2023 and 2024, reaching 4.1 million or 96% of pre-COVID levels by the end of the planning period.
Figure 25. Pace ADA Paratransit Ridership (millions)
Within the overall ADA Paratransit ridership, TAP ridership is forecast at 755,000 in 2021, more than triple the 2019 level, as Pace continues to emphasize that mode as a cost-effective alternative to traditional ADA Paratransit service. TAP ridership is assumed to grow rapidly in 2022 and beyond, reaching 1.3 million annual rides by the end of the planning period, representing about 32% of all ADA Paratransit rides.

Proposed 2022 Operating Budget, Page 37 of 99 Two-Year Financial Plan, and Five-Year Capital Plan
Fares No fare increase has been proposed by Pace for 2022, so the base ADA Paratransit fare will remain at $3.25. The TAP fare of $3.00 was waived during the height of the COVID-19 pandemic, and Pace’s 2022 budget maintains free rides on TAP through 2024, contributing to the strong projected TAP ridership growth. The growing share of free TAP rides pulls down the average fare for all ADA Paratransit rides across the budget and planning period, reaching $1.92 by 2024. Note that TAP rides have a positive impact on cost efficiency and effectiveness as explained below.
Figure 26. Pace ADA Paratransit Average Fare
Service Levels ADA Paratransit service levels are driven by customer demand. Pace projects that ADA Paratransit vehicle revenue miles will increase by 9% to 24.3 million in 2022, less than the projected ridership increase, as some of the efficiencies lost during the pandemic (i.e., shared rides) are regained. As a result, service effectiveness, as measured by passenger trips per VRM, is expected to gradually increase across the three-year planning period, nearing pre-COVID levels by 2024.
Figure 27. Pace ADA Paratransit Passenger Trips Per Vehicle Revenue Mile

Proposed 2022 Operating Budget, Page 38 of 99 Two-Year Financial Plan, and Five-Year Capital Plan
Operating Revenue Pace projects that 2022 ADA Paratransit operating revenues will decrease by 3.6% to $9.2 million, due to the absence of CRRSAA relief funding, which is expected to be fully drawn down in the 2021 base year. However, fare revenue is expected to increase to $6.8 million in line with ridership, and ancillary revenue is assumed to increase sharply to $2.4 million due to the restoration of payments for RTA certification trips as in-person assessments resume. Operating revenue comprises only about 4% of Pace’s total revenue for operations, with the balance provided by public funding sources.
Figure 28. Pace ADA Paratransit 2022 Revenues: $225.6 Million
Public Funding In 2011, the RTA Act was amended to require that ADA Paratransit operations are fully funded by the RTA each year. In the 2022 budget, Pace projects an ADA Paratransit funding need of $216.4 million, a 19% increase from the estimated 2021 funding level, which will be satisfied by Sales Tax II funds of $208.0 million and continued State funding of $8.4 million. Due to the ongoing impacts of COVID-19 on ridership and cost efficiency, there is again considerable uncertainty in the 2022 funding requirement. If additional ADA funding is needed, the RTA Board may be asked to approve the use of ADA Paratransit reserve funds or an additional sales tax allocation. However, Pace’s two-year financial plan indicates that adopted RTA funding levels should be sufficient for 2023 and 2024, if Pace’s ridership assumptions hold true.
Expenses Pace projects that 2022 operating expenditures for ADA Paratransit will increase by $32.6 million, or 16.9%, to $225.6 million, balanced with revenue, followed by increases of 4.6% and 5.2% in 2023 and 2024, respectively. Purchased transportation, which accounts for more than 85% of total ADA Paratransit expenses, is budgeted to increase by 15.4% in 2022, and the regional ADA support allocation, which accounts for work done by other Pace departments in support of ADA Paratransit, is projected at $10.5 million, an increase of almost 20% from 2021.
Proposed 2022 Operating Budget, Page 39 of 99 Two-Year Financial Plan, and Five-Year Capital Plan
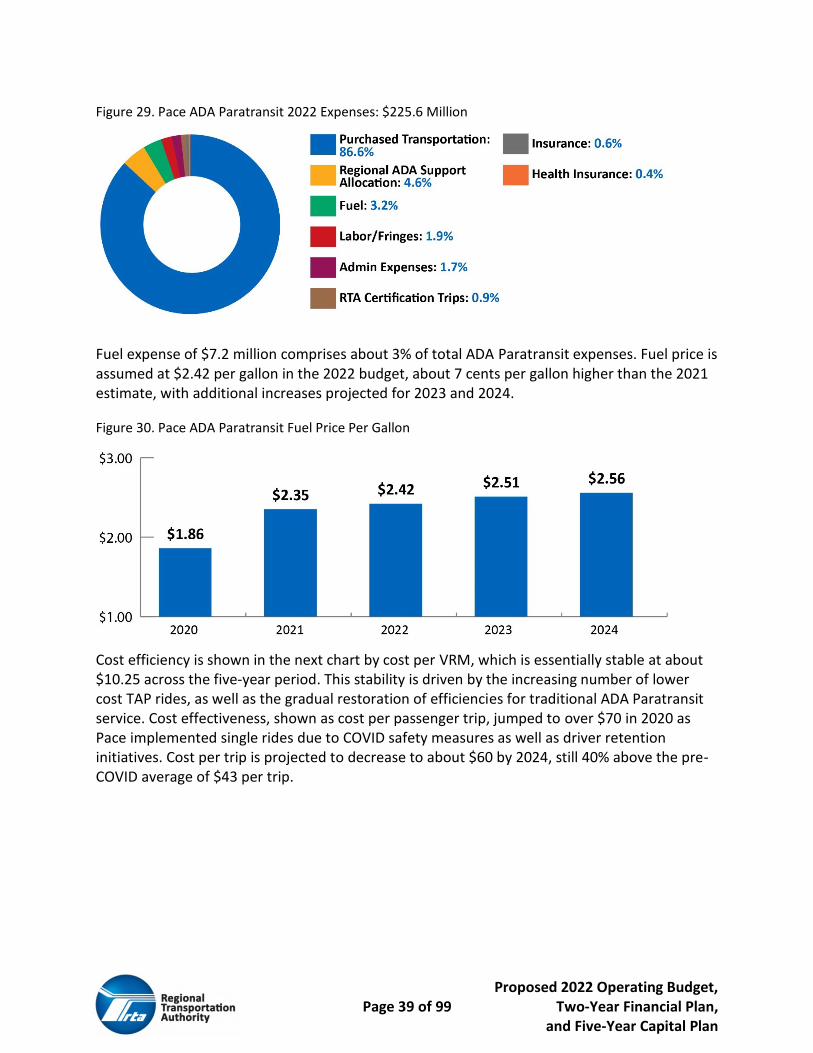
Figure 29. Pace ADA Paratransit 2022 Expenses: $225.6 Million
Fuel expense of $7.2 million comprises about 3% of total ADA Paratransit expenses. Fuel price is assumed at $2.42 per gallon in the 2022 budget, about 7 cents per gallon higher than the 2021 estimate, with additional increases projected for 2023 and 2024.
Figure 30. Pace ADA Paratransit Fuel Price Per Gallon
Cost efficiency is shown in the next chart by cost per VRM, which is essentially stable at about $10.25 across the five-year period. This stability is driven by the increasing number of lower cost TAP rides, as well as the gradual restoration of efficiencies for traditional ADA Paratransit service. Cost effectiveness, shown as cost per passenger trip, jumped to over $70 in 2020 as Pace implemented single rides due to COVID safety measures as well as driver retention initiatives. Cost per trip is projected to decrease to about $60 by 2024, still 40% above the pre-COVID average of $43 per trip.

Proposed 2022 Operating Budget, Page 40 of 99 Two-Year Financial Plan, and Five-Year Capital Plan
Figure 31. Pace ADA Paratransit Cost Efficiency and Effectiveness
Federal Relief and Additional Funding Need Although no federal CARES Act funding was allocated to ADA Paratransit, in March 2021 Pace was allocated $20.0 million of CRRSAA funding to support ADA Paratransit operations during the ongoing recovery. Pace anticipates that this CRRSAA allocation will be fully drawn down in 2021. Since Pace’s projected ADA Paratransit funding requirements for 2022 through 2024 are currently fully met by adopted RTA sales tax and State funding amounts, no additional federal relief funding is expected to be needed for ADA Paratransit through 2024.
Net Result and Recovery Ratio As shown in Table 8, the proposed Regional ADA Paratransit operating budget is balanced in 2022 through 2024, with revenues equal to expenditures, producing a net result of zero in each year. Pace is currently estimating a $0.9 million shortfall for 2021, which could be addressed at year-end by use of the RTA’s ADA Paratransit Reserve, if needed, subject to the authorization of the RTA Board. Pace’s 2022 through 2024 recovery ratios, calculated by dividing total operating revenue by total operating expenditures, with approved adjustments, meet the statutory requirement of 10%. Pace’s capital cost of contracting expense exclusion of $89.8 million in 2022 recognizes that a portion of Pace’s purchased transportation expense represents payment to ADA Paratransit contractors for their capital investments, rather than their operating expenses. An additional security expense exclusion of $17.1 million was applied to account for efficiency losses due to the provision of single rides to protect customers from the risk of COVID-19 infection.
Proposed 2022 Operating Budget, Page 41 of 99 Two-Year Financial Plan, and Five-Year Capital Plan
Table 8. Pace Regional ADA Paratransit 2022 Budget and 2023-2024 Financial Plan (dollars in thousands)

Proposed 2022 Operating Budget, Page 42 of 99 Two-Year Financial Plan, and Five-Year Capital Plan
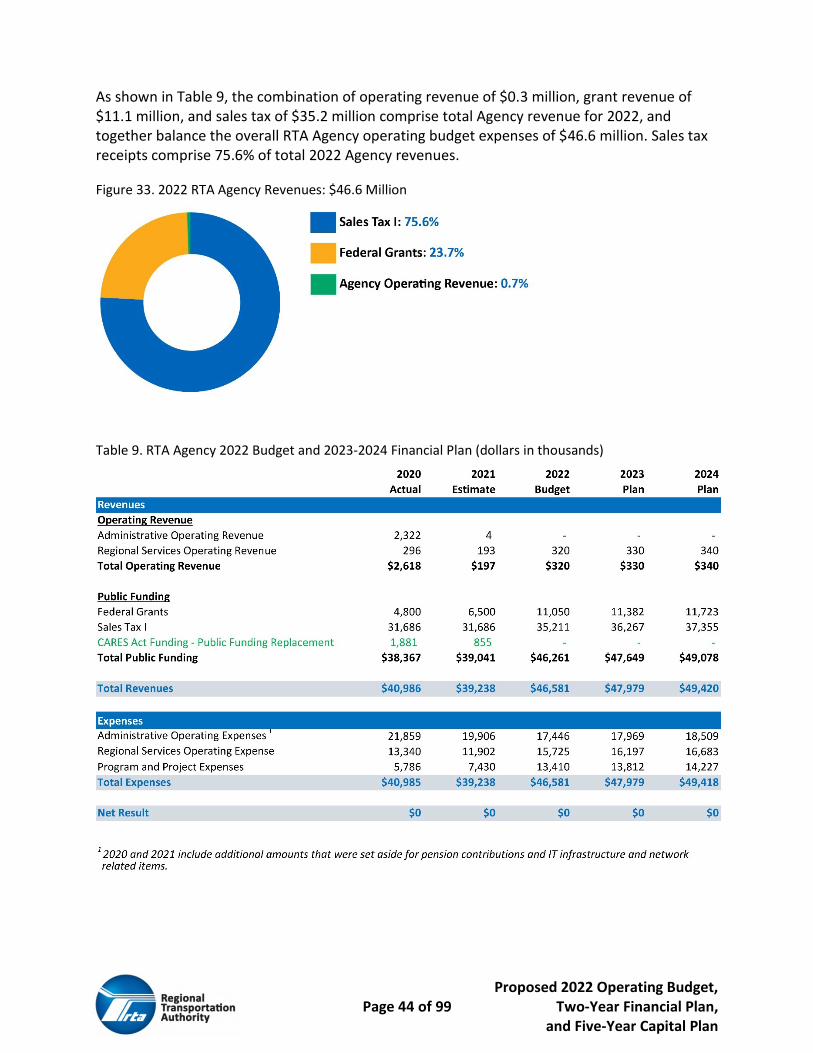
RTA Agency Operating Budget In response to reduced RTA sales tax levels caused by the COVID-19 pandemic, the RTA Agency budget funding level was reduced by 10%, from $35.2 million to $31.7 million, in May 2020. Cost savings of $3.5 million were implemented with the August 2020 budget amendment, and this reduced funding level was maintained for the 2021 Agency budget. Due to improving sales tax performance, the 2022 Agency budget funding level has been restored to the pre-COVID level of $35.2 million to fund RTA COVID recovery initiatives such as the strategic plan update and regional transit advocacy in the proposed 2022 Agency budget. The regional programs budget also includes services provided to the public, such as ADA certification, travel training, and ongoing RTA customer service. This funding level is still $2.1 million or 5% below the funding level anticipated in the pre-COVID 2022 Plan. The funding levels for 2023 and 2024 assume 3% annual growth.
Background The RTA is the oversight, funding, and regional planning agency for the three Service Boards: CTA bus and rail, Metra Commuter Rail, and Pace and Regional ADA Paratransit. The RTA’s primary source of operating funding is a regional sales tax which is matched by the State of Illinois via the Public Transportation Fund (PTF). Most of the RTA sales tax collections and PTF pass directly through the RTA to CTA, Metra, and Pace according to pre-determined, statutory formulas. The remainder of the sales tax and PTF is distributed at the direction of the RTA Board. A portion of this funding covers the RTA agency administrative costs, regional services and programs, and regional debt service expense. The 2022 Agency operating budget was developed in two parts to continue the RTA’s support of regional programs and services. First is the RTA Agency Administration Budget, which includes the core agency expenses for staff, facilities, information technology, office services, and professional services to support the funding, planning, and oversight mission of the RTA. Second is the RTA Regional Programs Budget, which includes Regional Services provided directly to the public by the RTA such as ADA Certification, Mobility Management Services, Travel Information, Customer Service, and the Reduced Fare and Transit Benefit Programs. The Regional Programs Budget also includes all the RTA’s grant-funded projects, RTA-funded regional studies and initiatives, and regional capital programs.
RTA Agency Administration Budget In 2022, total Agency Administration operating expenses of $17.4 million are $2.5 million or 12.4% lower than the 2021 estimate. The 2022 Administration Budget accounts for 37.5% of RTA Agency expenses and is 42.6% below the 2022 administrative expense cap of $30.4 million set by the RTA Act. Administration expenses are expected to increase by 3% in 2023 and 2024 respectively.

Proposed 2022 Operating Budget, Page 43 of 99 Two-Year Financial Plan, and Five-Year Capital Plan
RTA Regional Programs Budget In 2022, total Regional Programs revenue of $11.4 million is comprised of Regional Services Operating Revenue of $0.3 million and federal grants for Regional Projects totaling $11.1 million. The grant revenue for Regional Projects is $4.6 million greater than the 2021 estimate. Total Regional Programs expenses of $29.1 million, the sum of the Regional Services Operating Expense and the Grant and RTA Funded Project Expenses, comprise the remaining 62.5% of total RTA Agency expenses. This amount is $9.8 million higher than the 2021 estimate due primarily to a much lower Purchased Service expense in 2021 for the ADA Certification Program. Due to COVID-19, there were no in-person Pace ADA site trips provided to the certification centers. In 2022, overall Regional Services expenses of $15.7 million reflect the pre-pandemic spending level as well as a new vendor contract and are projected to be $3.8 million or 32.1% higher than the 2021 estimate. Regional Programs of $13.4 million are also budgeted $6.0 million higher than the 2021 estimate due to a much higher federally funded 5310 projects and other RTA initiatives, such as strategic plan update, COST Tool update, Regional Transit Advocacy, new RTA website development, and increased community planning projects. The overall RTA Agency operating expense of $46.6 million is projected to be 18.7% higher than the 2021 estimate, primarily due to an increase in Regional Services operating expense and Grant-Funded Program expense, partially offset by lower Administration expense. The overall Agency expense level is budgeted to increase by 3% in 2023 and in 2024 respectively.
Figure 32. 2022 RTA Agency Expenses: $46.6 Million
Sales Tax and CARES Act Funding The RTA Agency was allocated $28.8 million, or 2.0%, of the $1.438 billion total federal CARES Act funding awarded to the RTA region. CARES Act drawdowns supported $1.9 million of eligible Agency expenses in 2020, with an additional $0.9 million projected to support eligible Agency expenses in 2021. The remaining $26.0 million of RTA’s CARES Act apportionment is being utilized to support eligible RTA expenses outside of the Agency budget, such as interest on short-term borrowing and Joint Self-Insurance Fund (JSIF) premiums. Sales tax levels for 2022 and beyond appear more than sufficient to meet Agency budget funding requirements, so no need currently exists for additional relief funding for the RTA Agency.
Proposed 2022 Operating Budget, Page 44 of 99 Two-Year Financial Plan, and Five-Year Capital Plan
As shown in Table 9, the combination of operating revenue of $0.3 million, grant revenue of $11.1 million, and sales tax of $35.2 million comprise total Agency revenue for 2022, and together balance the overall RTA Agency operating budget expenses of $46.6 million. Sales tax receipts comprise 75.6% of total 2022 Agency revenues.
Figure 33. 2022 RTA Agency Revenues: $46.6 Million
Table 9. RTA Agency 2022 Budget and 2023-2024 Financial Plan (dollars in thousands)

Proposed 2022 Operating Budget, Page 45 of 99 Two-Year Financial Plan, and Five-Year Capital Plan
Regional Capital Program Capital programming is a core function of the RTA. Section 2.01b of the RTA Act (70 ILCS 3615/) requires the RTA Board to annually adopt a Five-Year Regional Capital Program that is guided by a strategic plan (Invest in Transit) and is fiscally constrained by the annual budget and two-year financial plan. Once the capital program is adopted, the expenditures of CTA, Metra, and Pace are subjected to continual review, so that the RTA may budget and ensure that funds available to the region are spent with maximum efficiency. The purpose of this document is to fulfill the RTA’s statutory requirements and equally importantly, to provide insights into the strategic benefits of transit capital investment underway in the region. For the last several years, the RTA and the Service Boards have been working together to articulate and advance a regional transit capital strategy. Invest in Transit emphasizes the importance of transit in northeastern Illinois and the related infrastructure investment for the three transit Service Boards. It includes a vision, goals, and priority projects that the RTA and the Service Boards are committed to advancing with additional capital funding. The enactment of the Rebuild Illinois program in June 2019 provided the RTA system with $2.6 billion in bond funding, which was programmed in 2020 and 2021. Additionally, an estimated $227 million in ongoing annual gas tax revenue is available to fund capital projects, referred to as “PAYGO.” The PAYGO funding infusion is focused on addressing state of good repair and other maintenance needs of the regional transit network. Despite the COVID-19 pandemic, the RTA and Service Boards continued to execute the capital program including granting funds and constructing projects. Throughout 2021, the RTA and the Service Boards worked together with the Illinois Department of Transportation (IDOT) to implement the Rebuild Illinois program, which includes bond funds as well as PAYGO. In 2021, the remainder of Rebuild Illinois bond funds were granted to the Service Boards, which helped to begin advancing several key projects in the region. Furthermore, IDOT and RTA granted $227 million in 2021 PAYGO funds to the three Service Boards. Those dollars will continue to fund capital maintenance projects and enhancements that will improve the state of good repair. The third round of PAYGO grants will be executed in 2022. Finally, the RTA and the Service Boards drafted a new method for allocating federal formula and state PAYGO funds. This performance‐based capital allocation process distributes funds based on need, project delivery timing, and regional priorities. The new approach better matches Service Board needs, puts a focus on equity and accessibility projects and incentivizes the Service Boards to deliver projects to the region in a timely manner. The new allocation method, described on page 49, begins with federal formula and PAYGO funds programmed in 2025 and 2026.
Proposed 2022 Operating Budget, Page 46 of 99 Two-Year Financial Plan, and Five-Year Capital Plan
Related Legislation
State The State of Illinois enacted legislation in September 2021 requiring a transparent prioritization process for northeastern Illinois transit projects receiving state capital funds, which considers, at a minimum:
• Access to key destinations such as jobs, retail, healthcare, and recreation
• Reliability improvement
• Capacity needs
• Safety
• State of good repair
• Racial equity and mobility justice
• Economic development
Several regional plans and processes are already in place to guide the transit capital programming process, as described in the Draft Framework for Transit Capital Investments, developed by RTA in 2020. Figure 34 describes the many considerations that go into transit capital programming at RTA and the Service Boards, as outlined in regional plans and agency documents. RTA is currently reviewing the criteria outlined in the new state legislation alongside current processes and criteria to determine where alignment is already occurring and where there are opportunities to better match with the new state legislation in future programming and reporting efforts.
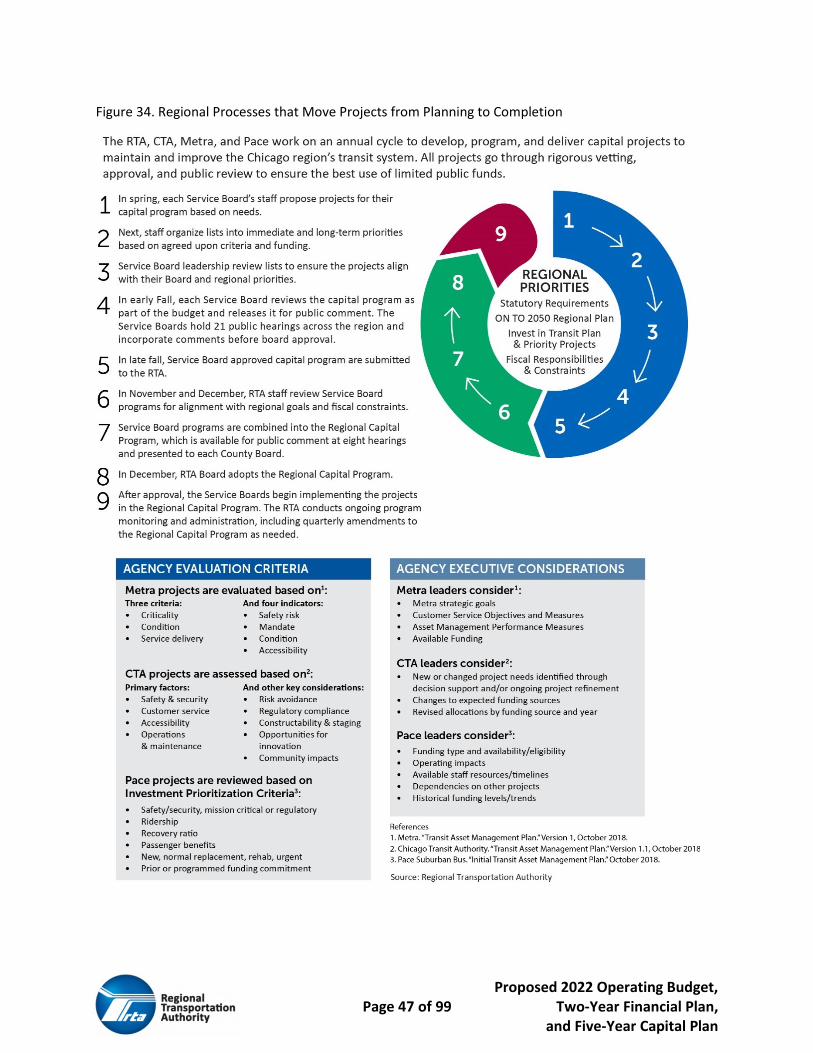
Proposed 2022 Operating Budget, Page 47 of 99 Two-Year Financial Plan, and Five-Year Capital Plan
Figure 34. Regional Processes that Move Projects from Planning to Completion

Proposed 2022 Operating Budget, Page 48 of 99 Two-Year Financial Plan, and Five-Year Capital Plan
Federal With the federal surface transportation authorization, the FAST Act set to expire at the end of the 2021 federal fiscal year, the U.S. Senate passed a $1.2 trillion, bipartisan infrastructure bill entitled the Infrastructure Investment and Jobs Act by a vote of 69-30 on August 10, 2021. Months later, on November 5, 2021, the U.S. House of Representatives passed the legislation. President Joe Biden has not yet signed the bill into law as of this document. The Infrastructure Investment and Jobs Act is a significant investment in the nation’s transit infrastructure providing for $106.9 billion in public transit funding over five years, an increase of $41.1 billion or 63% from FAST Act spending levels. The bill includes $8.9 billion in increased Urbanized Area formula grant funding over the previous authorization and $4.9 billion in State of Good Repair formula funding over FAST Act levels. The legislation also authorizes several new transit discretionary programs including a new State of Good Repair discretionary program set at $300 million per year that will get awarded to three applicants per year as well as a new $1.75 billion discretionary program for station accessibility entitled the All Stations Accessibility Program.
Progress Toward Transparency and Performance-Based Programming in Capital Investment Throughout 2021, the RTA and the Service Boards continued work toward improving the transparency of capital programming and the use of data to understand the impacts of the program on strategic priorities by forming a performance-based capital allocations process working group. The group met several times throughout the year and established a performance-based allocation structure for federal formula and PAYGO funds in years 2025, 2026, and beyond. The RTA Board approved the allocation structure at the July 15, 2021, board meeting and the estimated funding distribution when they met on September 15, 2021. According to the approved structure, the split of funds between Service Boards is based on their respective proportions of the funds needed to bring all assets in the region into state of good repair in 20 years. The structure is applied beginning with the 2025 allocation. Beginning with the 2026 program year, capital performance expenditure targets have also been applied to encourage timely delivery of projects to the region. Service Boards that do not meet the expenditure targets will have an adjustment made to their allocation. Funds that are not distributed will be held in a regional reserve. For the 2026 allocation, approved in September, some funds are being held in reserve for future distribution, based on targets not being met. RTA staff are developing a method of redistribution, in collaboration with the Service Boards. To advance policy priorities, a final part of the performance-based capital allocation is programming projects that meet the core requirements of achieving full accessibility and improving equity. The Service Boards must program at least 20% of the 2025 and 2026 federal formula and PAYGO funds to projects that meet one or both of those core requirements. The

Proposed 2022 Operating Budget, Page 49 of 99 Two-Year Financial Plan, and Five-Year Capital Plan
projects meeting these requirements are outlined throughout this section and in Appendix A: Priority Project Scope Detail.
Goals and Requirements for the Five-Year Regional Capital Program The 2022-2026 Capital Program continues to focus on the core requirements, strategic goals, and priority projects established in Invest in Transit. These provide three lenses for analyzing the capital program and understanding how it is accomplishing strategic objectives of the agencies.
Strategic Goals Invest in Transit’s strategic goals capture the RTA’s and Service Boards’ shared priorities. The strategic goals, and what they mean for capital programming, are as follows:
• Deliver value on our investment. This goal focuses on fiscal responsibility and maximizing the region’s investments in transit. Investment in this category might include replacing vehicles and facilities that are beyond their useful life to bring the regional system into a state of good repair.
• Build on the strengths of our network. This goal focuses on improvements to the transit system in six high-priority markets: The Chicago Central Business District, Chicago North Side, Chicago South Side and Southland, Suburban Cook County, Suburban Employment Centers, and ADA Paratransit. Investment in this category might include new technology and infrastructure to increase service capacity where it is needed, improved facilities and technologies for more seamless connections between services, or investments to provide transit workers the tools and training necessary to maintain around-the-clock operations.
• Stay competitive. This goal focuses on the ability of the transit system to satisfactorily meet customer needs and attract riders to the services. Investment in this category might include facilities and technologies to improve bus speeds and reliability, advancements in Ventra payment and Mobility-as-a-Service initiatives, or technologies that enable improved bus and rail reliability.
By continuing to incorporate the Invest in Transit strategic goals to describe the regional capital program and the individual Service Board’s capital program sections, the RTA and the Service Boards demonstrate how the current program of capital investments will assist in achieving the strategic priorities of the region.
Core Requirements The core requirements are central to the activities of the Service Boards. They are noted in Invest in Transit and are non-negotiable elements of agency operations that transcend immediate areas of focus. The Service Boards expend capital dollars to meet these requirements, and thus RTA is committed to addressing them through the regional capital
Proposed 2022 Operating Budget, Page 50 of 99 Two-Year Financial Plan, and Five-Year Capital Plan
programming process. These core requirements and their implications for the capital program include:
• Maintain and improve safety and reliability. This core requirement is focused on infrastructure improvements that improve the safety of passengers and staff, as well as security of the system. Investment in this category might include new and enhanced camera and communication systems, improved lighting at stations and facilities, or technologies for improved incident response. Ensuring that aging assets are maintained and replaced when needed to maintain the continuity of safe and reliable operations throughout the existing regional transit system is of paramount of importance to regional and Service Board capital programming processes.
• Achieve full accessibility. The agencies have been working for years to achieve full accessibility of the transit system to all riders, including those with physical disabilities. Investment in this category might include station and facility reconstructions to fully meet accessibility needs, replacement of aged elevators, new and upgraded signage and wayfinding systems, improvements for accessing bus stops and stations, or technology innovations to provide improved access to people with disabilities.
• Improve equity. Some types of investments improve access to transit and access to opportunities across the large and diverse RTA region. This might include providing improvements to serve residents of low income and disinvested neighborhoods with reconstructed facilities or enabling new services to increase access to jobs and opportunities.
• Meet regulatory requirements. Meeting regulatory requirements that make the northeastern Illinois transit system safer and more accessible is an ongoing programming need. Investment in this category might include new systems such as Metra’s required $400 million investment in Positive Train Control (PTC), new vehicle standards to meet crash or emission requirements, or technology to support security or reporting requirements.
As stated above, the core requirements selected as a focus for the performance-based programming measures are achieve full accessibility and improve equity.
Priority Projects Finally, the priority projects are a set of core capital initiatives largely focused on bringing the regional transit system nearer to a state of good repair, as well as advancing limited expansions in growing markets. This list is updated each year during the capital programming process. In describing the capital program through the lens of priority projects, the RTA and the Service Boards provide transparency around how many projects and how much funding is needed to advance each of these specific projects.

Proposed 2022 Operating Budget, Page 51 of 99 Two-Year Financial Plan, and Five-Year Capital Plan
Summary The core requirements, strategic goals, and priority projects defined in Invest in Transit are shared priorities for the transit agencies that can be applied to understand the current capital program.
2022-2026 Regional Capital Program and 2022 Regional Capital Program
2022-2026 Capital Funding by Source The 2022-2026 Regional Capital Program includes $5.261 billion in funding. After accounting for CTA debt-service payments, the region has $4.164 billion for capital projects in the five-year program. Table 10 shows the breakdown of funding sources by Service Board in the program.
Table 10. 2022-2026 Regional Capital Program Funding (dollars in thousands)
CTA Metra Pace RTA Total % of Total
Funding Sources
Federal Funds 2,040,142 980,224 214,585 - 3,234,951 61.5%
PAYGO Funds 696,663 370,237 67,890 210 1,134,790 21.6%
RTA Innovation, Coordination, & Enhancement (ICE)
- 17,024 5,674 - 22,908 0.4%
Service Board and Other Local Funds 525 - 1,000 323 1,848 0.04%
State Bond Funds - - - - - 0.0%
Sub-Total Non-Bond Funds $2,737,330 $1,367,485 $289,150 $533 $4,394,497 83.5%
RTA Bond Proceeds - 130,000 - - 130,000 2.5%
CTA Bond Proceeds 736,590 - - - 736,590 14.0%
Pace Bond Proceeds - - - - - 0.0%
Sub-Total Bond Funds $736,590 $130,000 - - $866,590 16.5%
Total Capital Funding $3,473,919 $1,497,485 $289,150 $533 $5,261,087 100.0%
Debt Service/ Financing Cost
(1,096,837) - - - (1,096,837)
Total Capital Funding Available $2,377,083 $1,497,485 $289,150 $533 $4,164,250
The $5.261 billion in funding is 17.1% less than the 2021-2025 Capital Program. Unlike 2020 and 2021, when two major state funding sources were available, Rebuild Illinois bond funds and PAYGO, in 2022 there are no remaining funds to be programmed from the Rebuild Illinois Bond Program. The full $2.6 billion of Rebuild Illinois bonds was programmed and granted to the Service Boards in 2020 and 2021, leaving PAYGO as the only state funding source available in 2022-2026 capital program. The Rebuild Illinois bonds, though completely programmed, will contribute to projects being delivered over the next five years. As the Rebuild Illinois bond funding is drawn down, the RTA will continue to work with the state to develop additional state capital funding, to supplement PAYGO dollars and to provide reliable funds to maintain the region’s transit system.

Proposed 2022 Operating Budget, Page 52 of 99 Two-Year Financial Plan, and Five-Year Capital Plan
The 2022-2026 Capital Program includes a funding mix of federal, state, RTA, and local sources. Funding is divided as follows: 61.5% federal funds, 21.6% state PAYGO funds, 14.0% CTA bond funds, 2.5% RTA bond funds, and nearly 0.5% RTA ICE and other local funding sources. Figure 35 shows the funding source split of the entire 2022-2026 Capital Program.
Figure 35. 2022-2026 Capital Funding: $5.261 Billion
2022 Annual Capital Program Funding For 2022, the total regional funds are $1.394 billion. After deducting $332.0 million of CTA debt service payments, on previously issued bonds, an estimated amount of $1.062 billion is available for the year. These funds come from the following sources: 47.0% federal, 36.2% CTA bonds, 16.3% PAYGO, 0.5% RTA ICE, and 0.1% other local funds. CTA bonds represent a large portion of 2022 available funds, as CTA pushed back a planned 2021 bond issuance. CTA may be able to reduce the need for bond issuances in 2022 if a new federal infrastructure bill is passed. Table 11 and Figure 36 show the split of funds by Service Board and funding source for 2022.
Table 11. 2022 Annual Regional Capital Program Funding (dollars in thousands)
CTA Metra Pace RTA Total % of Total
Funding Sources
Federal Funds 430,223 181,650 42,741 - 654,614 47.0%
PAYGO Funds 141,875 73,775 11,350 - 227,000 16.3%
RTA Innovation, Coordination, & Enhancement (ICE)
- 5,530 1,843 - 7,373 0.5%
Service Board and Other Local Funds
105 - 1,000 323 1,428 0.1%
State Bond Funds - - - - - 0.0%
Sub-Total Non-Bond Funds
$572,203 $260,955 $56,934 $323 $890,416 63.9%
RTA Bond Proceeds - - - - - 0.0%
CTA Bond Proceeds 504,090 - - - 504,090 36.2%
Pace Bond Proceeds - - - - - 0.0%
Sub-Total Bond Funds $504,090 - - - $504,090 36.1%

Proposed 2022 Operating Budget, Page 53 of 99 Two-Year Financial Plan, and Five-Year Capital Plan
CTA Metra Pace RTA Total % of Total
Funding Sources
Total Capital Funding $1,076,293 $260,955 $56,934 $323 $1,394,506 100.0%
Debt Service/Financing Cost
(332,022) - - - (332,022)
Total Capital Funding Available
$744,271 $260,955 $56,934 $323 $1,062,484
Figure 36. 2022 Capital Funding: $1.394 Billion
With all the Rebuild Illinois bond funds programmed, the state share of the 2022 program is reduced to 16.3%. RTA continues to work with the state to implement and construct the projects in the Rebuild Illinois bond fund program, as well as explore other sustainable capital revenue sources at the state and federal level.
Capital Funding by Priority Project The following section presents the 2022-2026 Capital Program through the lens of priority projects identified by the Service Boards through Invest in Transit and subsequent annual updates. All current priority projects, as identified by the Service Boards, are included in the analysis, whether or not they will receive funding in the five-year capital program. In addition, there are administrative categories for activities required to execute the proposed capital projects, as well as a category for projects that do not fall into any of the priority projects, called uncategorized projects. These categories of projects (administrative and uncategorized) are shown in the summary tables and are included in the 10-year need, but they are not included in the count of priority projects. The 10-year regional capital funding need is $36.2 billion. Notably, the current 2022-2025 capital program only funds 14.5% of the total 10-year need. If similar funding levels were to continue over the 10-year period only 29% of the need would be funded. Appendix A: Priority Project Scope Detail shows all the priority projects, the funding level in the 2022-2026 Capital Program, and the 10-year funding need.

Proposed 2022 Operating Budget, Page 54 of 99 Two-Year Financial Plan, and Five-Year Capital Plan
The Service Boards have identified 75 priority projects, of which four have been fully funded. Twenty-five (25) do not receive any funding in the 2022-2026 capital program. This leaves many priority projects unfunded in the current program and shows that additional funding is necessary to meet the needs of the region’s transit system and users. While the 2022-2026 program offers a robust amount of funding, more is needed. The regional estimate is that more than $3 billion is required annually to maintain and expand the system to meet the needs of the region. With that in mind, the RTA further analyzed the proposed projects using two different lenses, strategic goals, and core requirements, detailed in Goals and Requirements for the Capital Program section above. Appendix A Priority Project Details also identifies and describes all the projects included in the Capital Program, with details of project funding, strategic goals, and core requirements.
Strategic Goals The three strategic goals of Invest in Transit are to deliver value on our investment, build on the strengths of our network, and stay competitive. Each project contained in the 2022-2026 capital program has been assigned, by the Service Boards, to one of the three goals to demonstrate how this capital spending will assist in achieving the intended strategic investments of the region. There are 267 projects in the 2022-2026 capital program. The largest group of projects, 59% (157 projects) are assigned to build on the strengths of our network, while 35% (95 projects) have the goal of deliver value on our investment, and 6% (15 projects) help the system stay competitive, as shown in Figure 37.Figure Many of the projects in the capital program are designed to keep the system maintained and those types of projects have the goals of either build on strengths of our network or deliver value on investment.
Figure 37. Number of Service Board Capital Projects Advancing Each Strategic Goal
Viewing funding by strategic goal shows a different distribution, as shown in Figure 38. Deliver value on investment comprises 58% ($3.046 billion) of funds, 38% ($2.005 billion) of funds have a goal of build on strengths of our network, and 4% ($208.9 million) of funds are to stay competitive. This shows that while there are fewer projects focused on delivering value on our
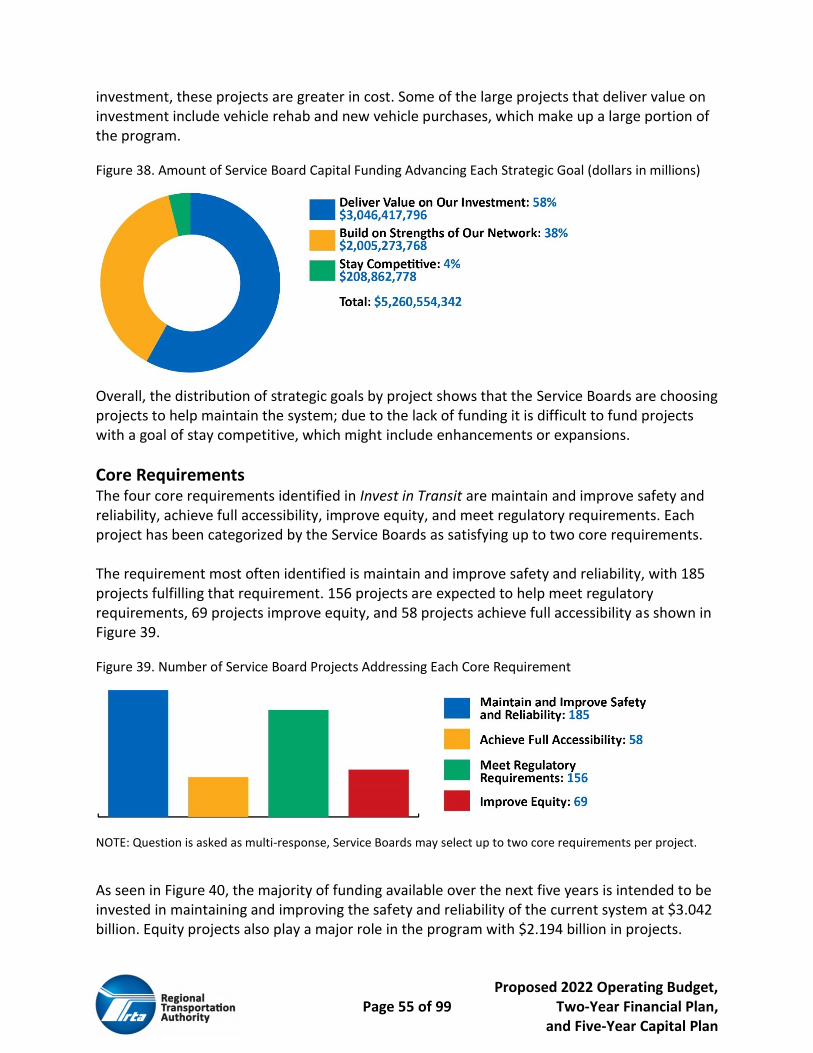
Proposed 2022 Operating Budget, Page 55 of 99 Two-Year Financial Plan, and Five-Year Capital Plan
investment, these projects are greater in cost. Some of the large projects that deliver value on investment include vehicle rehab and new vehicle purchases, which make up a large portion of the program.
Figure 38. Amount of Service Board Capital Funding Advancing Each Strategic Goal (dollars in millions)
Overall, the distribution of strategic goals by project shows that the Service Boards are choosing projects to help maintain the system; due to the lack of funding it is difficult to fund projects with a goal of stay competitive, which might include enhancements or expansions.
Core Requirements The four core requirements identified in Invest in Transit are maintain and improve safety and reliability, achieve full accessibility, improve equity, and meet regulatory requirements. Each project has been categorized by the Service Boards as satisfying up to two core requirements. The requirement most often identified is maintain and improve safety and reliability, with 185 projects fulfilling that requirement. 156 projects are expected to help meet regulatory requirements, 69 projects improve equity, and 58 projects achieve full accessibility as shown in Figure 39.
Figure 39. Number of Service Board Projects Addressing Each Core Requirement
NOTE: Question is asked as multi-response, Service Boards may select up to two core requirements per project.
As seen in Figure 40, the majority of funding available over the next five years is intended to be invested in maintaining and improving the safety and reliability of the current system at $3.042 billion. Equity projects also play a major role in the program with $2.194 billion in projects.
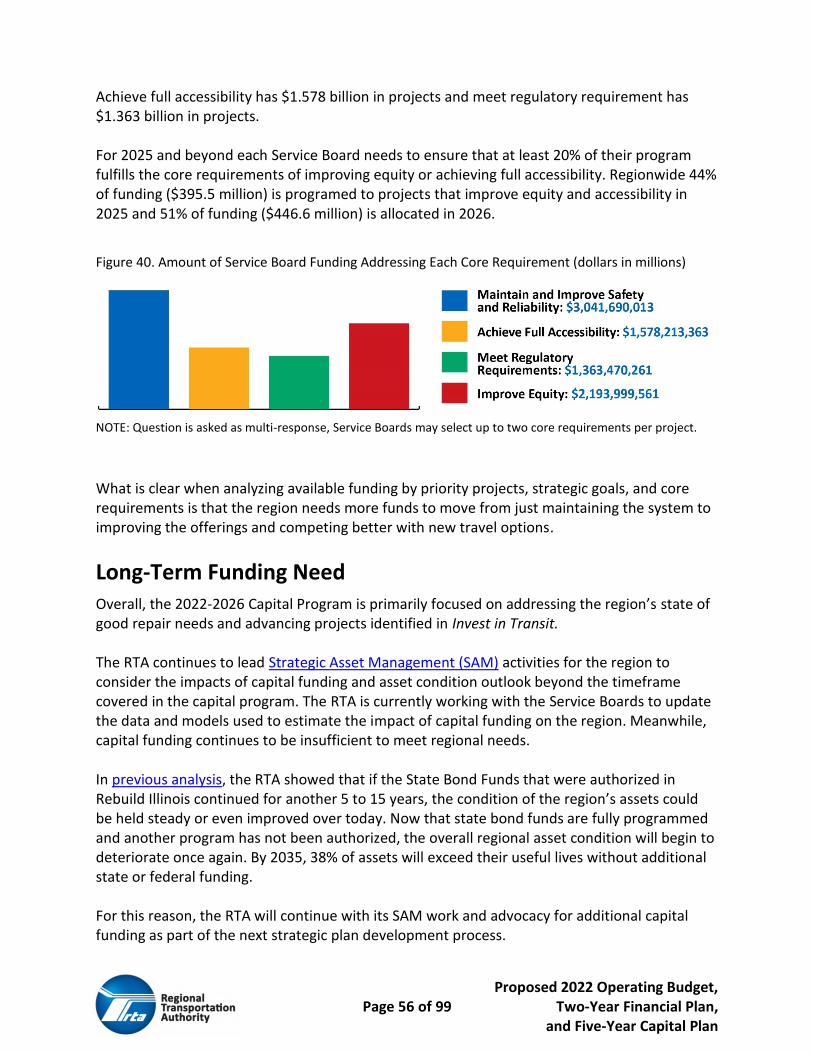
Proposed 2022 Operating Budget, Page 56 of 99 Two-Year Financial Plan, and Five-Year Capital Plan
Achieve full accessibility has $1.578 billion in projects and meet regulatory requirement has $1.363 billion in projects. For 2025 and beyond each Service Board needs to ensure that at least 20% of their program fulfills the core requirements of improving equity or achieving full accessibility. Regionwide 44% of funding ($395.5 million) is programed to projects that improve equity and accessibility in 2025 and 51% of funding ($446.6 million) is allocated in 2026.
Figure 40. Amount of Service Board Funding Addressing Each Core Requirement (dollars in millions)
NOTE: Question is asked as multi-response, Service Boards may select up to two core requirements per project.
What is clear when analyzing available funding by priority projects, strategic goals, and core requirements is that the region needs more funds to move from just maintaining the system to improving the offerings and competing better with new travel options.
Long-Term Funding Need Overall, the 2022-2026 Capital Program is primarily focused on addressing the region’s state of good repair needs and advancing projects identified in Invest in Transit. The RTA continues to lead Strategic Asset Management (SAM) activities for the region to consider the impacts of capital funding and asset condition outlook beyond the timeframe covered in the capital program. The RTA is currently working with the Service Boards to update the data and models used to estimate the impact of capital funding on the region. Meanwhile, capital funding continues to be insufficient to meet regional needs. In previous analysis, the RTA showed that if the State Bond Funds that were authorized in Rebuild Illinois continued for another 5 to 15 years, the condition of the region’s assets could be held steady or even improved over today. Now that state bond funds are fully programmed and another program has not been authorized, the overall regional asset condition will begin to deteriorate once again. By 2035, 38% of assets will exceed their useful lives without additional state or federal funding. For this reason, the RTA will continue with its SAM work and advocacy for additional capital funding as part of the next strategic plan development process.
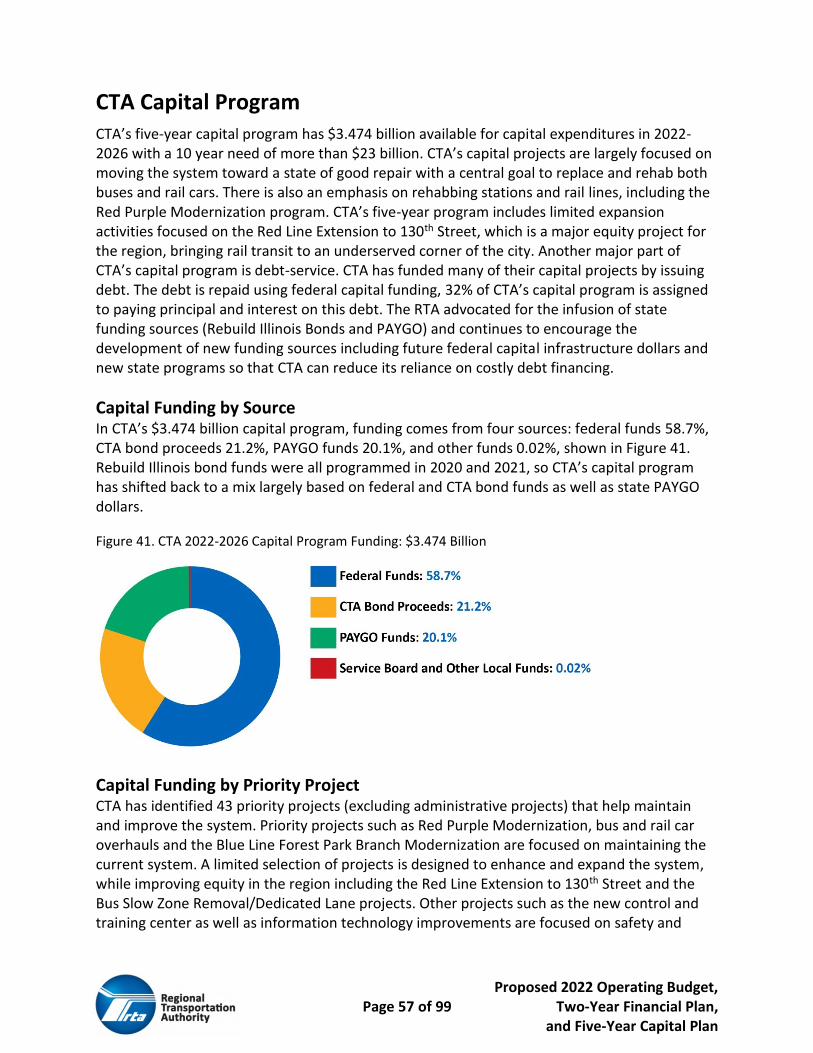
Proposed 2022 Operating Budget, Page 57 of 99 Two-Year Financial Plan, and Five-Year Capital Plan
CTA Capital Program CTA’s five-year capital program has $3.474 billion available for capital expenditures in 2022-2026 with a 10 year need of more than $23 billion. CTA’s capital projects are largely focused on moving the system toward a state of good repair with a central goal to replace and rehab both buses and rail cars. There is also an emphasis on rehabbing stations and rail lines, including the Red Purple Modernization program. CTA’s five-year program includes limited expansion activities focused on the Red Line Extension to 130th Street, which is a major equity project for the region, bringing rail transit to an underserved corner of the city. Another major part of CTA’s capital program is debt-service. CTA has funded many of their capital projects by issuing debt. The debt is repaid using federal capital funding, 32% of CTA’s capital program is assigned to paying principal and interest on this debt. The RTA advocated for the infusion of state funding sources (Rebuild Illinois Bonds and PAYGO) and continues to encourage the development of new funding sources including future federal capital infrastructure dollars and new state programs so that CTA can reduce its reliance on costly debt financing.
Capital Funding by Source In CTA’s $3.474 billion capital program, funding comes from four sources: federal funds 58.7%, CTA bond proceeds 21.2%, PAYGO funds 20.1%, and other funds 0.02%, shown in Figure 41. Rebuild Illinois bond funds were all programmed in 2020 and 2021, so CTA’s capital program has shifted back to a mix largely based on federal and CTA bond funds as well as state PAYGO dollars.
Figure 41. CTA 2022-2026 Capital Program Funding: $3.474 Billion
Capital Funding by Priority Project CTA has identified 43 priority projects (excluding administrative projects) that help maintain and improve the system. Priority projects such as Red Purple Modernization, bus and rail car overhauls and the Blue Line Forest Park Branch Modernization are focused on maintaining the current system. A limited selection of projects is designed to enhance and expand the system, while improving equity in the region including the Red Line Extension to 130th Street and the Bus Slow Zone Removal/Dedicated Lane projects. Other projects such as the new control and training center as well as information technology improvements are focused on safety and
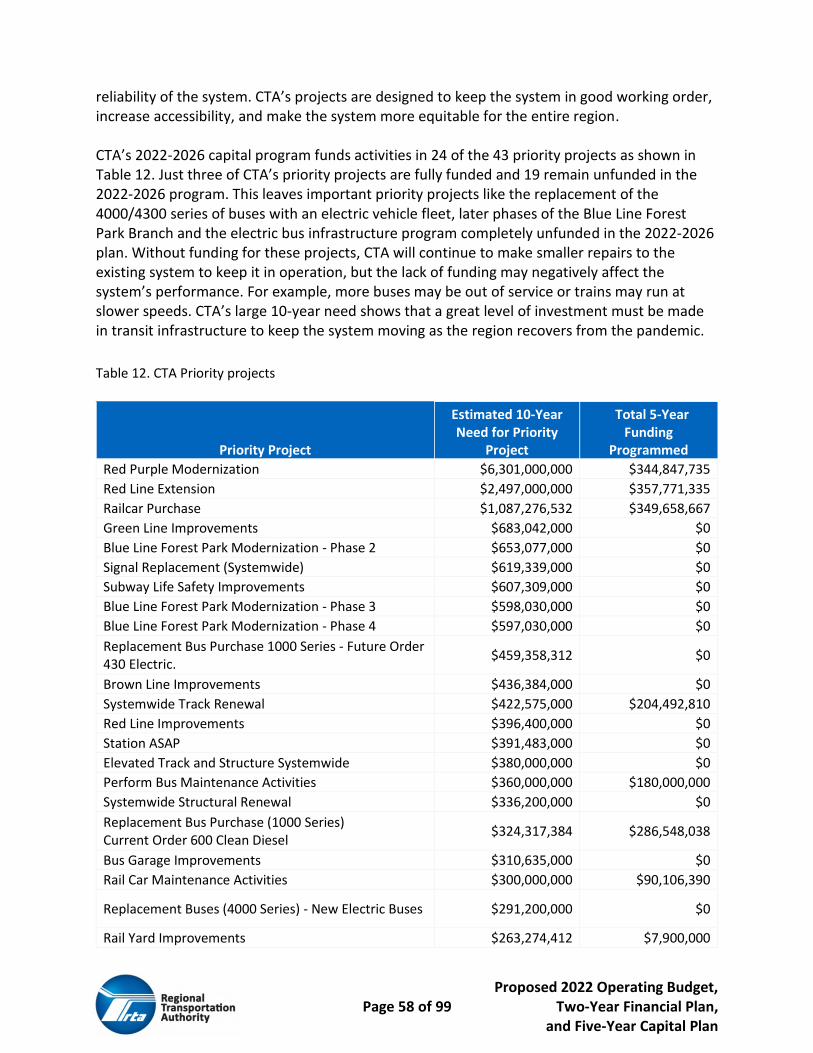
Proposed 2022 Operating Budget, Page 58 of 99 Two-Year Financial Plan, and Five-Year Capital Plan
reliability of the system. CTA’s projects are designed to keep the system in good working order, increase accessibility, and make the system more equitable for the entire region. CTA’s 2022-2026 capital program funds activities in 24 of the 43 priority projects as shown in Table 12. Just three of CTA’s priority projects are fully funded and 19 remain unfunded in the 2022-2026 program. This leaves important priority projects like the replacement of the 4000/4300 series of buses with an electric vehicle fleet, later phases of the Blue Line Forest Park Branch and the electric bus infrastructure program completely unfunded in the 2022-2026 plan. Without funding for these projects, CTA will continue to make smaller repairs to the existing system to keep it in operation, but the lack of funding may negatively affect the system’s performance. For example, more buses may be out of service or trains may run at slower speeds. CTA’s large 10-year need shows that a great level of investment must be made in transit infrastructure to keep the system moving as the region recovers from the pandemic.
Table 12. CTA Priority projects
Priority Project
Estimated 10-Year Need for Priority
Project
Total 5-Year Funding
Programmed
Red Purple Modernization $6,301,000,000 $344,847,735
Red Line Extension $2,497,000,000 $357,771,335
Railcar Purchase $1,087,276,532 $349,658,667
Green Line Improvements $683,042,000 $0
Blue Line Forest Park Modernization - Phase 2 $653,077,000 $0
Signal Replacement (Systemwide) $619,339,000 $0
Subway Life Safety Improvements $607,309,000 $0
Blue Line Forest Park Modernization - Phase 3 $598,030,000 $0
Blue Line Forest Park Modernization - Phase 4 $597,030,000 $0
Replacement Bus Purchase 1000 Series - Future Order 430 Electric.
$459,358,312 $0
Brown Line Improvements $436,384,000 $0
Systemwide Track Renewal $422,575,000 $204,492,810
Red Line Improvements $396,400,000 $0
Station ASAP $391,483,000 $0
Elevated Track and Structure Systemwide $380,000,000 $0
Perform Bus Maintenance Activities $360,000,000 $180,000,000
Systemwide Structural Renewal $336,200,000 $0
Replacement Bus Purchase (1000 Series) Current Order 600 Clean Diesel
$324,317,384 $286,548,038
Bus Garage Improvements $310,635,000 $0
Rail Car Maintenance Activities $300,000,000 $90,106,390
Replacement Buses (4000 Series) - New Electric Buses $291,200,000 $0
Rail Yard Improvements $263,274,412 $7,900,000
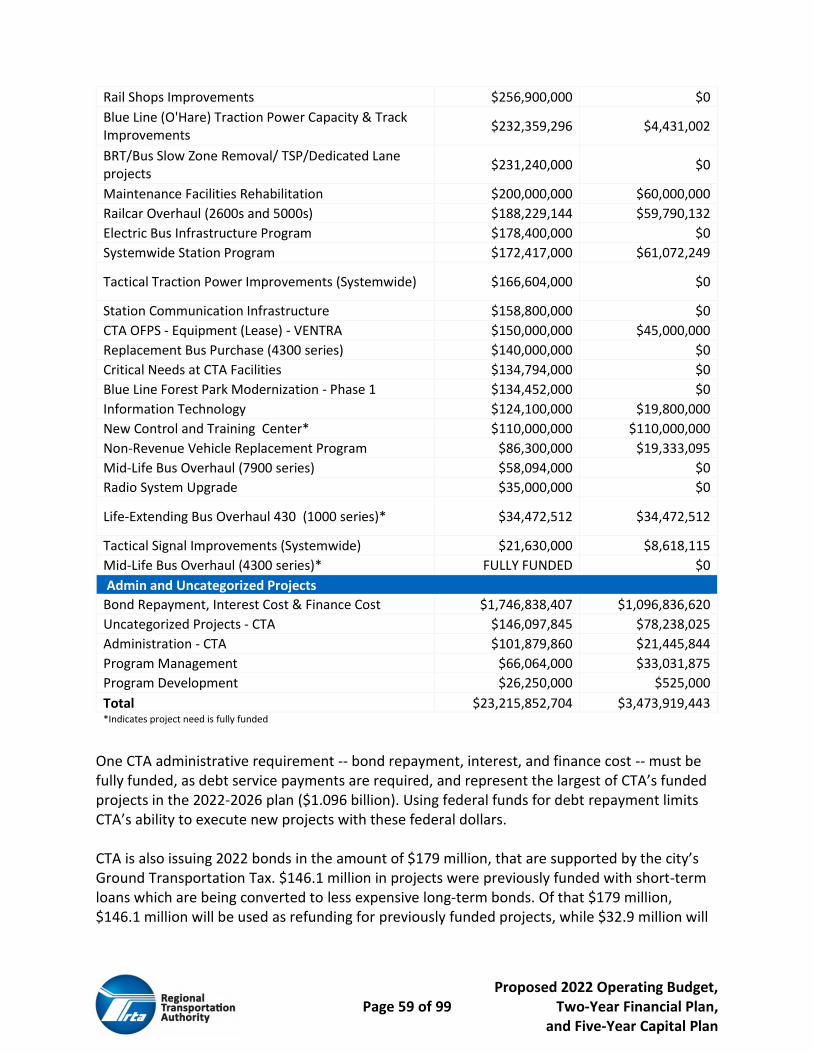
Proposed 2022 Operating Budget, Page 59 of 99 Two-Year Financial Plan, and Five-Year Capital Plan
Rail Shops Improvements $256,900,000 $0
Blue Line (O'Hare) Traction Power Capacity & Track Improvements
$232,359,296 $4,431,002
BRT/Bus Slow Zone Removal/ TSP/Dedicated Lane projects
$231,240,000 $0
Maintenance Facilities Rehabilitation $200,000,000 $60,000,000
Railcar Overhaul (2600s and 5000s) $188,229,144 $59,790,132
Electric Bus Infrastructure Program $178,400,000 $0
Systemwide Station Program $172,417,000 $61,072,249
Tactical Traction Power Improvements (Systemwide) $166,604,000 $0
Station Communication Infrastructure $158,800,000 $0
CTA OFPS - Equipment (Lease) - VENTRA $150,000,000 $45,000,000
Replacement Bus Purchase (4300 series) $140,000,000 $0
Critical Needs at CTA Facilities $134,794,000 $0
Blue Line Forest Park Modernization - Phase 1 $134,452,000 $0
Information Technology $124,100,000 $19,800,000
New Control and Training Center* $110,000,000 $110,000,000
Non-Revenue Vehicle Replacement Program $86,300,000 $19,333,095
Mid-Life Bus Overhaul (7900 series) $58,094,000 $0
Radio System Upgrade $35,000,000 $0
Life-Extending Bus Overhaul 430 (1000 series)* $34,472,512 $34,472,512
Tactical Signal Improvements (Systemwide) $21,630,000 $8,618,115
Mid-Life Bus Overhaul (4300 series)* FULLY FUNDED $0
Admin and Uncategorized Projects
Bond Repayment, Interest Cost & Finance Cost $1,746,838,407 $1,096,836,620
Uncategorized Projects - CTA $146,097,845 $78,238,025
Administration - CTA $101,879,860 $21,445,844
Program Management $66,064,000 $33,031,875
Program Development $26,250,000 $525,000
Total $23,215,852,704 $3,473,919,443 *Indicates project need is fully funded
One CTA administrative requirement -- bond repayment, interest, and finance cost -- must be fully funded, as debt service payments are required, and represent the largest of CTA’s funded projects in the 2022-2026 plan ($1.096 billion). Using federal funds for debt repayment limits CTA’s ability to execute new projects with these federal dollars. CTA is also issuing 2022 bonds in the amount of $179 million, that are supported by the city’s Ground Transportation Tax. $146.1 million in projects were previously funded with short-term loans which are being converted to less expensive long-term bonds. Of that $179 million, $146.1 million will be used as refunding for previously funded projects, while $32.9 million will

Proposed 2022 Operating Budget, Page 60 of 99 Two-Year Financial Plan, and Five-Year Capital Plan
be available for new projects programmed in 2022. The $146.1 million is shown as part of CTA’s debt service. Data will be further analyzed by looking at core requirements, and strategic goals; Table 13 shows information for each of CTA’s projects and Appendix A contains the detailed data for each project.
Table 13. CTA Priority Project Summary
Strategic Goals
Core Requirements
Priority Project
Estimated 10-Year Need for
Priority Project Individual Capital Project Title
Total 5-Year Funding
Programmed De
live
r V
alu
e o
n O
ur
Inve
stm
en
t
Bu
ild o
n S
tre
ngt
hs
of
Ou
r N
etw
ork
Stay
Co
mp
eti
tive
Mai
nta
in a
nd
Imp
rove
Saf
ety
an
d R
elia
bili
ty
Ach
ieve
Fu
ll A
cce
ssib
ility
Me
et
Re
gula
tory
Re
qu
ire
men
t
Imp
rove
Eq
uit
y
Red Purple Modernization
$6,301,000,000
NML - Red/Purple Modernization -CTA Bond RPM
$265,476,130 • • •
NML - Red/Purple Modernization (FTA Core Capacity)
$79,371,605 • • •
Red Line Extension
$2,497,000,000
Red Line Extension - Planning, Preliminary Engineering
$30,000,000 • • •
Red Line Extension - Planning, Preliminary Engineering
$327,771,335 • • •
Railcar Purchase
$1,087,276,532
Purchase Rail Cars - 7000' Series (Base Order 400)
$92,043,172 • • •
Purchase Rail Cars - 7000' Series (Base Order 400)
$53,892,555 • • •
Purchase Rail Cars - 7000' Series (Base Order 400)
$31,235,577 • • •

Proposed 2022 Operating Budget, Page 61 of 99 Two-Year Financial Plan, and Five-Year Capital Plan
Strategic Goals
Core Requirements
Priority Project
Estimated 10-Year Need for
Priority Project Individual Capital Project Title
Total 5-Year Funding
Programmed De
live
r V
alu
e o
n O
ur
Inve
stm
en
t
Bu
ild o
n S
tre
ngt
hs
of
Ou
r N
etw
ork
Stay
Co
mp
eti
tive
Mai
nta
in a
nd
Imp
rove
Saf
ety
an
d R
elia
bili
ty
Ach
ieve
Fu
ll A
cce
ssib
ility
Me
et
Re
gula
tory
Re
qu
ire
men
t
Imp
rove
Eq
uit
y
Rail Cars - 7000 Series Option Two (100 cars)
$70,885,122 • • •
Rail Cars - 7000 Series Option Two (100 cars)
$59,277,066 • • •
Rail Cars - 7000 Series Option Three (100 cars)
$12,629,059 • • •
Rail Cars - 7000 Series Option Three (100 cars)
$29,696,116 • • •
Green Line Improvements
$683,042,000 Green Line Improvements
$0 • • •
Blue Line Forest Park Modernization - Phase 2
$653,077,000 Blue Line Forest Park Modernization - Phase 2
$0 • • •
Signal Replacement (Systemwide)
$619,339,000 Signal Replacement (Systemwide)
$0
Subway Life Safety Improvements
$607,309,000 Subway Life Safety Improvements
$0 • • •
Blue Line Forest Park Modernization - Phase 3
$598,030,000 Blue Line Forest Park Modernization - Phase 3
$0 • • •
Blue Line Forest Park Modernization - Phase 4
$597,030,000 Blue Line Forest Park Modernization - Phase 4
$0 • • •

Proposed 2022 Operating Budget, Page 62 of 99 Two-Year Financial Plan, and Five-Year Capital Plan
Strategic Goals
Core Requirements
Priority Project
Estimated 10-Year Need for
Priority Project Individual Capital Project Title
Total 5-Year Funding
Programmed De
live
r V
alu
e o
n O
ur
Inve
stm
en
t
Bu
ild o
n S
tre
ngt
hs
of
Ou
r N
etw
ork
Stay
Co
mp
eti
tive
Mai
nta
in a
nd
Imp
rove
Saf
ety
an
d R
elia
bili
ty
Ach
ieve
Fu
ll A
cce
ssib
ility
Me
et
Re
gula
tory
Re
qu
ire
men
t
Imp
rove
Eq
uit
y
Replacement Bus Purchase 1000 Series - Future Order 430 Electric.
$459,358,312
Replacement Bus Purchase 1000 Series - Future Order 400 Electric.
$0 • • •
Brown Line Improvements
$436,384,000 Brown Line Improvements
$0
Systemwide Track Renewal
$422,575,000
Elevated Track and Structure Systemwide
$190,000,000 • •
Green & Pink Line West - Track Improvements
$9,515,414 • •
Red & Blue Line Subway - Track Improvements
$4,973,988 • •
Nagle Curve Improvements
$1,096 • •
Congress Blue Line - P1 Track
$2,312 • •
Red Line Improvements
$396,400,000 Red Line Improvements
$0 • • •
Station ASAP $391,483,000 Station ASAP $0
Elevated Track and Structure Systemwide
$380,000,000 Elevated Track and Structure Systemwide
$0
Perform Bus Maintenance Activities
$360,000,000 Perform Bus Maintenance Activities (P1)
$180,000,000 • •
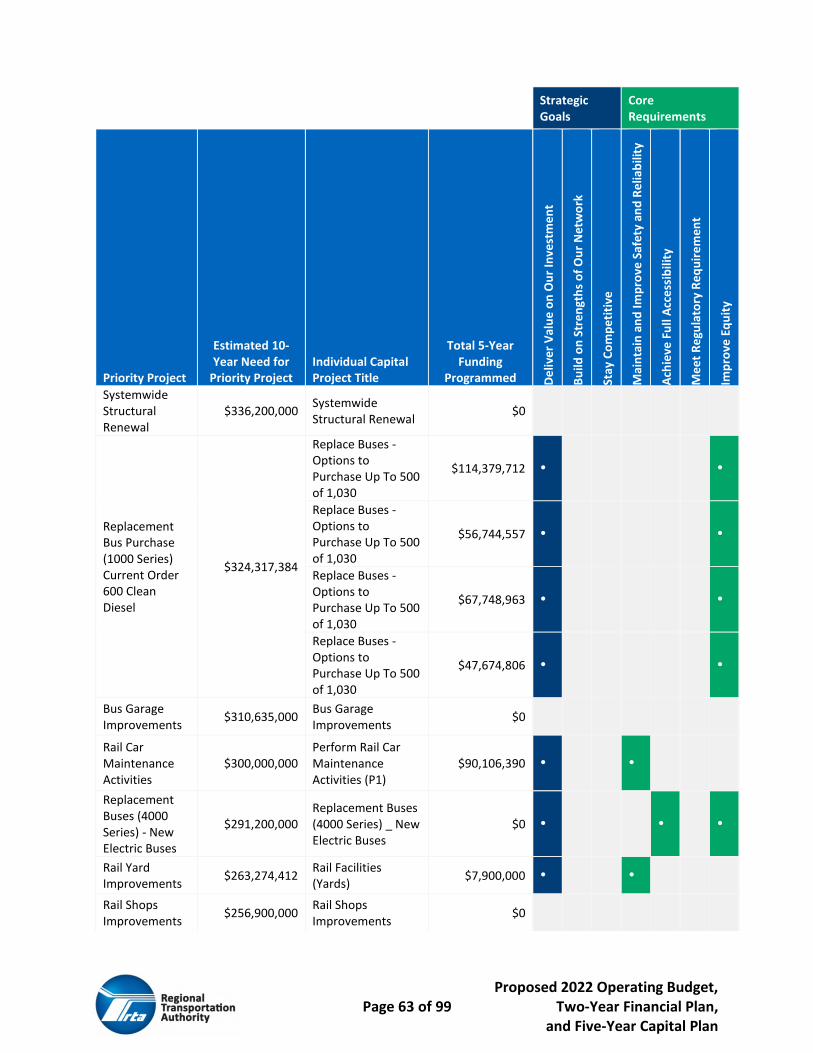
Proposed 2022 Operating Budget, Page 63 of 99 Two-Year Financial Plan, and Five-Year Capital Plan
Strategic Goals
Core Requirements
Priority Project
Estimated 10-Year Need for
Priority Project Individual Capital Project Title
Total 5-Year Funding
Programmed De
live
r V
alu
e o
n O
ur
Inve
stm
en
t
Bu
ild o
n S
tre
ngt
hs
of
Ou
r N
etw
ork
Stay
Co
mp
eti
tive
Mai
nta
in a
nd
Imp
rove
Saf
ety
an
d R
elia
bili
ty
Ach
ieve
Fu
ll A
cce
ssib
ility
Me
et
Re
gula
tory
Re
qu
ire
men
t
Imp
rove
Eq
uit
y
Systemwide Structural Renewal
$336,200,000 Systemwide Structural Renewal
$0
Replacement Bus Purchase (1000 Series) Current Order 600 Clean Diesel
$324,317,384
Replace Buses - Options to Purchase Up To 500 of 1,030
$114,379,712 • •
Replace Buses - Options to Purchase Up To 500 of 1,030
$56,744,557 • •
Replace Buses - Options to Purchase Up To 500 of 1,030
$67,748,963 • •
Replace Buses - Options to Purchase Up To 500 of 1,030
$47,674,806 • •
Bus Garage Improvements
$310,635,000 Bus Garage Improvements
$0
Rail Car Maintenance Activities
$300,000,000 Perform Rail Car Maintenance Activities (P1)
$90,106,390 • •
Replacement Buses (4000 Series) - New Electric Buses
$291,200,000 Replacement Buses (4000 Series) _ New Electric Buses
$0 • • •
Rail Yard Improvements
$263,274,412 Rail Facilities (Yards)
$7,900,000 • •
Rail Shops Improvements
$256,900,000 Rail Shops Improvements
$0
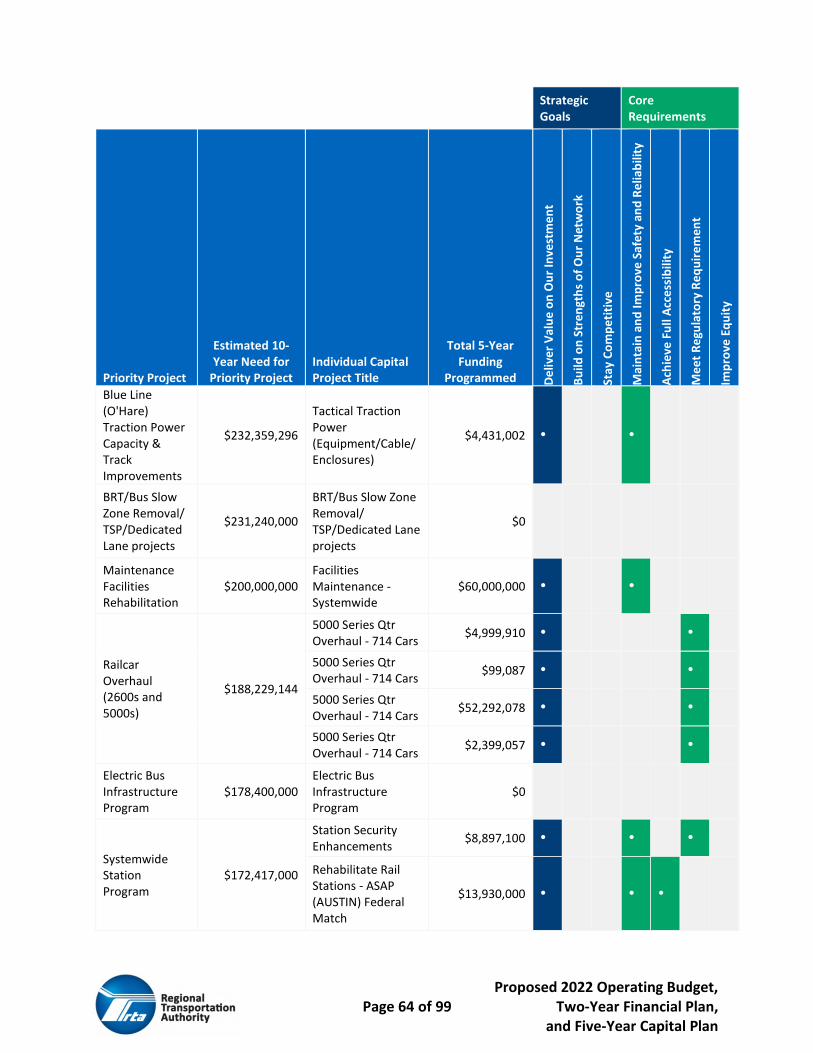
Proposed 2022 Operating Budget, Page 64 of 99 Two-Year Financial Plan, and Five-Year Capital Plan
Strategic Goals
Core Requirements
Priority Project
Estimated 10-Year Need for
Priority Project Individual Capital Project Title
Total 5-Year Funding
Programmed De
live
r V
alu
e o
n O
ur
Inve
stm
en
t
Bu
ild o
n S
tre
ngt
hs
of
Ou
r N
etw
ork
Stay
Co
mp
eti
tive
Mai
nta
in a
nd
Imp
rove
Saf
ety
an
d R
elia
bili
ty
Ach
ieve
Fu
ll A
cce
ssib
ility
Me
et
Re
gula
tory
Re
qu
ire
men
t
Imp
rove
Eq
uit
y
Blue Line (O'Hare) Traction Power Capacity & Track Improvements
$232,359,296
Tactical Traction Power (Equipment/Cable/Enclosures)
$4,431,002 • •
BRT/Bus Slow Zone Removal/ TSP/Dedicated Lane projects
$231,240,000
BRT/Bus Slow Zone Removal/ TSP/Dedicated Lane projects
$0
Maintenance Facilities Rehabilitation
$200,000,000 Facilities Maintenance - Systemwide
$60,000,000 • •
Railcar Overhaul (2600s and 5000s)
$188,229,144
5000 Series Qtr Overhaul - 714 Cars
$4,999,910 • •
5000 Series Qtr Overhaul - 714 Cars
$99,087 • •
5000 Series Qtr Overhaul - 714 Cars
$52,292,078 • •
5000 Series Qtr Overhaul - 714 Cars
$2,399,057 • •
Electric Bus Infrastructure Program
$178,400,000 Electric Bus Infrastructure Program
$0
Systemwide Station Program
$172,417,000
Station Security Enhancements
$8,897,100 • • •
Rehabilitate Rail Stations - ASAP (AUSTIN) Federal Match
$13,930,000 • • •

Proposed 2022 Operating Budget, Page 65 of 99 Two-Year Financial Plan, and Five-Year Capital Plan
Strategic Goals
Core Requirements
Priority Project
Estimated 10-Year Need for
Priority Project Individual Capital Project Title
Total 5-Year Funding
Programmed De
live
r V
alu
e o
n O
ur
Inve
stm
en
t
Bu
ild o
n S
tre
ngt
hs
of
Ou
r N
etw
ork
Stay
Co
mp
eti
tive
Mai
nta
in a
nd
Imp
rove
Saf
ety
an
d R
elia
bili
ty
Ach
ieve
Fu
ll A
cce
ssib
ility
Me
et
Re
gula
tory
Re
qu
ire
men
t
Imp
rove
Eq
uit
y
Systemwide Security Cameras Improvements (Safe & Secure)
$4,676,520 • • •
Security Camera Modernization and Upgrade
$9,568,629 • • •
Security Camera Modernization and Upgrade
$2,000,000 • • •
Public Address Communication Modernization & Upgrade
$12,000,000 • • •
Rail Station Communications Infrastructure Modernization
$5,000,000 • • •
Rail Station Communications Infrastructure Modernization
$5,000,000 • • •
Tactical Traction Power Improvements (Systemwide)
$166,604,000
Tactical Traction Power Improvements (Systemwide)
$0 • •
Station Communication Infrastructure
$158,800,000 Station Communication Infrastructure
$0 • • •

Proposed 2022 Operating Budget, Page 66 of 99 Two-Year Financial Plan, and Five-Year Capital Plan
Strategic Goals
Core Requirements
Priority Project
Estimated 10-Year Need for
Priority Project Individual Capital Project Title
Total 5-Year Funding
Programmed De
live
r V
alu
e o
n O
ur
Inve
stm
en
t
Bu
ild o
n S
tre
ngt
hs
of
Ou
r N
etw
ork
Stay
Co
mp
eti
tive
Mai
nta
in a
nd
Imp
rove
Saf
ety
an
d R
elia
bili
ty
Ach
ieve
Fu
ll A
cce
ssib
ility
Me
et
Re
gula
tory
Re
qu
ire
men
t
Imp
rove
Eq
uit
y
CTA OFPS - Equipment (Lease) - VENTRA
$150,000,000
CTA Open Fare Payment System - Equipment (Lease) - VENTRA
$45,000,000 • • •
Replacement Bus Purchase (4300 series)
$140,000,000 Replacement Bus Purchase (4300 series)
$0 • • •
Critical Needs at CTA Facilities
$134,794,000 Critical Needs at CTA Facilities
$0
Blue Line Forest Park Modernization - Phase 1
$134,452,000 Blue Line Forest Park Modernization - Phase 1
$0 • • •
Information Technology
$124,100,000
Upgrade Computer Systems
$3,400,000 • •
Information Technology - MMIMS Upgrade
$2,500,000 • •
Information Technology - Hastus Upgrade
$1,000,000 • •
Information Technology - TOPS Upgrade II
$1,500,000 • •
Information Technology - Bus Router Replacements (MP070's)
$4,200,000 • •
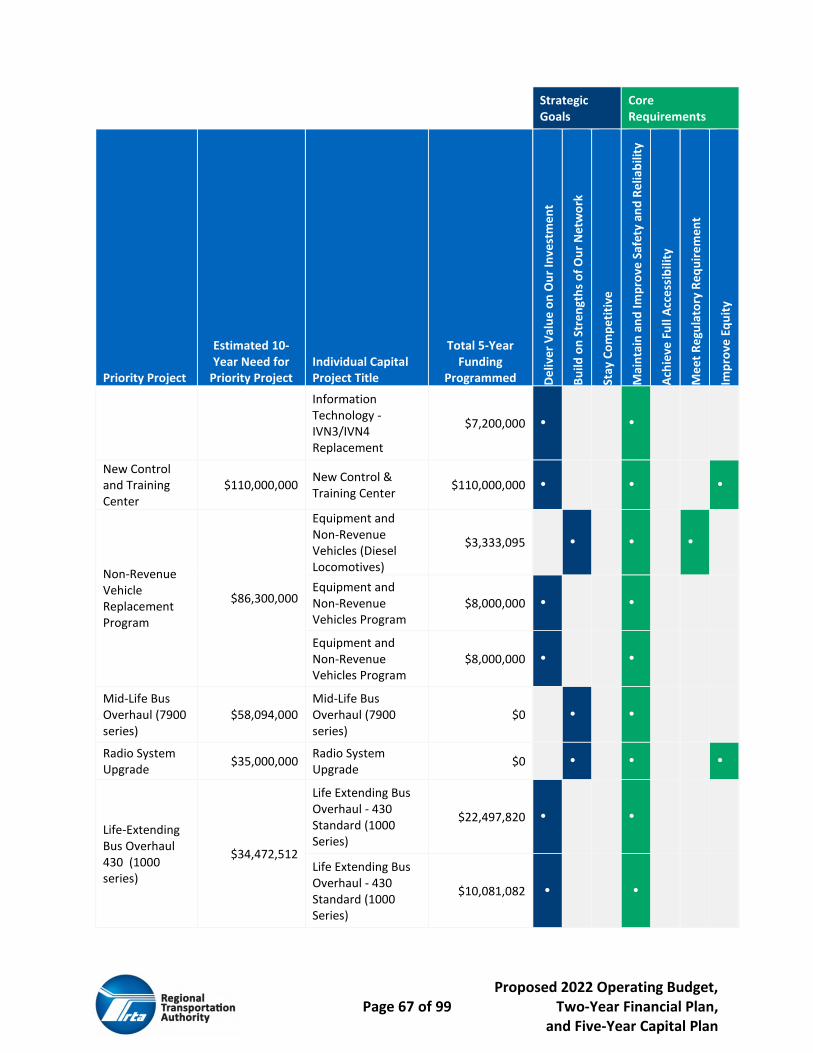
Proposed 2022 Operating Budget, Page 67 of 99 Two-Year Financial Plan, and Five-Year Capital Plan
Strategic Goals
Core Requirements
Priority Project
Estimated 10-Year Need for
Priority Project Individual Capital Project Title
Total 5-Year Funding
Programmed De
live
r V
alu
e o
n O
ur
Inve
stm
en
t
Bu
ild o
n S
tre
ngt
hs
of
Ou
r N
etw
ork
Stay
Co
mp
eti
tive
Mai
nta
in a
nd
Imp
rove
Saf
ety
an
d R
elia
bili
ty
Ach
ieve
Fu
ll A
cce
ssib
ility
Me
et
Re
gula
tory
Re
qu
ire
men
t
Imp
rove
Eq
uit
y
Information Technology - IVN3/IVN4 Replacement
$7,200,000 • •
New Control and Training Center
$110,000,000 New Control & Training Center
$110,000,000 • • •
Non-Revenue Vehicle Replacement Program
$86,300,000
Equipment and Non-Revenue Vehicles (Diesel Locomotives)
$3,333,095 • • •
Equipment and Non-Revenue Vehicles Program
$8,000,000 • •
Equipment and Non-Revenue Vehicles Program
$8,000,000 • •
Mid-Life Bus Overhaul (7900 series)
$58,094,000 Mid-Life Bus Overhaul (7900 series)
$0 • •
Radio System Upgrade
$35,000,000 Radio System Upgrade
$0 • • •
Life-Extending Bus Overhaul 430 (1000 series)
$34,472,512
Life Extending Bus Overhaul - 430 Standard (1000 Series)
$22,497,820 • •
Life Extending Bus Overhaul - 430 Standard (1000 Series)
$10,081,082 • •

Proposed 2022 Operating Budget, Page 68 of 99 Two-Year Financial Plan, and Five-Year Capital Plan
Strategic Goals
Core Requirements
Priority Project
Estimated 10-Year Need for
Priority Project Individual Capital Project Title
Total 5-Year Funding
Programmed De
live
r V
alu
e o
n O
ur
Inve
stm
en
t
Bu
ild o
n S
tre
ngt
hs
of
Ou
r N
etw
ork
Stay
Co
mp
eti
tive
Mai
nta
in a
nd
Imp
rove
Saf
ety
an
d R
elia
bili
ty
Ach
ieve
Fu
ll A
cce
ssib
ility
Me
et
Re
gula
tory
Re
qu
ire
men
t
Imp
rove
Eq
uit
y
Life Extending Bus Overhaul - 430 Standard (1000 Series)
$1,893,610 • •
Tactical Signal Improvements (Systemwide)
$21,630,000
Tactical Traction Power (Equipment/Cable/Enclosures)
$2,449,402 • •
Tactical Traction Power (Equipment/Cable/Enclosures)
$3,370,921 • •
Tactical Traction Power (Equipment/Cable/Enclosures)
$2,797,792 • •
Mid-Life Bus Overhaul (4300 series)
FULLY FUNDED Mid-Life Bus Overhaul (4300 series)
$0 • •
Admin and Uncategorized Projects
Bond Repayment, Interest Cost & Finance Cost
$1,746,838,407
CTA Bond Repayment - Principal - 5307
$135,255,000 • •
CTA Bond Repayment - Interest - 5307
$149,039,070 • •
CTA Bond Repayment - Principal - 5337
$296,980,000 • •
CTA Bond Repayment - Interest - 5337
$369,464,705 • •

Proposed 2022 Operating Budget, Page 69 of 99 Two-Year Financial Plan, and Five-Year Capital Plan
Strategic Goals
Core Requirements
Priority Project
Estimated 10-Year Need for
Priority Project Individual Capital Project Title
Total 5-Year Funding
Programmed De
live
r V
alu
e o
n O
ur
Inve
stm
en
t
Bu
ild o
n S
tre
ngt
hs
of
Ou
r N
etw
ork
Stay
Co
mp
eti
tive
Mai
nta
in a
nd
Imp
rove
Saf
ety
an
d R
elia
bili
ty
Ach
ieve
Fu
ll A
cce
ssib
ility
Me
et
Re
gula
tory
Re
qu
ire
men
t
Imp
rove
Eq
uit
y
Ground Transfer Tax Bond Repayment
$146,097,845 • •
Uncategorized Projects - CTA
$146,097,845
Office Building - Principal
$19,860,000 • •
Office Building - Interest
$11,078,025 • •
Implement Security Projects - HLS Program
$30,000,000 • •
Bus Slow Zones Elimination Program - CMAQ
$15,200,000 • • •
Program Development - UWP
$2,100,000 • •
Administration - CTA
$101,879,860
Support Service for 5307
$8,927,330 • •
Support Service for 5337
$10,580,777 • •
Support Service for 5339
$851,862 • •
Support Services for Fast Tracks Program
$404,723 • •
Support Services for CTA Bond
$681,151 • •
Program Management
$66,064,000
Program Management
$8,989,901 • •
Program Management
$24,041,974 • •
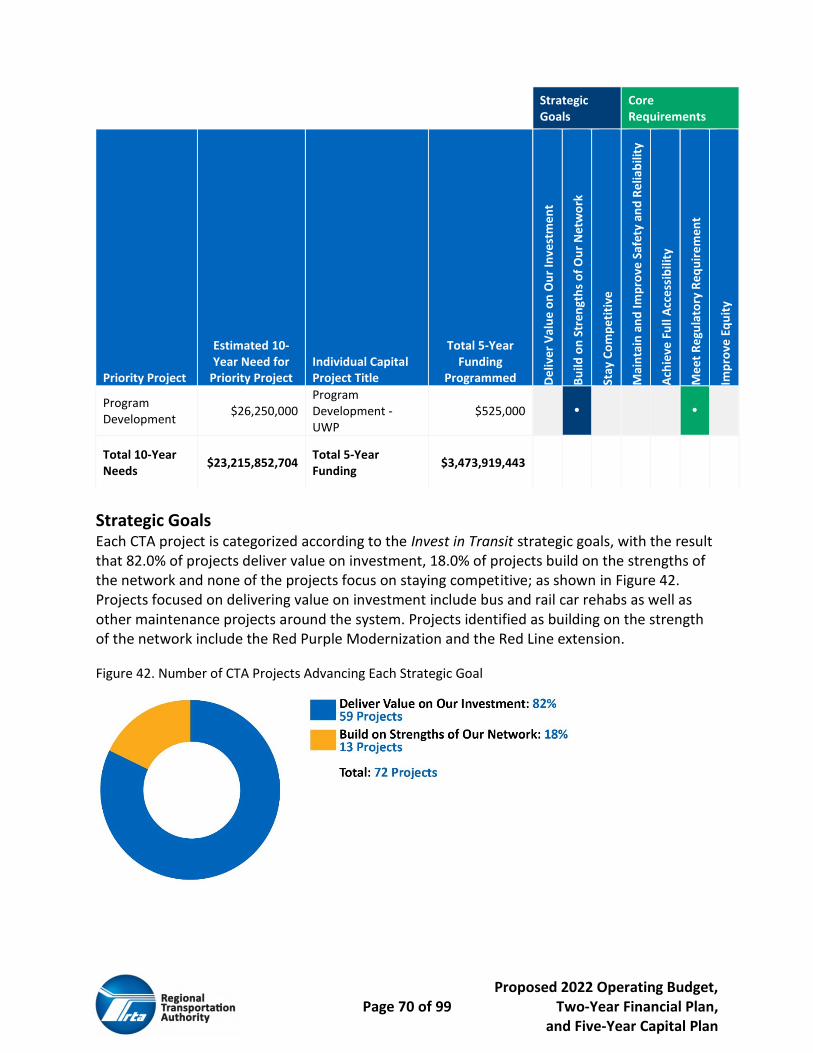
Proposed 2022 Operating Budget, Page 70 of 99 Two-Year Financial Plan, and Five-Year Capital Plan
Strategic Goals Each CTA project is categorized according to the Invest in Transit strategic goals, with the result that 82.0% of projects deliver value on investment, 18.0% of projects build on the strengths of the network and none of the projects focus on staying competitive; as shown in Figure 42. Projects focused on delivering value on investment include bus and rail car rehabs as well as other maintenance projects around the system. Projects identified as building on the strength of the network include the Red Purple Modernization and the Red Line extension.
Figure 42. Number of CTA Projects Advancing Each Strategic Goal
Strategic Goals
Core Requirements
Priority Project
Estimated 10-Year Need for
Priority Project Individual Capital Project Title
Total 5-Year Funding
Programmed De
live
r V
alu
e o
n O
ur
Inve
stm
en
t
Bu
ild o
n S
tre
ngt
hs
of
Ou
r N
etw
ork
Stay
Co
mp
eti
tive
Mai
nta
in a
nd
Imp
rove
Saf
ety
an
d R
elia
bili
ty
Ach
ieve
Fu
ll A
cce
ssib
ility
Me
et
Re
gula
tory
Re
qu
ire
men
t
Imp
rove
Eq
uit
y
Program Development
$26,250,000 Program Development - UWP
$525,000 • •
Total 10-Year Needs
$23,215,852,704 Total 5-Year Funding
$3,473,919,443
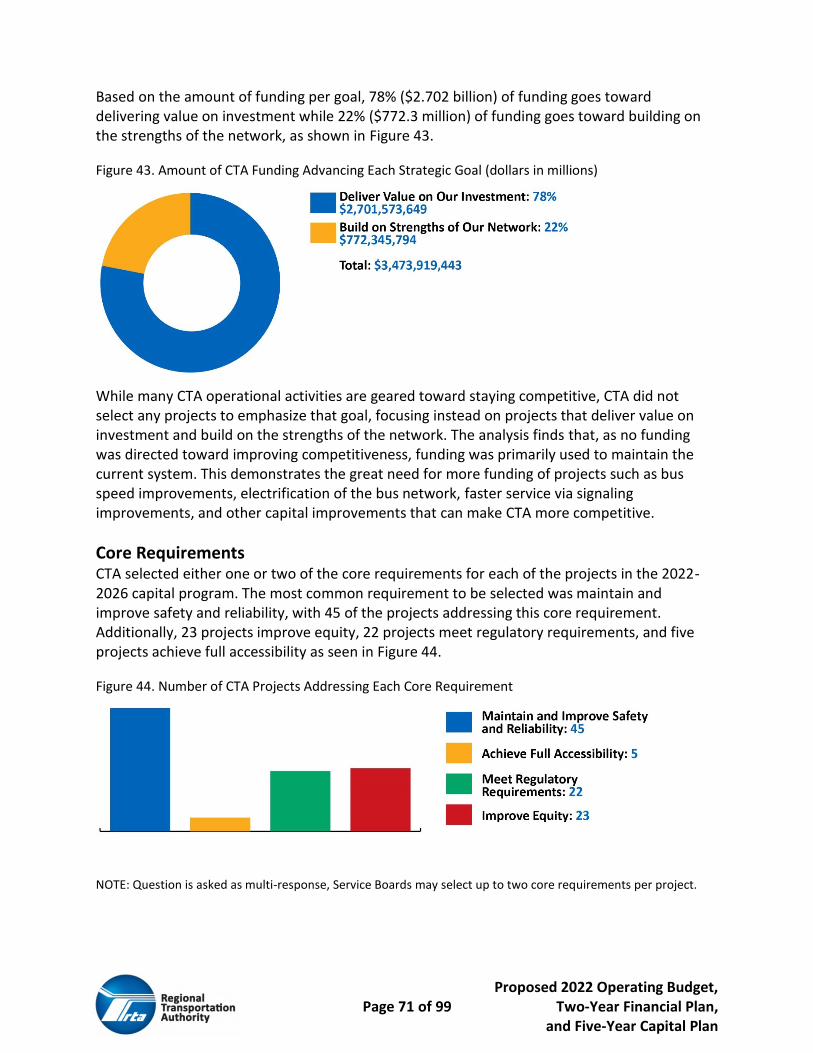
Proposed 2022 Operating Budget, Page 71 of 99 Two-Year Financial Plan, and Five-Year Capital Plan
Based on the amount of funding per goal, 78% ($2.702 billion) of funding goes toward delivering value on investment while 22% ($772.3 million) of funding goes toward building on the strengths of the network, as shown in Figure 43.
Figure 43. Amount of CTA Funding Advancing Each Strategic Goal (dollars in millions)
While many CTA operational activities are geared toward staying competitive, CTA did not select any projects to emphasize that goal, focusing instead on projects that deliver value on investment and build on the strengths of the network. The analysis finds that, as no funding was directed toward improving competitiveness, funding was primarily used to maintain the current system. This demonstrates the great need for more funding of projects such as bus speed improvements, electrification of the bus network, faster service via signaling improvements, and other capital improvements that can make CTA more competitive.
Core Requirements CTA selected either one or two of the core requirements for each of the projects in the 2022-2026 capital program. The most common requirement to be selected was maintain and improve safety and reliability, with 45 of the projects addressing this core requirement. Additionally, 23 projects improve equity, 22 projects meet regulatory requirements, and five projects achieve full accessibility as seen in Figure 44.
Figure 44. Number of CTA Projects Addressing Each Core Requirement
NOTE: Question is asked as multi-response, Service Boards may select up to two core requirements per project.

Proposed 2022 Operating Budget, Page 72 of 99 Two-Year Financial Plan, and Five-Year Capital Plan
When looking at core requirements by funded amount, maintain and improve safety and reliability was the main focus for CTA, with $2.036 billion of funds helping to address this requirement. Improve equity was another important core requirement with $1.502 billion in funding programmed. Achieve full accessibility had $716.5 million programmed, and meet regulatory requirements had $505.9 million earmarked, as shown in Figure 45. Of note, while there were 22 projects that meet regulatory requirements, funding for these projects was a smaller portion. There are several small regulatory requirements that CTA regularly needs to fund to stay compliant with all regulations from safety to security to modernization.
Figure 45. Amount of CTA Funding CTA Addressing Each Core Requirement (millions)
NOTE: Question is asked as multi-response, Service Boards may select up to two core requirements per project.
The new performance-based programming methodology requires that each Service Board program at least 20% of funding to projects that either achieve full accessibility or improve equity, beginning in 2025. Table 14 shows the projects and dollar value of those projects that are programmed to either equity or accessibility projects. CTA’s 2022-2026 program has a focus on projects that improve equity and achieve full accessibility. In 2025, 34.9% of funding is assigned to either equity or accessibility. In 2026, 47.1% of funding supports one of those goals. The main accessibility project programmed in 2025 and 2026 is the purchase of new 7000 series rail cars. This purchase will help to retire older 2600 rail cars, which do not have level boarding and require extra assistance for boarding. A key equity project is the Red Line Extension to 130th Street, which is a significantly transit underserved community. There are also various station projects that improve safety including security cameras and communication upgrades around the system.
Table 14. CTA Accessibility and Equity Project Highlights
Description 2025 2026
Achieve Full
Accessibility
Improve
Equity
Red Line Extension - Planning, Preliminary Engineering
$0 $30,000,000 •
Red Line Extension - Planning, Preliminary Engineering
$77,500,000 $0 •
Red Line Extension - Planning, Preliminary Engineering
$0 $30,000,000 •
Replace Buses - Options to Purchase Up To 500 of 1,030
$14,006,422 $18,070,178 •

Proposed 2022 Operating Budget, Page 73 of 99 Two-Year Financial Plan, and Five-Year Capital Plan
Description 2025 2026
Achieve Full
Accessibility
Improve
Equity
Replace Buses - Options to Purchase Up To 500 of 1,030
$13,545,938 $13,749,127 •
Replace Buses - Options to Purchase Up To 500 of 1,030
$0 $44,255,332 •
Replace Buses - Options to Purchase Up To 500 of 1,030
$9,226,922 $1,822,884 •
Rail Cars - 7000 Series Option Two (100 cars)
$42,444,089 $28,441,033 • •
Rail Cars - 7000 Series Option Two (100 cars)
$21,357,465 $37,919,601 • •
Rail Cars - 7000 Series Option Three (100 cars)
$0 $12,629,059 • •
Rail Cars - 7000 Series Option Three (100 cars)
$0 $29,696,116 • •
Security Camera Modernization and Upgrade
$4,000,000 $3,568,629 •
Public Address Communication Modernization & Upgrade
$6,000,000 $6,000,000 •
Rail Station Communications Infrastructure Modernization
$0 $5,000,000 •
Rail Station Communications Infrastructure Modernization
$5,000,000 $0 •
Total $193,080,836 $261,151,959
Total Annual Program $552,964,091 $554,722,299
Percent of Program toward Accessibility and Equity
34.9% 47.1%
Based on the 2022-2026 CTA capital program, CTA is firmly focused on maintaining the current system. There are very limited funds available for other projects that would provide enhancements. CTA and RTA continue to advocate for funds that will help address important goals such as CTA’s All Stations Accessibility Plan, rebuilding the Blue Line Forest Park Branch and the Red Line Extension to 130th Street. These projects build on the system and offer transit to underserved communities, fulfilling an important need for the region. Furthermore, advocating for additional federal and state funding will allow CTA to reduce its over reliance on funding projects with CTA issued debt, which requires large future repayments of principal and interest using federal funds, which otherwise would be available for new capital needs.
Metra Capital Program Metra has $1.497 billion of funding available in its 2022-2026 capital program with an estimate of $11.8 billion needed for priority projects over the coming 10 years. Metra continues to focus capital improvement projects on replacing and rehabbing both rail cars and locomotives. Forty-

Proposed 2022 Operating Budget, Page 74 of 99 Two-Year Financial Plan, and Five-Year Capital Plan
one percent of funds ($612.9M) programmed in the 2022-2026 capital program are dedicated to Metra’s fleet modernization plan including the purchase of zero-emissions locomotives. Other major projects are focused around improving stations, bridges, and the right of way for its trains.
Capital Funding by Source Metra’s 2022-2026 capital program has funding that is supported by federal, state, and local funds. Federal funds represent 65.5% of Metra’s capital program, PAYGO funds are 24.7% of the program, RTA Bonds account for 8.7% of available funds, and RTA Innovation, Coordination and Enhancement Funds account for 1.1% of the 5-year capital program, as shown in Figure 46. The 2022-2026 capital program relies more on federal funds than in the past two years, as all state Rebuild Illinois bond funds were programmed in 2020 and 2021. Rebuild Illinois bond funds will continue to contribute to ongoing projects over the next several years, but new state funding sources will need to be developed to augment the PAYGO funds so that the region can reduce reliance on federal funds and better meet the needs of the region. Metra’s program is augmented by a planned 2023 RTA bond issuance which will fund the purchase of new rail cars to replace old vehicles, some of which have been in service for more than 70 years.
Figure 46. Metra 2022-2026 Program Funding Sources: $1.497 Billion
Capital Funding by Priority Project Metra has identified ten priority projects. Most of Metra’s capital priorities involve maintaining the current system through projects such as fleet modernization, track improvements, and rail station improvements. Metra has fully funded the capital cost of one project that was originally identified in Invest in Transit, PTC, which was mandated by the federal government. Seven projects are partially funded but need more funds to be completed, and two projects, A2 interlocker switch control tower and Chicago Union Station improvements, remain unfunded in the 2022-2026 capital program. RTA and Metra continue to advocate for additional funding to better meet the needs of these projects, which are designed to bring Metra up to a state of good repair and improve the experience of Metra’s riders. Metra’s 2022-2026 capital program has funding allocated to seven of ten priority projects as shown Table 15.

Proposed 2022 Operating Budget, Page 75 of 99 Two-Year Financial Plan, and Five-Year Capital Plan
Table 15. Metra 2022-2026 Priority Projects
Priority Project Estimated 10-Year Need for Priority Project
Total 5-Year Funding Programmed
Bridge Replacement and Repair $2,041,120,143 $72,045,000
Track Improvements $1,969,562,700 $133,759,000
75th Street Corridor $1,746,000,000 $0
Fleet Modernization Plan $1,690,415,786 $610,906,603
Signal & Electrical Improvements $1,187,831,400 $216,804,000
A-2 Interlocking Replacement $1,100,000,000 $2,600,000
Rail Station Improvements $762,073,929 $216,212,000
Yards, Facilities, and Equipment Improvements
$626,617,653 $149,090,000
Chicago Union Station Improvements $525,000,000 $0
PTC - Systemwide FULLY FUNDED $0
Admin and Uncategorized Projects
Administration - Metra $183,038,405 $96,068,286
Total $11,831,660,015 $1,497,484,889
Data will be further analyzed by looking at core requirements and strategic goals, Table 16 Metra Priority Project Summary shows information for each of Metra’s projects and Appendix A contains the detailed data for each project.

Proposed 2022 Operating Budget, Page 76 of 99 Two-Year Financial Plan, and Five-Year Capital Plan
Table 16. Metra Priority Project Summary
Strategic Goals Core Requirements
Priority
Project
Estimated 10-
Year Need for
Priority Project
Individual
Capital Project
Title
Total 5-Year
Funding
Programmed De
live
r V
alu
e o
n O
ur
Inve
stm
en
t
Bu
ild o
n S
tre
ngt
hs
of
Ou
r N
etw
ork
Stay
Co
mp
eti
tive
Mai
nta
in a
nd
imp
rove
saf
ety
an
d r
elia
bili
ty
Ach
ieve
Fu
ll A
cce
ssib
ility
Me
et
Re
gula
tory
Re
qu
ire
men
t
Imp
rove
Eq
uit
y
Bridge Replacement and Repair
$2,041,120,143
Gresham Area Bridges
$2,000,000 • • •
Bridge A-318 $1,600,000 • • •
CREATE EW-2 Bridge Lift
$1,000,000 • • •
Bridge 86 - 78th St Entrance
$3,000,000 • • •
Hickory Creek Bridge
$2,650,000 • • •
Catenary Structure Rehabilitation
$5,500,000 • • •
Bridges & Retaining Walls MED
$6,400,000 • • •
Bridges & Retaining Walls MWD
$7,100,000 • • •
Bridges & Retaining Walls RID
$6,400,000 • • •
UP North Line Bridges
$20,000,000 • • •
Bridge A110/56 $495,000 • • •
Bridge A-318 $2,400,000 • • •

Proposed 2022 Operating Budget, Page 77 of 99 Two-Year Financial Plan, and Five-Year Capital Plan
Strategic Goals Core Requirements
Priority
Project
Estimated 10-
Year Need for
Priority Project
Individual
Capital Project
Title
Total 5-Year
Funding
Programmed De
live
r V
alu
e o
n O
ur
Inve
stm
en
t
Bu
ild o
n S
tre
ngt
hs
of
Ou
r N
etw
ork
Stay
Co
mp
eti
tive
Mai
nta
in a
nd
imp
rove
saf
ety
an
d r
elia
bili
ty
Ach
ieve
Fu
ll A
cce
ssib
ility
Me
et
Re
gula
tory
Re
qu
ire
men
t
Imp
rove
Eq
uit
y
Bridges & Retaining Walls MED
$4,200,000 • • •
Bridges & Retaining Walls UPR
$2,000,000 • • •
Bridges & Retaining Walls MD-N
$3,700,000 • • •
Bridges & Retaining Walls RID
$3,600,000 • • •
Track Improvements
$1,969,562,700
Ties & Ballast MED
$6,475,000 • • •
Ties & Ballast RID
$15,350,000 • • •
Ties & Ballast MD-W
$10,075,000 • • •
Ties & Ballast MD-N
$6,825,000 • • •
Undercutting & Surfacing MED
$3,250,000 • • •
Undercutting & Surfacing MWD
$3,000,000 • • •
Undercutting & Surfacing RID
$1,500,000 • • •
Undercutting & Surfacing UPR
$500,000 • • •
Rail Renewal BNS
$2,000,000 • • •
Rail Renewal MED
$2,250,000 • • •

Proposed 2022 Operating Budget, Page 78 of 99 Two-Year Financial Plan, and Five-Year Capital Plan
Strategic Goals Core Requirements
Priority
Project
Estimated 10-
Year Need for
Priority Project
Individual
Capital Project
Title
Total 5-Year
Funding
Programmed De
live
r V
alu
e o
n O
ur
Inve
stm
en
t
Bu
ild o
n S
tre
ngt
hs
of
Ou
r N
etw
ork
Stay
Co
mp
eti
tive
Mai
nta
in a
nd
imp
rove
saf
ety
an
d r
elia
bili
ty
Ach
ieve
Fu
ll A
cce
ssib
ility
Me
et
Re
gula
tory
Re
qu
ire
men
t
Imp
rove
Eq
uit
y
Rail Renewal MWD
$5,900,000 • • •
Rail Renewal RID
$5,104,000 • • •
Rail Renewal UPR
$1,000,000 • • •
Crossings (Road & Track) MWD
$11,500,000 • • •
Crossings (Road & Track) RID
$4,000,000 • • •
Crossings (Road & Track) UPR
$1,500,000 • • •
Ties & Ballast UPR
$8,450,000 • • •
Crossings (Road & Track) MED
$2,250,000 • • •
Bridges & Retaining Walls BNS
$2,000,000 • • •
Ties, Ballast & Switch Heaters BNS
$11,550,000 • • •
Ties & Ballast RID
$4,950,000 • • •
Undercutting & Surfacing MED
$750,000 • • •
Undercutting & Surfacing MWD
$750,000 • • •
Undercutting & Surfacing RID
$3,000,000 • • •
Undercutting & Surfacing UPR
$1,250,000 • • •

Proposed 2022 Operating Budget, Page 79 of 99 Two-Year Financial Plan, and Five-Year Capital Plan
Strategic Goals Core Requirements
Priority
Project
Estimated 10-
Year Need for
Priority Project
Individual
Capital Project
Title
Total 5-Year
Funding
Programmed De
live
r V
alu
e o
n O
ur
Inve
stm
en
t
Bu
ild o
n S
tre
ngt
hs
of
Ou
r N
etw
ork
Stay
Co
mp
eti
tive
Mai
nta
in a
nd
imp
rove
saf
ety
an
d r
elia
bili
ty
Ach
ieve
Fu
ll A
cce
ssib
ility
Me
et
Re
gula
tory
Re
qu
ire
men
t
Imp
rove
Eq
uit
y
Rail Renewal BNS
$3,630,000 • • •
Rail Renewal MED
$2,400,000 • • •
Rail Renewal MWD
$1,300,000 • • •
Rail Renewal RID
$1,500,000 • • •
Rail Renewal UPR
$500,000 • • •
Crossings (Road & Track) RID
$3,000,000 • • •
Crossings (Road & Track) UPR
$500,000 • • •
Crossings (Road & Track) MED
$1,500,000 • • •
Bridges & Retaining Walls BNS
$4,250,000 • • •
75th Street Corridor
$1,746,000,000 75th Street Corridor
$0 • • •
Fleet Modernization Plan
$1,690,415,786
New Rail Cars Purchase
$148,912,000 • • •
Car Rehab (Nippon Sharyo P-5)
$38,000,000 • • •
Zero-Emissions Locomotives
$6,800,000 • • •
New Rail Cars Purchase
$130,000,000 • • •

Proposed 2022 Operating Budget, Page 80 of 99 Two-Year Financial Plan, and Five-Year Capital Plan
Strategic Goals Core Requirements
Priority
Project
Estimated 10-
Year Need for
Priority Project
Individual
Capital Project
Title
Total 5-Year
Funding
Programmed De
live
r V
alu
e o
n O
ur
Inve
stm
en
t
Bu
ild o
n S
tre
ngt
hs
of
Ou
r N
etw
ork
Stay
Co
mp
eti
tive
Mai
nta
in a
nd
imp
rove
saf
ety
an
d r
elia
bili
ty
Ach
ieve
Fu
ll A
cce
ssib
ility
Me
et
Re
gula
tory
Re
qu
ire
men
t
Imp
rove
Eq
uit
y
Car And Locomotive Cameras
$10,000,000 • • •
Car Rehab (Nippon Sharyo P-5)
$36,000,000 • • •
Locomotive and Car Improvements
$10,000,000 • • •
PTC - Renewal (Mechanical)
$2,800,000 • • •
Zero-Emissions Locomotives
$750,000 • • •
New Rail Cars Purchase
$27,588,000 • • •
Car Rehab (Nippon Sharyo Highliners)
$34,532,466 • • •
Locomotive Rehab Units 100-149,215,216
$5,050,000 • • •
Car Rehab (Nippon Sharyo P-5)
$45,400,000 • • •
Traction Motors $8,400,000 • • •
Wheel Replacement
$17,000,000 • • •
COVID-19 Modifications
$7,850,000 • • •
Switch Locomotive Procurement
$24,000,000 • • •
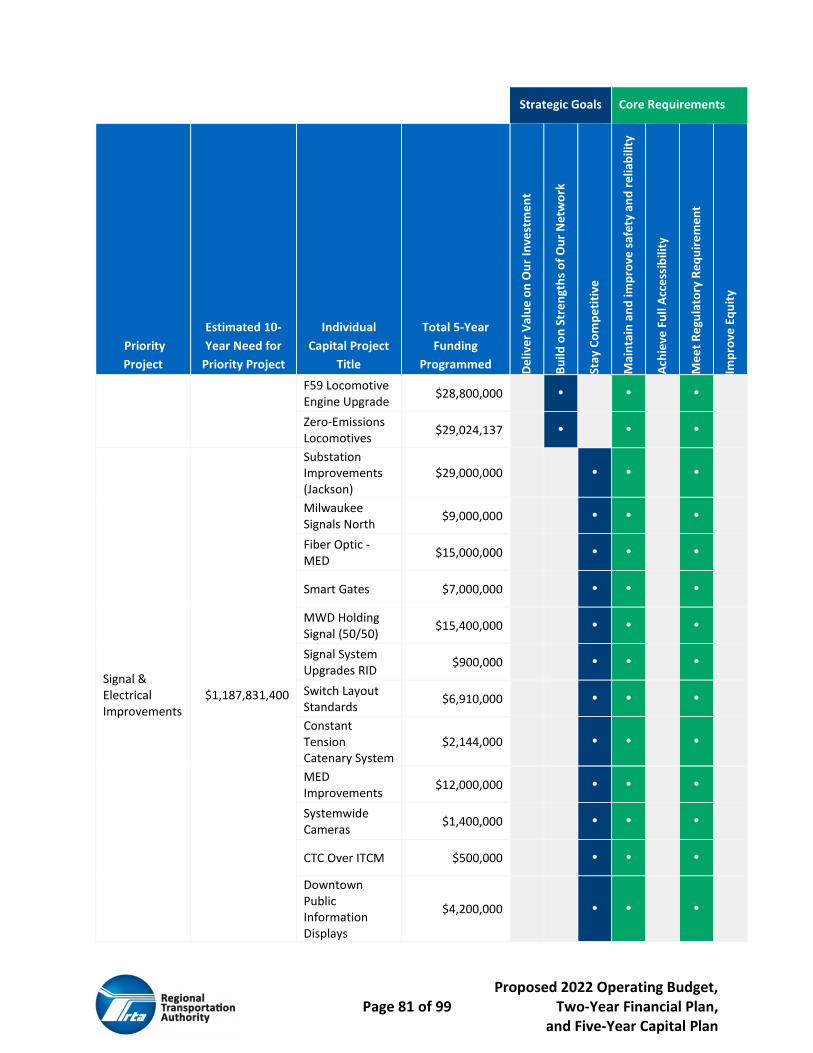
Proposed 2022 Operating Budget, Page 81 of 99 Two-Year Financial Plan, and Five-Year Capital Plan
Strategic Goals Core Requirements
Priority
Project
Estimated 10-
Year Need for
Priority Project
Individual
Capital Project
Title
Total 5-Year
Funding
Programmed De
live
r V
alu
e o
n O
ur
Inve
stm
en
t
Bu
ild o
n S
tre
ngt
hs
of
Ou
r N
etw
ork
Stay
Co
mp
eti
tive
Mai
nta
in a
nd
imp
rove
saf
ety
an
d r
elia
bili
ty
Ach
ieve
Fu
ll A
cce
ssib
ility
Me
et
Re
gula
tory
Re
qu
ire
men
t
Imp
rove
Eq
uit
y
F59 Locomotive Engine Upgrade
$28,800,000 • • •
Zero-Emissions Locomotives
$29,024,137 • • •
Signal & Electrical Improvements
$1,187,831,400
Substation Improvements (Jackson)
$29,000,000 • • •
Milwaukee Signals North
$9,000,000 • • •
Fiber Optic - MED
$15,000,000 • • •
Smart Gates $7,000,000 • • •
MWD Holding Signal (50/50)
$15,400,000 • • •
Signal System Upgrades RID
$900,000 • • •
Switch Layout Standards
$6,910,000 • • •
Constant Tension Catenary System
$2,144,000 • • •
MED Improvements
$12,000,000 • • •
Systemwide Cameras
$1,400,000 • • •
CTC Over ITCM $500,000 • • •
Downtown Public Information Displays
$4,200,000 • • •

Proposed 2022 Operating Budget, Page 82 of 99 Two-Year Financial Plan, and Five-Year Capital Plan
Strategic Goals Core Requirements
Priority
Project
Estimated 10-
Year Need for
Priority Project
Individual
Capital Project
Title
Total 5-Year
Funding
Programmed De
live
r V
alu
e o
n O
ur
Inve
stm
en
t
Bu
ild o
n S
tre
ngt
hs
of
Ou
r N
etw
ork
Stay
Co
mp
eti
tive
Mai
nta
in a
nd
imp
rove
saf
ety
an
d r
elia
bili
ty
Ach
ieve
Fu
ll A
cce
ssib
ility
Me
et
Re
gula
tory
Re
qu
ire
men
t
Imp
rove
Eq
uit
y
Impedance Bonds
$2,850,000 • • •
16th St. Interlocker
$12,000,000 • • •
A-20 (Techny) Interlocker
$12,000,000 • • •
Lake St. Interlocker
$33,000,000 • • •
Morgan Interlocking
$5,500,000 • • •
Western Interlocking
$3,000,000 • • •
Substation Improvements (Jackson)
$6,400,000 • • •
Chicago Union Station Interlockers
$20,000,000 • • •
Signal System Upgrades MED
$4,850,000 • • •
Signal System Upgrades MWD
$4,800,000 • • •
Signal System Upgrades RID
$3,950,000 • • •
PTC Renewal (Engineering)
$5,000,000 • • •
A-2 Interlocking Replacement
$1,100,000,000 Project Development
$2,600,000 • •
Rail Station Improvements
$762,073,929 79th St. Station Chatham
$13,900,000 • • •

Proposed 2022 Operating Budget, Page 83 of 99 Two-Year Financial Plan, and Five-Year Capital Plan
Strategic Goals Core Requirements
Priority
Project
Estimated 10-
Year Need for
Priority Project
Individual
Capital Project
Title
Total 5-Year
Funding
Programmed De
live
r V
alu
e o
n O
ur
Inve
stm
en
t
Bu
ild o
n S
tre
ngt
hs
of
Ou
r N
etw
ork
Stay
Co
mp
eti
tive
Mai
nta
in a
nd
imp
rove
saf
ety
an
d r
elia
bili
ty
Ach
ieve
Fu
ll A
cce
ssib
ility
Me
et
Re
gula
tory
Re
qu
ire
men
t
Imp
rove
Eq
uit
y
Elmhurst Station $1,000,000 • • •
103rd St. Station Rosemoor
$8,900,000 • • •
Rogers Park Station
$9,275,000 • • •
Auburn Park New Station
$6,500,000 • • •
147th St./Sibley Blvd Station
$9,400,000 • • •
87th Street Station Woodruff
$3,900,000 • • •
Arlington Park Station-Parking
$6,237,000 • • •
TROI - NET Station Displays
$329,000 • • •
Downtown Station Signs
$530,000 • • •
Peterson Ridge New Station
$650,000 • • •
Olympia Fields Station & Parking
$3,500,000 • • •
Systemwide Station Signs
$16,000,000 • • •
Elevator Replacement
$15,050,000 • • •
Shelters $5,500,000 • • •
TROI - NET Station Displays
$4,671,000 • • •

Proposed 2022 Operating Budget, Page 84 of 99 Two-Year Financial Plan, and Five-Year Capital Plan
Strategic Goals Core Requirements
Priority
Project
Estimated 10-
Year Need for
Priority Project
Individual
Capital Project
Title
Total 5-Year
Funding
Programmed De
live
r V
alu
e o
n O
ur
Inve
stm
en
t
Bu
ild o
n S
tre
ngt
hs
of
Ou
r N
etw
ork
Stay
Co
mp
eti
tive
Mai
nta
in a
nd
imp
rove
saf
ety
an
d r
elia
bili
ty
Ach
ieve
Fu
ll A
cce
ssib
ility
Me
et
Re
gula
tory
Re
qu
ire
men
t
Imp
rove
Eq
uit
y
115th St Station $4,480,000 • • •
Van Buren St. Station
$5,750,000 • • •
West Chicago Station
$6,050,000 • • •
Westmont Station
$2,000,000 • • •
Millennium Station-MEP Upgrades
$3,650,000 • • •
Platform Improvements
$21,800,000 • • •
Station Improvements
$5,700,000 • • •
Parking Lot Improvements
$2,500,000 • • •
River Forest Station
$900,000 • • •
Rogers Park Station
$16,825,000 • • •
Round Lake Station
$3,750,000 • • •
Congress Park Station
$4,750,000 • • •
Western Ave Station BNS
$300,000 • • •
University Park Station-Ramps & Canopies
$6,700,000 • • •
Kenilworth Station
$1,200,000 • • •
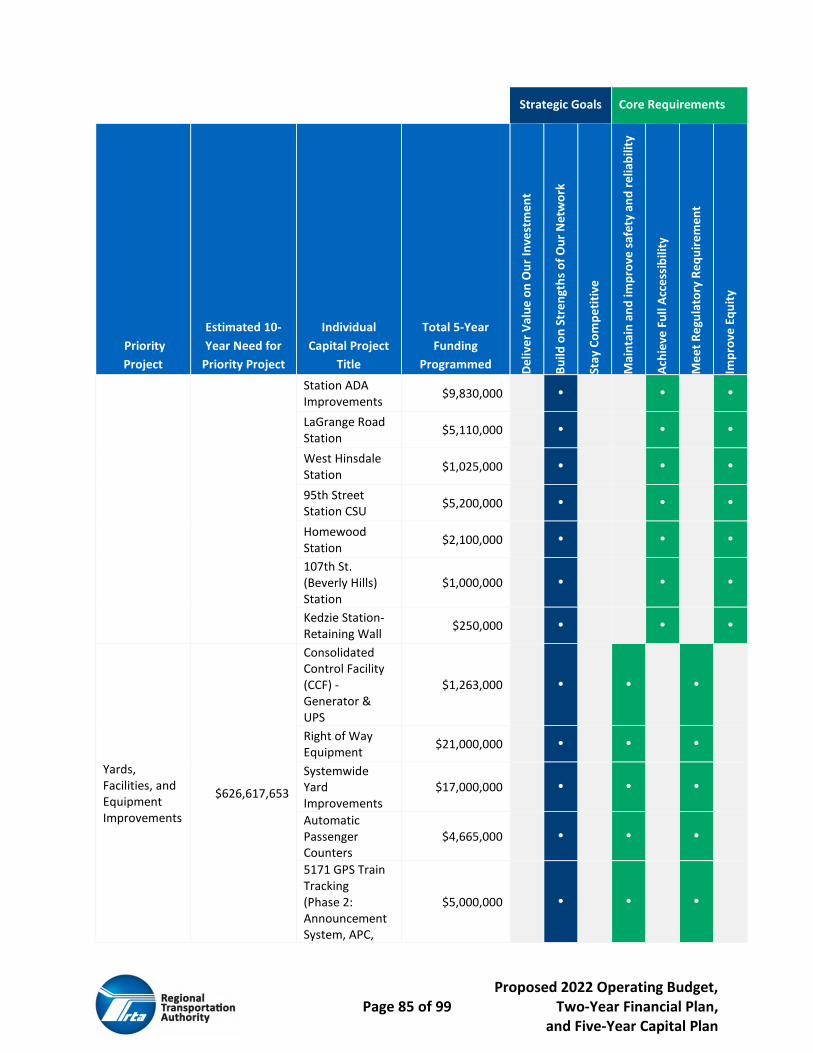
Proposed 2022 Operating Budget, Page 85 of 99 Two-Year Financial Plan, and Five-Year Capital Plan
Strategic Goals Core Requirements
Priority
Project
Estimated 10-
Year Need for
Priority Project
Individual
Capital Project
Title
Total 5-Year
Funding
Programmed De
live
r V
alu
e o
n O
ur
Inve
stm
en
t
Bu
ild o
n S
tre
ngt
hs
of
Ou
r N
etw
ork
Stay
Co
mp
eti
tive
Mai
nta
in a
nd
imp
rove
saf
ety
an
d r
elia
bili
ty
Ach
ieve
Fu
ll A
cce
ssib
ility
Me
et
Re
gula
tory
Re
qu
ire
men
t
Imp
rove
Eq
uit
y
Station ADA Improvements
$9,830,000 • • •
LaGrange Road Station
$5,110,000 • • •
West Hinsdale Station
$1,025,000 • • •
95th Street Station CSU
$5,200,000 • • •
Homewood Station
$2,100,000 • • •
107th St. (Beverly Hills) Station
$1,000,000 • • •
Kedzie Station-Retaining Wall
$250,000 • • •
Yards, Facilities, and Equipment Improvements
$626,617,653
Consolidated Control Facility (CCF) - Generator & UPS
$1,263,000 • • •
Right of Way Equipment
$21,000,000 • • •
Systemwide Yard Improvements
$17,000,000 • • •
Automatic Passenger Counters
$4,665,000 • • •
5171 GPS Train Tracking (Phase 2: Announcement System, APC,
$5,000,000 • • •

Proposed 2022 Operating Budget, Page 86 of 99 Two-Year Financial Plan, and Five-Year Capital Plan
Strategic Goals Core Requirements
Priority
Project
Estimated 10-
Year Need for
Priority Project
Individual
Capital Project
Title
Total 5-Year
Funding
Programmed De
live
r V
alu
e o
n O
ur
Inve
stm
en
t
Bu
ild o
n S
tre
ngt
hs
of
Ou
r N
etw
ork
Stay
Co
mp
eti
tive
Mai
nta
in a
nd
imp
rove
saf
ety
an
d r
elia
bili
ty
Ach
ieve
Fu
ll A
cce
ssib
ility
Me
et
Re
gula
tory
Re
qu
ire
men
t
Imp
rove
Eq
uit
y
Event Recorders)
Enterprise Asset Management System
$5,500,000 • • •
Transportation Division Software
$1,000,000 • • •
Financial Systems Replacement
$2,000,000 • • •
Automatic Passenger Counters
$2,000,000 • • •
Automatic Passenger Counters
$335,000 • • •
Central Warehousing
$4,525,000 • • •
Facilities - Electrical RID
$440,000 • • •
Yard Improvements UPR
$520,000 • • •
Right of Way Equipment
$6,500,000 • • •
Office Equipment
$2,050,000 • • •
IT Components & Services
$4,250,000 • • •
Building Improvements - 547 W Jackson
$10,000,000 • • •

Proposed 2022 Operating Budget, Page 87 of 99 Two-Year Financial Plan, and Five-Year Capital Plan
Strategic Goals Core Requirements
Priority
Project
Estimated 10-
Year Need for
Priority Project
Individual
Capital Project
Title
Total 5-Year
Funding
Programmed De
live
r V
alu
e o
n O
ur
Inve
stm
en
t
Bu
ild o
n S
tre
ngt
hs
of
Ou
r N
etw
ork
Stay
Co
mp
eti
tive
Mai
nta
in a
nd
imp
rove
saf
ety
an
d r
elia
bili
ty
Ach
ieve
Fu
ll A
cce
ssib
ility
Me
et
Re
gula
tory
Re
qu
ire
men
t
Imp
rove
Eq
uit
y
Communication Systems Improvements
$4,165,000 • • •
Enterprise Asset Management System
$18,750,000 • • •
Transportation Division Software
$1,000,000 • • •
Cyber Security Systems
$2,000,000 • • •
Facilities - Electrical MED
$4,000,000 • • •
Facilities - Electrical MWD
$3,700,000 • • •
Facilities - Electrical RID
$1,760,000 • • •
Consolidated Control Facility (CCF) - Generator & UPS
$447,000 • • •
Networking Equipment
$2,000,000
• • •
Yard Improvements BNS
$5,080,000
• • •
Yard Improvements MED
$1,990,000
• • •
Yard Improvements MWD
$2,370,000
• • •

Proposed 2022 Operating Budget, Page 88 of 99 Two-Year Financial Plan, and Five-Year Capital Plan
Strategic Goals Core Requirements
Priority
Project
Estimated 10-
Year Need for
Priority Project
Individual
Capital Project
Title
Total 5-Year
Funding
Programmed De
live
r V
alu
e o
n O
ur
Inve
stm
en
t
Bu
ild o
n S
tre
ngt
hs
of
Ou
r N
etw
ork
Stay
Co
mp
eti
tive
Mai
nta
in a
nd
imp
rove
saf
ety
an
d r
elia
bili
ty
Ach
ieve
Fu
ll A
cce
ssib
ility
Me
et
Re
gula
tory
Re
qu
ire
men
t
Imp
rove
Eq
uit
y
Yard Improvements RID
$1,260,000
• • •
Yard Improvements UPR
$2,520,000
• • •
Systemwide Yard Improvements
$10,000,000
• • •
Chicago Union Station Improvements
$525,000,000 Chicago Union Station Improvements
$0
• • •
Admin and Uncategorized Projects
Administration - Metra
$183,038,405
Transit Asset Management
$2,500,000 • •
Program Management
$70,000,000 • •
Project Administration
$2,350,000 • •
Contingencies $1,986,080 • •
Infrastructure Engineering
$6,875,000 • •
Project Administration
$2,350,000 • •
Contingencies $3,132,206 • •
Infrastructure Engineering
$6,875,000 • •
Total 10-Year Needs
$11,831,660,015 Total 5-Year Funding
$ 1,497,484,889

Proposed 2022 Operating Budget, Page 89 of 99 Two-Year Financial Plan, and Five-Year Capital Plan
Strategic Goals Metra selected a strategic goal from Invest in Transit for each of the projects presented in the capital program. Metra’s projects have a focus on the goal of build on strengths of our network (81% of projects). Deliver value on our investment represents 14% of projects and stay competitive accounts for 5% of projects, as shown in Figure 47. Projects such as rehab rail cars and locomotives, work on the right of way, and station rehabs were marked as build on strengths of our network as they will enable the system to continue serving the region. Improvements to switches and interlockers, signal, and substation improvements, all of which improve speed and reliability of the system, were marked with the strategic goal of stay competitive. Projects like engineering and administration fulfill the goal of deliver value on investment.
Figure 47. Number of Metra Projects Advancing Each Strategic Goal
When looking at funding by goal, the largest portion of funding goes toward projects assigned to build on strengths of our network, with 79% ($1.182 billion) of funds addressing this goal. Deliver value on investment was selected for 15% ($219.4 million) of funds and stay competitive accounted for 6% ($96.1 million) of funds, as shown in Figure 48. A large portion of Metra’s capital program is focused on replacing the older fleet and rebuilding the network, including track, stations, and bridges, and this all aids in building on and improving the quality of the existing network.

Proposed 2022 Operating Budget, Page 90 of 99 Two-Year Financial Plan, and Five-Year Capital Plan
Figure 48. Amount of Metra Funding Advancing Each Strategic Goal (dollars in millions)
Core Requirements Metra selected either one or two of the core requirements for each of the projects in the 2022-2026 capital program. The most common core requirement is meet regulatory requirements, which was selected for 133 projects. Maintain and improve safety and reliability was selected for 121 projects, achieve full accessibility were selected for 46 projects and improve equity was a requirement of 39 projects, seen in Figure 49.
Figure 49. Number of Metra Projects Addressing Each Core Requirement
NOTE: Question is asked as multi-response, Service Boards may select up to two core requirements per project.
From a funding perspective, by core requirement, $855.5 million of the funding goes toward projects that meet regulatory requirements, $741.4 million towards maintain and improve safety and reliability, $681.7 towards achieving full accessibility and $617.7 towards improving equity, as shown in Figure 50.

Proposed 2022 Operating Budget, Page 91 of 99 Two-Year Financial Plan, and Five-Year Capital Plan
Figure 50. Amount of Metra Funding Addressing Each Core Requirement (dollars in millions)
NOTE: Question is asked as multi-response, Service Boards may select up to two core requirements per project.
The new performance-based programming methodology requires that each Service Board program at least 20% of funding to projects that either achieve full accessibility or improve equity, beginning in 2025. Table 17 shows the projects and dollar value of those projects that are programmed to either equity or accessibility projects. Metra’s program has a significant focus on equity and accessibility projects with 54% of projects meeting one of these requirements in 2025 and 53% in 2026. Some of the main accessibility projects include new accessible rail cars and improving the accessibility at various stations throughout the system. Equity projects include station improvements and new rail cars, both of which will provide improvements to Metra service.
Table 17. Metra Accessibility and Equity Project Highlights
Description 2025 2026 Achieve Full Accessibility
Improve Equity
New Rail Cars Purchase $74,456,000 $74,456,000 • •
Olympia Fields Station & Parking $3,500,000 $0 • •
Car Rehab (Nippon Sharyo P-5) $12,500,000 $6,000,000 • •
Systemwide Station Signs $2,400,000 $2,400,000 •
New Rail Cars Purchase $20,544,000 $7,044,000 • •
Car Rehab (Nippon Sharyo Highliners) $7,510,822 $7,510,822 • •
Car Rehab (Nippon Sharyo P-5) $12,500,000 $19,000,000 • •
Millennium Station-MEP Upgrades $240,000 $0 • •
Platform Improvements $4,000,000 $4,000,000 •
Parking Lot Improvements $1,000,000 $1,000,000 • •
Rogers Park Station $4,850,000 $9,500,000 • •
Round Lake Station $3,000,000 $0 • •
University Park Station-Ramps & Canopies $3,000,000 $3,000,000 • •
Station ADA Improvements $1,900,000 $2,000,000 • •

Proposed 2022 Operating Budget, Page 92 of 99 Two-Year Financial Plan, and Five-Year Capital Plan
Description 2025 2026 Achieve Full Accessibility
Improve Equity
West Hinsdale Station $1,025,000 $0 • •
Station Improvements $2,000,000 $1,700,000 •
Total $154,425,822 $137,610,822
Total Annual Program $286,723,403 $260,447,915
Percent of Program toward Accessibility and Equity
53.9% 52.8%
Overall, like the other Service Boards, Metra’s goals are primary focused on maintaining the system and meeting regulatory requirements. Lesser funds are available for improving accessibility and equity. With more funds, Metra would better be able to address these issues.
Pace Suburban Service Capital Program Pace’s 2022-2026 Capital Program has $289.2 million of available funding with an approximately $1.142 billion 10-year funding need for priority projects. The 2022-2026 Capital Program continues to focus on maintaining Pace’s most valuable assets, its rolling stock as well as providing for maintenance of other assets, but also shifts the focus of capital investment into more environmentally friendly vehicles. More than 20% of Pace’s 2022-2026 capital program will be used to invest in electric buses as well as the charging infrastructure and garage upgrades needed to support the new technology.
Capital Funding by Source Pace’s 2022-2026 Capital Program has four funding sources: federal funds 74.2%; PAYGO funds 23.5%; Innovation, Coordination, & Enhancement (ICE) funds 2.0%; and Pace Service Board Capital 0.3%. As with the other Service Boards, Pace funding shows a bigger focus on federal funding in the 2022-2026 plan compared to the previous two programs because all the Rebuild Illinois bond funds were programmed in 2020 and 2021. The region continues to work with the state to find additional stable funding sources such as PAYGO to augment federal transportation funds and allow the region to better meet the capital need to maintain the system and provide for transformative projects, such as electrification of the Pace bus network.

Proposed 2022 Operating Budget, Page 93 of 99 Two-Year Financial Plan, and Five-Year Capital Plan
Figure 51. Pace 2022-2026 Capital Program Funding: $289.2 M (dollars in millions)
Capital Funding by Priority Projects Pace has identified 21 priority projects as part of their 10-year funding needs. Of the 21 priority projects, as shown in Table 18, Pace has been able to dedicate some funding to 14 projects in the 2022-2026 capital plan. Three projects have been fully funded and serval others have between a third and a half of funding needed in the five-year program. Many of Pace’s projects that are unfunded are focused on expanding services. These types of expansions have been put on hold due to reductions in ridership during the pandemic. Pace will reevaluate these needs as transit recovers over the coming years. As in previous years, most projects are focused on maintaining and replacing Pace’s fleet of vehicles, which includes transitioning to electric buses. The 10-year need for buses increased by $137 million because the cost of an electric bus is nearly double that of a diesel bus, and there are additional needs of more than $50 million for facilities to support the charging infrastructure and other requirements of electric buses. In addition, Pace is funding several projects that are designed to improve the passenger experience including new fareboxes, new real time signage, new Transit Signal Priority (TSP) infrastructure to support Pulse corridors, and security cameras for passenger safety.
Table 18. Pace Priority Projects
Priority Project
Estimated 10-Year Need for
Priority Project
Total 5-Year Funding
Programmed
Fixed Route Buses – Replacement $386,300,000 $48,400,000
Associated Capital Maintenance Items $89,600,000 $28,815,976
Pulse Infrastructure $84,525,000 $0
Fixed Route Buses – Expansion $83,889,000 $0
Improve Support Facilities $82,700,000 $41,350,000
Improve Passenger Facilities - Transportation Centers $78,000,000 $39,000,000
Paratransit Vehicles – Replacement $60,135,000 $24,914,827
Electric Buses $52,000,000 $52,000,000

Proposed 2022 Operating Budget, Page 94 of 99 Two-Year Financial Plan, and Five-Year Capital Plan
Priority Project
Estimated 10-Year Need for
Priority Project
Total 5-Year Funding
Programmed
Security, Computer, Software, and Office Systems Upgrades $49,400,000 $5,500,000
Regional Transit Signal Priority (RTSP) $39,000,000 $5,674,492
Pedestrian Infrastructure/ Shelters/Signs $32,050,000 $11,915,371
Support Equipment/Non-Revenue Vehicles $22,850,000 $2,000,000
Intelligent Bus System (IBS) Replacement $20,400,000 $7,125,000
Community Vehicles – Replacement $19,095,000 $6,555,000
Vanpool Vehicles – Replacement $14,560,000 $2,720,000
Paratransit Vehicles – Expansion $13,000,000 $0
Improve Passenger Facilities -Park-n-Ride Lots $7,450,000 $0
Farebox System $3,079,344 $3,079,344
Community Vehicles – Expansion $3,000,000 $0
Construct New Support Facilities* FULLY FUNDED $0
Bus on Shoulder (BoS) Infrastructure* FULLY FUNDED $0
Admin and Uncategorized Needs Uncategorized Projects – Pace $1,000,000 $1,000,000
Total $1,142,033,344 $279,050,010
*Indicates projects needs are fully funded
Data will be further analyzed by looking at core requirements, and strategic goals. Table 19 shows information for every Pace project, and Appendix A contains the detailed data for each project.

Proposed 2022 Operating Budget, Page 95 of 99 Two-Year Financial Plan, and Five-Year Capital Plan
Table 19. Pace Priority Project Summary
Strategic
Goals
Core
Requirements
Priority Project
Estimated 10-
Year Need for
Priority Project
Individual Capital Project
Title
Total 5-Year
Funding
Programmed De
live
r V
alu
e o
n O
ur
Inve
stm
en
t
Bu
ild o
n S
tre
ngt
hs
of
Ou
r N
etw
ork
Stay
Co
mp
eti
tive
Mai
nta
in a
nd
imp
rove
saf
ety
an
d r
elia
bili
ty
Ach
ieve
Fu
ll A
cce
ssib
ility
Me
et
Re
gula
tory
Re
qu
ire
me
nt
Imp
rove
Eq
uit
y
Fixed Route Buses -
Replacement $386,300,000
Fixed Route CNG Buses $48,400,000 • • •
Fixed Route Coach Buses $9,100,000 • • •
Associated Capital
Maintenance Items $89,600,000
Engine/Transmission
Retrofits & Associated
Capital
$28,815,976 • •
Pulse Infrastructure $84,525,000 Pace Infrastructure $0 • • •
Fixed Route Buses - Expansion $83,889,000 Fixed Route Buses -
Expansion $0 • • •
Improve Support Facilities $82,700,000
Fire Loop System $2,050,000 • • •
Charging Infrastructure $4,000,000 • • •
Improve Support Facilities $35,300,000 • • •
Improve Passenger Facilities -
Transportation Centers $78,000,000
Improve Passenger
Facilities $39,000,000 • • •
Paratransit Vehicles -
Replacement $60,135,000 Paratransit Vehicles
$15,580,000 • • •
$9,334,827 • • •
Electric Buses $52,000,000 Fixed Route Electric Buses $52,000,000 • • •
Security, Computer, Software,
and Office Systems Upgrades $49,400,000
Security System $1,500,000 • •
Computer
Systems/Hardware &
Software
$4,000,000 • • •
Regional Transit Signal Priority
(RTSP) $39,000,000 IBS - Security Cameras $5,674,492 • •
Pedestrian Infrastructure/
Shelters/Signs $32,050,000
Bus Stop Shelters/Signs $9,290,371 • •
Bus Tracker Signs $2,625,000 • •
Support Equipment/Non-
Revenue Vehicles $22,850,000
Support Equipment/Non-
Revenue Vehicles $2,000,000 • •
Intelligent Bus System (IBS)
Replacement $20,400,000 Intelligent Bus System $7,125,000 • •
Community Vehicles -
Replacement $19,095,000
Community Transit/On
Demand Vehicles $6,555,000 • • •

Proposed 2022 Operating Budget, Page 96 of 99 Two-Year Financial Plan, and Five-Year Capital Plan
Vanpool Vehicles -
Replacement $14,560,000 Vanpool Vehicles $2,720,000 • • •
Paratransit Vehicles -
Expansion $13,000,000 Paratransit Vehicles $0 • • •
Improve Passenger Facilities -
Park-n-Ride Lots $7,450,000
Improve Passenger
Facilities -Park-n-Ride Lots $0 • • •
Farebox System $3,079,344 Farebox System
Replacement $3,079,344 • • •
Community Vehicles -
Expansion $3,000,000
Community Transit/On
Demand Vehicles $0 • • •
Construct New Support
Facilities FULLY FUNDED
Construct New Support
Facilities - Wheeling $0 • •
Bus on Shoulder (BoS)
Infrastructure FULLY FUNDED
Bus on Shoulder (BoS)
Infrastructure $0 • • •
Admin and Uncategorized Projects
Uncategorized Projects - Pace $1,000,000 Unanticipated Capital $1,000,000 • •
Total 10-Year Needs $1,142,033,344 Total 5-Year Funding $289,150,010
Strategic Goals Pace selected one of the strategic goals from Invest in Transit for each of the projects presented in the capital program. Deliver value on our investment was the goal identified most often, with 53% of projects assigned to this goal. One-third of projects were assigned to stay competitive, and 14% to build on the strengths of the network, as shown in Figure 52. Pace’s projects categorized as delivering value on investment included purchase of new rolling stock, as well as improvement projects such as farebox replacements and intelligent bus systems. Projects assigned to the category of stay competitive included projects to electrify buses and technological solutions to improve the customer experience. Projects designated to build on the strengths of the network include improvements to signage and upgrades to passenger facilities including transportation centers and major bus stops.
Figure 52. Number of Pace Projects Advancing Each Strategic Goal
NOTE: Question is asked as multi-response, Service Boards may select up to two core requirements per project.

Proposed 2022 Operating Budget, Page 97 of 99 Two-Year Financial Plan, and Five-Year Capital Plan
The RTA also looks at dollars programmed to each goal; deliver value on investment continues to be the most funded goal, with 43% of funds ($125.4M) going toward these projects, while 39% of funds ($112.8M) to staying competitive and 18% ($50.9M) to build on the strengths of our network, as seen in Figure 53. Continuing the trend in the region, funding projects that deal with ongoing maintenance and support the existing system remain the most important components of Pace’s capital program. If more funding were available, Pace could more quickly roll out electric buses and related charging infrastructure, could improve the Pulse network to speed service, or could expand service as warranted.
Figure 53. Amount of Pace Funding Advancing Each Strategic Goal (dollars in millions)
Core Requirements Pace selected one or two core requirements for each of the projects in the 2022-2026 capital program. The top selected requirement was maintaining and improving safety and reliability, which was assigned to 19 projects. Fewer projects were assigned to the other core requirements with achieve full accessibility and improve equity accounting for seven projects each, and meet regulatory requirements for one project, as shown in Figure 54. Similar to the strategic goals above, most of Pace’s projects are focused on current operations and therefore classified as maintaining and improve safety and reliability.
Figure 54. Number of Pace Projects Addressing Each Core Requirement
NOTE: Question is asked as multi-response, Service Boards may select up to two core requirements per project.
From a funding by core requirement perspective, $264.2 million of the funding is going toward projects that maintain and improve safety and reliability, while $180.0 million help achieve full

Proposed 2022 Operating Budget, Page 98 of 99 Two-Year Financial Plan, and Five-Year Capital Plan
accessibility, $74.0 million help to improve equity and $2.1 million to fund regulatory requirements, seen in Figure 55.
Figure 55. Amount of Pace Funding Addressing Each Core Requirement (dollars in millions)
NOTE: Question is asked as multi-response, Service Boards may select up to two core requirements per project.
The new performance-based programming methodology requires that each Service Board program at least 20% of funding to projects that either achieve full accessibility or improve equity, beginning in 2025. Table 20 shows the projects and dollar value of those projects that are programmed to either equity or accessibility projects. Pace’s program has a significant focus on equity and accessibility projects with 82% of projects meeting one of these requirements in 2025 and 80% providing for equity or accessibility in 2026. Some of the main accessibility projects include new accessible vehicles and improving the accessibility at bus stops. Equity projects include the purchase of paratransit and vanpool vehicles as well as technology enhancements that make using Pace services easier.
Table 20. Pace Accessibility and Equity Project Highlights
Description 2025 2026
Achieve Full
Accessibility Improve
Equity
Fixed Route Electric Buses $ 14,000,000 $ 14,000,000 •
Paratransit Vehicles $ 4,554,550 $ 4,582,968 • •
Community Transit/On Demand Vehicles $ 1,615,000 $ 1,710,000 •
Vanpool Vehicles $ 1,360,000 $ 1,360,000 •
Improve Support Facilities $ 12,500,000 $ 12,000,000 •
Computer Systems/Hardware & Software $ 1,000,000 $ 1,000,000 •
Improve Passenger Facilities $ 13,000,000 $ 13,000,000 •
Total $ 48,029,550 $ 47,652,968
Total Annual Program $ 58,925,137 $ 59,344,010
Percent of Program toward Accessibility and Equity
81.5% 80.3%
Proposed 2022 Operating Budget, Page 99 of 99 Two-Year Financial Plan, and Five-Year Capital Plan
Overall, similarly to the other Service Boards, Pace’s primary goals of their projects are focused on maintaining the system. Equity and accessibility play a major role in Pace’s projects as well. RTA and the Service Boards are actively working to obtain more capital funding so that additional projects can be completed both to maintain the system as well as provide for more equitable and accessible transportation in the region.
RTA Capital Program The RTA’s portion of the proposed 2022-2026 Regional Capital Program totals $533,109, which is made up of set asides of the 2026 State PAYGO funding and funding for the Access to Transit program. After applying the performance-based programming for Federal Formula and PAYGO funds for 2025 and 2026, an estimated $209,629 was set aside until the next capital program. The programming of these funds will be determined by the RTA and Service Boards at a later date. Additionally, RTA is programming $323,480 for Access to Transit related projects.
Chicago Transit Authority567 W. Lake St.Chicago, IL 60661(888) 968-7282www.transitchicago.com
Metra547 W. Jackson Blvd.Chicago, IL 60661(312) 322-6777www.metra.com
Pace550 W. Algonquin Rd.Arlington Heights, IL 60005(847) 364-7223www.pacebus.com
175 W. Jackson Blvd., Ste. 1550 Chicago, Illinois 60604Phone: (312) 913-3200www.rtachicago.org
Follow us on
Proposed 2021 Operating Budget, Two-Year Financial Plan, and Five-Year Capital Program
November 2021