s,ateuite. en,~,ssi'orr:ra'nge ,inferred, surlvey … report, 1979 -. 1983 "t"i...
TRANSCRIPT

_L.-
,7
"'---'-
. JPL/PUBLICATION 84-16-'~
NASA-CR-17372819840019646
\- ,
S,ateUite. En,~,ssi'orr:Ra'nge ,Inferred," .,Earth, Surlvey ($ERIE.S)- ProJect:, Final
.~.Rep,ort on· R.es~arch.,and Development', ,I,
Phase~',1,979to"1~83 .' ~/ .
" L.A. Buennagel" ·P.F. MacDoran ', .' R~E. Neilan
. D.J. Spitzmesser:LE~ Young-
/
/
" ,
~ - / rj..<
, March 1, 1984.
;
"
',_NI\Sl\. 'National Aeron~utic~a'nd',' "
'Space Administration]
Jet· Propulsion Laboratory <
/ \ ---:- 'California'-Inst'itute of--Tecnnology,Pasadena; California ' -
"- -- /
,/
, ,,
0--.....i,'d·V?, ') 199L1
_1. ..... ~_.:}, ~L.-. ',~,
'.,:, LANGLEY RESEARCH CENTER
L18RARY.N~SI\ ,',
. ~ HA.~.1~TON,.VJRGINIA :'
: --"
/,
.' .--1
''-----,'
https://ntrs.nasa.gov/search.jsp?R=19840019646 2018-07-11T10:57:46+00:00Z


~":lPur;~nL-tH i l!J.:i-.'
".A T .-''' T '.1,,-'iii:". i '-.'-. i i',il_I J J. '_' __' J. I "!~_-:
================================================================================.1 1 RN/JPL-PUB-84-16
f""'.T,....,...,,1 , ..... ~r- I·--. ... Aiii ·-.. ..... i 'v' _-':-~ ,/ .,r"'; ;L.'. J. __'I !-i i I L..._•••• .::.- ...... .(I
34N27714** ISSUE 18 ~PAGE 2791 CATEGORY 4;.)PL-PtJB-E>i-15 f\lAS 1~',26~ 173728 Cr:·,lT=ti=: f:':lAS7-9·1E:'11'.'.-1 .f~r--.. T r- T r-r--. r"'.r-...~I ....... ..-P.• ..,..
l.if'Jl-LH::J:=i 1 r- 1 t.L} L.it)L·tjj'iit.i\i. t
RPT~= NASA-CR-173728
UTTL: Satellite Em1ss1on Range .Inferred Earth SurveY (SERIES) projectFinal Report, 1979 -. 1983
"T"I {,,""-M_
j L~r-';
MAJS: /*GEODESY/*GLOBAL POSITIONING SYSTEM/*MICROWAVE FREQUENCIES;*NAVIGATION/*'C"""'r...... /""-r-r-n/.. r-""!"'" "'T"r-1 ........~I/T ... I ...-·
~~HL~LNH~j j~HLKl~~~
MINS: / ACCURACY/ COST EFFECTIVENESS/ GUIDANCE CMOTION)/ RADIO STARS; VERY LONGBASE INTERFEROMETRY
AES; The Global Posittonjng SYstem (GPS) was developed by the Department ofr--__ ,-_. ._._-= ._'='1 •• r_._ .__ .. .=_._.J..:_._ •. __ 1- •• ~!__ !1._:.1._..I i"""-..L_~ __ .fo••
4! r- __ ~ __ ,_
L!eTefit:;e f-ir;Hictrt ~::f T()r [id\tlJ::.idlii}fi ~)t:;e ~)Y' tfle \...'f}i leu ~tdtet:; HfWeCj rt..:(c:et:;=
The sYstem will consist of a constel lat10u of 18 operational NavigationSatel1ite Tjmlng and Rangjng (NAVSTAR) satel1jtes by the late 1380!s:Dur~ng the last four Yea;s~ the Satel1 lt0 EmissjoD Range Inferred EarthSurveying (SERIES) team at the Jet Propulsion Laboratory (JPL) hasdeveloped a 00veJ receiver which is the heart of the SERIESsystem desjgned to use SfgnaJs broadcast from the GPS~ Th1s rece1ver does


JPL PUBLICATION 84-16
Satellite Emission Range InferredEarth Survey (SERIES) Project: FinalReport on Research and DevelopmentPhase, 1979 to 1983
L.A. BuennagelP.F. MacDoranR.E. NeilanD.J. SpitzmesserL.E. Young
March 1, 1984
NI\SI\National Aeronautics andSpace Administration
Jet Propulsion LaboratoryCalifornia Institute of TechnologyPasadena, California

The research described in this publication was carried out by the Jet PropulsionLaboratory, California Institute of Technology, under a contract with the NationalAeronautics and Space Administration.
Reference herein to any specific commercial product, process, or service by tradename, trademark, manufacturer, or otherwise, does not constitute or imply itsendorsement by the United States Government or the Jet Propulsion Laboratory,California Institute of Technology.

PREFACE
The work described in this report is a consequence of many years of research
and development activity on the use of radio interferometry at microwave
frequencies using compact radio stars as the sources of radio signals. The
initial SERIES engineering configuration, using the NAVSTAR satellites instead
of quasars, was to process the data by the Very Long Baseline Interferometry
(VLBI) techniques. This approach resulted in a complexity of data processing
which was not compatible with the concept of using the much stronger radio
signals. Fortunately, it turned out that using the one-way range measurement
from the satellite to each of the two earth stations greatly simplified the
entire project. Although the primary dedication of the research was to create
a system competitive in accuracy with the VLBI and laser ranging techniques
(but at much less cost in capital expenditures), two additional significant
results were achieved: 1) the ability to synchronize clocks to the few
nanosecond level at intercontinental distances in near real time, and 2) the
ability to measure the total columnar content of free electrons between the
NAVSTAR satellite and the earth receiver along the line of sight between them.
N. A. Renzetti, Manager
JPL Geodynamics Program
iii

ACKNOWLEDGEMENT
The authors wish to acknowledge the support of Mr. T. L. Fischetti
of NASA Headquarters for his foresight in funding the feasibility and
proof-of-concept work at JPL with regard to the application of the Global
Positioning System for precision earth surveying.
The authors gratefully acknowledge the assistance of their JPL
colleagues: M. G. Newsted, M. A. Smith and S. Harmon for the mechanical
design and fabrication of the portable stations; J. B. Thomas for theoretical
studies and system analysis; G. M. Resch and D. W. Curkendall for discussions
on system design options; H. N. Royden, R. M. Miller, and T. E. Litwin for VHF
Faraday rotation ionospheric monitoring at Goldstone, CA; A. L. Berkin for
assistance in taking data; S. J. DiNardo and C. J. Vegos for logistical
support. The cooperation of F. B. Varnum, Defense Mapping Agency and Sergeant
Wagner, Vandenberg AFB, is also acknowledged for making available the
approximate GPS satellite ephemerides used in the SERIES microcomputer for
pointing the 1.5 m antennas.
iv

CONTENTS
I. INTRODUCTION . · · · · · · . · · · · · · · · · · · · 1
II. STATEMENT OF THE CHALLENGE 5
III THEORY OF OPERATION · · · · · 6
IV. IMPLEMENTATION · · · · · · · · · 16
V. DIFFERENTIAL OBSERVATIONS · · · · · 22
VI. IONOSPHERIC CALIBRATIONS · · · · · · · · 23
VII. BASELINE ESTIMATION SOFTWARE · · · · · · · · · · · · · · 28
VIII. SERIES TEST SEQUENCE · · · · · · · · 29
IX. CURRENT SERIES STATUS · · · · 41
X. SYMBOL GLOSSARY · · · · · · · 43
REFERENCES . . . . . . . . · · · · · · . · · · · · · · · · · · · · · 45
Figures
1. One of the two SERIES proof-of-concept stations • • • •• 2
2. A two-dimensional illustration of conventional positioningusing a GPS receiver having code access • 7
3. SERIES differential positioning geometry 11
4.
5.
6.
7.
SERIES Doppler positioning Geometry
SERIES simplified block diagram • • •
SERIES delay and multiply technique ••
A schematic representation of the SERIES baselinesolution • • • • • • • • • • • • • • •
· .14
17
18
20
8.
9.
10.
SERIES technique for measurement of the columnar chargedparticle content • • • • • • • • •••
SERIES 150 m baseline length measurements
Comparison of SERIES and composite measurements of the21 km baseline •. . . . . • • . . . . • • . • • • • . .
v
25
31
33

11.
12.
13.
CONTENTS (Contd)
One nanosecond (10-9 second) agreement was observed oneach of two experiments in which a traveling clock wasused to verify SERIES clock synchronization measurementsmade on the 21 km baseline • • • • • • • • • • •
The P-codes are nearly in phase when transmitted fromthe GPS satellites, but suffer a differential delay dueto the presence of free electrons in the ionosphere • • •
The SERIES ionospheric measurements are shown as circles,while the Faraday rotation results are triangles
35
36
37
14. The calculated cumulative error in baseline length isshown for the SERIES receivers as tested •••••• . . 39
15. Table of SERIES baseline results
vi
. . . . . 40

ABSTRACT
The Global Positioning System (GPS) was developed by the Department of
Defense primarily for navigation use by the United States Armed Forces. The
system will consist of a constellation of 18 operational Navigation Satellite
Timing and Ranging (NAVSTAR) satellites by the late 1980's.
During the last four years, the Satellite Emission Range Inferred Earth
Surveying (SERIES) team at the Jet Propulsion Laboratory (JPL) has developed a
novel receiver which is the heart of the SERIES geodetic system designed to
use signals broadcast from the GPS. This receiver does not require knowledge
of the exact code sequence being transmitted. In addition, when two SERIES
receivers are used differentially to determine a baseline, few em accuracies
can be obtained.
The initial engineering test phase has been completed for the SERIES
Project. Baseline lengths, ranging from 150 meters to 171 kilometers, have
been measured with 0.3 em to 7 em accuracies. This technology, which is
sponsored by the NASA Geodynamics Program, has been developed at JPL to meet
the challenge for high precision, cost-effective geodesy, and to complement
the mobile Very Long Baseline Interferometry (VLBI) system for Earth surveying.
vii


I. INTRODUCTION
The commonly accepted model of the structure of the Earth's crust is that
it is composed of a set of tectonic plates. One of the stated objectives of
the NASA Geodynamics Program is to contribute to the understanding of the
processes that result in the movement and deformation of these tectonic
plates. The average rates of interplate motion over geologic time scales have
been determined from the geologic record to be in the range of a few
centitneters per year, but whether this motion is constant or episodic is
currently unknown.
Two space-based techniques, currently being supported by the Geodynamics
program, have been developed, and are capable, in principle, of measuring the
motions between plates in real time (a few years). These techniques are Very
Long Baseline Interferometry (VLBI) and Satellite LASER Ranging (SLR).
In addition to the large scale movement between tectonic plates, more
complicated motion in the Earth's crust is known to occur. An example of this
would be the local crustal distortion caused by the strain accumulation and
release near the boundaries of plates. It is necessary to describe such
motion in detail in order to be able to deduce the physical processes at work,
or to generalize such plate boundary interactions for study of the forces that
drive and resist plate motion. In order to adequately characterize these
distortions, it is necessary to measure a grid of reference points that is
densely sampled in space and time.
It is not possible to make such measurements using VLBI or SLk techniques
due to economic considerations. The requirement for the dense set of accurate
geodetic measurements, needed for regional geodesy and a number of related
studies, is the motivation for developing the Satellite Emission ~ange Inferred
Earth Surveying (SERIES) Global Positioning System (GPS) receiver which is
described in this report.
Two proof-of-concept SERIES stations (Fig. 1) have been constructed.
lhese stations each have a 1.S-m diameter prime feed parabolic dish antenna
1

N
Figure 1. One of the two SERIES proof-of-concept stations. Data aquisitionelectronics occupy a small portion of the camper shell. Theantenna is a 1.5 meter diameter, prime focus feed dish mountedon a two axis (azimuth and elevation) drive.

which provides approximately 23 dB of gain in the GPS signal. The receivers
have been constructed from off-the-shelf components wherever possible (Ref. 1).
The receivers contain a locally generated test signal for self-calibration.
Data can be recorded on either floppy disks or 9-track tapes.
The original SERIES implementation was to use the NAVSTARs as Radio
Frequency (RF) noise sources for Very Long Baseline Interferometry (VLBI)
terminals (Ref. 2). However, it was realized that the periodic structure in
the GPS signal could be used to provide ranging information even without code
sequence knowledge. By exploiting the periodic structure, the GPS signal
bandwidths were collapsed, and the data acquisition and post-processing were
greatly simplified.
The proof-of-concept statiohs have been tested on baselines up to 171 km
during the last year and a half. Baseline vectors determined with the SERIES
stations have demonstrated few em measurement accuracies for baselines of a
few tens of km (Ref. 3).
These SERIES stations are also capable of measuring the total columnar
content of free electrons integrated along the path between the receiver and
the GPS satellite. This measurement was validated through comparison with a
co-located Faraday rotation device, obtaining agreement to 1016 electrons
per meter squared (Ref. 4).
An additional feature of the SERIES technique is the ability to
synchronize clocks at different sites by receiving common signals from the
satellite. This was demonstrated by comparisons of clock offsets measured
with the SERIES stations against independent measurements made simultaneously
with an atomic clock carried between the two stations (Ref. 5). The agreement
between the two techniques was within 1 nanosecond (10- 9 second) for each of
the two experiments performed. The SERIES technique for clock synchronization
is expected to give accuracies of 1 to 10 nanoseconds for intercontinental
station separations.
3

Development of the SERIES technology is currently underway at JPL for the
following applications:
1. High-precision, cost-effective Earth surveying
2. Precision orbit determination of low-Earth orbiters
3. The precise positioning of marine platforms to aid in themeasurement of sea floor motions.
4

II. STATEMENT OF THE CHALLENGE
The satellite constellation of the GPS t when fully implemented in the
late 1980'st will be composed of 18 Earth satellites (Ref. 6). This constel
lation will illuminate the Earth with dual L-band microwave signals intended
to serve t primarilYt U.S. military needs for positioning and navigation. At
this writing t six satellites are in orbit and functional. The three main
elements of the GPS are the satellite segment (termed NAVSTAR) which develops
L-band signals from on-board atomic clocks and disseminates satellite
ephemeris information; a ground control segment that monitors and controls the
ephemeris of each satellite and the clocks in orbit; and a user segment that
receives the L-band signals to accomplish a wide variety of positioning and
navigation functions. Because of the nature of military missions t each
segment of the GPS has capability which is restricted t and the highest preci
sion NAVSTAR transmissions are encrypted in a manner originally designed to be
unavailable to the public.
In its highest precision mode for point positioning of a single receiver t
the GPS is required to have an accuracy of 16 meters in three dimensions.
However t for certain applications t such as crustal deformation monitoring to
provide inputs for geophysical modeling, sub-decimeter relative positioning
accuracy is the threshold of interest. The challenge is to devise a system
which (1) exploits the technology of the existing Global Positioning System;
(2) operates~ knowledge of the codes, while simultaneously obtaining an
accuracy level three orders of magnitude better than required by the original
GPS design; and (3) achieves these results with inexpensive equipment and
cost-effective data processing.
5

III. THEORY OF OPERATION
In order to understand the SERIES concept of GPS, it is useful to
consider the convential mode of operation in which the user has access to
the codes (see Fig. 2). Suppose an observer is located at a geocentric
vector position described as ~1 with the NAVSTAR-GPS located at geocentric+
vector position p. The observer acquires the satellite broadcast whens
the satellite rises above the horizon. Imagine that the clock aboard the
satellite, registering t , and the clock at the observer's radio receiver,s
registering t u ' are synchronized. If the apparent delay in the arrival of
the satellite clock pulses is ~t, then the apparent range to the satellite
is p = c ~t, where c is the speed of light.
The magnitude of the range varies between 25xl06 meters at satellite
rise and is set to a minimum of 20xl06 meters at the Time of Closest Approach
(TCA) to the observer's position. The rate of change of range causes the
P-code modulation to vary from its true frequency (f = 10.23 MHz) by an amount
equal to ±27 Hz with the true frequency value being observed at approximately
TCA. However, in the real world, neither the user's nor the satellite's clock
is exactly synchronized to an external frequency standard such as Universal
Time Coordinated (UTC). This results in an error in the observed range. The
observed range, p', now appears as
p' =1 p - R I + c(~t - ~t )s u u s
where the subscripts u and s denote user and satellite, respectively, and the
~t and ~t indicate clock bias with respect to the UTC. Also, theu s
measured frequency of the satellite signals, f, is in error by a summationmof errors in the clock rate of both user and satellite clocks, as well as
errors due to atmospheric range rate terms. This type of GPS measurement is
also known as single point or absolute positioning.
+In the conventional GPS configuration, the terms Ps and ~ts are
supplied to the user by a 50 bit-per-second telemetry message which contain~,
satellite ephemeris and clock state information. When a user decrypts
6

Pi = PSEUDO RANGE TO ith SATELLITE
USER RANGE ERRORDUE TO CLOCK OFFSETS: c(.~tu - ~t5i)
TRUE RANGE' p. = p~ - c(At - At .). I I U 51
NAVSTAR·GPS
1~(Xl' V,)
~t~TRUE USERPOSITION
APPARENTPOSITION
SATELLITECLOCK OFFSET
= USER CLOCK OFFSET
GIVEN INFO: Xi' Y i & Atsi
WHERE i = 1,20R3
SOLVE FOR: Xu- Yu & Atu
Figure 2. A two-dimensional illustration of conventional positioning using a GPSreceiver having code access

..
R ,u
as well as a fourth term which accounts for the user clock offset (Ref. 7).
signals from four NAVSTA.K satellites using the coarse acquisition (CiA) code
and the preclslon (P) code channels, the resulting measured pseudo ranges P'i'
permit solution of the user geocentric location, Ru • Four satellite
observations are necessary to solve for the three dimensional location,
The development of the SERIES system as described herein assumes no
knowledge of the CiA or P-code modulation sequence but can deduce differen
tial positioning information, implementing a theory very different from the
design concept of conventional GPS use.
The first challenge is to extract a usable signal from the encoded L-band
transmissions without a decrypting receiver. Briefly, that detection is
accomplished by a delay and multiply process that recovers the chipping rates
of the CiA and P-code modulations on the dual L-band carriers, as described in
Section IV of this report. This type of information acquisition has a range
ambiguity, unlike the pseudo-range observable derived by decrypting the GPS
P-code signals. Having no dependence upon the coded form of GPS transmissions
is such an advantage to a civilian user community that innovations to accom-
TIlodate this ambiguous data are well worth the effort. This is particularly
attractive when the resultant system can achieve a differential accuracy
improvement 1000 times better than the 16m accuracy designed into the conven
tional CPS mode. This improved accuracy is also possible for properly
designed conventional code correlating GPS receivers when used in a
differential mode.
The pseudo-range ambiguities are 2~.3m from P-code modulations extracted
from either the L1 or L2 channel and 2~3m from the CiA code modulation
which is available only on the L1 channel. The P-code ambiguity is resolved
by interpolating within the CiA code modulation to a precision of 10 meters
which represents a modest 3% of the CiA code cycle wavelength and requires an
amplitude Signal to Noise Ratio, SNR = 5. An ambiguity of some number of CiA
cycles (wavelength, 2~3m) is now present which can be resolved by the use of
Doppler positioning techniques accurate to 100 meters which are unambiguous.
Alternately, the 2~3 m ambiguities can be resolved using ~priori baseline
information. Thus, a method has been outlined which deduces unambiguous
pseuao ranges based on P-code modulation.
8

Consider the two dimensional case shown in Figure 2. To deduce the true
user position in absolute mode, a solution of the following system of
equations is performed:
~(Xu X )2 + (Y Y )2 pl1 - c(~t - 6t )1 u 1 u sl
v1(~ X )2 + (Y Y )2 p/2 - c(~t - ~t )2 u 2 u s2
~(~ _ X )2 + (Y - Y )2 p/3 - c(~tu - ~ts3)3 u 3
where p' l' p' 2' and p' 3 indicate actual measurements of the pseudo-range
from the user's receiver to the satellites which are located at the given
satellite positions of X. and Y. and with their individual satellite clock1 1
time offsets of 6t si where i = 1, 2 or 3.
For this two-dimensional case the three unknowns, Xu' Yu and ~tu are solved
for based upon the three observations P'1' P/2 and P/3. These measured
values are subsequently combined with corrections for various time delays to
produce an estimate of the true range, p.
The SERIES development, to be expanded upon in later sections, makes it
possible to measure the pseudo-ranges p'. without code knowledge. However,1
the satellite clock offset terms, 6t ., are generally unknown for each ofSl
the satellites being observed by a user without code knowledge. To avoid the
necessity of knowing satellite time, t s ' or the satellite clock offset,
6t si ' a pair of user stations now observes the three satellites, and the
measured pseudo ranges to each satellite are differenced between stations:
9

AllY offset in the epoch time of satellite transmission is an error presented
simultaneously to the two stations and is therefore common-mode eliminated in
the differential data type (see Fig. 3). This two-station differential data
type is also identical to the delay-data type developed by cross correlation
signal detection in Very Long Baseline Interferometry (VLBI).
lhus, the point positioning technique producing the geocentric location
of the user and the user clock offset (X , Y , ~t ) is abandoned inu u ufavor of a tecnnique for determining the differential location of station 2
A
relative to station 1. The unit vector S is located at station 1 and points
to the satellite signal source at a distance Pl' The baseline vector Bpoints from the antenna at station 2 to the antenna at station 1.
The satellite clock offsets are eliminated since they are common to each
station,Dut in their place a new clock parameter appears, that of the two
user clocks' offset. In general, clock 1 is not synchronized to clock 2.
Because the satellites are a finite distance away from the user receivers,
incomingwavefronts are spherical in shape. The VLBI geodetic experience
deals with extragalactic radio sources, which are virtually at infinity and
thus have planar wavefronts. As shown in Reference 8, the usual VLBI geodetic
equations can be recast into a modified form by including a spherical to
planar wavefront term, O. The set of differential pseudo-range equations
take on the form
(1)
where
and
~p' p' - P'2 1 (2)
where the prime indicates a measured quantity.
The term (&t u1 - &tu2 ) is the offset of clock 2 relative to clock 1 and
t TM is the differential time delay associated with the transmission media of
10

SPHERICALWAVEFRONT
WAVELENGTHAMBIGUITYRESOLVED BYDOPPLERPOSITIONING
~p= P2- Pl ~
~p' = -T (f2 T2 - f 1 T 1) + ~ (N2 - N1)
/\ I A-":>u.p = - S . B - {) + c(..1tu 1 -Atu2) + ctTM
~RA~SMI~IONI MEDIA ERROR
USER CLOCKDIFFERENTIALERROR
FREQ f 1COUNTER
STOPTIME T1INTERVAL
START COUNTER
Figure 3. SERIES differential positioning geometry

the troposphere and ionosphere through which the satellite signals must pass
in reaching the user receivers. The tropospheric delay calibration can be
ignored, modeled, or explicitly calibrated depending upon accuracy require
ments. The ionospheric delay can be explicitly measured without code
knowledge by exploiting the dual frequency NAVSTAR transmissions, as will be
discussed in subsequent sections. The terms N1 and N2 account for the
phase ambiguities associated with the SERIES technique at stations 1 and 2.
For example, the P-code chipping rate of f = 10.23 MHz is recovered and
exhibits a phase offset indicative of the pseudo-range, P., to the1
satellite but with an ambiguity of the P-code wavelength. In Figure 3, the
pseudo range at station 1 is formed by measuring the elapsed time from the
one-pulse-per second (1 pps) event markers of clock 1 to the next occurring
positive-going-zero crossing of the P-code's 10.23 MHz sinusoidal output
encountered by receiver 1.
The time interval counter (TIC) indicates a value T1 between 0 and
97.75 nanoseconds (1/10.23 MHz). The received P-code frequency will be
Doppler shifted by up to 27 Hz for a stationary receiver, and the actual
received frequency, f 1, is measured. The P-code fractional phase is now
formed by multiplying the f 1 by T1• The pseudo range is the wavelength
(elf) multiplied by the fractional phase,
(3)
where N1 clf is the integer number of whole P-code wavelength cycles (elf =A = 29.3 m) between the receiver and satellite, and f is the rest frequency
of the satellite P-code clock.
In this process it has been assumed that the geocentric location ofA
receiver 1 (R) the unit vectors from receiver 1 to the satellite, (S), and
the range from receiver 1 to the satellite (Pi) are known quantities.
Receiver 2 outputs are now measured relative to clock 2 and the pseudo
range from station 2 becomes
12

The differential pseudo range is now formed as
(4)
!;,p , p'z - P'l (5)
The true differential pseudo range, ~p, is functionally dependent upon the
baseline as indicated in equation (1).
The problem is now the determination of the ambiguity of whole cycles,
N elf. Figure 4 illustrates in two dimensions the physical situation of three
NAVSTAR satellites following each other around the Earth in their 12-hour
period circular orbits. The observer is located at Rand the satellites are+ + +
located at PsI' Ps 2 and Ps 3' The NAVSTAR satellites each transmit
the same frequency (fT), and the observer is assumed to have a receiver with
an oscillator synchronized to the same UTC frequency scale. The measured
Doppler frequency is
(6)
The velocity vector projections along the line of sight cause the Doppler
shift effect. Consider a simplification of a non-rotating Earth or a possible
observer at a very high latitude so that the Earth's rotational velocity is
very small compared to the satellite's velocity along its orbital path. Each
value of the Doppler frequency, fM, measured at time t, allows the look-up
or computation from ephemeris elements of the satellite state vector, contain
ing the position P. and velocity V .• Therefore, all possible placesS1 S1
where the observer could be located are on the surface of a cone whose vertex+is at the satellite position p , and whose axis of rotation lies along the
ssatellite's velocity vector. The half apex angle of the cone is given by
(7)
Since Figure 4 illustrates a two-dimensional situation, the intersection of
the cones with the plane of the figure reduces the loci of possible positions
13

,/,/
,//'
/',/
,/
Figure 4. SERIES Doppler positioning ~eometry

,
to lines of constant Doppler. The intersection of the lines of possible
position from satellites 1 and 3 are sufficient to determine the observer
position R. Satellite 2 is shown at the special case of zero Doppler occurring
at the time of closest approach (TCA) so that the observer must lie in a plane
defined by the normal to the satellite 2 velocity vector. Actually, two satel
lites would have been sufficient to determine R given the assumption of
synchronized receiver and satellite oscillators, but the third satellite adds
redundancy or an additional observation to solve for the receiver reference
oscillator frequency offset relative to the assumed synchronized satellite
transmitted frequencies fT.
Having
P'D =1 Ps
+ -I-determined R and having Ps as a given, the Doppler pseudo range
RI is deduced and equated to Equations (3) and (4). Thus,
N clf (f T)c/fm
(8)
is a solution for determining the ambiguity of the whole cycles, N c/f.
15

IV. IMPLEMENTATION
The innovations to be described were developed primarily in pursuit of
extraterrestrial geodesy by a system called Satellite Emission Range Inferred
Earth Surveying (SERIES) (Reference 8). However, the term SERIES used in these
descriptions will be considered as a generic term. Imagine one or more SERIES
devices receiving signals from four or more GPS satellites. Each station is
equipped with an antenna, a receiver and a data system (see Figure 5). The
challenge is to extract information from an encrypted spread spectrum, which
is bi-phase modulated with full carrier suppression using an unknown pseudo
random noise (PRN) code sequence. It is known (Reference 6) that the carriers
and rate of digital modulation transitions are controlled by the satellite
borne atomic frequency reference. All GPS satellites have an identical rate
of 10.23 mega-transitions per second which is termed the chip rate of the
P-code channel. Two other modulations are also present: 1.023 MHz, called the
coarse acquisition channel (CiA), and a 50-bit-per-second telemetry channel
containing satellite ephemeris data. Dual frequency bands are provided for
ionospheric calibration, and are L1 , centered at 1575.42 MHz, and L2 , at
1227.6 MHz. These are generated by multiplying the 10.23 MHz signal by 154
and 120, respectively.
To exploit these signals without code sequence knowledge, a nonlinear
detection scheme is used. The P and CiA code modulation transitions are
recovered when a delay and multiply method is employed (Figure 6). The effect
is to collapse a broadband 20.46 MHz signal (10.23 MHz, double sideband) into
a simple sinewave. Such methods have been common practice (References 9 and
10) to demodulate telemetry data synchronously, where the recovery of the
telemetry bit clock frequency is merely a means to the end of recovering the
telemetry bit stream. In the SERIES implementation, the actual P-code and CiA
code bit sequences are not explicitly used. The strategy is to exploit the
chip rate as a type of coherent range code which has ambiguities that can be
resolved. Specifically, by exploiting the fact that Doppler Positioning is
virtually unique, the ambiguities in the phase measurement of the CiA code can
be resolved, which in turn enables the resolution of P-code cycle ambiguities.
16

TIME---~ INTERVALr--_~ COUNTER
L1P-CODECHIP
L1CIA CODECHIP
FLTR1575±IO
SPREAD£RA-10 L
1+10 MHz
L1 1575.42 MHz
B.P.~----t~ FI LTER
1.1 TO1. 7 GHz
L1
&L2 FROM
GPS SATELLITE
~~
L2 1227. 6 MHz
FLTR1227±10 L2
P-CODECHIP
STATION ~ ~
CLOCK
Figure 5. SERIES simplified block diagram

B. P.FLTR
10.23 M b/sOR 1. 023 Mb/s
DELA "1-----,(
/2
49 nsOR 487 ns
rvvv10.23 MHzOR1.023 MHzSINEWAVE
I-t-T..j
UU-
-
~: - ......, II I
---: ~T/2I I
INCOMINGSIGNAL: s(t)
DELAYED +1SIGNAL: s(t-T/2)
-1L.L.JCl
+1::::>m(t) = s (t)I-
-J x s(t-T/2)a..-1..... ~
cc <C
BIT CLOCK +1SIGNAL, c,c + n = m(t) 0
TRI-LEVEL +1PSEUDO-RANDOM 0NOISE VARIABLE, n -1
TIME
Figure 6. SERIES delay and multiply technique

For some applications, there is a desire to have access to the L-band RF
carriers and the P and CiA-code channels' sub-carriers, all of which have been
coherently derived from the on-board spacecraft atomic frequency references.
Because of the needs of the conventional GPS mission, these signals are stable
to better than 10-12
sec. at 100 seconds averaging time (Reference 11).
Using these signal-squaring techniques, with a half-chip time delay in
the case of the sub-carriers, it is possible to recover the P-code modulation
rate of 10.23 MHz at both the L1 and L2 channels. These P-codes exhibit
Doppler shifts that span from 0 to ±27 Hz. The CiA-code modulation of 1.023
~lHz, usually present only on the L1 channel, is similarly recovered and has
a Doppler shift of 0 to ±2.7 Hz.
A major feature of the SERIES technique is now evident, that of infor
mation compression. In the beginning, there was a spread spectrum of 20.46
MHz width of unknown modulation, and now all the information necessary for
pseudo ranging and ionospheric calibration is contained in sinewaves which are
confined to a relatively narrow bandwidth. Specifically, for an Earth-fixed
observer all the P-code information is contained within a S4 Hz bandwidth, and
the CiA channel within S.4 Hz.
Imagine now a receiver that has input to it a signal from a single GPS
satellite. The CiA channel output of the 1.023 MB/S chipping rate is connected
to the stop channel of a time interval counter (TIC) (Figure 5). This counter
is started by a 1 pps signal from the receiver clock. The range of the satel
lite to the receiving antenna is now indicated by the time interval counter,
modulo 978 nanoseconds (the period of 1.023 MHz) with an unknown possible bias
between the satellite and the SERIES receiver clocks. A second receiver can
now perform the same measurement relative to its own clock (Figure 7). By
calculating the following
a differential phase delay observation is created where T. is the time1
interval counter value of the i th station, and the product T.f. is the1 1
fractional phase measured at that station. This is identical to the delay
19
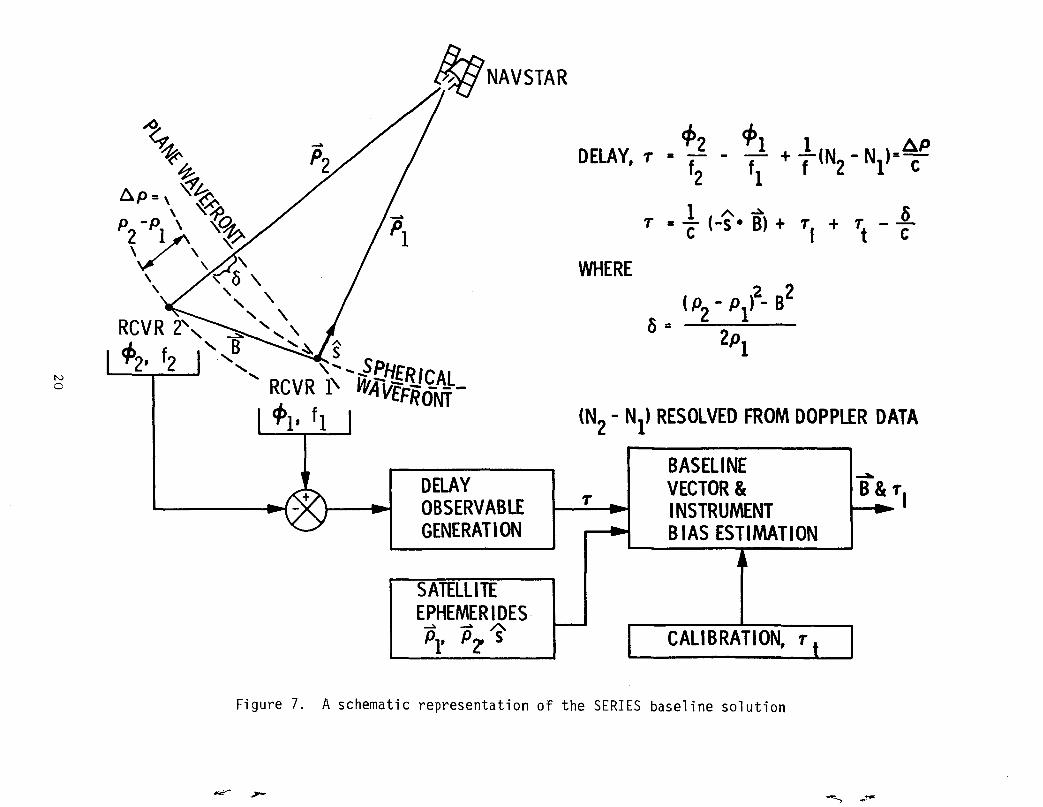
WHERE
4>2 4>1 1 APDELAY, 1" • - - - + -(N - N )=-
f2 f1
f 2 1 c
'2 2(Po -p)-B
8 = 2 12Pl
1 A"::' 61" • C (-s· B) + 1"( + 1"t - C
1"
(N2 - Nl ) RESOLVED FROM DOPPLER DATA
BASELINEVECTOR &INSTRUMENTBlAS ESTIMATION
DELAYOBSERVABLEGENERATION
No
SATELLITEEPHEMERIDES·
->. ->. ~
PI' P'! s CALI BRATION, 1"
Figure 7. A schematic representation of the SERIES baseline solution

data type of VLBI (Reference 12) for which considerable baseline measurement
experience exists (Reference 13). Note that the possible CiA-code phase bias
in the satellite now vanishes, but in its place another bias appears which is
the difference of clock epochs between station 1 and 2. The delay observable
created by differenced CiA-code ranging is ambiguous at the CiA-code
wavelength of 293 meters. Similarly, this same procedure could be employed
using the P-code which would introduce ambiguities in the delay of 29.3m. For
convenience and reduced cost of implementation, the recovered sinewaves are
coherently down-converted to lower frequencies where the performance of simple
time interval measurement equipment is quite adequate (Figure 5).
The next step is to estimate the baseline vector and deduce the time
offset of the station 1 clock relative to the station 2 clock. The conceptual
approach is identical to that employed in quasar VLBI geodesy (Reference 13).
Consider four or more CPS satellites above the horizon common to stations 1
and 2. Four delay observations are developed by differencing digital time
interval counter readings scaled by the Doppler frequency. All of the CPS
satellites are widely separated in the sky, and thus the geometry and the four
delays allow for a simultaneous estimation of the three-dimensional baseline
vector and the relative clock bias between the stations (X, Y, Z, ~t). The
strategy here is to make four delay observations as rapidly as possible so as
to minimize the effect of receiver clock instabilities. The clock error
contribution grows linearly with the total time required to observe the four
or more CPS satellites.
21

V. DIFFEkENTIAL OBSERVATIONS
An important data type is differential Doppler and differential pseudo
ranging extracted either from the received carriers or from the P or CiA
channels. Differencing automatically removes any possible phase or phase rate
biases which might originate in the GPS satellites t because a bias which may
be unique to one satellite is simultaneously recorded by each user station and
is subsequently cancelled in the difference. Operating in a differential mode
also reduces the sensitivity of the baseline vector determination to the
uncertainties within the satellite ephemeris. Orbital errors contribute to
the baseline error and are attenuated by the ratio of the baseline length to
satellite height t nominally 20 t OOO km (Reference 14). Thus t for a 100 km
baseline separation between receivers t a 10 meter satellite orbit uncertainty
at its 20 t OOO km orbital position can contribute t with worst case geometrYt
~ cm uncertainty to the baseline determination.
22

VI. IONOSPHERIC CALIBRATION: DUAL P-CODE CHANNELS
The L-band region of the electromagnetic spectrum contains substantial
ionospheric delay effects when considering the sub-decimeter baseline accuracy
requirements of geodesy. In an uncalibrated mode, the L1 channel at 1575
MHz would experience approximately 15m of zenith range delay or up to 40m of
delay at low elevation angles during active ionospheric conditions (zenith
columnar contents of 1018
electrons per m2). In an uncalibrated Doppler
positioning mode, using the SERIES method, the L1 channel would be disturbed
by approximately 10 meters of positioning-equivalent error which results from17 2a columnar electron content rate of change of 6x10 el/m per hour.
Clearly, the dual channel availability of NAVSTAR must be used to
explicitly measure the ionospheric delay and delay rate effects along the line
of sight to the satellite being observed. The differential, L1 - L2frequencies, while not being optimum for measuring the ionospheric delay, have
sufficient separation for determining the dispersion effect with the required
precision.
In an earlier form of experimentation (Reference 15) the SERIES
ionospheric calibration used an analog cross-correlation approach which
exploited the fact that the identical P-code modulation sequence is coherently
transmitted by the NAVSTAR satellites on both the L1 and L2 GPS channels
(Reference 6).
The ionospheric columnar content was measured by intentionally delaying
the first arriving L1 signals and then cross-correlating with the L2channel. The delay in the L1 is made adjustable to compensate for the
differential delay experienced in the L2 channel. When the output of the
correlator is a maximum, the variable delay value is the ionospheric delay.
While the technique was functional, it suffered from two difficulties: The
measurement was difficult to calibrate to 0.1 nanoseconds and it was vulnerable
to changes in the NAVSTAR transmission format. For example, the GPS satellites
could conceivably be reconfigured so as to broadcast different portions of the
P-code sequence on L1 and L2 thus destroying the possibility of obtaining
an output by inter-channel cross correlation.
23

A more reliable approach was to exploit the 10.23 MHz P-code bit transi
tion rates separately derived from the L1 and L2 channels. The 10.23
megabit-per-second (MBjS) code chip rate is directly derived from the on-board
atomic frequency references and used to coherently modulate L1 and L2•
Although the actual code sequence or code phasing might be altered, it is
likely that the P-code chip rates of L1 and L2 will not be changed. Thus,
the phase of the code transitions are probably in coincidence or with simple
constant offsets in the satellites and will therefore experience ionospheric
dispersion in the same manner that the code sequence is differentially delayed
in the previously mentioned inter-channel correlation approach.
A digital time interval counter and/or a phase measuring device is used
to determine the lag of the LZ channel relative to the L1 channel to deter
mine the columnar content of the ionosphere. This SERIES subsystem has been
given the name SLIC for Satellite L-band Ionospheric Calibration (Figure 8),
and is a potentially powerful tool for mapping ionospheric conditions.
Consider the P-code transitions at L1 and L2 to be phase coincident
at the satellite's location. The L1 and L2 channels then experience the
ionospheric dispersion because of their 347.82 MHz of frequency separation.
The- physics of this situation are discussed in Reference 16 and summarized as
follows: The group delay effect is in general, t = AI/cf 2 , whereg
A = 40.3 in MKS units
I columnar electron content, electrons per 2= m
f radio frequency, Hertz
c speed of light, meters per second
t = ionospheric time delay, secondsg
The SLIC observable is the differential group delay (Tg ) between L1 and
L2:
Consider now the extreme conditions of the ionosphere. The mlnlmum
zenith content to be expected is I = 0.5x10 17 electrons/meter 2 which will
24

DIRECT IONOSPHERICDELAY MEA SUREMENT
START,-------,STOP TIME INTERVAL,.--~ COUNTER
J...
L1 AT
1575 MHz
L2 AT
1227 MHz
RFAMPL
NV1
Figure 8. SERIES technique for measurement of the columnar chargedparticle content

result in r (min) = 1.7~ nanoseconds.g Its L
could approach 10 el/m and observingIts 2
columnar content of L.~xl0 el/m, and
seconds. Exploiting the P-code in
At a maximum, the zenith content
at a low elevation angle causes a
results in T (max) = 87.5 nano-g
this manner has an ambiguity of ~7.75 ns,
between L1 and L:2. (267
on the L 1 channel).
observable at either L 1 or
'r'h 1017 1/· :2. l'us, e m resu ts In
and thus care must be exercised to avoid ambiguous measurements in high
ionospheric content situations.
In geodetic missions, calibration must be applied to the pseudo-range
L2• The ionospheric delay on L1 is t g1 = 1.54 Tg
•
T 3.5 ns or 105 em path equivalent differenceg
em path delay on the L2 channel minus 162 em path delay
The SLIC error sources contain three major elements: (1) receiver noise,
(L) receiver delay, and (3) possible biases in the NAVSTAR at the time of
transmission. The measures taken to compensate for these error sources are as
follows:
(1) Using a 1.5 m diameter antenna provides more than adequate signal
strength, and the differential phase shift between the L1 and
L2 channels is measured to within 0.1 ns RMS or better with one
second of averaging using the Bipolar transistor preamplifier,
corresponding to a columnar content of 3x10¹⁵ el/m2 or 4.6 em
of pseudo range calibration on the L1 channel. Thus, to achieve
a two centimeter precision in pseudo ranging calibration, 5 seconds
of SLIC data must be averaged.
(L) To measure the differential phase behavior of the SLIC receiver
itself, a GPS satellite simulator consisting of a PRN (pseudo-random
noise) sequence is modulated onto carriers at L 1 and L2 and
injected into the first RF amplifier, and the data system processes
the signal in a manner identical to the reception of the NAVSTAR
signals. In this way the dissimilarities between L1 and L2signal paths are measured with a precision of 0.06 ns to achieve a
2. em accurcy in the SLIC receiver delay.
26

(3) According to the specification of the Block I NAVSTAR satellite
(Reference 17), the relative phasing of the P-code transmissions on
L1 and L2 channels will vary by less than 1.5 nanoseconds.
Such a time difference in transmission will cause a bias in the
deduced total columnar content equivalent to 3xl016el/m2
but
will have no effect upon the SERIES determined baseline vectors
performed in a two-station differenced pseudo range mode since any
satellite biases are common-mode rejected.
Important features of the SLIC method are listed below:
1) Total columnar electron content measurement with a precision of
10l5el/m2 with 10 seconds of averaging and an accuracy dependent
upon phasing in the NAVSTAR, limited to approximately 3xl016
el/m2
•
2) No P-code digital sequence knowledge required.
3) No dependence upon orbit kinematics of the NAVSTAR.
4) No modeling of geomagnetic fields or unsensed electrons as with the
Faraday Rotation method.
5) No active elements as with ionosondes or topside sounders aboard
Earth-orbiting spacecraft.
6) Modest instrumentation requirements, with options for omni
directional reception.
7) Columnar content measurement from a single station; no cross
correlation between two stations to achieve signal detection as in
the VLBI method.
8) A single satellite pass allows horizon-to-horizon sampling of the
ionosphere in 6 hours; the full 18 satellite constellation will
<lllow a continuous sampling in at least four directions (perhaps as
many as seven) from every location on the Earth's surface.
27

VII. BASELINE ESTIMATION SOFTWARE
Baseline estimation software has been written to allow the evaluation of
the SERIES receiver engineering tests. This program allows the determi
nation of a baseline between two SERIES stations, the clock offset between the
stations, and the approximate location, in the WCS-72 frame, of each station.
Data input from the SERIES stations to the baseline estimation soft
ware consists of time tagged pseudo ranges to the CPS satellites as well as
measurements of the ionospheric delays along the lines of sight to the CPS
satellites. Other ancillary data can be entered such as surface measurements
of barometric pressure, temperature, relative humidity, or water vapor
radiometer measurements of water vapor delays.
The baseline program also requires ephemeris information. The orbits
determined post facto by the Naval Surface Weapons Center (NSWC) are currently
being used for SERIES baseline tests. These orbits, with approximately 10-m
errors, are adequate for precision determinations of baselines up to 100 km.
The baseline program operates on singly differenced ranges, i.e., the
difference in simultaneous pseudo ranges between two stations to a CPS
satellite. These differences are formed and compared with the modeled
differences based on the ephemerides, the ~ priori station locations and clock
offsets. The three components of the baseline vector and the clock offsets
are adjusted so that the least squares residuals are obtained.
The data can be sent over phone lines so that a near-real time (within I
hour) baseline solution can be obtained. Presently, this near-real time
solution does not have the precision ephemeris information available, leading
to degraded baseline accuracy. The ~ priori ephemeris is available at the
time a baseline is measured, while the post-fit ephemeris is generally avail
able two weeks hence.
28

VIII. SERIES TEST SEQUENCE
The testing program was designed to allow a sequential check of suspected
system error sources (see the listing below).
Experiment
Single Station
o Baseline
l~U M Haseline
150 M Cornman Clock
I~U M Attenuated
l~O M Long Track
Ll KM (DSSIJ/14)
II KM (Clock Sync)
Faraday Co-Location
171 KM (JPL/Goldstone)
A. SINGLE STATION TESTS
System Component Tested
Instrumentation
Instrumentation + Baseline Estimator
Instrumentation + Clock + SNR + Multipath
Isolates Clock Error Source
Isolates SNR Error Source Signal
Sensitive to Multipath
Test Field Operation of Mobile Units
SERIES Clock Sync Demonstrated
SERIES Ionospheric Calibration Validated
Tests Dependence of Errors on Baseline Length,
Atmospheric Delay Models, Ephemeris Errors
Single station tests were performed to indicate whether receiver
stability was adequate to obtain baseline measurement results with few cm
precision. The SNR (Signal to Noise Ratio) of the GPS satellite signals in
the receiver Intermediate Frequency (IF) band were also measured in single
station tests. This was compared with the output SNR of the reconstructed
code clocks in order to verify that the SERIES code clock recovery technique
was operating at or near the theoretically predicted performance level.
Single station tests were repeated throughout the test sequence in order
to periodically validate instrument performance.
H. 0 BASELINE
The 0 baseline tests were performed with the output signal from a single
antenna being split to provide inputs to the two SERIES receivers. One
29
Rubidium frequency standard was used to provide the reference clock for both
of the SERIES receivers. The RMS scatter in the baseline lengths was 1 cm,
which is less than the J cm predicted by the SNR if independent noise is present
in each receiver. This is due to the fact that much of the noise in the abaseline experiment is correlated between the two receivers and, therefore,
cancels. The mean measured baseline length of 5 cm is thought to have peen
caused by electronic cross-talk between the two closely situated receivers.
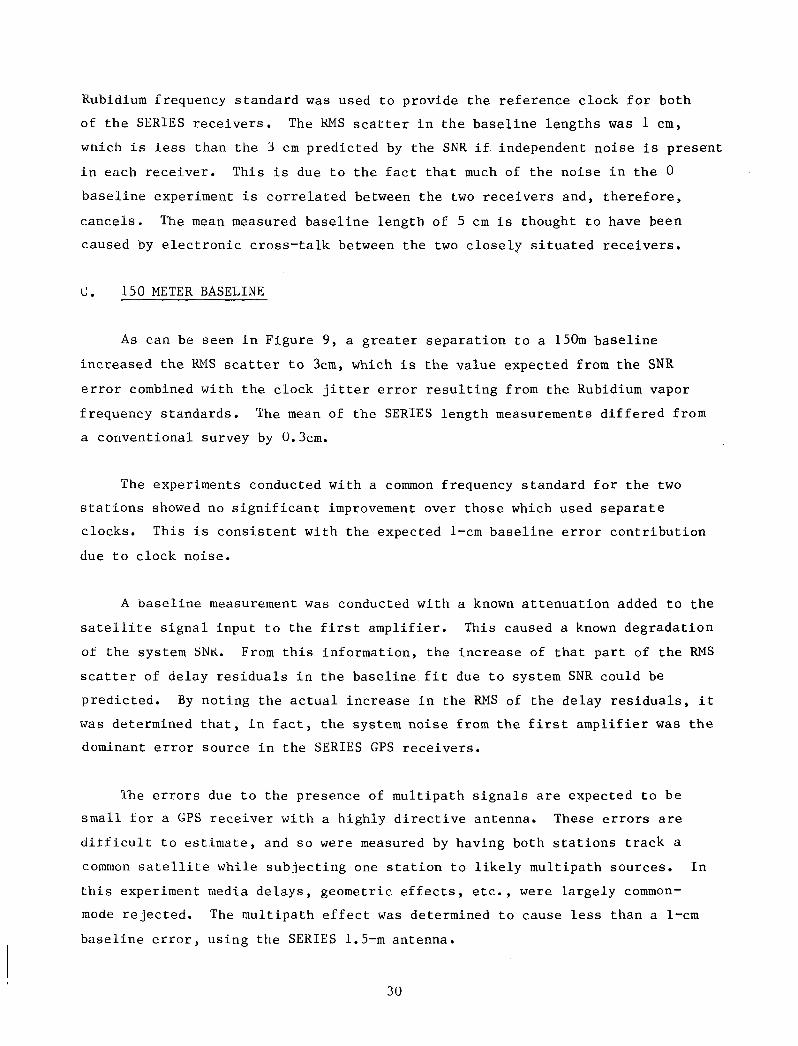
c. 150 METER BASELINE
As can be seen in Figure 9, a greater separation to a 150m baseline
increased the RMS scatter to 3cm, which is the value expected from the SNR
error combined with the clock jitter error resulting from the Rubidium vapor
frequency standards. The mean of the SERIES length measurements differed from
a conventional survey by O.3cm.
The experiments conducted with a common frequency standard for the two
stations showed no significant improvement over those which used separate
clocks. This is consistent with the expected l-cm baseline error contribution
due to clock noise.
A baseline measurement was conducted with a known attenuation added to the
satellite signal input to the first amplifier. This caused a known degradation
ot the system SNk. From this information, the increase of that part of the R}IS
scatter of delay residuals in the baseline fit due to system SNR could be
predicted. By noting the actual increase in the RMS of the delay residuals, it
was determined that, in fact, the system noise from the first amplifier was the
dominant error source in the SERIES GPS receivers.
lhe errors due to the presence of multipath signals are expected to be
small for a GPS receiver with a highly directive antenna. These errors are
ditficult to estimate, and so were measured by having both stations track a
common satellite while subjecting one station to likely multipath sources. In
this experiment media delays, geometric effects, etc., were largely common
mode rejected. The multipath effect was determined to cause less than a I-em
baseline error, using tile SERIES 1.5-m antenna.
30

151. 65
t-V)
0:::151. 60LU
t-LU
~:::r::
0t-<:;)z
151.55LU-I
LU dL CALCULATEDz SURVEY-I
00FROM SNRLU
v..>V)
UMEAN)...... «ca 151. 50
151.45 ---6""'-/5-~--I.....----I-2"'/6-..Io.--4""'-/-5"""/ --------'"13/5 1/6 3/6 6 6
EXPERIMENT DATA (DAY/MONTH 1982)
Figure 9. SERIES 150 m baseline length measurements. Each circle withouterror bars represents a solution using 1.25 to 1.75 hours ofdata taken on a constellation of five GPS satellites, mutuallyvisible over Southern California. The scatter among thesesolutions is consistent with the SNR error bar. The meanlength agreed with the conventional survey to within theSERIES errors, with a difference of 0.3 em.

D. 21 KM BASELINE
For the proof-of-concept system~ the SNR errors still dominate at the
21km baseline~ with 4cm RMS scatter of the solutions for baseline length. The
comparison between the composite survey (combined VLBI and conventional
measurements) and the SERIES measurement~ in Earth fixed coordinates~ is shown
in Figure 10. The errors in the composite survey are estimated to be less
than 5 cm in each component. The errors in the components of the SERIES
determination vary. The north-south component of the SERIES baseline is quite
well determined~ while the east-west and vertical components are less well
determined. This can be explained by simple geometric factors. The set of
five operating GPS satellites available during the tests described here formed
a constellation over California which is nearly aligned along the north-south
direction. This geometry provides for a weak solution in the east-west
component of the baseline. A similar argument can be made for the local
vertical component~ as obviously no satellites can be observed in the local
"down" direction. This effect is~ of course~ also present for the other
baselines which were measured. The existence of the eventual full 18
satellite GPS system in the late 1980's will offer improved geometric as well
as time coverage.
E. 21 KM - CLOCK SYNCHRONIZATION
While the SERIES stations were on the 21 km baseline~ two experiments
were performed to demonstrate the measurement of the clock offset between the
two station clocks (Ref. 5). The usual SERIES multi-parameter solution
contains a determination of clock offset and rate as well as the baseline
vector separating the two stations. This solved-for clock offset contains
contributions from the differential receiver delays at the two SERIES
stations. In addition, the solved-for delay includes contributions from the
phases of locally generated heterodyne signals. Ancillary measurements were
taken during the clock sync experiments to calibrate the effect of each SERIES
station's heterodyne signal phase. In order to measure the differential
instrumental delays between the two receiving stations, they were brought
together for a calibration run on a 2m baseline. The error in the SERIES
measurement of clock sync was estimated to be 1 ns (10-9sec). This is
32

*COMPOSITE SER IES SER IES -
COORDINATE SURVEY (ERROR) COMPOSITE
LENGTH 21463.655 21463.667 +0.012(METERS) (±0.018 )
X -2531. 786 -2531.829 -0.043(METERS) (±0.021 )
Y 14090.312 14090.266 -0.046
(METERS) (±0.027 )
Z 15991. 9.25 15991.960 +0.035(METERS) (±0.021 )
* SURVEY IS COMPOSITE OF VLBI + CONVENTIONAL SURVEY MEASUREMENTS
Figure 10. Comparison of SERIES and composite measurements of the21 km baseline

dominated by errors in measuring the differential instrumental delays between
the two receivers. On longer baselines, the ephemeris errors would also become
important. They would be expected to contribute a 5 ns error to the clock sync
measurements on a 3,000 km baseline if 10-meter orbit errors are assumed.
During the two SERIES clock sync experiments, a Rubidium vapor frequency
standard was used as a traveling clock to allow an independent check on the
SERIES clock sync results. To obtain accurate results with the traveling
clock, three round trips were made between the two SERIES stations. At each
visit of the traveling clock to a SERIES station, the epoch of the traveling
clock was compared to the SERIES station clock using a time interval counter
to measure the offset of the clocks. Care was taken to insure that trigger
levels were set to the same levels on each visit and the same coaxial cables
were used at each station. The offset between each station clock and the
traveling clock was later fit to a second order polynomial so that the time
offset between the two station clocks could be determined at a common epoch.
The traveling measurement clock error was estimated to be 0.7 ns.
When the clock offsets obtained with the SERIES technique were compared
with the independent traveling clock measurements, interpolated to the same
epoch, agreement was within one nanosecond for each of the two clock sync
experiments (Fig. 11). (This agreement was obtained after adjusting the 977-ns
ambiguity of the CiA code chip period present in the SERIES receiver.)
F. FARADAY CO-LOCATION - SLIC TEST
A schematic representation of the operating principle for the SERIES
L-band Ionospheric Calibration (SLIC) technique is shown in Fig. 12. In order
to demonstrate this technique for measuring the columnar free electron content
in the ionosphere, data were taken with the SERIES station co-located with
another system capable of measuring the ionospheric content (Faraday Rotation).
Figure 13 shows a comparison of the two techniques for one day of data. Note
that each technique measures the total electron content along different lines
of sight, and these are then mapped to the zenith content. The agreement
between the two techniques is about 10 16 e/m2 when the two lines of sight
are close and, therefore, mapping errors are small.
34

tSTA A - tSTA B t STA A - tSTA B DIFFERENCESER IES RECE IVER TRAVELING CLOCK BETWEEN 2 TECHN IQUES
23 AUG 82 -189.7 ns -190.3 ns +0.6 ns14:36:45 PDT
24 AUG 82 -1302.0 ns -1301.4 ns -0.6 ns14:00:45 PDT
Figure 11. One nanosecond (10- 9 second) agreement was observed on each oftwo experiments in which a traveling clock was used to verifySERIES clock synchronization measurements made on the 21 kmbaseline.

ICDELAY MEASUREMENT
L1 AT1575 MHz
START _r-- I-
RF --. TIME INTERVALAMPL STOP _ COUNTER--.
L.-- I- L2 AT" T ./
1227 MHz DIRECT IONOSPHER
FARADAY SATELLITE
~GPS~ SATELLITE
L1 P-CODE L2
P-CODE
ION
0
S~~'~:~;;~;li\\,\'\\\'\\\\\\'\\\'\\\\\\\\\'\\'\\\\\!\\\;'\\\:\\~!'~j\t\\\;\'i\;\:\\\\\\\\i\\\\\\\\\\\\\'\\\\\\\\\\\·\:\\\\\\\\\\\;;;\\\t:;;,
Figure 12. The P-codes are nearly in phase when transmitted from the GPSsatellites, but suffer a differential delay due to the presenceof free electrons in the ionosphere. By measuring the magnitudeof this differential delay, the SERIES station is able todetermine the columnar content of free electrons in the ionosphere.

5.06- CO-LOCATED FARADAY ROTATION MEASUREMENT
-------Q)I~ 0 Sli CMEASUREMENT~r- 4.0.......~0
~
1-'ZLJ.JI-
3.0z0 CLOSEST APPROACH OF FARADAYuz AND SliC lINE-OF-SIGHTS ~
00::: 9I-U 2.0LJ.J-oJLJ.J
w -oJ-...J «
I-0
{ 5.4 ns L1 DELAYI-
~ 1.0t= 8.9 ns L2 DELAYzLJ.JN
004:00 07:00 10:00
1 DEC 1982TIME OF DAY (PST)
Figure 13. The SERIES ionospheric measurements are shown as circles, whilethe Faraday rotation results are triangles. The rapidly increasing TEe is due to the fact that the data were taken during sunrise. It can be seen that 'the agreement is better when the 1inesof sight for the two techniques are close, as this allows mappingerrors to cancel.

G. 171 KM BASELINE
The 171 km baseline tests are sensitive to ephemeris errors. (Fig. 14).
Tropospheric delay corrections were applied to the baseline solution based on
surface weather data (temperatures pressure and relative humidity) taken during
the experiments. Ionospheric delay or SLIC corrections have been derived from
the dual band SERIES data and applied. On the 171 km baseline between JPL and
Goldstone, the error contribution due to a 10-meter uncertainty in the satel
lite ephemerides is estimated to be 9 em.
The KMS scatter of the baseline lengths was 7 em for the 171 km base
line. This is consistent with the presence of 10-meter errors in the
ephemerides supplied by the NSWC.
H. BASELINE SUMMARY
A summary of the SERIES baseline testing results is given in Fig 15.
This table represents the precision of the SERIES baseline measurement by the
RMS scatter of the individual day's solutions. Typically, there were 12 days
of data for each basel~ne. The accuracies of the SERIES measurements are
shown through comparison with independent surveys.
I. BASELINE ERROR VS BASELINE LENGTH
Figure 14 shows the calculated effect of various error sources on baseline
length determination accuracy for the current SERIES proof-of-concept system vs
baseline length. For the shorter baselines, the SNR is the dominating error
source. The errors due to both the SNR and clock terms can be reduced to less
than I-em by more efficient data collection combined with more nearly simul
taneous observations of the set of GPS satellites. The error shown for water
vapor is based on the use of surface data to correct delays, and could be
reduced with the use of current water vapor radiometers (WVR's). The ephemeris
errors dominate for long baselines. The approach proposed by the JPL GPS
development team to reduce ephemeris errors is to use a set of sites with
positions determined by VLBI as fiducial points for a network of GPS receiver
stations. Those observations made from the fiducial points would be used to
obtain accurate ephemerides of the GPS satellites during each experiment.
38

SERIES ERROR SOURCES fOR PROOf-Of-CONCEPT STATIONS30
• MEASURED RMS IN LENGTH
(1) SURFACE MODEL(2) POST FIT EPHEMERIDES SUPPLIED BY NSWC (± 10 M ACCURACY ASSUMED)
Figure 14. The calculated cumulative error in baseline length is shown forthe SERIES receivers as tested. It can be seen that for baselines longer than a few tens of km, the error is dominated byephemeris and tropospheric calibration errors. The performanceof the SERIES system is shown by the triangles for the 0,150 m, 21 km, and 171 km baselines.

BASELI NE LENGTH RMS SCATTER IN LENGTHDIFFERENCE OF MEANLENGTH FROM SURVEY
o_ __.._ _. .._.. . ..__1 CM .._ _. __.. .__ _* +5 CM
150 M._..__ ....__ .._. ...._. . . 3 CM. ...._. __...__.... .._... .+0.3 CM
21 KM __.._. .... ....__ ._..... 4 CM . ... ._. .._..__. ...+ 1. 2 eM
171 KM__.._._... ...._. ._....__ 7CM .. ._.__...._._._.**+ 7 CM, -1 CM
*ELECTRONIC CROSSTALK WAS THOUGHT TO CAUSE LENGTH BIAS
** DIFFERENCE FROM ARIES VLBI AND PRELIMINARY TEXAS LASERRESULTS RESPECTIVELY
Figure 15. Table of SERIES baseline results. Between 9 and 12 measurementswere made at each of the baselines.

IX. CURRENT SERIES STATUS
the results of the tests described in the previous section show that the
dominant error sources included primarily system noise and clock jitter on the
short baselines (see Fig. 14). Un the long baselines, orbit errors and the
delays due to the presence of water vapor become important. Since the delays
due to the ionosphere are measured in the SERIES receiver, these delays are
calibrated.
As described previously, the errors due to water vapor delays can be
reduced by the use of water vapor radiometers which measure those delays, and
a network of high precision GPS receivers operating at known sites (fiducial
stations) can be used to greatly reduce the orbital errors.
Improvements have already been made to the SERIES hardware and observa
tion strategy, since taking the data contained in this report, to reduce the
errors due to system noise and clock jitter. The clock errors were reduced by
changing the time between satellite observations from two minutes to one
minute. Three approaches have been used to reduce the error due to system
noise.
The first of these was the reduction of the bandpass width of the P-code
tracKing filter. This allowed the data sampling to be closer to the desired
Nyquist rate. The SERIES data sampling rate is currently limited by hardware
constraints to ten samples per second. The bandwidth of the sampled signal
was originally bO hz, and therefore had a Nyquist rate of 160 samples per
second. The bandwidth is currently 20 Hz, with a Nyquist rate of 40 samples
per second. The loss of SNR due to undersampling the P-code signal has been
reduced to 0.25 from 0.0625.
The second approach was to replace the Bipolar Transistor preamplifier
with a Gallium ArSenide Field Effect Transistor (GASFET) preamplifier. The
table below shows the SERIES system temperatures, including the antenna
temperature, for either preamplifier, at each of the two frequencies received.
41

Preamplifier
Bipolar Transistor
GASFET
L2 at
1227.6 MHZ
485 K
95 K
L 1 at
1575.42 MHZ
560 K
125 K
The third approach to reduce the effect of system noise on pseudo
range measurement accuracy was to acquire carrier range data. The
capability to obtain carrier data from the L2 frequency band has been
added to the SERIES system. The advantage of carrier range data over
P-code ranges is due to the fact that the recovered (squared) carrier
wavelength iS t for the L2 carrier t 120 times shorter than the P-code
"wavelength t " and the error due to system noise is proportional to the
wavelength. Therefore t for a given SNR on the L2 band t the carrier
range error due to system noise is 120 times less than the P-code range
error due to system noise.
A potential problem with the use of the carrier range data type is
the necessity to determine the pseudo-range ambiguitYt equal to the
wavelength of the squared carrier (12.1 cm for L2). The capability to
determine this ambiguity using the P-code pseudo-range measurement is
predicted from current P-code performance t but has not t as yet t been
tested experimentally.
Due to the high SNR resulting from the SERIES high gain antenna t the
addition of the carrier data type to the already precise P-code data will
make the SERIES receivers a unique tool. Potential uses t in addition to
geodesYt are investigations of inherent limiting error sources of the
space segment of the GPS t such as the possible presence of multipathing in
the GPS satellite antennas. With or without the addition of the carrier
range data type t the SERIES geodetic instrument has been demonstrated to
be a GPS receiver capable of making accurate t cost effective measurements
of baselines from sites located in remote areas.
42

itu+{j
sP
P'
!J.p
!J. P'
!J.t (t u - t s)
!J.t u • !J.t s
!J.t 8i0
S
B
t TMc
f
fIn
(Mu l - MuZ)
N·l
V sN
clf l-
f.l
'1'i
8. f .T.l l. l
f1'1
P'D
t g
1
x. SYMBOL GLOSSARY
User/observer geocentric vector
Satellite geocentric vector
Range from observer to satellite
Measured pseudo range;p' = p + c (!J.tu - !J.t s ) + noise
Differential pseudo range
Measured differential pseudo range
Apparent del~y in arrival of satellite clockpulses
User or satellite clock offset with respectto UTC (Universal Time Coordinated)
Clock offset of i th satellite
Correction term for converting spherical toplanar wave fronts
Unit vector from primary station to satellite signal source at distance Pi
Baseline vector from remote station toprimary statio-n
Time delay through transmission media
Speed of light
Code frequency in satellite reference frame
Code frequency measured by the user
Clock offset of clock 2 relative to clock 1
P code or CiA code c~hle ambiguityencountered at the i station
Satellite velocity
Integer number of whole wavelength cycles
Effective wavelength of code at frequency f
F d. th .requency measure at l statlon
Time of reception tagged by the TIC (TimeInterval Counter)
Fractional phase of the CiA or P codes
Measured Doppler frequency
Measured Doppler pseudo range
Group delay effect; ionospheric time delayin seconds
Columnar electron content

C/A code
P-code
Differential ionospheric group delay betweenL1 and L2 channels
Coarse acquisition code with 1.023 MHz bitclocking rate, normally present in L1 CPSband
Precision code with 10.23 MHz bit clockingrate, present in L1 and L2 CPS bands
CPS frequency band centered at 1.57542 CHz
CPS frequency band centered at 1.2276 CHz
44

REFERENCES
1. MacDoran t P. F' t Spitzmesser t D. J' t Buennage1 t L. A' t "SERIES:Satellite Emission Range Inferred Earth Surveying," Proceedings of theThird International Geodetic Symposium on Satellite Positioning t LasCruces t New Mexico t Feb' t 1982.
2. MacDoran t P. F' t "Satellite Emission Radio Interferometric EarthSurveying t SERIES-GPS Geodetic System t " Bulletin Geodesique t 53 (1979)tpp. 117-138.
3. Young t L. E' t Spitzmesser t D. Jot Buennagel t L. Aot "SERIES t A Novel Useof GPS Satellites for Positioning t " Proceedings of the IAG/IUGG Symposiumon Point Positioning in Marine GeodesYt Maracaibo t Feb' t 1983.
4. Royden t R. N' t Miller t R. B' t Buennagel t L. B' t "Comparison of NAVSTARSatellite L-band Ionospheric Calibrations with Faraday-RotationMeasurements t " to be published in Radio Science t May-June t 1984.
5. Buennagel t L. A' t Spitzmesser t D. J' t and Young t L. E' t Proceedings ofthe Fourteenth Annual Precise Time and Time Interval (PTTI) applicationand Planning Meeting t Dec' t 1982.
6. Spilker t J. J' t Jr' t "GPS Signal Structure and Performance Characteristics t" Navigation Vol. 25 t 121-146 (1978).
7. Milliken t R. J' t and Zoller t C. J' t "Principle of Operation of NAVSTARand System Characteristics t " Navigation VoL 2S t Summer t 1978
8. Ong t K. M' t MacDoran t P. F' t "Quasars and Artificial Satellites forGeodynamics Monitoring and Earthquake Research," International Conferenceon Cybernetics and SocietYt October t 1979.
9. Spiker t J. J' t Jr' t Digital Communications by Satellite t Prentice-RalltInc' t Englewood Cliffs t New JerseYt 1977.
10. Viterbi t A. J' t Principles ~ Coherent Communications t McGraw-Rill t 1966.
11. Bartho1omew t C. A' t "Satellite Frequency Standards t " Navigation tVol. 25 t Summer t 1978.
12. Thomas t J. B' t "An Analysis of Long Baseline Radio InterferometrYt" TheDeep Space Network Progress Report t Tech. Rep. 32-l526 t Vol. 7 t p. 37,Jet Propulsion LaboratorYt Pasadena t Ca1ifornia t 1972a.
13. Niel1 t A. E' t K. M. Ong t p. F. MacDoran t G. M. Resch, D. W. Fite,L. J. Skjerve t D. J. Spitzmesser t D. D. Morabito, L. Tanida tE. S. Claflin, B. B. Johnson t M. G. Newsted, A. Banisch t andJ. F. Dracup: "Comparison of a Radio Interferometric DifferentialBaseline Measurement with Conventional GeodesYt" Tectonophysics, 52,p. 532 t 1979.
45

14. Russell, S. S., Schaibly, J. H., "Control Segment and User Performance,"Navigation, Vol. 25, Summer, 1978.
15. MacDoran, P. F., SERIES-Satellite Emission Radio Interferometric EarthSurveying, Third Annual NASA Geodynamics Program Review, Crustal DynamicsProject Geodynamics Research, NASA, Washington, D.C., pp. 76 (1981).
16. Koehler, R. L., "Radio Propagation Measurements of Pulsed Plasma StreamsFrom the Sun Using Pioneer Spacecraft," J. Geophysical Research 73, 115,4483-4894 (1968).
17. Interface Control Document, 03953, Space Division, Rockwell InternationalCorporation, September, 1975.
46 NASA-JPL-Coml.• L.A., Cain.


