sas® enterprise miner™ and sas® visual data mining and ... › content › dam › sas ›...
TRANSCRIPT

1
Paper SAS3616-2019
SAS® Enterprise Miner™ and SAS® Visual Data Mining and Machine Learning Hand Shake
Jagruti Kanjia, Dominique Latour, and Holly Sweeney, SAS Institute Inc.
ABSTRACT
SAS® Enterprise Miner™ and Model Studio are two solutions that you can use to create predictive and classification models. In this paper, we show that although these applications
have different architectures and run in different environments, we can integrate models generated in one environment and compare them with models produced in the other. In SAS Enterprise Miner, we show how the SAS® Viya® Code node can be used to create models based on SAS® Visual Data Mining and Machine Learning and integrate them into a SAS Enterprise Miner project. For Model Studio, we describe how models generated in SAS Enterprise Miner can be integrated into a Model Studio pipeline for the purpose of
comparison. We also discuss how you can use the SAS® code node in Model Studio to produce user-defined models. We hope that a better understanding of these capabilities can
help users to fully use the rich functionality and flexibility of these products.
INTRODUCTION
SAS Enterprise Miner, and SAS Visual Data Mining and Machine Learning in Model Studio and SAS® Visual Analytics, are powerful visual tools that take you through the data prep, data exploration, modeling, and scoring stages of an analytics project. SAS Enterprise Miner
has been a proven data mining workbench for over 20 years and currently runs on the SAS® 9.4 platform. SAS Visual Data Mining and Machine Learning runs on SAS Viya, which leverages the cloud-enabled, in-memory analytics engine of SAS® Cloud Analytic Services
(CAS), allowing for better processing and greater flexibility.
The SAS Enterprise Miner Graphical User Interface (GUI) is a point-and-click interface where each step in the data mining process is represented by a node in the diagram process flow. The GUI enables analysts with little statistical expertise to easily navigate through the data mining process. More experienced users can go “behind the scenes” and write their own
code and customize the process.
SAS Visual Data Mining and Machine Learning is a collection of algorithms and utilities for data preparation and modeling that run via CAS actions in a distributed, in-memory
infrastructure. There are multiple interfaces to SAS Visual Data Mining and Machine Learning. You can analyze your data using SAS procedures, use an open-source programming language to access SAS® Analytics, and interactively explore and model your
data in both SAS Visual Analytics reports and Model Studio pipelines.
Model Studio presents a modern approach to data mining that is specifically designed to serve as an extensible and open framework that can access data from a variety of common sources. By using CAS actions, you can invoke in-memory analytics not just with SAS, but
also with Python, R, and Java.
Model Studio enables you to visually assemble, configure, build, and compare data mining models and pipelines for a wide range of analytic data mining tasks. Model Studio pipelines
have a similar structure to SAS Enterprise Miner process flow diagrams. All pipelines begin with a Data node that inserts the project data into the pipeline and performs the specified data partitioning. Each step of the pipeline flow is represented by a node in one of the
following categories:
• Data Mining Preprocessing: Nodes for exploring the data and for manipulating and

2
prepping the data for modeling.
• Supervised Learning: Nodes to build predictive models for your specified target.
• Postprocessing: Nodes to perform operations on models after they are built in
upstream nodes. Currently this category is dedicated to building ensemble models.
• Miscellaneous: Nodes with additional capabilities. This category includes creating summary statistics and graphs to explore your data, saving data exported from the
previous node in the pipeline, and writing your own SAS code or open-source code (R or
Python).
The complete list of nodes available to create your pipeline in Model Studio 8.3 are shown in
Table 1.
Node Category Nodes
Data Mining
Preprocessing
Anomaly Detection Clustering Feature Extraction
Filtering Imputation Manage Variables
Replacement Text Mining Transformations
Variable Clustering Variable Selection
Supervised
Learning Batch Code Bayesian Network Decision Tree
Forest GLM Gradient Boosting
Linear Regression Logistic Regression Neural Network
Quantile Regression Score Code Import SVM
Postprocessing Ensemble
Miscellaneous Data Exploration Open Source Code SAS Code
Save Data
Table 1. Nodes Available in Model Studio 8.3
The Score Data node and the Segment Profile node are two new nodes that will be added in
Model Studio 8.4.
Model Studio also provides a selection of pre-built beginner, intermediate, and advanced node and pipeline templates that enable you to quickly prototype, test, and enhance
models. You can create, modify, and save your templates and model score codes. You can also write your own custom SAS code or open-source code to integrate in the pipeline. Model Studio expedites and simplifies model assessment and model pipeline comparisons
when evaluating competing analytic models.
This paper discusses the integration between SAS Enterprise Miner, Model Studio, and SAS Visual Analytics, and how you can generate models in one environment and compare them
with models generated in another.
The sample data used in this paper can be downloaded from the SAS Visual Analytics documentation page (http://support.sas.com/documentation/onlinedoc/va/index.html#viya81). Click Example Data for Getting Started with Analytical Models, unzip, and save the
insightToyDemo.sas7bdat data file in an accessible location.
The specific business problem you are trying to solve in this example is increasing company
profits at Insight Toy Company. Your IT department has provided you with two years of

3
data on all aspects of the business. The data includes information about what products are sold, to which vendors they are sold, the manufacturers and distributors of the products, the associated costs, and some metrics about the sales representatives and the vendors.
The goal is to determine which features are most likely to predict whether a product was
returned.
BUILD MODELS IN SAS ENTERPRISE MINER
To determine which features are most likely to predict whether a product has returned, we
first build a forest model and a rule induction model in SAS Enterprise Miner.
BUILD A FOREST MODEL IN SAS ENTERPRISE MINER
We first generate a forest model using the High Performance (HP) Forest node. The diagram flow in Figure 1 illustrates the data mining flow that you can use to create partition data
sets, pre-process data, create the Forest model, and export the model.
Figure 1. SAS Enterprise Miner HP Forest Model Diagram Flow
The insightToyDemo table is pre-populated with a Partition variable that contains two values: T for training observations and V for validation observations. SAS Enterprise Miner
has a Data Partition node that you can use to partition your data if your table does not have a partition variable. You can include following code in the SAS Code node to create a
training and validation partition data sets based on the Partition variable:
data &EM_EXPORT_TRAIN (drop=Partition);
set &EM_IMPORT_DATA;
where Partition = 'T';
run;
data &EM_EXPORT_VALIDATE (drop=Partition);
set &EM_IMPORT_DATA;
where Partition = 'V';
run;
The observations with Partition = T are assigned to the training data set and observations
with Partition = V are assigned to the validation data set. The partition variable was created
so that each data set contains 50% of the total data.
You can use the Transform Variables node to create a new variable called TotalCost using
the formula or expression shown below:
TotalCost = OrderDistributionCost + OrderMarketingCost + OrderProductCost +
OrderSalesCost;
TotalCost is used in the analysis and the four other cost variables used in the calculation are
excluded from the analysis.
The HP Forest node creates predictive models by using a random forest ensemble methodology. We used the default property settings to create a forest model. The HP Forest model creates an analytic store, a binary file called score.sasast. The Score node creates an
associated DATA step 2 (DS2) score file, epscore.sas, which will be used to score new data.
The epscore.sas file contains a string that identifies the following items:
4
• The setkey method identifies the analytic store with the specified key.
• The preCode method block. This contains the code to transform input variables.
• The postCode method block. This contains the code to process output variables.
The Score node creates predicted variables that have fixed names. These variables can be
used for further analysis and reporting.
The Score Code Export node exports files that are necessary for score code deployment. The epcode.sas and the score.sasast files are exported to the location that you specify in
the Output Directory property in the Score Code Export node.
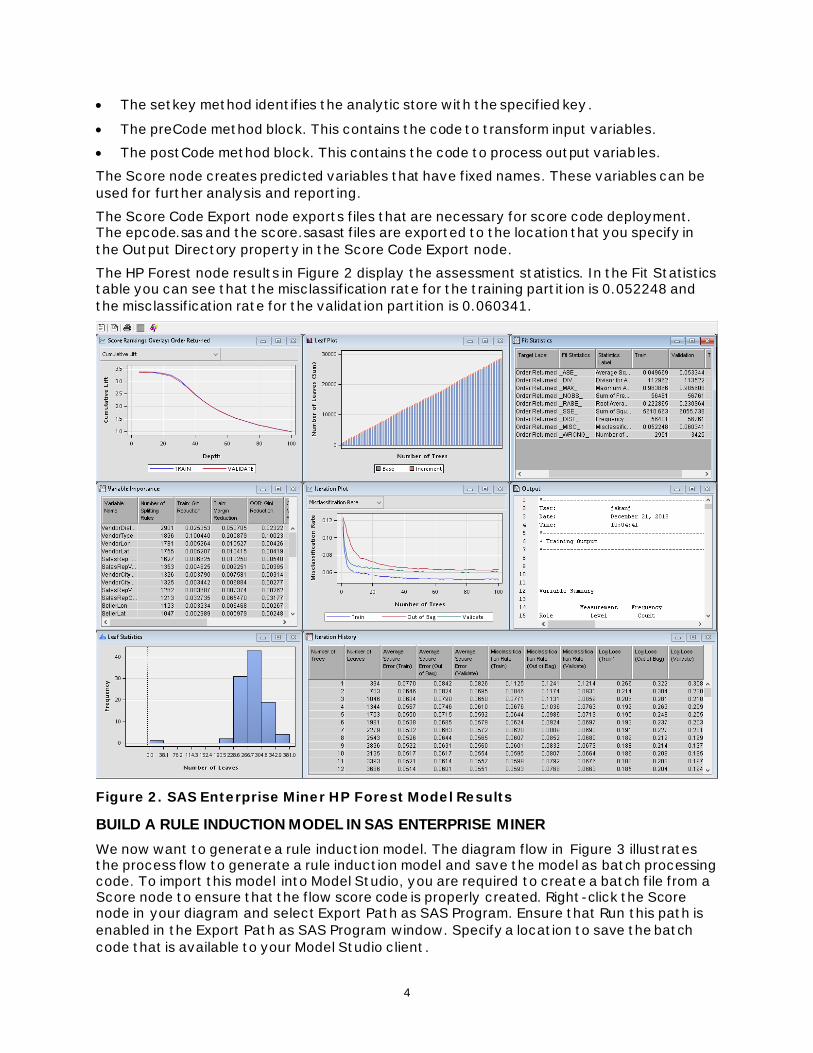
The HP Forest node results in Figure 2 display the assessment statistics. In the Fit Statistics table you can see that the misclassification rate for the training partition is 0.052248 and
the misclassification rate for the validation partition is 0.060341.
Figure 2. SAS Enterprise Miner HP Forest Model Results
BUILD A RULE INDUCTION MODEL IN SAS ENTERPRISE MINER
We now want to generate a rule induction model. The diagram flow in Figure 3 illustrates the process flow to generate a rule induction model and save the model as batch processing code. To import this model into Model Studio, you are required to create a batch file from a Score node to ensure that the flow score code is properly created. Right-click the Score node in your diagram and select Export Path as SAS Program. Ensure that Run this path is
enabled in the Export Path as SAS Program window. Specify a location to save the batch
code that is available to your Model Studio client.

5
Figure 3. SAS Enterprise Miner Rule Induction Model Diagram Flow
SAS Enterprise Miner batch processing is a SAS macro-based interface to the SAS Enterprise Miner client/server environment that operates without running the SAS Enterprise Miner user interface. This batch code generates several data sets such as the workspace data set, the nodes data set, the actions data set, the connections data set, and the node properties data sets. These components data sets configure different settings,
provide relational information, and provide individual node settings to SAS Enterprise Miner.
All this information is required to run a valid process flow diagram.
CREATING SAS VIYA MODELS IN SAS ENTERPRISE MINER
As discussed in “Make SAS® Enterprise Miner™ Play Nicely with SAS® Viya®”, you can generate models based on SAS Viya procedures within SAS Enterprise Miner. Using the SAS Viya Code node, you can run procedures in the CAS engine and have the results displayed in SAS Enterprise Miner. Models generated in the SAS Viya Code node can also be compared
to other models based on traditional SAS Enterprise Miner nodes.
We use a SAS Viya Code node to generate and compare a variety of data mining and machine learning procedures. These models will be assessed in SAS Viya and the best of those models will be selected and exported for successor nodes to consume. Figure 4
illustrates the process flow for this example.
Figure 4. SAS Enterprise Miner SAS Viya Code Diagram Flow
The Training Code editor in the SAS Viya Code node consists of a template with a section
where you can enter you custom SAS code.
We first need to provide the name and port of the SAS Viya machine, the CAS library
(CASLIB), and the name of the CAS user:
/*---------------------------------------------------------------*
*
* Setup the CAS information
*
* Note that the cashost and casport can be specified in the EM project
* startup code using the em_casHost and em_casPort macro variables.
*
*----------------------------------------------------------------*/
%let em_cashost = dmcasrh-18w30.aatesting.sashq-r.openstack.sas.com;
%let em_casport = 5570;
%let caslib = CASUSER;
%let casuser = emduser4;
If the CAS server is Transport Layer Security (TLS) enabled, you need to install certificates to the trusted Certificate Authority (CA) bundle. You can use SAS® Deployment Manager to add your root and intermediate certificates to the trusted CA bundle and validate
certificates. For more information, you can refer to the SAS® 9.4 and SAS® Viya®
programming documentation.

6
We wish to display some results in the node, so we need to register the associated results tables. This will ensure that the results tables get downloaded from the SAS Viya machine to the SAS Enterprise Miner diagram and node folder. The CAS argument is used to indicate
that these tables are in CAS as opposed to on the SAS Viya client :
%em_register(key=varImportance1, type=DATA);
%em_register(key=varImportance2, type=DATA);
%em_register(key=forestOutmodel, type=DATA, cas=y);
%em_register(key=GBOutmodel, type=DATA, cas=y);
In this example, we will run four models in our SAS Viya session. All models will be assessed in SAS Viya using the em_viya_assess macro. The name argument is used so that we can clearly identify the models when comparing the assessment results. This macro
must be called after each model is run.
A neural network model is generated using the NNET procedure:
proc nnet data=&em_casdata
printtarget
standardize=MIDRANGE;
target %em_target /level=&em_dec_level;
hidden 3;
input %em_interval_input / level=interval;
input %em_nominal_input %em_binary_input/ level=nominal;
train outmodel=&em_caslib..outmodel seed=12345 numtries=1
stagnation=5 validgoal=0;
architecture MLP;
hidden 50 / act=TANH;
optimization algorithm=LBFGS maxiters=300 regl2=0.1;
autotune maxiters=5 maxevals=5 maxtime=200 popsize=2;
&em_partition_statement;
code file="&em_file_scorecode";
score out=&em_casout copyvars=(%em_target &em_partitionvar);
run;
%em_viya_assess(name=Neural);
The score code file that is identified by the em_file_scorecode macro contains DS1 code that
will be used to score the training table.
A forest model is generated using the FOREST procedure:
/* Forest */
proc forest data=&em_casdata outmodel=&em_user_forestoutmodel
minleafsize=5 seed=12345 loh=0 numbin=20 binmethod=QUANTILE
maxbranch=2 assignmissing=USEINSEARCH
minuseinsearch=1
ntrees=100
maxdepth=20
inbagfraction=0.6
vote=PROBABILITY printtarget;
target %em_target /level=&em_dec_level;
input %em_interval_input / level=interval;
input %em_nominal_input %em_binary_input / level=nominal;
grow IGR;
&em_partition_statement;
savestate rstore=&em_data_rstore;
ods output variableImportance=&em_user_varimportance1;

7
run;
%em_viya_assess(name=Forest);
We use the ODS statement to create the varimportance1 table that will be used to display a
report in the node results. The FOREST model produces an analytic store using the SAVESTATE statement. This analytic store will be used to score the training table. This remote analytic store table will be downloaded to SAS Enterprise Miner in the form of a
binary file.
A gradient boosting model is generated using the GRADBOOST procedure:
/* Gradient Boosting */
proc gradboost data=&em_casdata outmodel=&em_user_GBOutmodel
earlystop(tolerance=0 stagnation=5)
numBin=50 binmethod=QUANTILE
maxdepth=4
maxbranch=2
minleafsize=5
assignmissing=USEINSEARCH minuseinsearch=1
ntrees=100 learningrate=0.1 samplingrate=0.5 lasso=0 ridge=1
seed=12345
printtarget;
target %em_target / level=&em_dec_level;
input %em_interval_input / level=interval;
input %em_nominal_input %em_binary_input / level=nominal;
&em_partition_statement;
code file="&em_file_scorecode";
savestate rstore=&em_data_rstore;
run;
%em_viya_assess(name=GB);
The OUTMODEL option in the PROC GRADBOOST statement is used to produce the GBoutmodel table, which will be displayed in the results. The SAVESTATE statement is again
used to create the analytic store for this model.
A decision tree model is generated using the TREESPLIT procedure:
/* Decision Tree */
proc treesplit data=&em_casdata
maxdepth=10 numbin=20
nsurrogates=0 minleafsize=5 maxbranch=2
assignmissing=USEINSEARCH binmethod=QUANTILE
minuseinsearch=1
pruningtable;
grow IGR;
target %em_target /level=&em_dec_level;
input %em_interval_input / level=interval;
input %em_nominal_input %em_binary_input / level=nominal;
prune costcomplexity;
&em_partition_statement;
code file="&em_file_scorecode";
ods output variableImportance=&em_user_varimportance2;
run;
%em_viya_assess(name=Tree);
We create the variable importance table, VARIMPORTANCE2, to display in the results. This
procedure also produces a DS1 code as its score code representation.

8
The em_viya_modelselection macro will select the best model based on the Model Selection
properties displayed in the property sheet of the node:
%em_viya_modelselection;
Finally, we use the em_report macro to define reports to be displayed in the results viewer
of the node. In this example, we simply display tabular reports:
/*---------------------------------------------------------------*
*
* The em_viya_report macro processes assessment tables, score code, as
* well as table and files specified via the em_register macro and downloads
* them from the SAS Viya machine to the EM diagram and node folders.
*
*----------------------------------------------------------------*/
%em_report(key=varImportance1, viewtype=DATA, description=Variable
Importance Forest, Block=SAS Viya Reports);
%em_report(key=varImportance2, viewtype=DATA, description=Variable
Importance Tree2, Block=SAS Viya Reports);
%em_report(key=forestOutmodel, viewtype=DATA, description=Forest model
data set, Block=SAS Viya Reports);
%em_report(key=GBOutmodel, viewtype=DATA, description=Gradient Boosting
model dataset, Block=SAS Viya Reports);
%em_viya_report;
The Results window contains many reports used to compare the various models (Figure 5).
These are based on the data that was assessed in SAS Viya using the ASSESS procedure.

9
Figure 5. SAS Viya Code Node Results
The report titled SAS Viya Model Selection (Figure 6) identifies the model selected based on the specified criteria. In this example, the Kolmogorov-Smirnov (KS) statistic was used and Neural, the model generated by the NNET procedure, was chosen to be the best model of the four. This is the model that will be exported by the node including its score code to be
used downstream in the process flow.
Figure 6. SAS Viya Code Node Model Selection Table
The SAS Viya Output Report contains the HTML output produced by the procedures that ran
(Figure 7).

10
Figure 7. SAS Viya Code Node Output Report
To see the custom report that we requested using the em_report macro, select View, and
then select SAS Viya Reports (Figure 8). The four reports that we created are listed.

11
Figure 8. SAS Viya Code Node Custom Report Selection
Select Variable Importance Forest to display the variable importance for the forest model
(Figure 9).
Figure 9. SAS Viya Code Node Variable Importance Forest Table
INTEGRATE MODEL STUDIO WITH SAS VISUAL ANALYTICS
We want to create a Forest model in SAS Visual Analytics by using the SAS Visual Data
Mining and Machine Learning add-on. We will then import the model into Model Studio.

12
In SAS Visual Analytics, you can start by identifying the data that you want to model. You can then adjust certain characteristics of that data and create new data items. The
insightToyDemo data must be loaded into CAS before we can begin our analysis.
Open SAS Visual Analytics and click the Data button. Use the Import tab to import the insightToyDemo data. We want to create a partition column based on the partition variable already existing in the table. In the Data pane, right-click the z Partition category and select
New partition. In the New Partition window, specify V for Validation data value and specify T
for Training data value.
To create the Total Cost variable, select New data item in the Data pane, and then select
Calculated item (Figure 10). Replace the text with the following expression:
'Order Distribution Cost'n + 'Order Marketing Cost'n + 'Order Product
Cost'n + 'Order Sales Cost'n
Figure 10. Create the Total Cost Variable in SAS Visual Analytics
From the Objects pane, drag a Forest object onto the canvas. In the Data Roles pane, select Order Returned as the response variable. Select Total Cost, Vendor Distance, Vendor Rating, Vendor Satisfaction, Product Line, and Vendor Type as the Predictors. Select z Partition as a Partition ID variable. Notice that the Error Plot, Variable Importance chart,
and Lift plot are displayed in the canvas (Figure 11).

13
Figure 11. SAS Visual Analytics Forest Model Results
To copy this model from SAS Visual Analytics to Model Studio, select Create pipeline, and then select Add to new project. This action copies the variable roles, the model, and all data
preparation steps to Model Studio and then Model Studio will automatically open. The Model Studio project is named Interactive Project and the created pipeline will contain four nodes
as shown in Figure 12.

14
Figure 12. Model Studio Interactive Project Pipeline
The Interactive Data Preparation node handles the role assignments that you made in SAS
Visual Analytics when you run the pipeline. In this example, all variables other than the response variable, the partition variable, and the variables selected as the predictors are rejected by the Interactive Data Preparation node. The Interactive Forest node runs the Forest score code generated in SAS Visual Analytics. In the same pipeline, a Forest node can be added from the Supervised Learning nodes group. The new Forest model can then be
compared with the Interactive Forest model created in SAS Visual Analytics as shown in Figure 13. The models created in SAS Visual Analytics and Model Studio can be different. SAS Visual Analytics is an interactive environment, so the default options are set so that models will run faster. In Model Studio, the default options are set to generate the best
possible model.

15
Figure 13. Model Studio Forest Model Pipeline
IMPORT A SAS ENTERPRISE MINER MODEL INTO MODEL STUDIO
We now want to compare the three Forest models that we created in SAS Enterprise Miner, SAS Visual Analytics, and Model Studio. We first need to import the Forest model that we
built in SAS Enterprise Miner into Model Studio. The Score Code Import node enables you to import the score code of external models that have a representation in DS1 SAS code or in an analytic store. To import the model built in SAS Enterprise Miner into Model Studio, the analytic store and the score code file exported by the Score Code Export node need to be
copied to a directory accessible by Model Studio.
UPLOAD AN ANALYTIC STORE TO CAS
To import an analytic store model in Model Studio, the analytic store in the form of a binary file (sasast extension) must be uploaded to CAS first. You can use the ASTORE procedure to upload an analytic store from the local file system into a data table in CAS. You can use the
CASUTIL procedure with the promote option to load the analytic store into global-scope so that it can be found by Model Studio. Global-scope tables can be seen publicly and are not
dropped when the CAS session is terminated.
You can use the SAS Code node to run PROC ASTORE to upload the analytic store. A new
pipeline shown in Figure 14 is created in the Model Studio project.

16
Figure 14. Model Studio SAS Code Pipeline to Upload Analytic Store
The following code uploads the analytic store to CAS and promotes it into global-scope:
/* Create CAS session */
proc cas;
/* Create SAS librefs for all existing caslibs */
caslib _all_ assign;
/* The UPLOAD statement moves an analytic store from the local file system
into a data table in CAS */
proc astore;
upload store="/demo/hpforestmodel/hpforest_score.sasast"
rstore=Models.hpforeststore_ast;
run;
/* Promote the Analytic Store to global scope so that it is available to
all sessions */
proc casutil;
promote casdata="hpforeststore_ast"
casout="hpforeststore"
incaslib="Models"
outcaslib="Public";
quit;
Note that the analytic store does not reside on your client, but must reside in a path
available to the SAS client (the SAS Viya session).
IMPORT THE SAS ENTERPRISE MINER HP FOREST MODEL
To import the HP Forest model that you created in SAS Enterprise Miner, add the Score Code Import node to the Interactive Pipeline created earlier (located in the Supervised
Learning node group). The updated pipeline is shown in Figure 15.

17
Figure 15. Model Studio Pipeline with Forest Models from SAS Visual Analytics,
Model Studio, and SAS Enterprise Miner
In the Score Code Import node properties pane, click Open. Select the analytic store code
File Type radio button. Under Score code file, c lick Browse, navigate to the hpforest_epcode.sas file that you saved earlier, and select OK. Under analytic store table, click Browse to select an analytic store table. Select hpforeststore from the Public library and select OK. Select Import to import the HP Forest model. The score code that you
created in SAS Enterprise Miner is opened in the code editor.
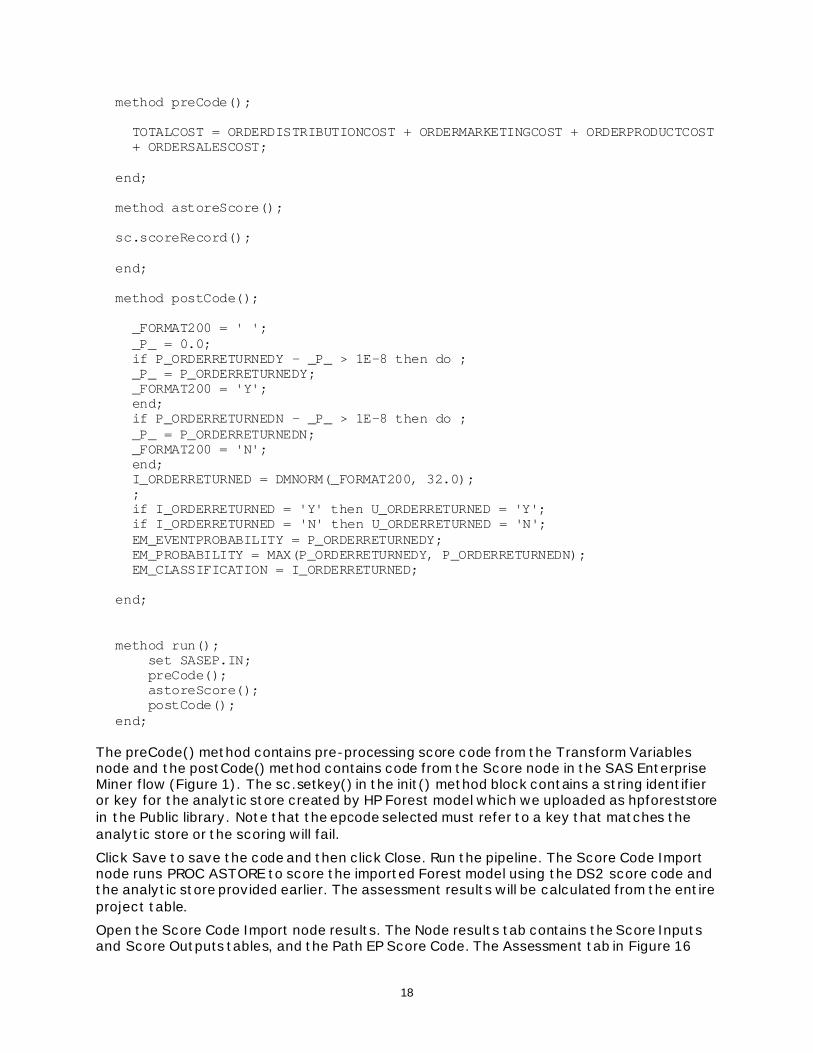
A snapshot of the DS2 score code file below shows the variable declaration, and the init(),
preCode(), astoreScore(), and postCode() methods:
dcl nchar(4) "_WARN_" having label n'Warnings';
dcl nchar(1) U_ORDERRETURNED;
dcl double EM_EVENTPROBABILITY;
dcl double EM_PROBABILITY;
dcl nchar(32) EM_CLASSIFICATION;
dcl nchar(200) _FORMAT200;
dcl double _P_;
varlist allvars [_all_];
method init();
sc.setvars(allvars);
sc.setkey(n'1175CA1F805D85652BEE789C4F4D5507F51F8F30');
end;
18
method preCode();
TOTALCOST = ORDERDISTRIBUTIONCOST + ORDERMARKETINGCOST + ORDERPRODUCTCOST
+ ORDERSALESCOST;
end;
method astoreScore();
sc.scoreRecord();
end;
method postCode();
_FORMAT200 = ' ';
_P_ = 0.0;
if P_ORDERRETURNEDY - _P_ > 1E-8 then do ;
_P_ = P_ORDERRETURNEDY;
_FORMAT200 = 'Y';
end;
if P_ORDERRETURNEDN - _P_ > 1E-8 then do ;
_P_ = P_ORDERRETURNEDN;
_FORMAT200 = 'N';
end;
I_ORDERRETURNED = DMNORM(_FORMAT200, 32.0);
;
if I_ORDERRETURNED = 'Y' then U_ORDERRETURNED = 'Y';
if I_ORDERRETURNED = 'N' then U_ORDERRETURNED = 'N';
EM_EVENTPROBABILITY = P_ORDERRETURNEDY;
EM_PROBABILITY = MAX(P_ORDERRETURNEDY, P_ORDERRETURNEDN);
EM_CLASSIFICATION = I_ORDERRETURNED;
end;
method run();
set SASEP.IN;
preCode();
astoreScore();
postCode();
end;
The preCode() method contains pre-processing score code from the Transform Variables node and the postCode() method contains code from the Score node in the SAS Enterprise Miner flow (Figure 1). The sc.setkey() in the init() method block contains a string identifier or key for the analytic store created by HP Forest model which we uploaded as hpforeststore
in the Public library. Note that the epcode selected must refer to a key that matches the
analytic store or the scoring will fail.
Click Save to save the code and then click Close. Run the pipeline. The Score Code Import node runs PROC ASTORE to score the imported Forest model using the DS2 score code and the analytic store provided earlier. The assessment results will be calculated from the entire
project table.
Open the Score Code Import node results. The Node results tab contains the Score Inputs and Score Outputs tables, and the Path EP Score Code. The Assessment tab in Figure 16

19
displays the assessment reports: Lift Reports, ROC Reports, and the Fit Statistics table. The Fit Statistics table shows that the misclassification rate for the training partition is 0.0522 and the misclassification rate for the validation partition is 0.0603. In Model Studio 8.4, a
misclassification report will also be created that displays a classification bar chart across all
data partitions.
The score code in the Score Code Import node is static, so if you rerun the pipeline, the
associated score code or analytic store will not change.
Figure 16. Score Code Import Node Results
BATCH CODE NODE
The Batch Code node in Model Studio enables you to import batch processing code or batch scripts that were created in SAS Enterprise Miner. When the Batch Code node runs, a sample of the input data is provided to the SAS client . The batch processing code that represents the SAS Enterprise Miner process flow diagram is run on that sample. When the batch code node reruns, the score code associated with the SAS Enterprise Miner flow will be regenerated and assessed in Model Studio. The results can differ from the results in SAS
Enterprise Miner because the project has changed. This differs from the Score Code Import
node where the score code or analytic store is static when you rerun a pipeline.
Add a Batch Code node (located in the Supervised Learning node group) to the Interactive
Project Pipeline created earlier. The updated pipeline is shown in Figure 17.

20
Figure 17. Model Studio Pipeline with the Rule Induction Model from SAS
Enterprise Miner
In the Batch Code node properties pane, click Open and navigate to the batch code file for the rule induction model that you saved earlier. The batch processing code that you created
in SAS Enterprise Miner is opened in the code editor:
*------------------------------------------------------------*;
* EM Version: 15.1;
* SAS Release: 9.04.01M6P110718;
* Host: larry;
* Project Path: C:\temp;
* Project Name: SGF2019;
* Diagram Id: EMWS8;
* Diagram Name: Rule Induction model;
* Generated by: jakanj;
* Date: 21FEB2019:13:39:43;
*------------------------------------------------------------*;
*------------------------------------------------------------*;
* Macro Variables;
*------------------------------------------------------------*;
%let EM_PROJECT =;
%let EM_PROJECTNAME =;
%let EM_WSNAME =;
%let EM_WSDESCRIPTION =Rule Induction model;
%let EM_SUMMARY =WORK.SUMMARY;
%let EM_NUMTASKS =SINGLE;
%let EM_EDITMODE =R;
%let EM_DEBUGVAL =;
%let EM_ACTION =run;
The header at the top of the program provides information about the SAS Enterprise Miner project and diagram from which this batch code file was created. In this example, the EM_PROJECT, EM_PROJECTNAME, and EM_WSNAME macro variables are not set. This

21
indicates that when the batch code runs it will create a temporary project in the WORK directory of the SAS Viya client session. In some cases, those macro variables might have been predefined to specific values; this is useful in SAS Enterprise Miner if you want to
rerun an existing diagram or create a project and diagram at a specific location. However, when running the batch code in Model Studio those macro variables are ignored because in
most cases the SAS Viya client will not be able to access that location.
The workspace data set uses the macro variables to set the configuration properties:
*------------------------------------------------------------*;
* Create workspace data set;
*------------------------------------------------------------*;
data workspace;
length property $64 value $200;
property= 'PROJECTLOCATION';
value= "&EM_PROJECT";
output;
property= 'PROJECTNAME';
value= "&EM_PROJECTNAME";
The batch code file contains information about the data source that was used when the process flow was created in SAS Enterprise Miner and which table should be used when running the batch file. When the Batch Code node runs, the CAS data or a sample will be
used instead of what is specified in the batch file:
%macro em_usedatatable;
%if ^%symexist(EM_USEDATATABLE) %then %do;
%let EM_USEDATATABLE = Y;
%end;
%if "&EM_USEDATATABLE" ne "N" %then %do;
%global Ids_data Ids_newdata;
*------------------------------------------------------------*;
* Data Tables;
*------------------------------------------------------------*;
%let Ids_data = INSIGHT.INSIGHTTOYDEMO;
%let Ids_newdata =;
*------------------------------------------------------------*;
%end;
%global Ids_source;
%if "&Ids_newdata" ne "" %then %do;
%let Ids_source = USERTABLE;
%end;
%else %do;
%let Ids_source = DATASOURCE;
%end;
%mend em_usedatatable;
%em_usedatatable;
The file also contains the start-up code associated with the project from which the batch code was created. In many cases this code contains references to paths that might not be accessible to the SAS Viya session. This code is therefore ignored when the Batch Code
runs:
*------------------------------------------------------------*;
* Run Startup and Property Code;
*------------------------------------------------------------*;
%macro em_runstartupCode;

22
%if ^%symexist(EM_RUNSTARTUP) %then %do;
%let EM_RUNSTARTUP = Y;
%end;
%if "&EM_RUNSTARTUP" ne "N" %then %do;
data _null_;
if symget('sysscp')=:'WIN' then dsep='\';
else if symget('sysscp')=:'DNT' then dsep='\';
else dsep = '/';
filepath = pathname('work')!!dsep!!"RUNSTARTUP.sas";
call symput('DSPATH', filepath);
run;
data _null_;
filename dspath "&dspath";
file dspath;
put '*------------------------------------------------------------* ;';
put '* Project Startup Code';
put '*------------------------------------------------------------* ;';
put ' ';
put ' ';
put 'libname DemoData ''\D:\SGF2019'';';
put ' ';
run;
%end;
%mend em_runstartupCode;
%em_runstartupCode;
The nodes data set defines nodes that are used in the process flow diagram. In this example, Transform, Rule Induction, and Score nodes were used in the process flow
diagram:
*------------------------------------------------------------*;
* Create nodes data set;
*------------------------------------------------------------*;
data nodes;
length id $12 component $32 description $64 X 8 Y 8 diagramID $32 parentID
$32;
id= "Trans";
component="Transform";
description= "Transform Variables";
diagramID="_ROOT_";
parentID="";
X=462;
Y=66;
output;
id= "Score";
component="Score";
description= "Score";
diagramID="_ROOT_";
parentID="";
X=858;
Y=66;
output;
id= "Rule";
component="RuleInduction";
description= "Rule Induction";
diagramID="_ROOT_";
parentID="";

23
The connections data set indicates directional flow from predecessor nodes to successor
nodes:
*------------------------------------------------------------*;
* Create connections data set;
*------------------------------------------------------------*;
data connect;
length from to $12;
from="Rule";
to="Score";
output;
from="Trans";
to="Rule";
output;
from="EMCODE";
to="Trans";
output;
The batch code file contains the metadata associated with the Input Data node of the flow.
When the Batch Code node runs, this metadata will be replaced by the metadata of the Model Studio project that is displayed in the Data tab. This ensures that the same target
and input variables are used:
*------------------------------------------------------------*;
* Variable Attributes for Ids;
*------------------------------------------------------------*;
data WORK.Ids_VariableAttribute;
length Variable $64 AttributeName $32 AttributeValue $64;
Variable='DistributorCityLat';
AttributeName="LEVEL";
AttributeValue='NOMINAL';
Output;
Variable='DistributorCityLon';
AttributeName="LEVEL";
AttributeValue='NOMINAL';
Output;
Variable='DistributorLat';
AttributeName="LEVEL";
AttributeValue='NOMINAL';
Output;
Variable='DistributorLon';
AttributeName="LEVEL";
AttributeValue='NOMINAL';
Output;
The actions data set defines actions to be taken by each node in the process flow diagram. In this example, the run action is invoked from the Score node, which means that this node
and all its predecessors will run. Note that REPORT is also a supported action. The REPORT action creates an SPK file that contains the SAS Enterprise Miner results of each node in the diagram. However, when running in Model Studio the results of that action are simply
ignored:
*------------------------------------------------------------*;
* Create actions to run data set;
*------------------------------------------------------------*;
%macro emaction;

24
%let actionstring = %upcase(&EM_ACTION);
%if %index(&actionstring, RUN) or %index(&actionstring, REPORT) %then %do;
data actions;
length id $12 action $40;
id="Score";
%if %index(&actionstring, RUN) %then %do;
action='run';
output;
%end;
The EXECUTE operation of the %em5batch macro submits the flow stream to SAS for program execution. The %em5batch macro uses the previously defined workspace, nodes,
connect, nodeprops, and actions arguments:
*------------------------------------------------------------*;
* Execute the actions;
*------------------------------------------------------------*;
%em5batch(execute, workspace=workspace, nodes=nodes, connect=connect,
datasources=datasources, nodeprops=nodeprops, action=actions);
Click Save and then click Close. Run the pipeline. The data is downloaded to the SAS client and the data mining batch processing code shown above will be submitted in a SAS batch job. If the training data is very large, it is recommended that you download a sample of the training data to the SAS client to use to train the model. You can specify a sampling method and the number or percentage of observations in the properties panel under the Data
Sample group. Although the training might be using only a sample of the training data, the
assessment results will be calculated from the entire project table.
Open the Batch Code node results. The Node results tab contains the Score Inputs and
Score Outputs tables, the EM Batch Code, and the Path Score Code. The Assessment tab in Figure 18 displays the assessment reports: Lift Reports, ROC Reports, and the Fit Statistics table. The Fit Statistics table shows that misclassification rate for the training partition is
0.1060 and the misclassification rate for the validation partition is 0.1059.

25
Figure 18. Batch Code Node Results
USE SAS ENTERPRISE MINER AND HIGH-PERFORMANCE DATA MINING PROCEDURES IN MODEL STUDIO
You can also leverage code that uses SAS Enterprise Miner or SAS High-Performance Data Mining (HPDM) procedures by integrating them into a SAS Code node in Model Studio. This enables you, similarly to the Batch Code node, to retrain a SAS Enterprise Miner model with
new data. This also allows you to also add custom reports to the node results.
We illustrate how this can be done through two examples. The first example uses a SAS Enterprise Miner procedure that produces DS1 score code. The second example uses an HPDM procedure that produces a model based on an analytic store. Because these procedures do not run in a CAS environment, the data will get downloaded to the SAS
client. Therefore, if the training data is very large, it is recommended that you download a sample of the training data to the SAS client to use to train the model. This can be done by using the PARTITION CAS procedure. Although the model might be trained using only a sample of the training data, the assessment results will be calculated from the entire project
table.
Figure 19 shows the final pipeline after completing these last two examples.

26
Figure 19. Model Studio Pipeline with All Six Models
BUILD A LOGISTIC REGRESSION MODEL USING THE DMREG PROCEDURE
In this first example, we fit a logistic regression model to the OrderReturned binary target variable. In a logistic regression, observations with missing values are ignored. This reduces
the size of the training data set, which can weaken the predictive power of the model. To impute missing values, right-click the Interactive Data Preparation node in your pipeline and add an Imputation node (located in the Data Mining Preprocessing group). By default, the Imputation node imputes class variables with the most frequent class and imputes interval variables with the mean. Add a SAS Code node below the Imputation node. Right -click the
SAS Code node, select Move, and then select Supervised Learning. This moves the node to the Supervised Learning swim lane so that it gets treated as other modeling nodes. Right-
click the SAS Code node and rename the node “DMREG.”
Unlike HPDM and CAS-based procedures, SAS Enterprise Miner procedures such as DMREG require separate data sets for the training, validat ion, and/or test data. Therefore, we first create local training and validation tables by applying WHERE clauses to the CAS training table. Note that by using the dm_partitiontrainwhereclausenlit and
dm_partitionValidWhereClauseNlit macro variables the code is dynamic and could be
reused in other projects based on different data sources or partition variables:
/* Create the training and validation data sets */
data work.train;
set &dm_data;
where &dm_partitionTrainWhereClauseNlit;
run;
data work.validate;
set &dm_data;
where &dm_partitionValidWhereClauseNlit;
run;
The DMREG procedure requires the creation of a Data Mining Database (DMDB) catalog,
which is created using PROC DMDB:
proc dmdb batch data=work.train dmdbcat=work.dmdbcat maxlevel = 513;
class %dm_dec_target %dm_class_input;

27
var %dm_interval_input;
target %dm_dec_target;
run;
We then fit the logistic regression model with the following code:
proc dmreg data=work.train dmdbcat=work.dmdbcat
validata = work.validate
outterms = &dm_lib..outterms
namelen=200;
class %dm_dec_target %dm_class_input;
model %dm_dec_target = %dm_interval_input %dm_class_input
/ error=binomial link=LOGIT coding=DEVIATION nodesignprint;
code file="&dm_file_scorecode" group=_&dm_labelid;
run;
Because we want to display a plot of our parameter estimates, we create the OUTTERMS data set. The DMREG procedure produces DS1 score code and we use the code statement to create the Model Studio system file &dm_file_scorecode. This file will be used to assess
this model on the entire CAS table and produce assessment reports. Note that the group option is used to prevent label collision if we were to decide to ensemble this model with
others.
Finally, we create a custom report that display the t-values associated with the various parameter estimates using a bar chart. The dmcas_report macro is used to describe the bar
chart to be displayed:
data &dm_lib..outterms;
length sign $1 effect $65;
set &dm_lib..outterms;
if coefficient<0 then sign='-';
else sign='+';
if Variable ne 'Intercept' and classLevel ne '' then
effect=ktrim(variable)!!'-'!!ktrim(classLevel);
else
effect = ktrim(variable);
abstvalue = abs(tvalue);
run;
%dmcas_report(dataset=outterms, reportType=BarChart, category=Effect,
Response=abstvalue, sortDirection=descending,
sortBy=abstvalue, group=sign,
description=%nrbquote(T Value));
Run the SAS Code node and examine the results. Figure 20 displays a bar chart of the t-values ordered in descending order with the bars colored by the sign of the parameter
estimates.

28
Figure 20. Parameter Estimates for the DMREG Model
The Path Score Code contains the transformations from the Interactive Data Preparation
node that was created in SAS Visual Analytics and from the Imputation node:
*------------------------------------------------------------*;
* DMCAS Release: 1.0;
* SAS Release: V.03.04M0P012919;
* Site Number: 70180938;
* Host: sasdzl2.emd.sashq-d.openstack.sas.com;
* Encoding: utf-8;
* Java Encoding: UTF8;
* Locale: en_US;
* Project GUID: dc803dcd-af32-45bb-9b82-7321010c33b0;
* Node GUID: c1ab2265-fbc6-488e-a2ac-b2850dc74f05;
* Generated by: sasdzl;
* Date: 19FEB2019:15:37:40
*------------------------------------------------------------*;
*------------------------------------------------------------*;
*Nodeid: _2YXXM5J7R0BDWTM7K8CHIH920;
*------------------------------------------------------------*;
'_va_d_TotalCost'n=('OrderDistributionCost'n + 'OrderMarketingCost'n +
'OrderProductCost'n + 'OrderSalesCost'n);;
*------------------------------------------------------------*;
*Nodeid: _91H3E88L3KP8UNOAW3BKDBLZM;
*------------------------------------------------------------*;
*------------------------------------------------------------*;
*Nodeid: _50YL9LD3XZYLSLEY3WADI97XU;

29
*------------------------------------------------------------*;
* Imputation Method = MEAN ;
Label 'IMP_VendorRating'n = 'Imputed Vendor Rating';
Length 'IMP_VendorRating'n 8;
if missing('VendorRating'n) then do;
'IMP_VendorRating'n = 0.5704505088;
end;
else 'IMP_VendorRating'n = 'VendorRating'n;
The Node results tab contains all the other reports included in supervised modeling nodes: Score Inputs and Score Outputs tables, Properties table, and the Output Delivery System
(ODS) output that was generated by the DMREG procedure.
The Assessment tab (Figure 21) contains the same reports included in the output of the supervised learning models with a binary target: Lift reports, ROC reports, and the Fit
Statistics table. The Fit Statistics table shows that misclassification rate for the training
partition is 0.0565 and the misclassification rate for the validation partition is 0.0561.
Figure 21. DMREG Model Results
Because this SAS Code node is a supervised learning node, you can add it as a challenger model (if not chosen by the Model Comparison node) in the Pipeline Comparison tab; you can use it to score a holdout table; or you can register it to SAS® Model Manager. In Model Studio 8.4, you will be able to publish a model to SAS® Micro Analytic Service (MAS). For
more information, refer to the paper “Unleashing SAS® Visual Data Mining and Machine
learning Models.”

30
BUILD A MODEL THAT CREATES AN ANALYTIC STORE
In this second example, we use the HPSVM procedure to produce a support vector machine (SVM) model. Because the HPSVM procedure supports a partition variable defined in its
training data, we use the dm_partition_statement macro variable to dynamically reference
the partition variable and partition values. Add another SAS Code node below the
Imputation node. Right-click the node and rename it “HPSVM.”
The following code creates the SVM model:
proc hpsvm data=&dm_data maxiter=25 method=ACTIVESET
tolerance=0.000001 c=1;
input %dm_interval_input / level = interval;
input %dm_nominal_input %dm_binary_input / level = nominal;
target %dm_dec_target / level = &dm_dec_level;
kernel polynom / deg = 2;
&dm_partition_statement;
PERFORMANCE DETAILS;
savestate file = "&dm_file_astore";
run;
proc astore;
upload store="&dm_file_astore" rstore=&dm_data_rstore;
run;
The HPSVM procedure produces score code in the form of an analytic store. The savestate statement is used to create the analytic store binary file, which resides on the SAS client. In order for Model Studio to assess the model, this file must be uploaded to CAS. You use the ASTORE procedure to upload this file to a CAS table so that Model Studio can assess the
model on the CAS training table.
As in the previous example, the Assessment tab in the node Results is populated with
assessment reports (Figure 22). The Fit Statistics table shows that misclassification rate for the training partition is 0.0558 and the misclassification rate for the validation partition is
0.0552.

31
Figure 22. HPSVM Model Results
Open the Model Comparison node results and note that the Forest model created in Model Studio is the champion model (Figure 23). The Forest model built in Model Studio has a larger Kolmogorov-Smirnov (KS) value compared to the other five models built in this
paper.
Figure 23. Model Studio Model Comparison Results for All Models
SCORE USING A MODEL STUDIO FOREST MODEL IN SAS 9.4

32
The analytic store table and DS2 scoring code generated in Model Studio can be downloaded for use in other environments. In this example, the Forest model built in Model Studio can be used to score in SAS 9.4. In your Interactive Model pipeline, right-click the Model Studio
Forest node and select Download Score Code. Save the ZIP file. The ZIP file contains a SAS file called dmcas_epscorecode.sas, which is the DS2 code associated with the analytic store. This file references the analytic store table information located in the model’s CAS library (CASLIB) table. In addition, the associated analytic store will be copied from the project CASLIB to the model’s CASLIB. For example, the header in the dmcas_epscorecode.sas file
indicates that the _97E0545WF9DNUSCUFG8GN8HVY_ast analytic store is located in the
Models CAS library:
/* This score code file references one or more analytic stores that are
located in the CASLIB Models.
* These ASTORE tables include:
* _97E0545WF9DNUSCUFG8GN8HVY_ast */
PROC ASTORE is used to download the analytic store table
_97E0545WF9DNUSCUFG8GN8HVY_ast, which was created by Forest model.
Create a new pipeline with a SAS Code node (Figure 24). Use the SAS Code node to run
PROC ASTORE to download the analytic store table to the SAS Viya file system.
Figure 24. Model Studio SAS Code Pipeline to Download Analytic Store
The CASLIB statement makes the default CAS libraries visible in the active session. The CASUTIL procedure is used to load the analytic store table into memory on the CAS server. The following code loads the analytic store table _97E0545WF9DNUSCUFG8GN8HVY_ast
into memory and makes it available in the Public library:
/* Create CAS session */
cas;
/* Create SAS librefs for all existing caslibs */
caslib _all_ assign;
/* Load the analytic store table into memory and make it available into
Public library */
proc casutil;
load casdata="_97E0545WF9DNUSCUFG8GN8HVY_ast.sashdat"
incaslib="models"
casout="_97E0545WF9DNUSCUFG8GN8HVY_ast"
outcaslib=Public;
run;
The DOWNLOAD statement retrieves the analytic store available in the CAS session and
stores it in the SAS file system. The following code downloads the analytic store table

33
_97E0545WF9DNUSCUFG8GN8HVY_ast to the Public library and stores the Forest.sasast file
in the SAS file system:
/* Retrieve an analytic store _97E0545WF9DNUSCUFG8GN8HVY_ast from the CAS
session and store it in the local file system as Forest.sasast */
proc astore;
download rstore=Public._97E0545WF9DNUSCUFG8GN8HVY_ast"
store="/saveastore/Forest.sasast";
run;
The Forest.sasast and dmcas_epscorecode.sas files need to be copied to directories
accessible by SAS 9.4 system.
PROC ASTORE can score an input table by using the information in the analytic store created by the Forest model. In this example, the input data table is InsightToyDemo, the output data table is SAS94_scoreout1, the analytic store table is Forest.sasast, and the DS2 scoring code is in the dmcas_epscorecode.sas file (generated by the Forest model). Run the
following PROC ASTORE code to score the model in the SAS 9.4 Program Editor. The same
code can be executed in a SAS Code node in SAS Enterprise Miner:
libname DemoData "D:\AstoreModels";
/* Score the forest model */
proc astore;
score data=DemoData.InsightToyDemo
store="D:\AstoreModels\Forest.sasast"
epcode="D:\AstoreModels\dmcas_epscorecode.sas"
out=DemoData.SAS94_scoreout1;
quit;
proc print data=DemoData.SAS94_scoreout1 (obs=100);
run;
View the output. The SAS94_scoreout1 table was created in the D:\AstoreModels directory
and first 100 observations were printed in the output.
SCORE ANALYTIC STORE MODELS IN CAS FROM SAS 9.4
SAS Cloud Analytic Services (CAS) is the analytic server and associated cloud services in SAS Viya. You can create a CAS session and run a CASLIB statement to make the default CAS libraries visible in the specified library. The CASLIB statement assumes that you have a CAS server already available. This CAS server is identified by specifying the host on which it
runs and the port on which it listens for communications.
The following CAS statement creates the CAS session named emcasid:
cas emcasid host="dmcasrh-18w30.aatesting.sashq-r.openstack.sas.com"
port=5570;
The following caslib statement makes the default CAS libraries visible in the CAS session:
caslib _all_ assign;
If you have created the emcasid session, you can terminate it with the following code by
using the TERMINATE option in the CAS statement:
cas emcasid terminate;

34
If the CAS server is Transport Layer Security (TLS) enabled, you need to install certificates to the trusted Certificate Authority (CA) bundle. You can use SAS® Deployment Manager to add your root and intermediate certificates to the trusted CA bundle and validate
certificates. For more information, you can refer to the SAS® 9.4 and SAS® Viya®
programming documentation.
The CASUTIL procedure can be used to load an analytic store table into memory on a
specified CAS server. The following code loads the analytic store table _97E0545WF9DNUSCUFG8GN8HVY_ast that was created by the Forest model in Model
Studio into memory and makes it available in the Public library as a foreststore:
proc casutil;
load casdata="_97E0545WF9DNUSCUFG8GN8HVY_ast.sashdat"
incaslib="models" /* This is the store that was copied earlier from
our project CASLIB when we downloaded out the DS2 code. */
casout="foreststore"
outcaslib="Public";
run;
Use PROC ASTORE to score an input table by information in the analytic store, foreststore, which is loaded in Public library. In this example, the input data table is public.InsightToyDemo, the output data table is public.scoreout1, the analytic store is in the
data table Public.foreststore, and DS2 scoring code is in the dmcas_epscorecode.sas file
(generated by the Forest model):
ods listing;
proc astore;
score data=public.InsightToyDemo
out=public.scoreout1
rstore=Public.foreststore
epcode="D:\AstoreModels\dmcas_epscorecode.sas";
run;
CONCLUSION
Model Studio enables users with the ability to not only create models based on modern
machine learning algorithms, but also import models from a variety of sources: SAS Visual Analytics, models created in SAS Enterprise Miner, and external models that can be expressed in the form of DS1 code or as an analytic store. Moreover, you can, us ing the SAS code node, create your own models by writing custom code based on SAS Enterprise Miner or HPDM procedures or use the Batch Code node to run SAS Enterprise Miner diagrams expressed as batch code. Model Studio provides a flexible environment to assess,
compare, register, and publish these models although they came from various sources and
applications.
REFERENCES
Ebersole, Beth, and Czika, Wendy. 2018. “Make SAS® Enterprise Miner™ Play Nicely with SAS® Viya®.” Proceedings of the SAS Global Forum 2018. Cary, NC: SAS Institute Inc. Available at https://www.sas.com/content/dam/SAS/support/en/sas-global-forum-
proceedings/2018/2204-2018.pdf.
SAS Institute Inc. 2018. “Create a Forest.” In SAS® Visual Analytics 8.3: Getting Started with Analytical Models. Cary, NC: SAS Institute Inc. Available at https://go.documentation.sas.com/?cdcId=vacdc&cdcVersion=8.3&docsetId=vaamgs&docs
etTarget=n0y80e2uitkic4n1vq836kjkmsbo.htm&locale=en.

35
Pecze, Shawn, Prasanth Kanakadandi, Byron Biggs, Michael (Xin) Chi. 2019. “Unleashing SAS® Visual Data Mining and Machine Learning Models.” Proceedings of the SAS Global
Forum 2019. Cary, NC: SAS Institute Inc.
Wujek, Brett, Susan Haller, and Jonathan Wexler. 2018. “Navigating the Analytics Life Cycle with SAS® Visual Data Mining and Machine Learning on SAS Viya.” Proceedings of the SAS Global Forum 2018. Cary, NC: SAS Institute Inc. Available at
https://www.sas.com/content/dam/SAS/support/en/sas-global-forum-
proceedings/2018/2246-2018.pdf.
CONTACT INFORMATION
Your comments and questions are valued and encouraged. Contact the author at:
Jagruti Kanjia
SAS Institute Inc. [email protected] Dominique Latour SAS Institute Inc.
[email protected] Holly Sweeney SAS Institute Inc. [email protected]
SAS and all other SAS Institute Inc. product or service names are registered trademarks or trademarks of SAS Institute Inc. in the USA and other countries. ® indicates USA
registration.
Other brand and product names are trademarks of their respective companies.