saratoga springs ny 4.27.2015send springs ny 4.27.2015send.pdf · open app or playstore on your...
TRANSCRIPT

4/28/2015
1
Welcome!
2015 CEFPI Northeast Regional Conference
Relevance:Designing Schools That
Inspire Teachers,EngageStudents
& Embrace Communities
Thank you to our Sponsors!
2015 CEFPI Northeast Regional Conference

4/28/2015
2
Thank you to our Exhibitors!
2015 CEFPI Northeast Regional Conference
The Mobile App!
1. Open App or Playstore on your phone or tablet
2. Search for Eventsential
3. Select App
4. Click Install
5. Select CEFPI
WHAT CAN YOU DO?
With this app, you can take advantage of features that help you make the most of your time and keep you informed on the latest information.
Capabilities:
Itinerary Builder Appointment Scheduler Session Search Exhibitor Search Session Evaluation Social Networking Event Alerts
TO GET STARTED: Announcements: receive event alerts with the most up-to-date information
Schedule: create your own itinerary and make your personal appointments; take notes dur-ing session’s right on the app and save them for later
Exhibitors: search, filter, and mark exhibitors to visit then contact them through the app
Twitter: stay engaged throughout the event- follow us @CEFPI2/ hashtag #cefpi2015
Event Details: access floor plans, expo hall maps and other information
Dashboard: one quick glance at your person-al itinerary, what is next on your agenda and up to date social media feeds
CEFPI Event Mobile App on smart phone, tablet or web
Download from Apple App Store
or Google Playstore
Use the Mobile App Online
Click on http://cefpi.eventsential.org to use this tool on your computer!
For all your CEFPI Conference
Information and Needs!

4/28/2015
3
Improving the Places Children Learn
• Who we are:– 4,200 Industry Professionals located around the world
– Organized by regions and chapters to serve local needs and interests
– Professional association for stakeholders in planning, designing, building and maintaining the places we learn.
• What we do:– Network & Collaborate
– Share Information & Ideas
– Provide high quality professional development
– Contribute to educational excellence through the connection of learning and place.
The Council of Educational Facility Planners International
Thank you to our Sponsors!
2015 CEFPI Northeast Regional Conference
4/28/2015
4
Designing 21st Century Learning Environmentsfor
Rigor, Relevance and Relationships
Bill Daggett, Founder and Chairman
April 27, 2015
Form follow Function
4/28/2015
5
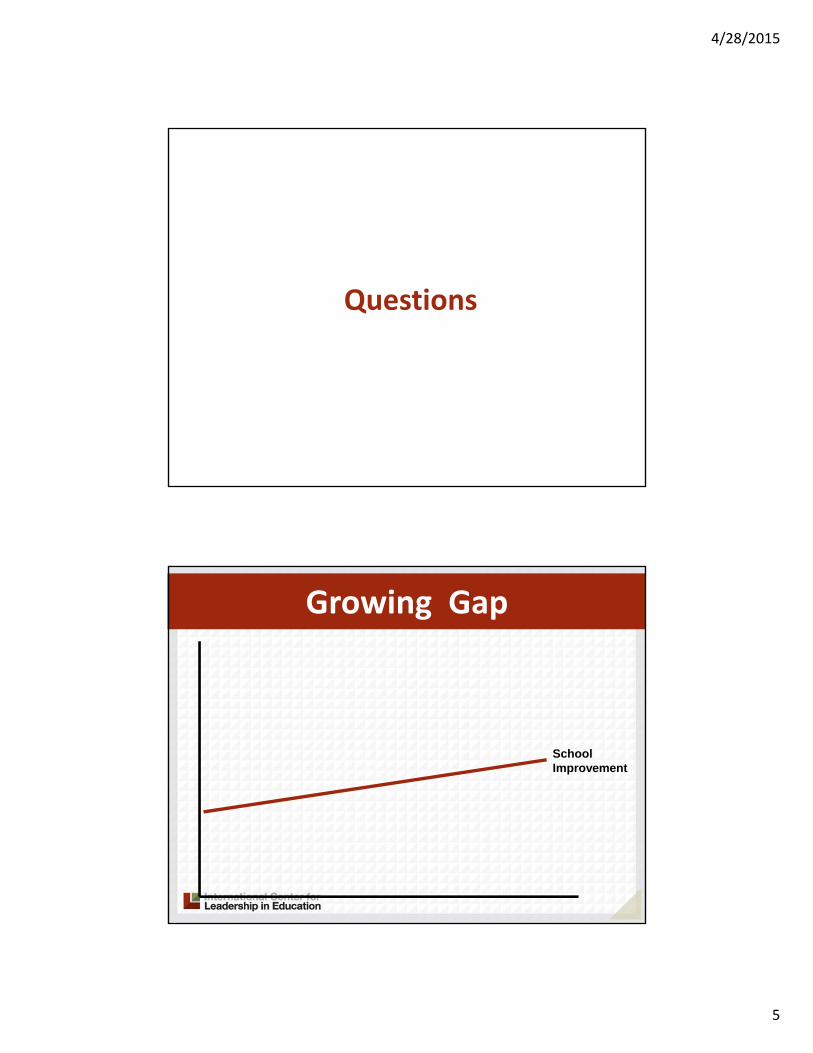
Questions
School Improvement
Growing Gap
4/28/2015
6
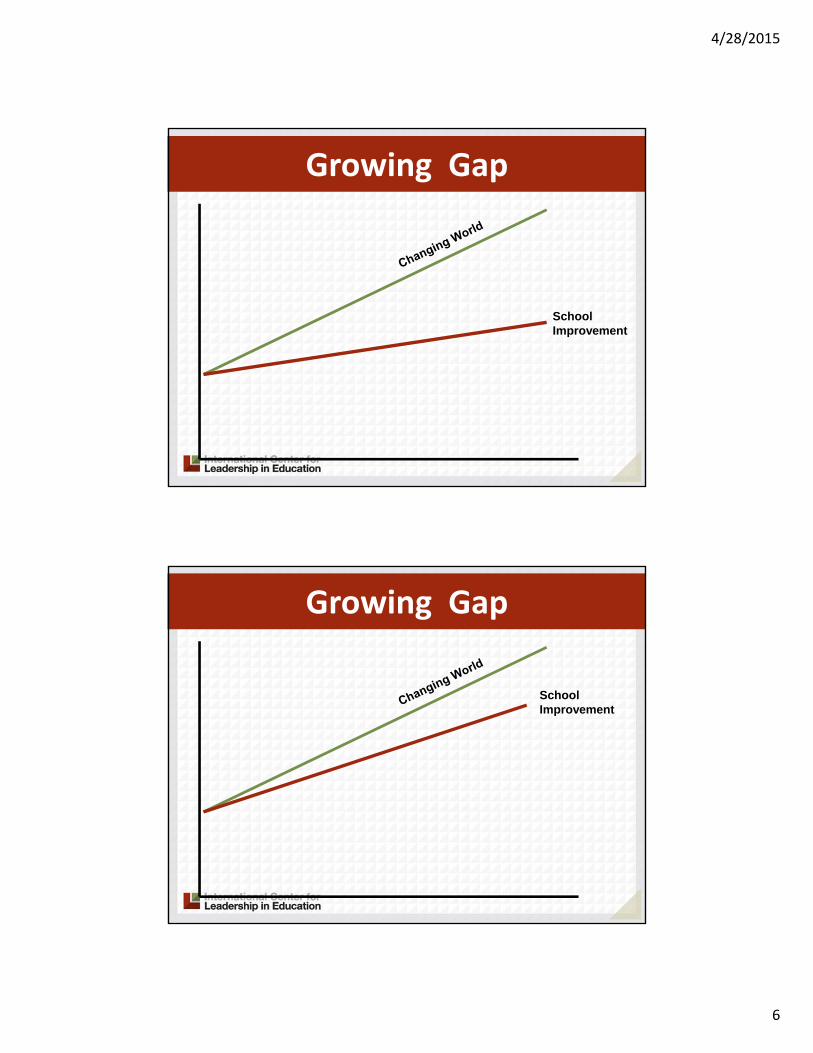
School Improvement
Growing Gap
School Improvement
Growing Gap

4/28/2015
7
School Improvement
Growing Gap

4/28/2015
8
Anchored in the Pastvs.
Focused on the Future
Anchored in the Pastvs.
Focused on the Future

4/28/2015
9
Rigorous Learning
25 Year Journey
Then Now
1. Knowledge in one discipline
2. Application within discipline
3. Application across disciplines
4. Application to real‐world predictable situations
5. Application to real‐world unpredictable situations
Application Model

4/28/2015
10
Rigorous Learning
25 Year Journey
Knowing Doing
Levels
1 2 3 4 5
Bloom’s
C D
A B
456
321
Application
4/28/2015
11
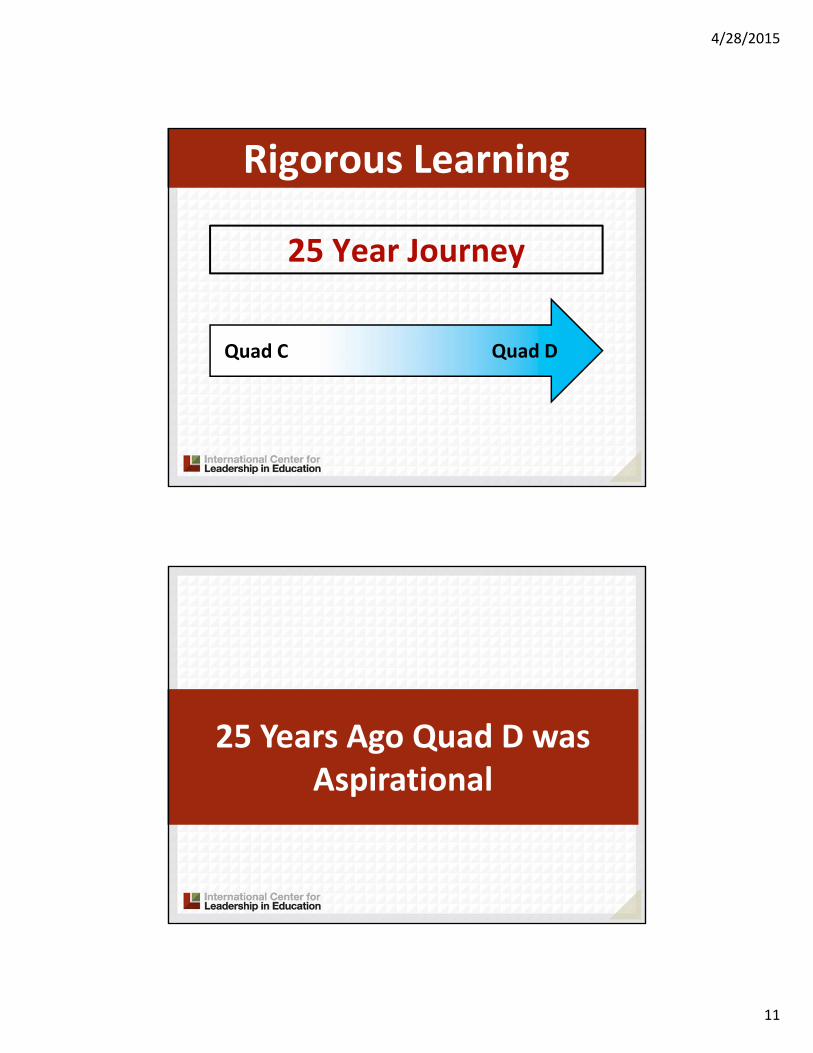
Rigorous Learning
25 Year Journey
Quad C Quad D
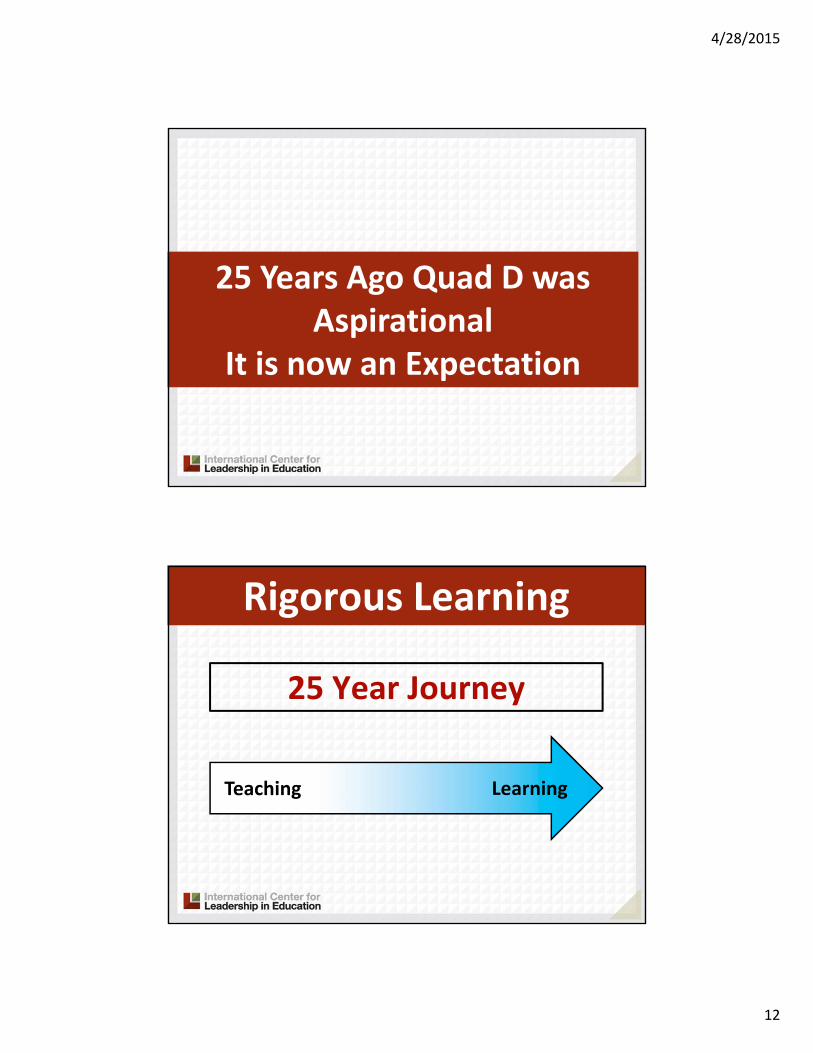
25 Years Ago Quad D was Aspirational
4/28/2015
12
25 Years Ago Quad D was Aspirational
It is now an Expectation
Rigorous Learning
25 Year Journey
Teaching Learning

4/28/2015
13
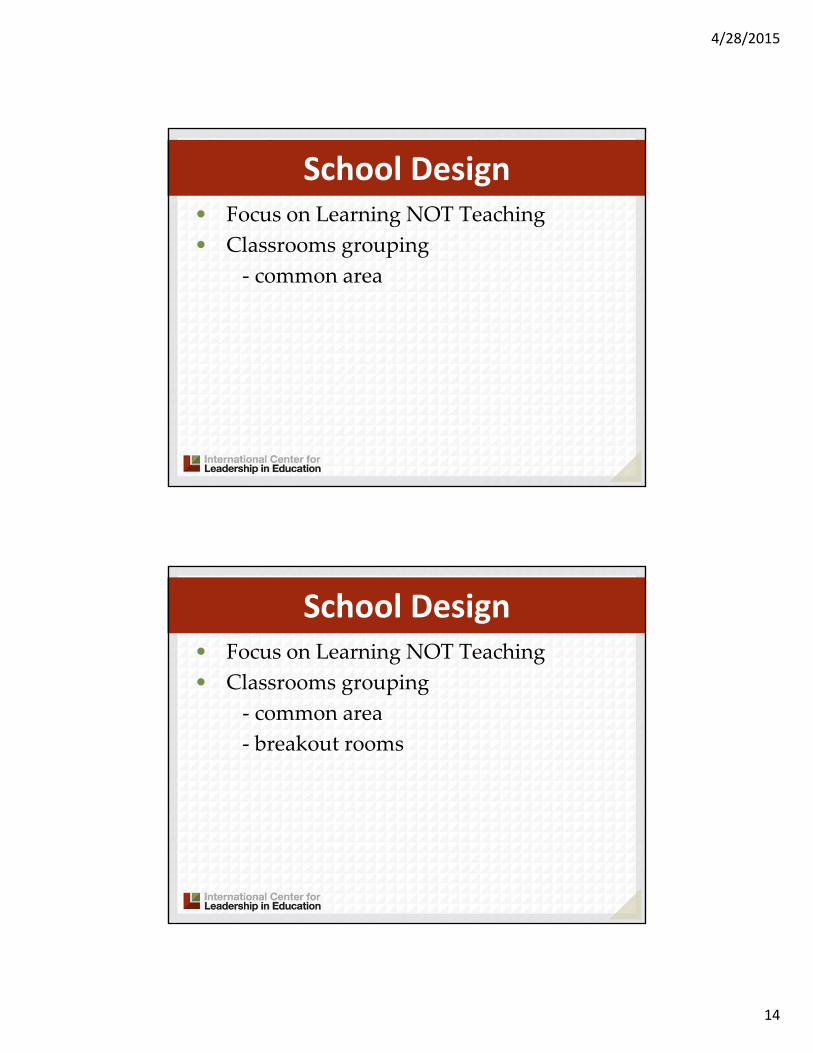
• Focus on Learning NOT Teaching
School Design
• Focus on Learning NOT Teaching
• Classrooms grouping
School Design
4/28/2015
14
• Focus on Learning NOT Teaching
• Classrooms grouping
‐ common area
School Design
• Focus on Learning NOT Teaching
• Classrooms grouping
‐ common area
‐ breakout rooms
School Design
4/28/2015
15
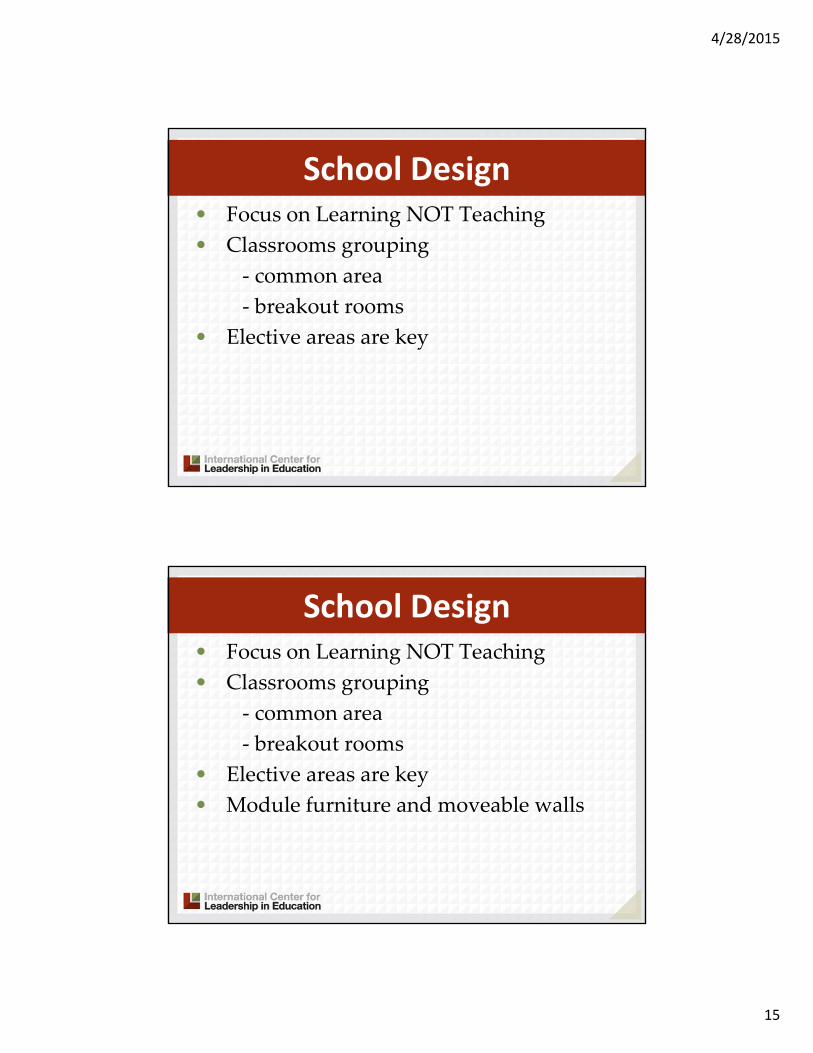
• Focus on Learning NOT Teaching
• Classrooms grouping
‐ common area
‐ breakout rooms
• Elective areas are key
School Design
• Focus on Learning NOT Teaching
• Classrooms grouping
‐ common area
‐ breakout rooms
• Elective areas are key
• Module furniture and moveable walls
School Design

4/28/2015
16
• Focus on Learning NOT Teaching
• Classrooms grouping
‐ common area
‐ breakout rooms
• Elective areas are key
• Module furniture and moveable walls
• Innovation
School Design
WHY
4/28/2015
17
Culture Trumps Strategy
Powerpoint, Notes, and More Information
VISIT: http://leadered.com/billdaggett
OR SCAN:

4/28/2015
18
Emerging Trends
• Career Ready
Emerging Trends
4/28/2015
19
A declining Support Ratio
A declining Support Ratio• Under 18 ‐‐‐‐‐‐‐‐‐‐‐‐‐‐‐‐‐‐‐‐22%

4/28/2015
20
A declining Support Ratio• Under 18 ‐‐‐‐‐‐‐‐‐‐‐‐‐‐‐‐‐‐‐‐22%
• Over 65 ‐‐‐‐‐‐‐‐‐‐‐‐‐‐‐‐‐‐‐‐‐‐13%
A declining Support Ratio• Under 18 ‐‐‐‐‐‐‐‐‐‐‐‐‐‐‐‐‐‐‐‐22%
• Over 65 ‐‐‐‐‐‐‐‐‐‐‐‐‐‐‐‐‐‐‐‐‐‐13%
• 18‐65 Not Working‐‐‐‐‐‐‐‐19%
4/28/2015
21
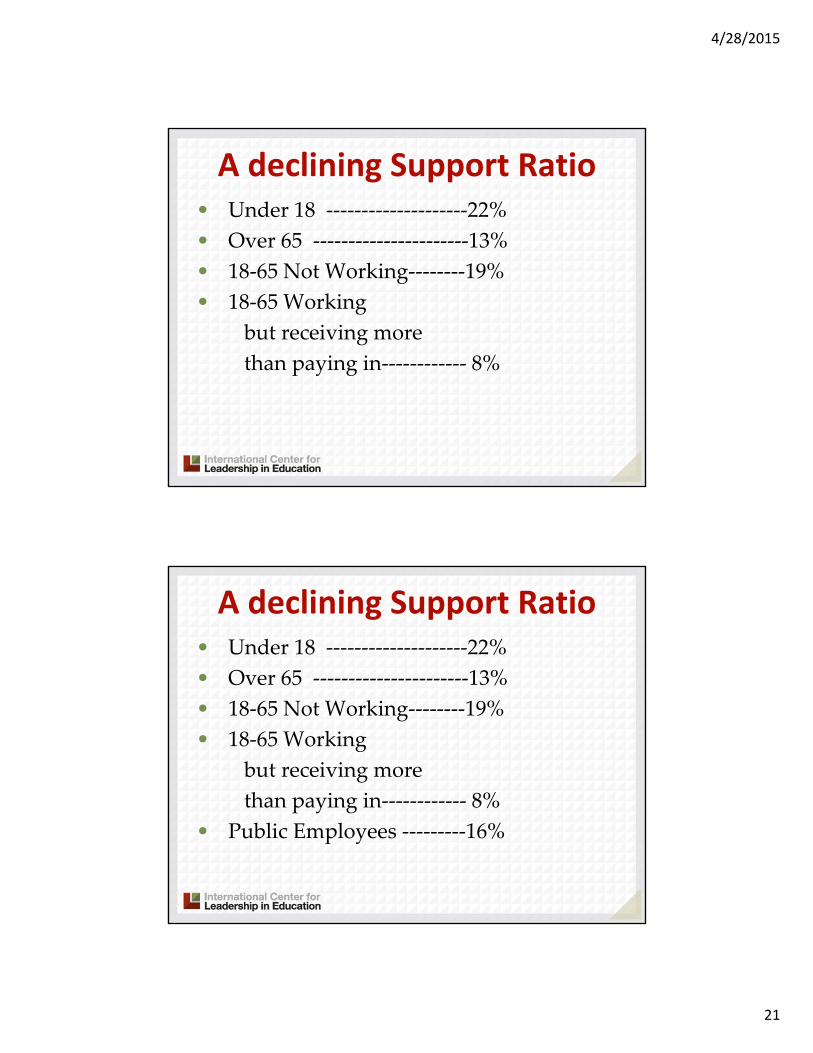
A declining Support Ratio• Under 18 ‐‐‐‐‐‐‐‐‐‐‐‐‐‐‐‐‐‐‐‐22%
• Over 65 ‐‐‐‐‐‐‐‐‐‐‐‐‐‐‐‐‐‐‐‐‐‐13%
• 18‐65 Not Working‐‐‐‐‐‐‐‐19%
• 18‐65 Working
but receiving more
than paying in‐‐‐‐‐‐‐‐‐‐‐‐ 8%
A declining Support Ratio• Under 18 ‐‐‐‐‐‐‐‐‐‐‐‐‐‐‐‐‐‐‐‐22%
• Over 65 ‐‐‐‐‐‐‐‐‐‐‐‐‐‐‐‐‐‐‐‐‐‐13%
• 18‐65 Not Working‐‐‐‐‐‐‐‐19%
• 18‐65 Working
but receiving more
than paying in‐‐‐‐‐‐‐‐‐‐‐‐ 8%
• Public Employees ‐‐‐‐‐‐‐‐‐16%

4/28/2015
22
A declining Support Ratio• Under 18 ‐‐‐‐‐‐‐‐‐‐‐‐‐‐‐‐‐‐‐‐22%
• Over 65 ‐‐‐‐‐‐‐‐‐‐‐‐‐‐‐‐‐‐‐‐‐‐13%
• 18‐65 Not Working‐‐‐‐‐‐‐‐19%
• 18‐65 Working
but receiving more
than paying in‐‐‐‐‐‐‐‐‐‐‐‐ 8%
• Public Employees ‐‐‐‐‐‐‐‐‐16%
TOTAL 78%
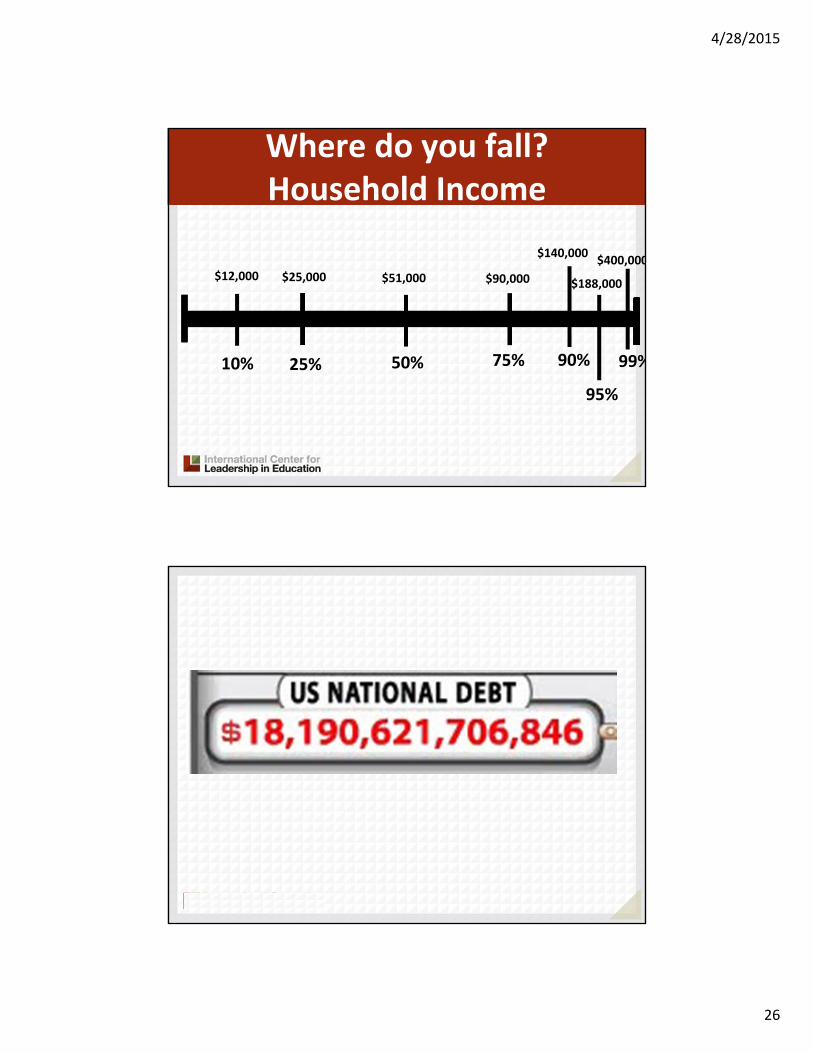
Where do you fall?Household Income

4/28/2015
23
Where do you fall?Household Income
$12,000
10%
Where do you fall?Household Income
$12,000
25%
$25,000
10%

4/28/2015
24
Where do you fall?Household Income
$12,000
25%
$25,000
10%
$51,000
50%
Where do you fall?Household Income
$12,000
25%
$25,000
10%
$51,000
50%
$90,000
75%

4/28/2015
25
Where do you fall?Household Income
$12,000
25%
$25,000
10%
$51,000
50%
$90,000
75% 90%
$140,000
Where do you fall?Household Income
$12,000
25%
$25,000
10%
$51,000
50%
$90,000
75% 90%
$140,000
$188,000
95%
4/28/2015
26
Where do you fall?Household Income
$12,000
25%
$25,000
10%
$51,000
50%
$90,000
75% 90%
$140,000
$188,000
95%
$400,000
99%
4/28/2015
27
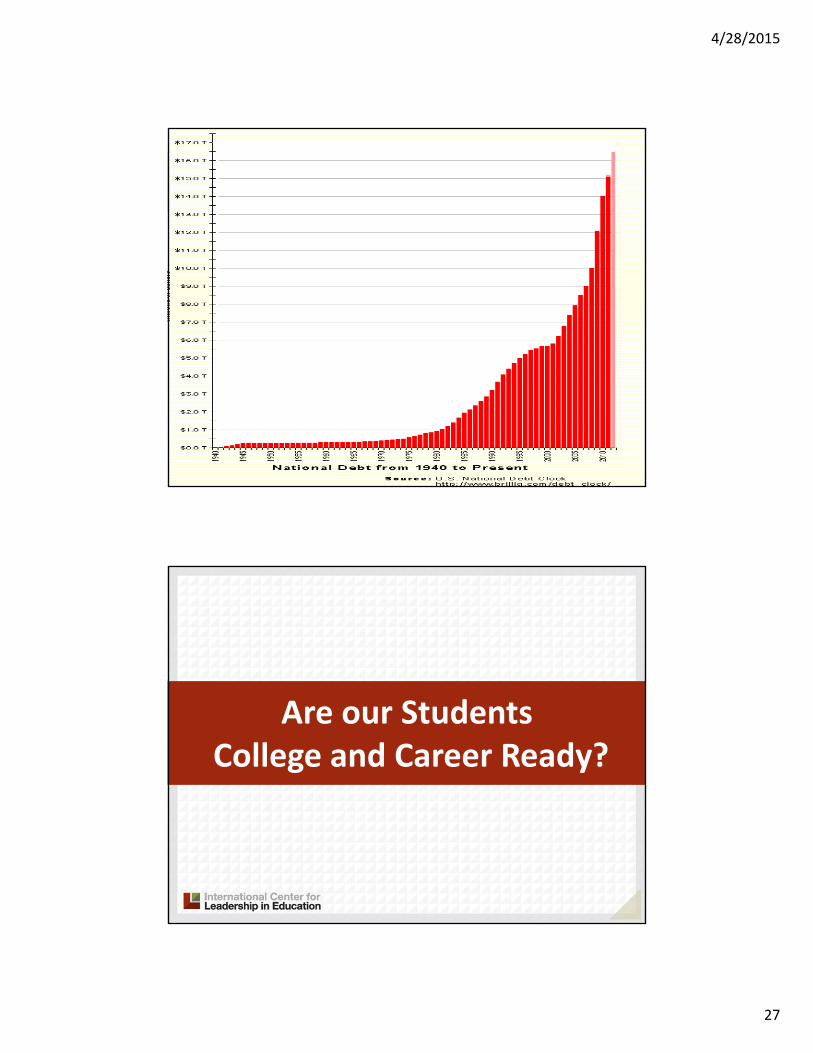
Are our Students College and Career Ready?

4/28/2015
28
College FreshmanWell or Very Well Prepared
• High School Teachers – 89%
• College Instructors – 26%
• Two Year College – 51.7%
• Four Year College – 19.9%
Freshmen NeedingRemediation

4/28/2015
29
• Two‐Year Colleges – 55.5%
• Four‐Year Colleges – 65.2%
College Retention Rate2014
First to Second Year
Source: ACT
• Two‐Year Colleges – 44.5%
• Four‐Year Colleges – 34.8%
College Dropout Rate2014
First to Second Year
Source: ACT
4/28/2015
30
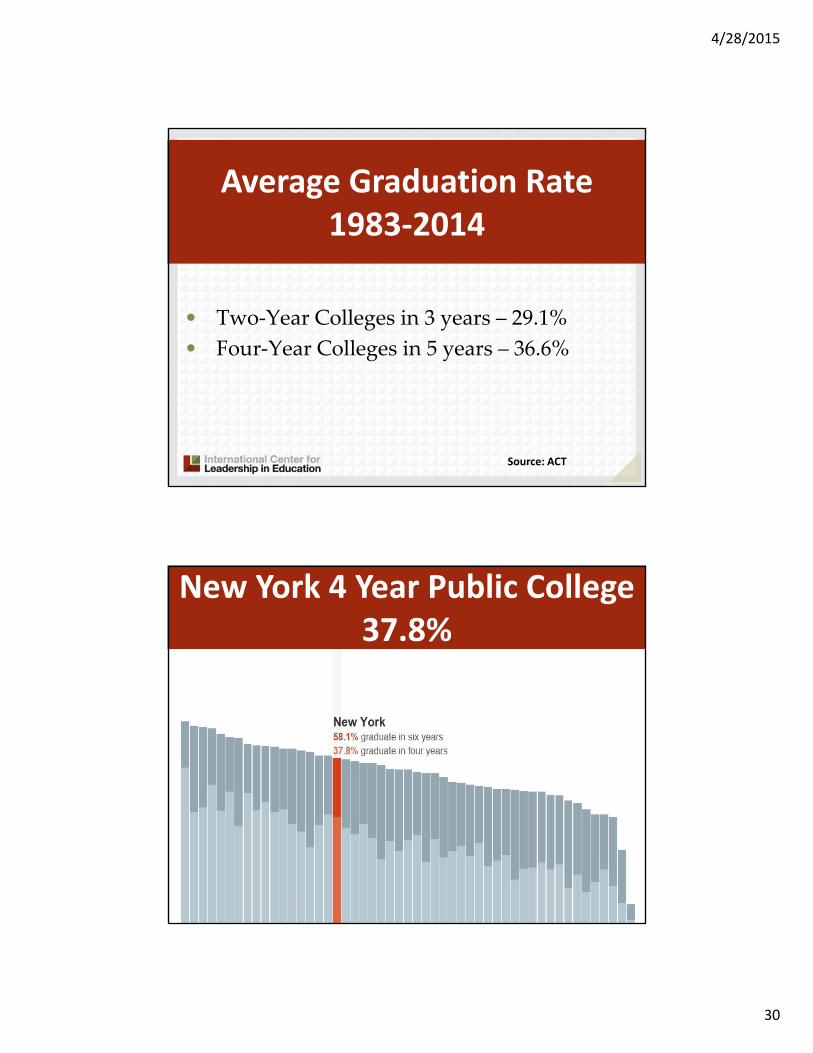
• Two‐Year Colleges in 3 years – 29.1%
• Four‐Year Colleges in 5 years – 36.6%
Average Graduation Rate1983‐2014
Source: ACT
New York 4 Year Public College37.8%

4/28/2015
31
New York 2 Year Public College10.9%
1. Success of Graduates
2. Cost
College Challenges

4/28/2015
32
College tuition rates have increased on average at twice the rate of inflation in the past
17 years
Source: ACT
2013 college grad average loan debt was $35,200
Source: ACT

4/28/2015
33
1984 1994 2004 2014
200%
400%
600%
800%
1,000%
0
1,200%
Percent Change Since January 1984• Food• Consume Price Index• Shelter• Medicare• College
Career Ready

4/28/2015
34
BUT
3.8 million jobs in the
U.S.
remain unfilled
13 Million Americans are Unemployed
Your Major MattersA LOT
4/28/2015
35
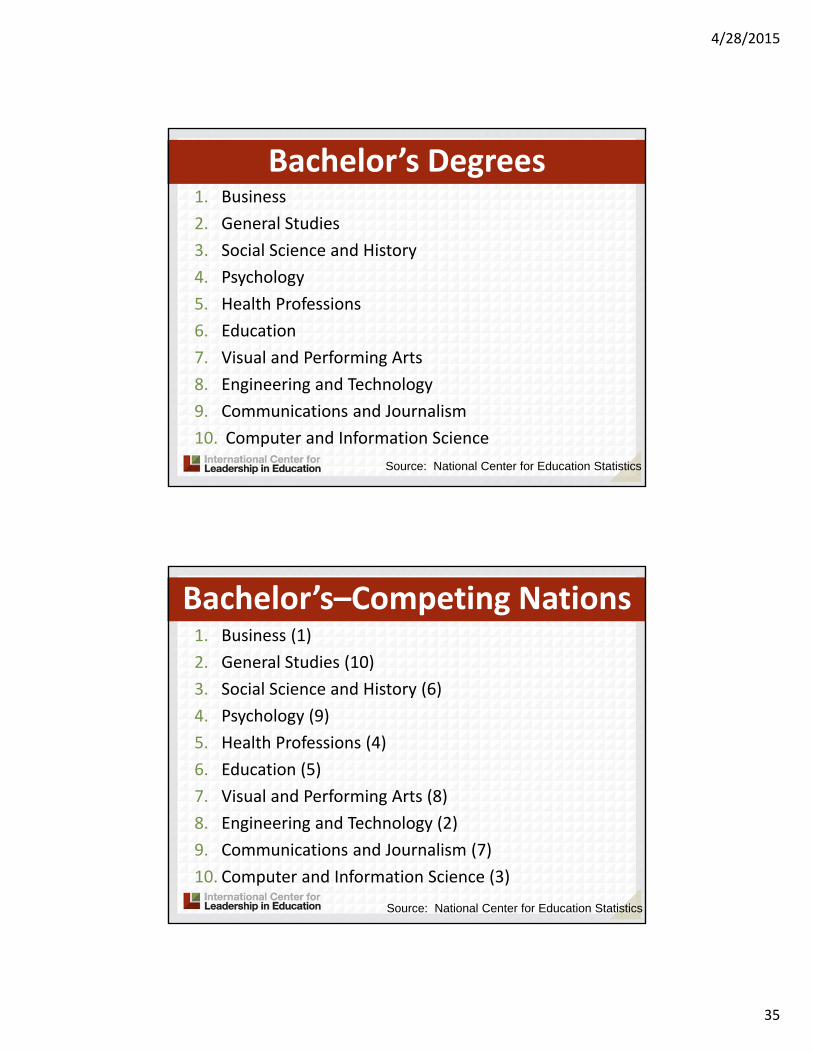
1. Business
2. General Studies
3. Social Science and History
4. Psychology
5. Health Professions
6. Education
7. Visual and Performing Arts
8. Engineering and Technology
9. Communications and Journalism
10. Computer and Information Science
Bachelor’s Degrees
Source: National Center for Education Statistics
1. Business (1)
2. General Studies (10)
3. Social Science and History (6)
4. Psychology (9)
5. Health Professions (4)
6. Education (5)
7. Visual and Performing Arts (8)
8. Engineering and Technology (2)
9. Communications and Journalism (7)
10. Computer and Information Science (3)
Bachelor’s–Competing Nations
Source: National Center for Education Statistics
4/28/2015
36
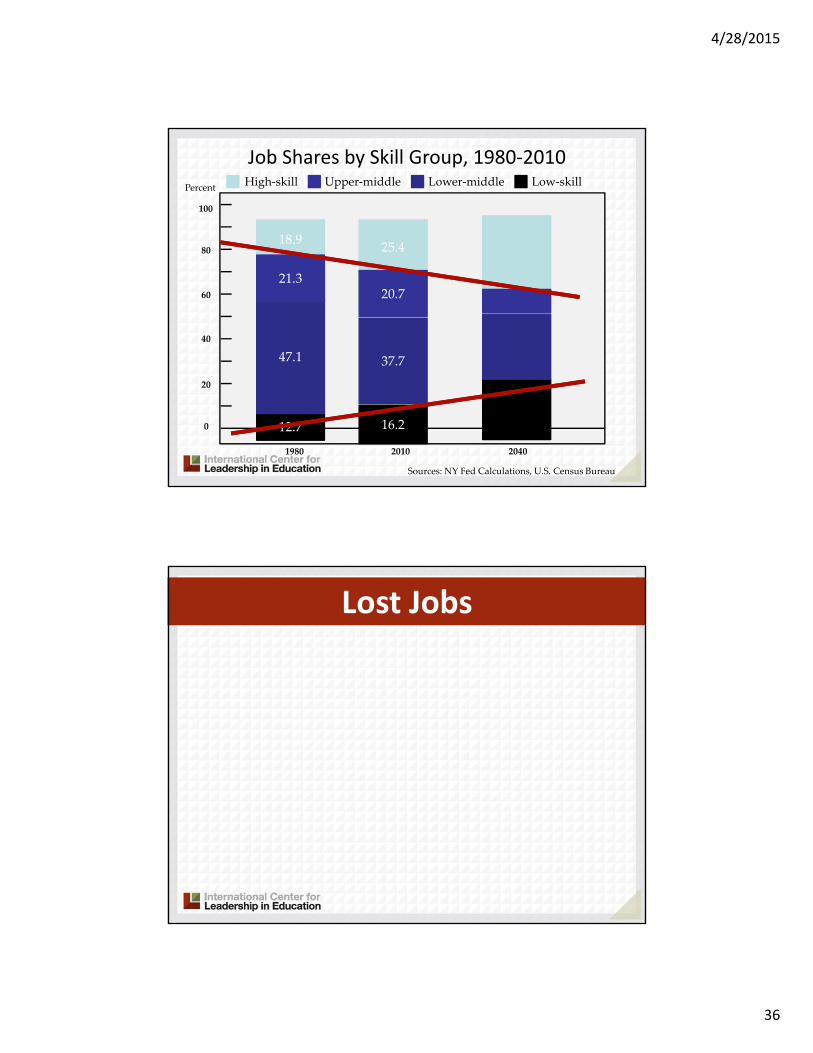
Job Shares by Skill Group, 1980‐2010
Sources: NY Fed Calculations, U.S. Census Bureau
High‐skill Upper‐middle Lower‐middle Low‐skill
100
80
60
40
20
0 12.7
18.9
47.1
21.3
1980
16.2
25.4
37.7
20.7
2010 2040
Percent
Lost Jobs
4/28/2015
37
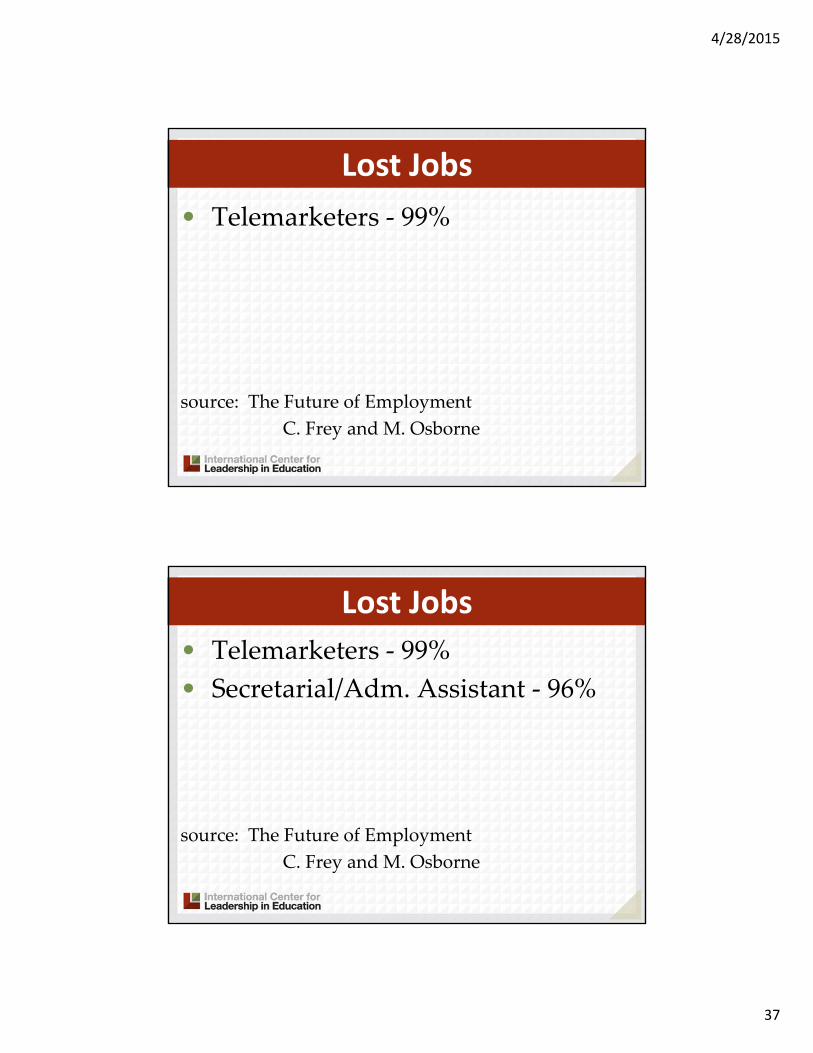
• Telemarketers ‐ 99%
source: The Future of Employment
C. Frey and M. Osborne
Lost Jobs
• Telemarketers ‐ 99%
• Secretarial/Adm. Assistant ‐ 96%
source: The Future of Employment
C. Frey and M. Osborne
Lost Jobs

4/28/2015
38
• Telemarketers ‐ 99%
• Secretarial/Adm. Assistant ‐ 96%
• Accountant/Auditors – 94%
source: The Future of Employment
C. Frey and M. Osborne
Lost Jobs
• Telemarketers ‐ 99%
• Secretarial/Adm. Assistant ‐ 96%
• Accountant/Auditors – 94%
• Technical Writers – 89%
source: The Future of Employment
C. Frey and M. Osborne
Lost Jobs

4/28/2015
39
• Machinists – 65%
source: The Future of Employment
C. Frey and M. Osborne
Lost Jobs
• Machinists – 65%
• Economist – 43%
source: The Future of Employment
C. Frey and M. Osborne
Lost Jobs

4/28/2015
40
• Machinists – 65%
• Economist – 43%
• Health Technologists – 40%
source: The Future of Employment
C. Frey and M. Osborne
Lost Jobs
Job Shares by Skill Group, 1980‐2010
Sources: NY Fed Calculations, U.S. Census Bureau
High‐skill Upper‐middle Lower‐middle Low‐skill
100
80
60
40
20
0 12.7
18.9
47.1
21.3
1980
16.2
25.4
37.7
20.7
2010 2040
Percent
4/28/2015
41
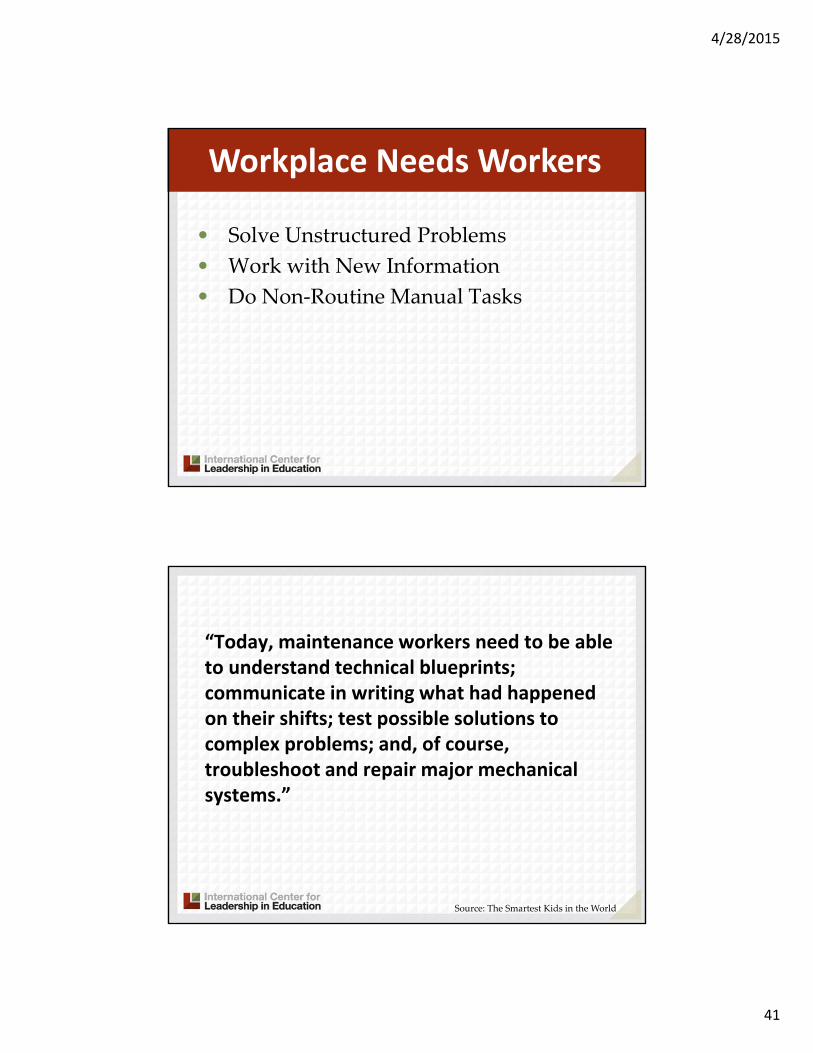
• Solve Unstructured Problems
• Work with New Information
• Do Non‐Routine Manual Tasks
Workplace Needs Workers
“Today, maintenance workers need to be able to understand technical blueprints; communicate in writing what had happened on their shifts; test possible solutions to complex problems; and, of course, troubleshoot and repair major mechanical systems.”
Source: The Smartest Kids in the World

4/28/2015
42
• Career Ready
• Focus on Application
Emerging Trends
1. Knowledge in one discipline
2. Application within discipline
3. Application across disciplines
4. Application to real‐world predictable situations
5. Application to real‐world unpredictable situations
Application Model

4/28/2015
43
1. Awareness
2. Comprehension
3. Application
4. Analysis
5. Synthesis
6. Evaluation
Knowledge Taxonomy
Levels
1 2 3 4 5
Bloom’s
C D
A B
456
321
Application
4/28/2015
44
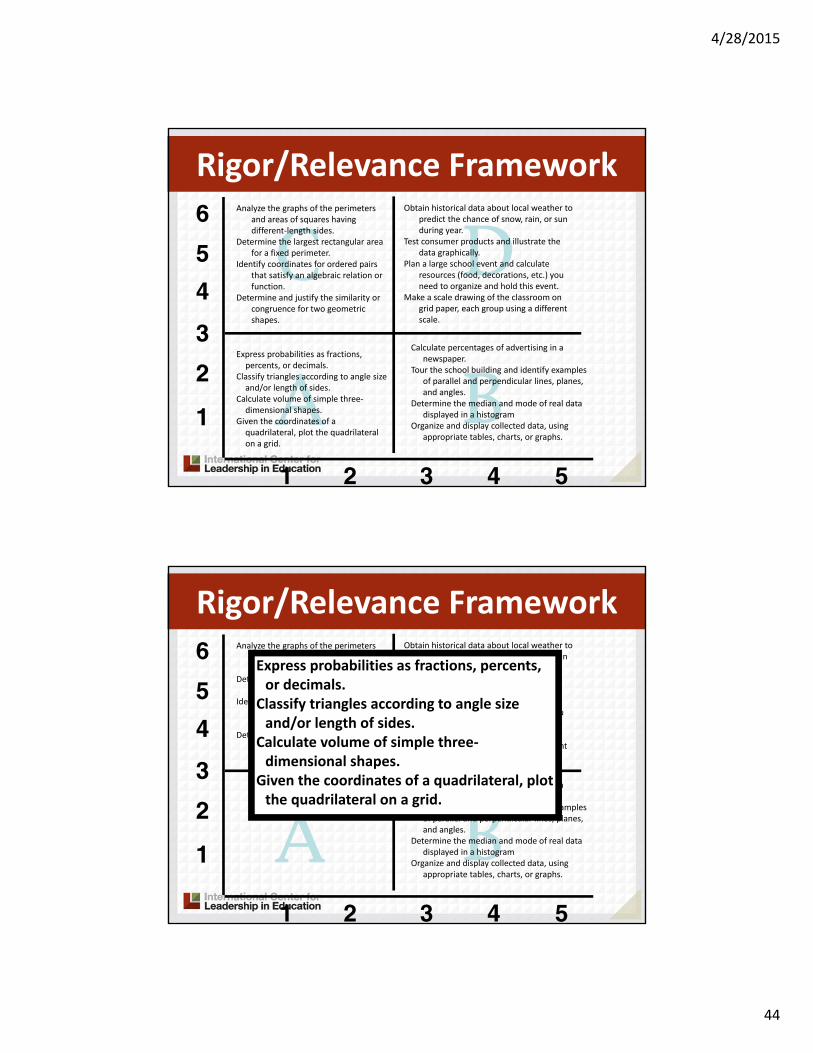
Rigor/Relevance Framework
1
2
3
4
5
6
1 2 3 4 5
A B
DCExpress probabilities as fractions, percents, or decimals.
Classify triangles according to angle size and/or length of sides.
Calculate volume of simple three‐dimensional shapes.
Given the coordinates of a quadrilateral, plot the quadrilateral on a grid.
Analyze the graphs of the perimeters and areas of squares having different‐length sides.
Determine the largest rectangular area for a fixed perimeter.
Identify coordinates for ordered pairs that satisfy an algebraic relation or function.
Determine and justify the similarity or congruence for two geometric shapes.
Obtain historical data about local weather to predict the chance of snow, rain, or sun during year.
Test consumer products and illustrate the data graphically.
Plan a large school event and calculate resources (food, decorations, etc.) you need to organize and hold this event.
Make a scale drawing of the classroom on grid paper, each group using a different scale.
Calculate percentages of advertising in a newspaper.
Tour the school building and identify examples of parallel and perpendicular lines, planes, and angles.
Determine the median and mode of real data displayed in a histogram
Organize and display collected data, using appropriate tables, charts, or graphs.
Rigor/Relevance Framework
1
2
3
4
5
6
1 2 3 4 5
A B
DCAnalyze the graphs of the perimeters
and areas of squares having different‐length sides.
Determine the largest rectangular area for a fixed perimeter.
Identify coordinates for ordered pairs that satisfy an algebraic relation or function.
Determine and justify the similarity or congruence for two geometric shapes.
Obtain historical data about local weather to predict the chance of snow, rain, or sun during year.
Test consumer products and illustrate the data graphically.
Plan a large school event and calculate resources (food, decorations, etc.) you need to organize and hold this event.
Make a scale drawing of the classroom on grid paper, each group using a different scale.
Calculate percentages of advertising in a newspaper.
Tour the school building and identify examples of parallel and perpendicular lines, planes, and angles.
Determine the median and mode of real data displayed in a histogram
Organize and display collected data, using appropriate tables, charts, or graphs.
Express probabilities as fractions, percents, or decimals.
Classify triangles according to angle size and/or length of sides.
Calculate volume of simple three‐dimensional shapes.
Given the coordinates of a quadrilateral, plot the quadrilateral on a grid.
4/28/2015
45
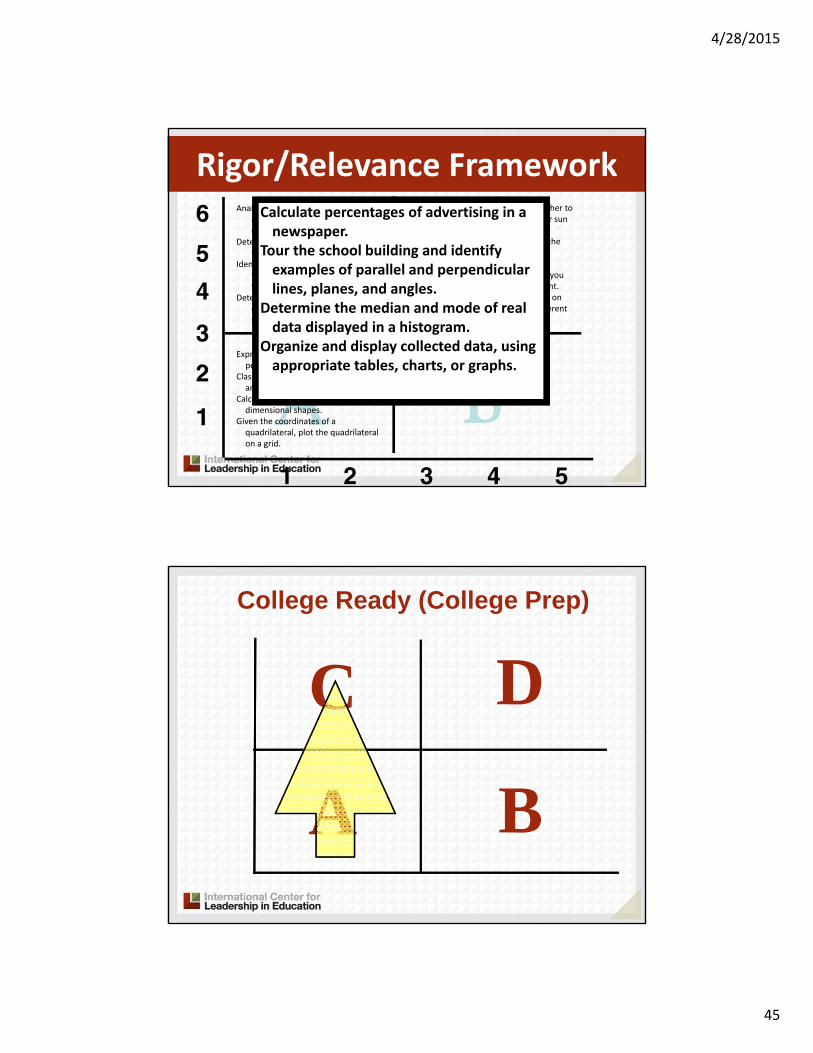
Rigor/Relevance Framework
1
2
3
4
5
6
1 2 3 4 5
A B
DCExpress probabilities as fractions, percents, or decimals.
Classify triangles according to angle size and/or length of sides.
Calculate volume of simple three‐dimensional shapes.
Given the coordinates of a quadrilateral, plot the quadrilateral on a grid.
Analyze the graphs of the perimeters and areas of squares having different‐length sides.
Determine the largest rectangular area for a fixed perimeter.
Identify coordinates for ordered pairs that satisfy an algebraic relation or function.
Determine and justify the similarity or congruence for two geometric shapes.
Obtain historical data about local weather to predict the chance of snow, rain, or sun during year.
Test consumer products and illustrate the data graphically.
Plan a large school event and calculate resources (food, decorations, etc.) you need to organize and hold this event.
Make a scale drawing of the classroom on grid paper, each group using a different scale.
Calculate percentages of advertising in a newspaper.
Tour the school building and identify examples of parallel and perpendicular lines, planes, and angles.
Determine the median and mode of real data displayed in a histogram.
Organize and display collected data, using appropriate tables, charts, or graphs.
A B
DC
College Ready (College Prep)

4/28/2015
46
A B
DC
Job Ready (CTE)
A B
DC
Career Ready

4/28/2015
47
Decision MakingInnovation/Creativity Goal Setting/Results DrivenMulti TaskingWork with others
Quad D – Skills and Knowledge
• Solve Unstructured Problems (Quad D)
• Work with New Information (Quad D)
• Do Non‐Routine Manual Tasks (Quad B)
Work Place Needs

4/28/2015
48
• Career Ready
• Focus on Application
• Digital
Emerging Trends

4/28/2015
49
Powerpoint, Notes, and More Information
VISIT: http://leadered.com/billdaggett
OR SCAN: