sap optimisation and modernisation
TRANSCRIPT

© West Trax International Ltd.
Optimising Value And Alignment
Throughout The SAP Lifecycle
Slide 2 © West Trax International Ltd
About West Trax
Founded in 2003
Headquarters in Germany and UK, subsidiaries Austria and Switzerland.
Provider of SAP KPI measurements, benchmarks and improved usage quality.
Identification of SAP optimisation potential and cost savings including As-Is and To-Be analyses, Cost/Benefit
analyses, implementation strategies and action plans.
Support and optimisation of SAP re-standardisation, modernisation, outsourcing, upgrade and consolidation
projects.
Methodology and benchmark database certified by German CoC.
Over 1,400 analyses completed to date in 15 different sectors.
26 clients certified for West Trax “Best SAP Performance” Quality Award.
Potential savings identified per client approx. €200K to over €1million p.a.
Average ROI (Return on Investment) 1:4 to 1:9
(1€ Investment generates 4 to 9 € in cost savings)

Slide 3 © West Trax International Ltd
Client List Extract

Slide 4 © West Trax International Ltd
Optimisation – What Are We Talking About?
Current optimisation opportunities: -ModernisationBusiness alignmentHarmonisationConsolidation
When developing business cases and project plans for: -Cost reductionProductivity improvementsUpgrades and EHP’sConsolidationSourcing changesDue diligence
Mergers, acquisitions, divestituresFuture positioning (HANA / Cloud)
Slide 5 © West Trax International Ltd
SAP Optimisation Potential
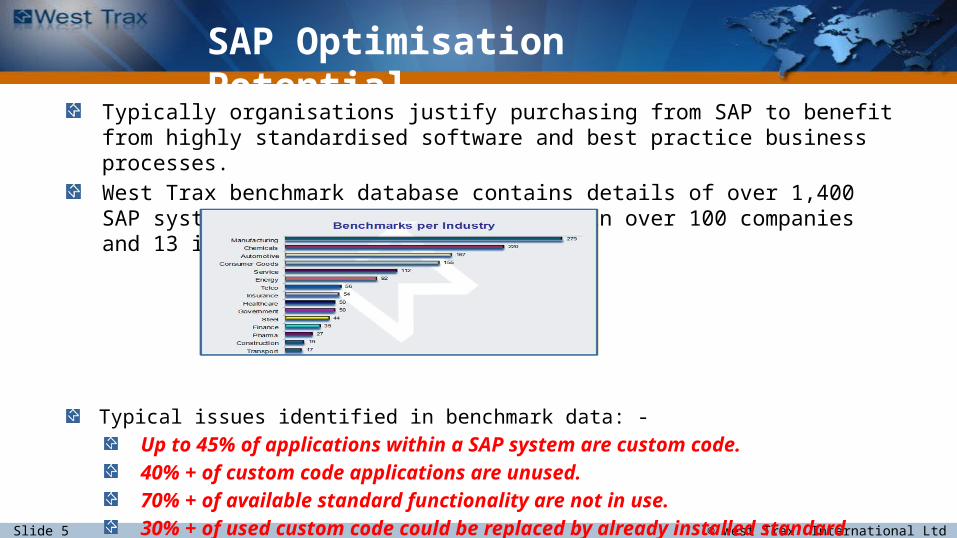
Typically organisations justify purchasing from SAP to benefit from highly standardised software and best practice business processes.
West Trax benchmark database contains details of over 1,400 SAP system analyses completed to date in over 100 companies and 13 industries.
Typical issues identified in benchmark data: -
Up to 45% of applications within a SAP system are custom code.
40% + of custom code applications are unused.
70% + of available standard functionality are not in use.
30% + of used custom code could be replaced by already installed standard functionality.

Slide 6 © West Trax International Ltd
Deployment of Standard Functionality
23
%
20
%
52
%
48
%
22
% 42
%
32
% 54
%
15
% 31
%
0%
20%
40%
60%
80%
100%
Go
ods M
an
ag
em
en
t
Re
ve
nu
e a
nd
Co
st
Co
ntr
ollin
g
Asset
Acco
un
tin
g
Pro
ject
Ma
na
ge
me
nt
Exte
rna
l A
cco
un
tin
g
Pro
cu
rem
ent
Pro
du
ct D
ata
Ma
na
ge
me
nt
Pla
nt M
ain
ten
an
ce
Sa
les a
nd
Dis
trib
utio
n
Cu
sto
me
r S
erv
ice
Deployment of Standard Functionality
Paid Functionality Used Functionality

Slide 7 © West Trax International Ltd
Why Optimise Core ERP Now?
The “Digital future” promises great potential to increase future business value - big data, analytics, BI, mobile etc.
BUTWell optimised, up to date, core ERP will still be the critical bedrock for full integration of new applications and maximisation of S/4HANA ROI.
ANDIn the meantime most current systems have significant potential to deliver business benefits such as valuable short-term quick wins in terms of cost savings, increased productivity and performance improvements.
Waiting To Optimise and Modernise ERP Until A HANA MigrationIs Probably Not The Best Business Option For Most Organisations

Slide 8 © West Trax International Ltd
What about HANA?
Route planner for migration to HANA and fully exploit ROIMinimise customisationMaximise standardisationOptimise business processesInstall EHP7 (pre-req.)UnicodeSuite on HANAExchange extensionsS/4HANA
The Later You Start To Optimise and Modernise ERP Before YourHANA Migration The Bigger The Task
See SAP HANA Cookbook For More Info.

Slide 9 © West Trax International Ltd
Optimisation – How?
Essential to establish a business focused, top down strategy
Baselining – establish the As-Is (Facts – NOT Opinions)Benchmarking – compare with industry peers and best practiceEstablish the potential for improvement and savingsEliminate unused custom codeRe-standardise or optimise used custom codeOptimise business processes
Compare and align with SAP best practice processesIncrease standardisationMinimise use of third party solutions and manual actions
Increase automation within SAP and with data entry / extract solutions

Slide 10 © West Trax International Ltd
Which Decision Making Process To Use?
West Trax Analysis Provides Full Transparency And Enables Fact-based Planning And Decision Making!
???
Sat Nav Or Crystal Ball?

Slide 11 © West Trax International Ltd
Maximise Your SAP ROI With West Trax
Maximise The ROI From Your SAP Assets
Analyse Optimise Realise

Slide 12 © West Trax International Ltd
West Trax Methodology
Automated offline analysis rapidly provides transparency and facts with minimal use of
client’s resources. (Approx. 1 hour per system to provide required data)
West Trax algorithm maps SAP usage data onto 5 level hierarchical Process Models
Available for ERP, CRM, HCM, SCM, Industry Solutions.
ABAP Parser analyses custom code functionality.
Template and rule based roadmap allows comparisons between different SAP systems,
clients or company codes.
KPI Simulation and Calculation Models adjustable to calculate optimisation potential and
project costs.
Results delivered as easy to handle re-usable cockpits.

Slide 13 © West Trax International Ltd
Why is West Trax different?
What does a West Trax Business Process analysis deliver that others do not?
Measurement of the level to which the business is supported by SAP Application Core Processes utilising the available standard transactions.
Identification of core process gaps and use of custom code and non-core applications.
Measurement and comparison of core process usage, gaps and external interfaces between systems, BU’s, countries, company codes etc. to identify inconsistent implementation, customisation and usage.
Comparisons of KPI’s against sector peers and best practice benchmarks. Quantification of potential to optimise and consolidate systems and deliver
additional value. Recommended actions and implementation strategies to optimise the
value derived from core business processes and make major savings.

Slide 14 © West Trax International Ltd
FI CO AC EC TRSAP Modules
…
StandardTransaction
Custom CodeThird Party
Legacy
ProcessesAre cross- functional
Methodology:Usage Data Mapped Onto Business Process Models

Slide 15 © West Trax International Ltd
Detailed Business Process Analysis

Slide 16 © West Trax International Ltd
12 Months Client usage data mapped onto SAP Best Practice Process Model* for Financial Closing * Source: SAP® SE
Percentages show how many of the available programs and transactions have been used per process category (boxes)
Business Process AssessmentExample – Financial Close

Slide 17 © West Trax International Ltd
SAP Financial ClosePotential Savings From Automation
Potential Identified To Reduce Process CostsBy Automating Existing Standard Functionality
Parameters Can Be Adjusted For Individual Requirements
All parameters are conservative and can be adjusted according to client‘s situation.
A re-standardisation
project will identify potential for additional
savings

Slide 18 © West Trax International Ltd
Summary
Based on benchmark data from nearly 1,500 analyses major optimisation opportunities exist in many SAP systems.
Waiting To Optimise and Modernise ERP Until A HANA Migration Is Probably Not The Best Business Option For Most Organisations.
Business cases and project plans need to be based on FACTS.
A West Trax automated off-line analysis rapidly and economically provides objective, independent facts based on actual software configuration and transaction usage within the business processes.
Average project ROI 1:4 - 1:9 (£1 investment generates £4-9 in savings)includes implementation costs.

Slide 19 © West Trax International Ltd
To Find Out More About How West Trax Can Help You Maximise The ROI From Your SAP Optimisation and Modernisation Projects
Or For A Free No Obligation Web Demo
Contact
David LongWest Trax Ltd.
T: +44 (0) 1989 780114M: +44 (0) 7774 808694
E: [email protected]: www.westtrax.com
Next Steps
Slide 20 © West Trax International Ltd
Benchmark Examples Screenshots

Slide 21 © West Trax International Ltd
Degree of Standardisation
70
,7%
65
,6%
61
,2%
59
,4%
58
,5%
55
,8%
55
,4%
55
,0%
54
,8%
53
,4%
51
,4%
51
,0%
50
,7%
48
,2%
46
,7%
44
,5%
95
,5%
92
,5%
83
,6%
70
,6% 8
1,8
%
72
,4% 80
,6%
83
,5%
67
,1%
72
,4%
74
,7%
61
,0%
62
,7%
65
,7%
65
,2%
47
,1%
41
,6%
34
,3%
51
,1%
32
,3%
22
,4% 30
,8%
28
,0% 37
,8%
18
,5%
24
,0%
41
,6%
29
,5%
20
,0% 3
1,5
%
10,0%
20,0%
30,0%
40,0%
50,0%
60,0%
70,0%
80,0%
90,0%
100,0%S
tee
l
Gove
rnm
en
t
Auto
mo
tive
Clien
t
Co
nstr
uctio
n
Te
lecom
mun
ica
tion
Co
nsu
me
r G
ood
s
Ene
rgy
Ma
nufa
ctu
ring
Pha
rma
Tra
nspo
rt
Ch
em
ica
ls
He
alth
ca
re
Fin
ance
Serv
ice
Insu
ran
ce
Degree of Standardisation KPI
Average
Measured Best Practice
Measured Worst Case

Slide 22 © West Trax International Ltd
Unused Standard Potential
66
,0%
67
,6%
67
,7%
68
,4%
69
,9%
73
,8%
75
,5%
78
,7%
80
,4%
83
,5%
84
,2%
84
,3%
84
,4%
84
,8%
86
,6%
88
,1%
52
,6%
40
,3%
40
,3%
61
,5%
52
,3%
40
,3%
69
,2%
66
,8%
68
,8% 77
,2%
67
,1%
72
,7%
75
,6%
79
,7%
82
,7%
75
,7% 85
,7% 94
,1%
81
,8%
87
,1%
92
,9%
91
,0%
93
,7%
97
,2%
89
,2%
93
,9%
91
,8%
97
,4%
90
,1%
96
,9%
10,0%
20,0%
30,0%
40,0%
50,0%
60,0%
70,0%
80,0%
90,0%
100,0%C
lien
t
Pha
rma
Ch
em
ica
ls
Ma
nufa
ctu
ring
Co
nstr
uctio
n
Auto
mo
tive
Ste
el
Co
nsu
me
r G
ood
s
Serv
ice
Te
lecom
mun
ica
tion
He
alth
ca
re
Tra
nspo
rt
Insu
ran
ce
Ene
rgy
Gove
rnm
en
t
Fin
ance
Unused Standard Potential KPI
Average
Measured Best Practice
Measured Worst Case

Slide 23 © West Trax International Ltd
Custom Code
23
,2%
23
,8% 30
,3%
30
,5%
30
,8%
32
,2%
32
,3%
35
,4%
35
,6%
36
,7%
39
,2%
41
,9%
45
,5%
46
,2%
54
,3%
12
,6%
10
,9%
10
,6%
23
,9%
13
,9% 19
,4%
17
,8%
5,1
%
16
,2%
6,9
%
17
,8%
6,5
%
18
,7%
16
,0%
0,0%
10,0%
20,0%
30,0%
40,0%
50,0%
Ph
arm
a
Au
tom
otive
Ch
em
ica
ls
He
alth
ca
re
Tra
nsp
ort
Insu
ran
ce
Co
nstr
uctio
n
Co
nsu
me
r G
oo
ds
Se
rvic
e
Ma
nu
factu
rin
g
Fin
an
ce
Ste
el
Te
leco
mm
un
ica
tio
n
En
erg
y
Clie
nt
Custom Code KPI
Average Measured Best Practice

Slide 24 © West Trax International Ltd
Unused Custom Code
32
,5%
33
,8%
37
,4%
37
,7%
38
,3%
39
,4%
40
,7%
41
,4%
44
,4%
44
,5%
50
,0%
52
,2%
50
,3%
52
,7%
53
,7%
57
,4%
0,0
%
0,0
%
24
,4%
7,7
%
20
,6%
5,3
% 13
,3%
20
,1%
16
,5% 25
,0%
5,9
%
7,7
%
9,7
%
33
,4%
28
,6%
68
,5%
61
,2%
48
,1%
63
,2%
59
,1%
64
,6%
68
,3%
64
,5%
68
,6%
60
,1%
87
,3% 9
9,5
%
98
,8%
77
,3%
95
,7%
0,0%
10,0%
20,0%
30,0%
40,0%
50,0%
60,0%
70,0%
80,0%
90,0%
100,0%C
onsum
er
Goods
Fin
ance
Pharm
a
Serv
ice
Tra
nsport
Auto
motive
Chem
icals
Constr
uction
Insura
nce
Govern
ment
Manufa
ctu
ring
Tele
com
munic
ation
Client
Ste
el
Healthcare
Energ
y
Unused Custom Code KPI
Average
Measured Best Practice
Measured Worst Case

Slide 25 © West Trax International Ltd
Detailed Analysis – Background JobsExample
Not Client!

Slide 26 © West Trax International Ltd
Performance Analysis