salt recovery from waste to energy incineration fly...
TRANSCRIPT

Salt Recovery from Waste to Energy
Incineration Fly Ash A process based on evaporation of brine
Master’s Thesis within the Sustainable Energy Systems programme
GUSTAV STENBERG
Department of Civil and Environmental Engineering
Division of Water Environment Technology
CHALMERS UNIVERSITY OF TECHNOLOGY
Master’s Thesis BOMX02-16-19
Gothenburg, Sweden 2016

MASTER’S THESIS BOMX02-16-19
Salt Recovery from Waste to Energy Incineration
Fly Ash
A process based on evaporation of brine Master’s Thesis within the Sustainable Energy Systems programme
GUSTAV STENBERG
SUPERVISORS
Karin Karlfeldt Fedje
Jale Adawi
Morten Breinholt Jensen
EXAMINER
Ann-Margret Hvitt Strömvall
Department Civil and Environmental Engineering
Division of Water Environment Technology
CHALMERS UNIVERSITY OF TECHNOLOGY
Gothenburg, Sweden 2016
Salt Recovery from Waste to Energy Incineration Fly Ash
A process based on evaporation of brine
Master’s Thesis within the Sustainable Energy Systems programme
GUSTAV STENBERG
© GUSTAV STENBERG, 2016
Examensarbete BOMX02-16-19/Institutionen för bygg- och miljöteknik,
Chalmers Tekniska Högskola 2016
Department of Civil and Environmental Engineering
Division of Water Environment Technology
Chalmers University of Technology
SE-412 96 Gothenburg
Sweden
Telephone: + 46 (0)31-772 1000
Cover:
Flight view of Langøya and NOAH AS process (NOAH, 2016).
Chalmers Reproservice
Gothenburg, Sweden 2016
I
Salt Recovery from Waste to Energy Incineration Fly Ash
A process based on evaporation of brine
Master’s Thesis in the Sustainable Energy Systems programme
GUSTAV STENBERG
Department of Civil and Environmental Engineering
Division of Water Environment Technology
Chalmers University of Technology
ABSTRACT
Incineration is a common way to handle municipal solid waste. The remaining
residues after the incineration can be divided into two groups, bottom ash and fly ash.
The fly ash contains toxic substances such as metal compounds and chlorides and is
therefore usually classified as hazardous waste. An industrial company located in
Norway is handling fly ash in order to minimise the amount of leached toxic
substances. In their process, fly ash is used to neutralize sulfuric acid and thereby
immobilize the toxic substances. The chlorides that are not immobilized through the
process are leached from the fly ash and diverted to the Oslo Fjord.
In this study, it is investigated whether it is possible to extract salts from fly ash in the
industrial process. Ash samples have been extracted from three different positions in
the process and from these samples salt solutions were generated. The salts have been
dried and crystallised by evaporating the water in the brine. These salts have then
been analysed and compared with the regulatory framework for road salt in
Scandinavia. The results differ from the three different samples, but for one sample
with fly ash mixed with sulfuric acid the results are good and the concentrations of
toxic metals are within the limits for road salt in Scandinavia. However, the extracted
salt from the industrial process is a mixture of different salts, mainly CaCl2, NaCl and
KCl. The salts spread on the roads today are mainly NaCl but also CaCl2, MgCl2 are
used, however usually not as mixtures.
To get a working process on a large scale, energy is required to evaporate the water in
the brine. Therefore it is advantageously to place the salt extraction process close to
other industrial activities, which producing waste heat. Different concepts of multiple
effect evaporators have been studied with the purpose to investigate how much
crystallised salt that can be produced. The evaporator concepts have been designed for
two different temperatures on the waste heat. The evaporator using waste heat at the
higher temperature (380°C) is more efficient and can produce around 69 000 tonnes
of crystallised salt annually. This corresponds to 18 % of the total consumption of
road salt in Scandinavia. It is expected that around 100 000 tonnes of salt dissolved in
water can be precipitated from the industrial company in Norway, which means that
69 % of this can be evaporated. When trading the salt it may be an advantage to
separate the salts from each other. There are technologies for separating but this has
not been investigated in this study. The project has great potential and to utilize raw
materials throughout the whole production chain is completely in time when raw
material shortage is a growing problem in society.
Key words: MSW, fly ash, multiple effect evaporation, road salt, NaCl, CaCl2, KCl

II
Saltåtervinning från flygaska genererad vid avfallsförbränning
En process baserad på indunstning av saltlösning
Examensarbete inom masterprogrammet Hållbara Energisystem
GUSTAV STENBERG
Institutionen för Bygg- och Miljöteknik
Avdelningen för Vatten Miljö Teknik
Chalmers Tekniska Högskola
SAMMANFATTNING
Avfallsförbränning är en vanlig metod för avfallshantering. Slutprodukten från
avfallsförbränningen kan delas upp i två delar, bottenaska och flygaska. Flygaskan
innehåller en rad olika giftiga ämnen så som metaller och klorider och klassas således
som farligt avfall. Ett industriföretag i Norge hanterar flygaska med syfte att minimera
urlakning av giftiga substanser. I deras process används flygaska för att stabilisera
svavelsyra genom en process som immobiliserar giftiga substanser. Kloriderna som
inte immobiliseras i denna process urlakas och leds ut i Oslofjorden.
I den här studien har det undersökts huruvida det är möjligt att utvinna salter ur
flygaska från den industriella processen. Askprover har tagits ut ur tre olika punkter i
processen. Ur dessa tre punkter har saltlösningar genererats. Vattnet ur dessa
saltlösningar har avlägsnats genom indunstning under upphettning. Dessa salter har
sedan analyserats och resultatet har jämförts med de krav som ställs på vägsalt idag.
Resultaten är spridda för de tre olika provpunkterna men för aska som är blandat med
svavelsyra är resultaten bra och mängden giftiga substanser ligger med marginal
under de krav som ställs på vägsalt i Skandinavien idag. Salterna utvunna från
processen innehåller en rad olika salter, då främst CaCl2, NaCl och KCl. Det salt som
sprids på vägar idag är främst NaCl men även MgCl2 och CaCl2 används men då
vanligtvis inte som en mix.
För att få en fungerande process i större skala krävs energi för att indunsta denna
saltlösning. Därför är det fördelaktigt att placera denna saltutvinningsprocess nära en
annan industriell verksamhet som alstrar spillvärme. Två olika multieffektindunstare
har designats med syfte att undersöka hur stora mängder torrt salt som kan
produceras. Indunstarna har designats utifrån två olika rökgastemperaturer.
Indunstaren som använder spillvärme vid den högre temperaturen (380°C) är mest
effektiv och kan producera 69 000 ton torrt salt per år. Detta motsvarar 18 % av den
årliga konsumtionen av vägsalt i Skandinavien. Cirka 100 000 ton salt löst i vatten
förväntas kunna utvinnas ifrån industrin i Norge vilket betyder att 69 % kan indunstas
till salt i kristallform. Vid försäljning av salterna kan det finnas en fördel att separera
de olika salterna från varandra. Det finns tekniker för separering men detta har inte
undersökts i denna studie. Projektet har stor potential och att utnyttja råvaror genom
hela produktionskedjan ligger helt i tiden då råvarubristen blir ett allt större problem i
samhället.
Nyckelord: Avfallsförbränning, flygaska, multi-effekt förångare, vägsalt, NaCl,
CaCl2, KCl
III
Contents
ABSTRACT I
SAMMANFATTNING II
CONTENTS III
PREFACE V
NOTATIONS VI
1 INTRODUCTION 1
1.1 Background 1
1.2 Aim and objectives 3
1.3 Limitations of scope 3
2 LITERATURE STUDY 4
2.1 General facts about road salt 4
2.2 General about MSWI and the produced fly ash 7
2.3 General about NOAH AS and their process today 11
2.4 Crystallisation technologies 12
3 METHOD 15
3.1 Regulations for road salt in Scandinavia 15
3.2 Extraction of salt from the process on Langøya 15
3.3 Brine evaporation 17
4 REGULATIONS FOR ROAD SALT IN SCANDINAVIA 21
4.1 European standardisation 21 4.1.1 Sodium chloride 22 4.1.2 Magnesium chloride 23 4.1.3 Calcium chloride 24 4.1.4 Salt blends 25
4.2 Requirements for road salt in Norway 25
4.3 Requirements for road salt in Sweden 26
4.4 Requirements for road salt in Denmark 27
5 RESULTS AND DISCUSSION 29
5.1 Salt composition 29
5.2 Evaporation and drying process 34
6 CONCLUSIONS 40

IV
7 FURTHER CHALLENGES 41
8 LIST OF LITERATURE 43
9 APPENDIX A – FLOW SHEET 46
10 APPENDIX B – RAW DATA 47
11 APPENDIX C – HEAT BALANCES FOR LOW TEMPERATURE
PROCESS 48
12 APPENDIX D – HEAT BALANCES FOR HIGH TEMPERATURE
PROCESS 51

V
Preface
This master thesis was performed during the spring term of 2016 together with the
Norwegian company NOAH AS, within the Sustainable Energy System programme at
Chalmers University of Technology. At first, I would like to say many thanks to
NOAH AS and especially Jale Adawi and Morten Breinholt Jensen, who have helped
and supported me through this thesis. I am also thankful for the help from my
supervisor, Karin Karlfeldt Fedje, Division of Water Environment Technology at
Chalmers University of Technology. She has support me throughout the whole project
with technical issues as well as practical tips for the writing of the report. I also want
to say thank you to my examiner Ann-Margret Hvitt Strömvall, Division of Water
Environment Technology at Chalmers University of Technology, for her help during
this thesis.
VI
Notations
BFB Bubbling fluidised bed
BFBC Bubbling fluidised bed combustor
CaCl2 Calcium chloride
CEN European Committee for Standardisation
CFB Circulated fluidised bed
CFBC Circulated fluidised bed combustor
DOC Dissolved organic carbons
FBC Fluidised bed combustion
HRSG Heat recovery steam generator
ICP Inductively coupled plasma
KCl Potassium chloride
LS-value Liquid to solid value
MBC Mass burn combustor
MgCl2 Magnesium chloride
MSW Municipal solid waste
MSWI Municipal solid waste incineration
NaCl Sodium chloride
NOx Nitrogen oxides
SOx Sulphate oxides
THC Total hydrocarbons
TOC Total organic carbon
1
1 Introduction
1.1 Background
A growing problem in society is the increased production of waste from households
and industry. In 2013 the total amount of waste generated from households in Sweden
was around 4 450 000. This equals to 461 kg/person annually. Of all generated waste
from households, 33 % was recycled, 50 % was used for energy production, 15 % was
used for biologic recovering and the remaining part was used for landfill. (Westin,
2013).
A common way to handle municipal solid waste (MSW) is to use it for production of
energy. The residues from incineration can be divided into two groups, fly ash and
bottom ash. Bottom ash is the ash that falls down through the bottom of the
combustion furnace. After total combustion the metal parts are removed from the
bottom ash and the remaining ash may be stored and used as construction material.
Fly ash is usually classified as hazardous waste. The reason is that the amount of
heavy metals, mainly zinc and lead, is above the limits. The limits are 2 500 mg/kg for
both lead and zinc. Also the high pH value and the high level of chlorides make the
fly ash classified as hazardous waste (Marit Lægreid , 2014).
The Norwegian company NOAH AS is today handling around 270 000 tonnes of fly
ash from industrial and municipal solid waste incineration annually. Most of the fly
ash is derived from Scandinavia. Today all of this fly ash handling takes place on the
island Langøya, in the township of Re in Norway. The 270 000 tonnes of fly ash
containing lime has alkaline properties and is used to neutralize sulfuric acid from the
Norwegian company Kronos Titan, which is producing titanium dioxide. Around
200 000 ton of sulfuric acid is annually neutralized by mixing it with the fly ash.
When the fly ash and sulfuric acid are mixed, solid gypsum is created. This gypsum is
also binds heavy metals and prevents them from being leached out into the Oslo
Fjord. This remaining gypsum is recovered on Langøya. However, the remaining
slurry is containing salts leached from the fly ash. This salt slurry, called brine, is
pumped through a water treatment plant including a sand- and carbon filter, with the
aim to remove remaining particles and dissolved organic carbons (DOC). The brine is
today diverted into the Oslo Fjord. Continuous laboratory samples are made by
NOAH AS to ensure the right pH value and particle content. Every year 600 000 –
800 000 m3 of treated water is diverted into the Oslo Fjord (Breinholt Jensen, 2016).
The facility on the island Langøya is expected to be fully utilized within a few years
and NOAH AS is looking for a new place to recover sulfuric acid with fly ash. One
possible proposal is to establish a new facility in Brevik close to Oslo. NOAH AS
wants to increase the level of recycled substances from their process. For the new
facility the possibility to recover the salts in the water slurry instead of wasting it into
the Oslo Fjord is of great interest. If it is possible to recover the salts, it can eventually
be used as road salt. This could be both economically profitable and have a positive
influence on the environment.
Norcem AS is a cement factory in Brevik, which produces cement, but also waste heat
that could eventually be used to evaporate the water from the brine in NOAH AS’s
further facility. If it is possible to evaporate all water and produce salt in crystallised
form the transportation costs will be lower.

2
Road salt is used in the whole Scandinavia on the roads to remove snow and ice
(Wikström, 2016). It can also be used preventively before slippery roads occur. Salt is
today the most common alternative to avoid ice and snow on the roads. Sand can only
replace salt on low traffic roads. There are other substances such as calcium
magnesium acetate, that can be used with same results as salt but the cost is too high
today (Trafikverket, 2015). With NaCl, that is the most common de-icing agent, it is
possible to melt snow down to -18°C but in most cases the recommendation in
Scandinavia is to use salts on roads down to -6°C. Colder than this requires too much
salts (Trafikverket, 2015). By this reason road salt is unusual in the northern part of
Scandinavian (Wikström, 2016).
The salt consumption is varying from year to year depending on the climate. The total
consumption of road salt in Scandinavia the winter 2013/14 was 379 000 tonnes. The
annual consumption of road salt for each country is presented in Figure 1 (Freddy
Knudsen, 2014).
Figure 1 Annually consumption of road salt in Scandinavia
Salt is produced by evaporation of sea water, by salt mining, as a by-product or by a
process called vacuum salt. Sea salt is mainly produced in warmer countries where the
water is evaporated by the sun in pounds. Vacuum salt is the name of a process where
water is injected into salt deposits. This process is used when the deposit is deep in the
ground, up to three thousand meters deep, and ordinary salt mining cannot be used.
Water is pumped into drill holes, the crystallised salt is dissolved and resulting brine
can then be recovered. To produce salt from fly ash is an example of salt produced as
by-product. The road salt is today mainly imported from Germany. Most of the road
salt is transported dry to minimize the transportation costs. Salt used as a de-icing
agent on roads is mainly NaCl originating from salt mining but a small part is also
from evaporated salt water and vacuum salt (Eide, 2016).
0
50000
100000
150000
200000
250000
300000
2008/09 2009/10 2010/11 2011/12 2012/13 2013/14
Co
nsu
mti
on
of
road
sal
t [t
on
ne
s]
Winter season
Sweden
Denmark
Norway
3
1.2 Aim and objectives
The aim of this study is to investigate the possibility to recover salts from fly ash. This
study was performed for fly ash handled at NOAH AS´s process on Langøya in
Norway. The possibility to recover salts from the ash can have an environmental- and
economic profit and is therefore of great interest. More detailed information about the
composition of the brines will be presented and compared with the regulations for
road salt in Scandinavia. Methods to evaporate the water from the brine are also of
interest.
Scientific questions:
What is the regulatory framework for road salts used in Scandinavia today?
What is the composition of different salts in the extracted brine from the
process on Langøya?
How high is the total concentration of salts in the brine?
What kind of different toxic substances such as toxic metals are present in the
salt and in what quantities?
Is it possible to use the waste energy from an industrial process to crystallise
the salts in the brine? How much energy is required?
Does the salt extracted from Langøya reach the regulatory framework that
exists in Scandinavia?
1.3 Limitations of scope
Methods to separate different salts from each other will be briefly discussed
but not analysed in depth.
Methods for removal of eventually toxic substances from the salt will not be
discussed.
The regulatory framework for road salt usage will only be investigated for
Scandinavia.
Economic calculations for the salt production in large scale will not be
investigated.
4
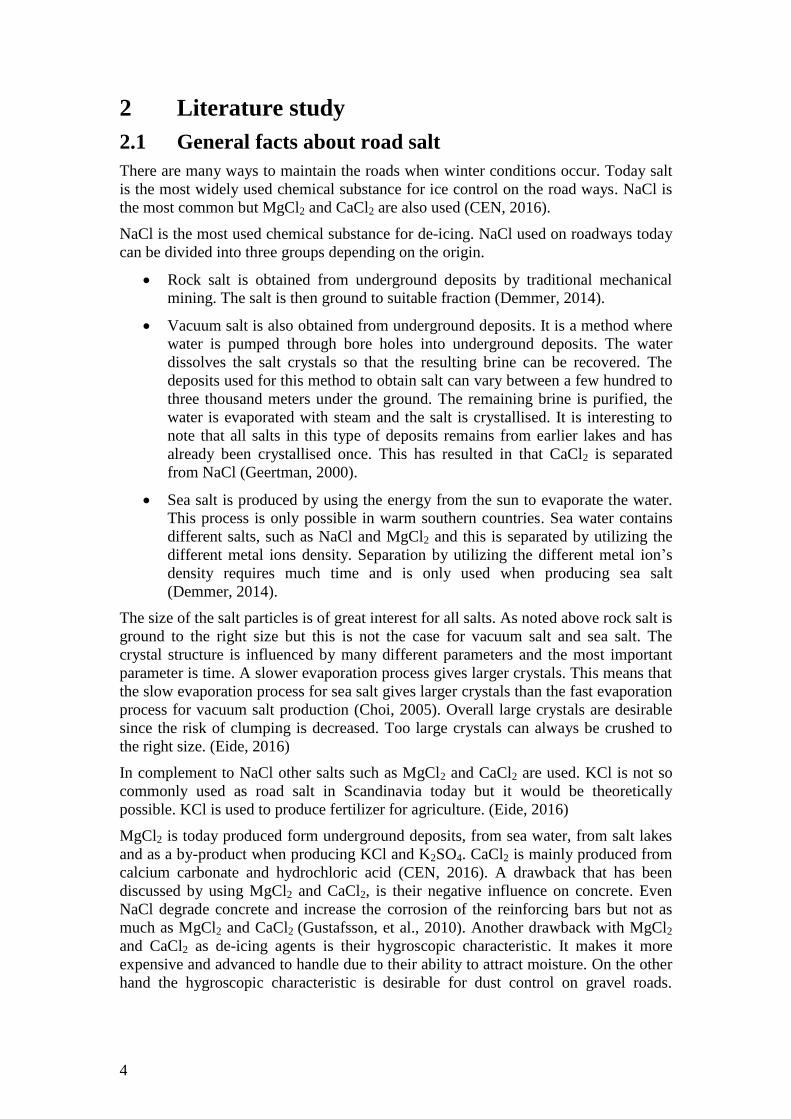
2 Literature study
2.1 General facts about road salt
There are many ways to maintain the roads when winter conditions occur. Today salt
is the most widely used chemical substance for ice control on the road ways. NaCl is
the most common but MgCl2 and CaCl2 are also used (CEN, 2016).
NaCl is the most used chemical substance for de-icing. NaCl used on roadways today
can be divided into three groups depending on the origin.
Rock salt is obtained from underground deposits by traditional mechanical
mining. The salt is then ground to suitable fraction (Demmer, 2014).
Vacuum salt is also obtained from underground deposits. It is a method where
water is pumped through bore holes into underground deposits. The water
dissolves the salt crystals so that the resulting brine can be recovered. The
deposits used for this method to obtain salt can vary between a few hundred to
three thousand meters under the ground. The remaining brine is purified, the
water is evaporated with steam and the salt is crystallised. It is interesting to
note that all salts in this type of deposits remains from earlier lakes and has
already been crystallised once. This has resulted in that CaCl2 is separated
from NaCl (Geertman, 2000).
Sea salt is produced by using the energy from the sun to evaporate the water.
This process is only possible in warm southern countries. Sea water contains
different salts, such as NaCl and MgCl2 and this is separated by utilizing the
different metal ions density. Separation by utilizing the different metal ion’s
density requires much time and is only used when producing sea salt
(Demmer, 2014).
The size of the salt particles is of great interest for all salts. As noted above rock salt is
ground to the right size but this is not the case for vacuum salt and sea salt. The
crystal structure is influenced by many different parameters and the most important
parameter is time. A slower evaporation process gives larger crystals. This means that
the slow evaporation process for sea salt gives larger crystals than the fast evaporation
process for vacuum salt production (Choi, 2005). Overall large crystals are desirable
since the risk of clumping is decreased. Too large crystals can always be crushed to
the right size. (Eide, 2016)
In complement to NaCl other salts such as MgCl2 and CaCl2 are used. KCl is not so
commonly used as road salt in Scandinavia today but it would be theoretically
possible. KCl is used to produce fertilizer for agriculture. (Eide, 2016)
MgCl2 is today produced form underground deposits, from sea water, from salt lakes
and as a by-product when producing KCl and K2SO4. CaCl2 is mainly produced from
calcium carbonate and hydrochloric acid (CEN, 2016). A drawback that has been
discussed by using MgCl2 and CaCl2, is their negative influence on concrete. Even
NaCl degrade concrete and increase the corrosion of the reinforcing bars but not as
much as MgCl2 and CaCl2 (Gustafsson, et al., 2010). Another drawback with MgCl2
and CaCl2 as de-icing agents is their hygroscopic characteristic. It makes it more
expensive and advanced to handle due to their ability to attract moisture. On the other
hand the hygroscopic characteristic is desirable for dust control on gravel roads.
5
Therefore MgCl2 and CaCl2 are spread on gravel roads to hold dust down (Vegvesen,
2014).
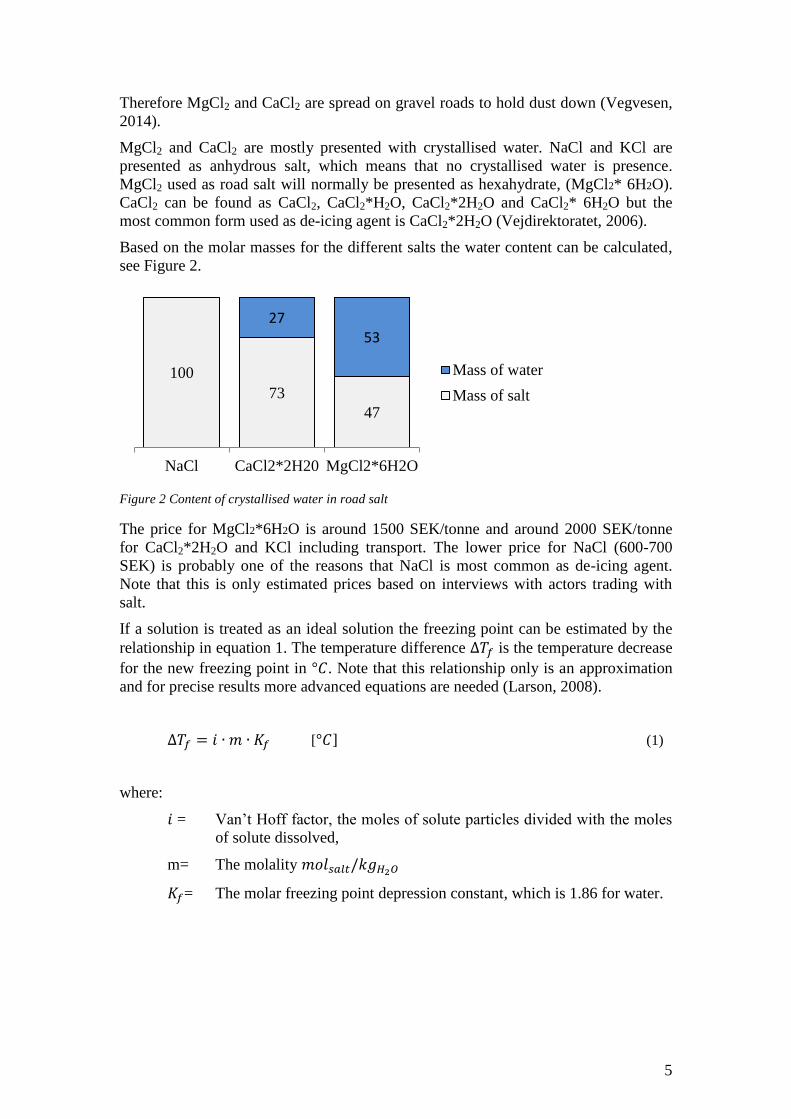
MgCl2 and CaCl2 are mostly presented with crystallised water. NaCl and KCl are
presented as anhydrous salt, which means that no crystallised water is presence.
MgCl2 used as road salt will normally be presented as hexahydrate, (MgCl2* 6H2O).
CaCl2 can be found as CaCl2, CaCl2*H2O, CaCl2*2H2O and CaCl2* 6H2O but the
most common form used as de-icing agent is CaCl2*2H2O (Vejdirektoratet, 2006).
Based on the molar masses for the different salts the water content can be calculated,
see Figure 2.
Figure 2 Content of crystallised water in road salt
The price for MgCl2*6H2O is around 1500 SEK/tonne and around 2000 SEK/tonne
for CaCl2*2H2O and KCl including transport. The lower price for NaCl (600-700
SEK) is probably one of the reasons that NaCl is most common as de-icing agent.
Note that this is only estimated prices based on interviews with actors trading with
salt.
If a solution is treated as an ideal solution the freezing point can be estimated by the
relationship in equation 1. The temperature difference ∆𝑇𝑓 is the temperature decrease
for the new freezing point in °𝐶. Note that this relationship only is an approximation
and for precise results more advanced equations are needed (Larson, 2008).
∆𝑇𝑓 = 𝑖 ∙ 𝑚 ∙ 𝐾𝑓 [°𝐶] (1)
where:
𝑖 = Van’t Hoff factor, the moles of solute particles divided with the moles
of solute dissolved,
m= The molality 𝑚𝑜𝑙𝑠𝑎𝑙𝑡/𝑘𝑔𝐻2𝑂
𝐾𝑓= The molar freezing point depression constant, which is 1.86 for water.
100
73
47
27 53
NaCl CaCl2*2H20 MgCl2*6H2O
Mass of water
Mass of salt
6
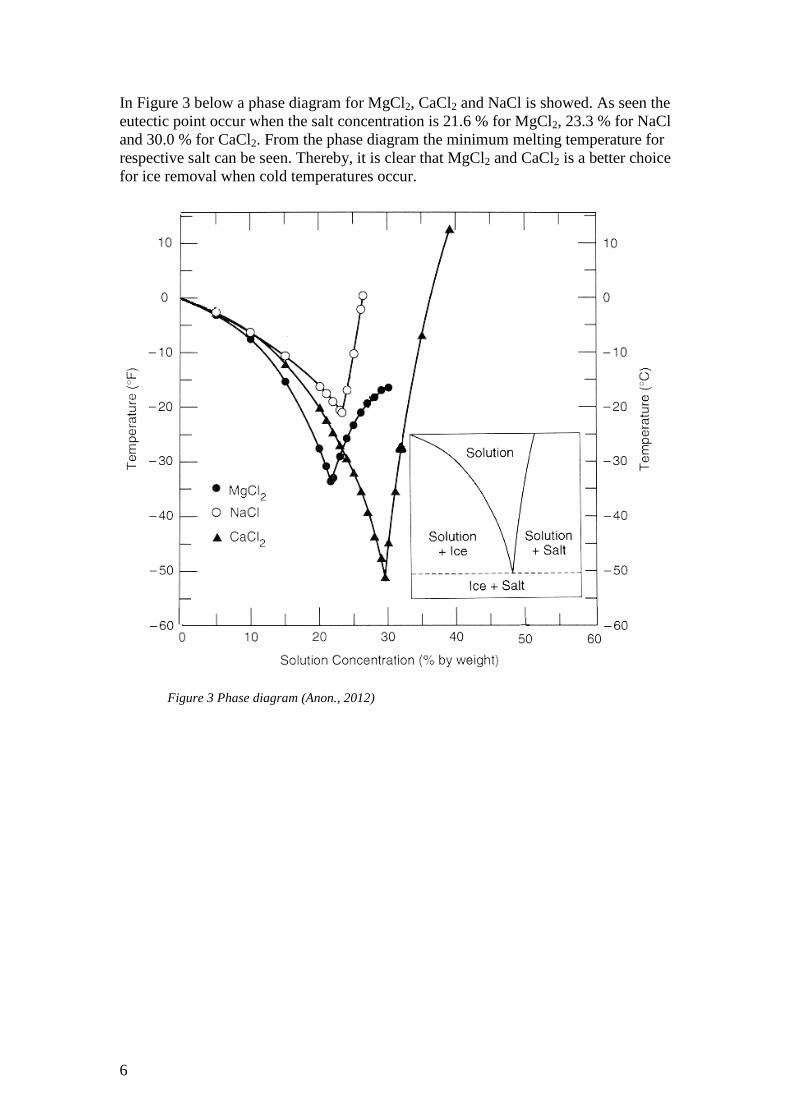
In Figure 3 below a phase diagram for MgCl2, CaCl2 and NaCl is showed. As seen the
eutectic point occur when the salt concentration is 21.6 % for MgCl2, 23.3 % for NaCl
and 30.0 % for CaCl2. From the phase diagram the minimum melting temperature for
respective salt can be seen. Thereby, it is clear that MgCl2 and CaCl2 is a better choice
for ice removal when cold temperatures occur.
Figure 3 Phase diagram (Anon., 2012)
7
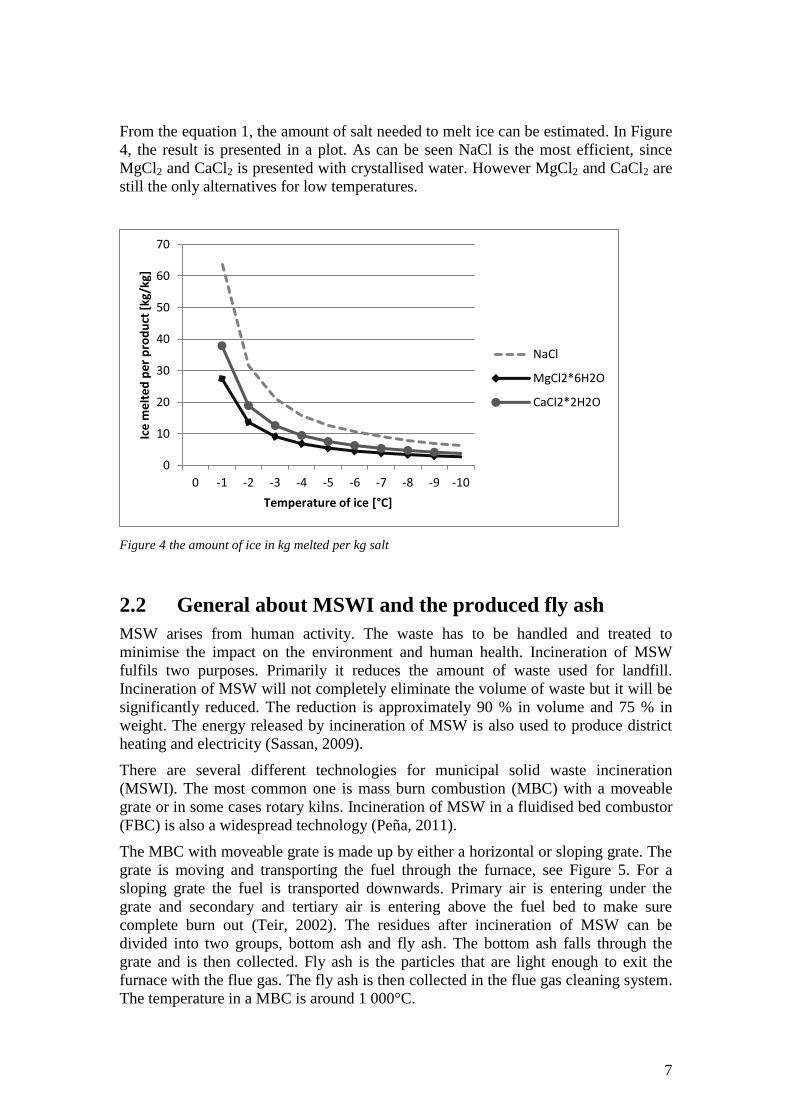
From the equation 1, the amount of salt needed to melt ice can be estimated. In Figure
4, the result is presented in a plot. As can be seen NaCl is the most efficient, since
MgCl2 and CaCl2 is presented with crystallised water. However MgCl2 and CaCl2 are
still the only alternatives for low temperatures.
Figure 4 the amount of ice in kg melted per kg salt
2.2 General about MSWI and the produced fly ash
MSW arises from human activity. The waste has to be handled and treated to
minimise the impact on the environment and human health. Incineration of MSW
fulfils two purposes. Primarily it reduces the amount of waste used for landfill.
Incineration of MSW will not completely eliminate the volume of waste but it will be
significantly reduced. The reduction is approximately 90 % in volume and 75 % in
weight. The energy released by incineration of MSW is also used to produce district
heating and electricity (Sassan, 2009).
There are several different technologies for municipal solid waste incineration
(MSWI). The most common one is mass burn combustion (MBC) with a moveable
grate or in some cases rotary kilns. Incineration of MSW in a fluidised bed combustor
(FBC) is also a widespread technology (Peña, 2011).
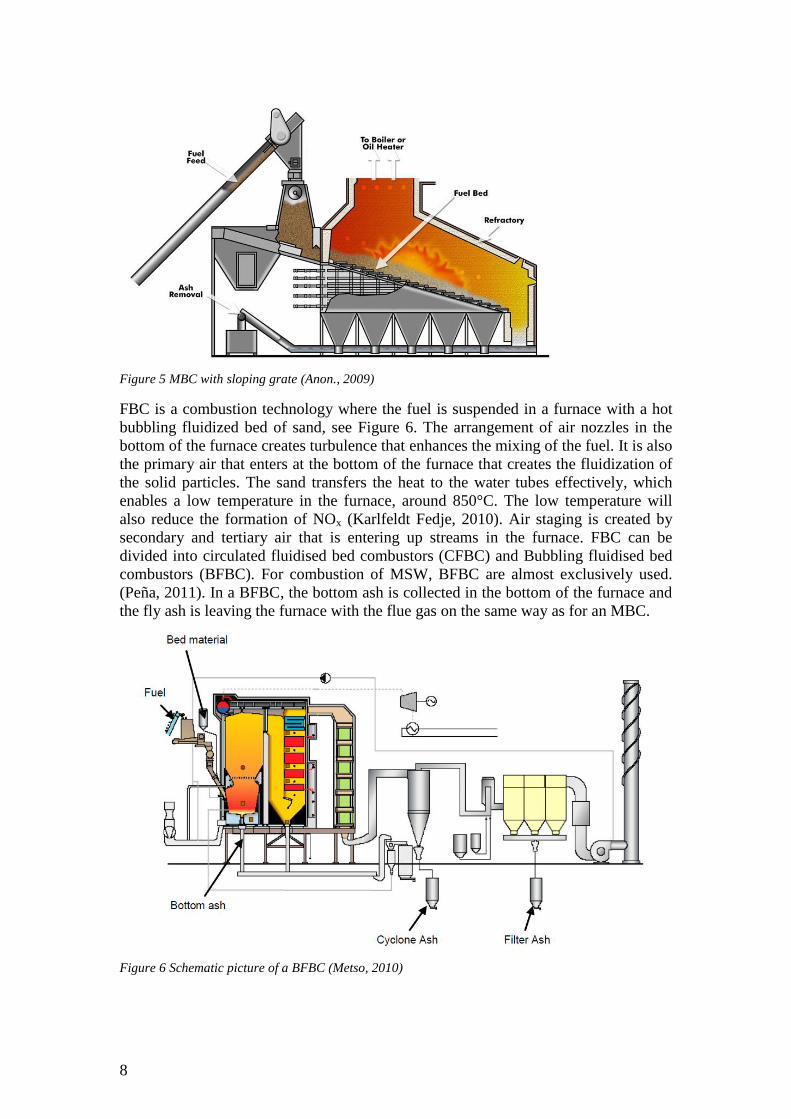
The MBC with moveable grate is made up by either a horizontal or sloping grate. The
grate is moving and transporting the fuel through the furnace, see Figure 5. For a
sloping grate the fuel is transported downwards. Primary air is entering under the
grate and secondary and tertiary air is entering above the fuel bed to make sure
complete burn out (Teir, 2002). The residues after incineration of MSW can be
divided into two groups, bottom ash and fly ash. The bottom ash falls through the
grate and is then collected. Fly ash is the particles that are light enough to exit the
furnace with the flue gas. The fly ash is then collected in the flue gas cleaning system.
The temperature in a MBC is around 1 000°C.
0
10
20
30
40
50
60
70
0 -1 -2 -3 -4 -5 -6 -7 -8 -9 -10
Ice
me
lte
d p
er
pro
du
ct [
kg/k
g]
Temperature of ice [°C]
NaCl
MgCl2*6H2O
CaCl2*2H2O
8
Figure 5 MBC with sloping grate (Anon., 2009)
FBC is a combustion technology where the fuel is suspended in a furnace with a hot
bubbling fluidized bed of sand, see Figure 6. The arrangement of air nozzles in the
bottom of the furnace creates turbulence that enhances the mixing of the fuel. It is also
the primary air that enters at the bottom of the furnace that creates the fluidization of
the solid particles. The sand transfers the heat to the water tubes effectively, which
enables a low temperature in the furnace, around 850°C. The low temperature will
also reduce the formation of NOx (Karlfeldt Fedje, 2010). Air staging is created by
secondary and tertiary air that is entering up streams in the furnace. FBC can be
divided into circulated fluidised bed combustors (CFBC) and Bubbling fluidised bed
combustors (BFBC). For combustion of MSW, BFBC are almost exclusively used.
(Peña, 2011). In a BFBC, the bottom ash is collected in the bottom of the furnace and
the fly ash is leaving the furnace with the flue gas on the same way as for an MBC.
Figure 6 Schematic picture of a BFBC (Metso, 2010)

9
However bottom ash from both MBC and BFBC consists of mostly non-combustible
particles, which are a residual part from household waste. The bottom ash is sent to a
reprocessing facility where metals are separated for recovery. The combustible
particles are removed and the remaining bottom ash is stored in order to improve its
quality. The bottom ash is then suitable as a construction material, for example as
filling material for road construction (Cewep, 2009).
MSW is a heterogeneous fuel, which means that the quality of the fuel will vary both
over time and between different plants. The fly ash from incineration of MSW is not
useable as a construction material due to high level of toxic metals and chlorides. The
acceptance for using fly ash from MSWI is low due to the environmental risk for
leaching of toxic metals and chlorides. A large part of the fly ash in Scandinavia is
therefore sent to Langøya in Norway for further treatment.
As mentioned above the quality of the MSW fuel will vary, which means that also the
content in the fly ash will vary. There are also other parameters that affect the content
of different substances in the fly ash. A high temperature will evaporate metals with a
low boiling temperature point, so that the amount of metals increases in fly ash. This
means that the concentration of toxic metals in the fly ash usually is higher for MBC.
However, volatilization of metals also depends on the gas composition. An increased
concentration of chlorides such as HCl will increase the volatilization of metals such
as Cd, Pb, Cu and Zn. In the same way, an increased concentration of sulphur can
decrease the volatilisation of metals. Further the flue gas is cooled down and
volatilised metals are condensed into small particles (Wikman, et al., 2003).
The flue gas is passing through a flue gas cleaning system before entering the
atmosphere. The particles in the flue gas are in most cases removed in a bag filter or
by electrostatic precipitation. Before this filter, CaCO3, Ca(OH)2 or sodium hydrogen
carbonate (NaHCO3) can be added to remove SOx and chlorides (Ronald D. Bell,
u.d.).
Equation 2 shows a reaction with slaked lime and hydrogen chloride as reactants. The
product after reaction is salt in form of CaCl2 and water.
𝐶𝑎(𝑂𝐻)2 + 2𝐻𝐶𝑙 → 𝐶𝑎𝐶𝑙2 + 2𝐻2𝑂 (2)
Equation 3 shows a reaction in which limestone is used as a neutralizing reagent.
𝐶𝑎𝐶𝑂3 + 2𝐻𝐶𝑙 → 𝐶𝑎𝐶𝑙2 + 𝐻2𝑂 + 𝐶𝑂2 (3)
When sodium hydrogen carbonate is used as a neutralising reagent, following reaction
occurs, see equation 4 (Ronald D. Bell, u.d.).
𝑁𝑎𝐻𝐶𝑂3 + 𝐻𝐶𝑙 → 𝑁𝑎𝐶𝑙 + 𝐻2𝑂 + 𝐶𝑂2 (4)
As can be seen the choice of cleaning system affects the production of salts and the
amount of produced salt can be regulated by different cleaning systems.
The fly ash is then collected and transported for further treatment. After the bag filter
the remaining flue gas sometimes passing a wet scrubber for reduction of chlorides
and sulphur. Also, selective catalytic reaction (SCR) or selective non catalytic
reaction (SNCR) are used to reduce NOx.
In Figure 7, a flow sheet of Renova AB´s facility in Gothenburg is presented. Renova
AB uses MBC. The fuel enters the furnace (2) and the produced energy is then used to
produce steam in the steam generator (4). This heat is then used to produce electricity
and heat. The flue gas is passing through an electrostatic precipitator (8), where 99 %
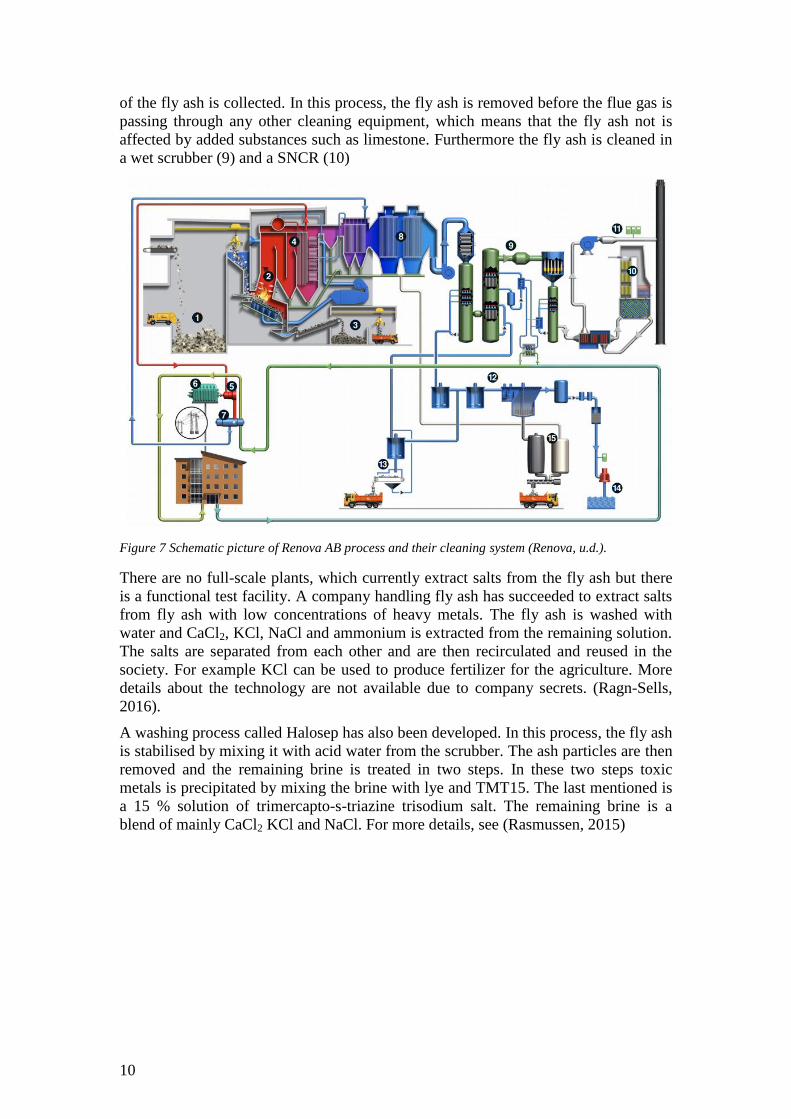
10
of the fly ash is collected. In this process, the fly ash is removed before the flue gas is
passing through any other cleaning equipment, which means that the fly ash not is
affected by added substances such as limestone. Furthermore the fly ash is cleaned in
a wet scrubber (9) and a SNCR (10)
Figure 7 Schematic picture of Renova AB process and their cleaning system (Renova, u.d.).
There are no full-scale plants, which currently extract salts from the fly ash but there
is a functional test facility. A company handling fly ash has succeeded to extract salts
from fly ash with low concentrations of heavy metals. The fly ash is washed with
water and CaCl2, KCl, NaCl and ammonium is extracted from the remaining solution.
The salts are separated from each other and are then recirculated and reused in the
society. For example KCl can be used to produce fertilizer for the agriculture. More
details about the technology are not available due to company secrets. (Ragn-Sells,
2016).
A washing process called Halosep has also been developed. In this process, the fly ash
is stabilised by mixing it with acid water from the scrubber. The ash particles are then
removed and the remaining brine is treated in two steps. In these two steps toxic
metals is precipitated by mixing the brine with lye and TMT15. The last mentioned is
a 15 % solution of trimercapto-s-triazine trisodium salt. The remaining brine is a
blend of mainly CaCl2 KCl and NaCl. For more details, see (Rasmussen, 2015)

11
2.3 General about NOAH AS and their process today
NOAH AS is operating on the island Langøya in Norway in the township Re.
Between 1899 and 1985 Langøya was a quarry for extraction of limestone. The total
amount of limestone produced was around 45 million tonnes which lead to 9.3 million
m3
large crates down to 80 meters under sea level. Since 1985, Langøya is utilized for
treatment of hazardous waste, such as fly ash generated from MSWI and sulfuric acid
(NOAH, 2016). In Figure 8, a simplified flow sheet for the process on Langøya is
presented. For a more detailed flow sheet, see Appendix A – Flow sheet.
Figure 8 Simplified flow sheet of the process on Langøya
Fly ash is transported from the whole of Scandinavia to Langøya with ships and
trucks. The fly ash is unloaded to storage and is then mixed with water in large tanks
(809). Salts and some toxic metal compounds are leached from the fly ash. The
sulfuric acid transported to Langøya is acidic and needs to be neutralised by the
alkaline fly ash solution. The fly ash solution and the sulfuric acid are mixed in
vessels R0-R4 until the right pH level is reached in the R4 tank. The reaction between
the fly ash and sulfuric acid creates solid gypsum, see equation 5 (Breinholt Jensen,
2015).
𝐻2𝑆𝑂4 + 𝐶𝑎𝑂/𝑓𝑙𝑦 𝑎𝑠ℎ → 𝐶𝑎𝑆𝑂4 + 𝐻2𝑂 (5)
Hydrated lime can also be added to reach the right pH level. The remaining gypsum
slurry is then pumped to a large crate where the gypsum settles and immobilizing
toxic metals and prevent them to be leached. The water containing salt is then
recirculated or pumped through a water treatment plant including a carbon- and sand
filter to remove particles before it is diverted into the Oslo Fjord. The crates are
constantly filled with more gypsum and Langøya will therefore be fully utilized
within a few years. The future plan is to build a new facility in Brevik with a similar
treatment.
12
2.4 Crystallisation technologies
The salts extracted from the process on Langøya are solved in brine. To obtain dry
salts in crystallised form, the water in the brine has to be removed. Removing water
from the brine is a well-known technology that is used for example when producing
vacuum salt (GEA, 2012).
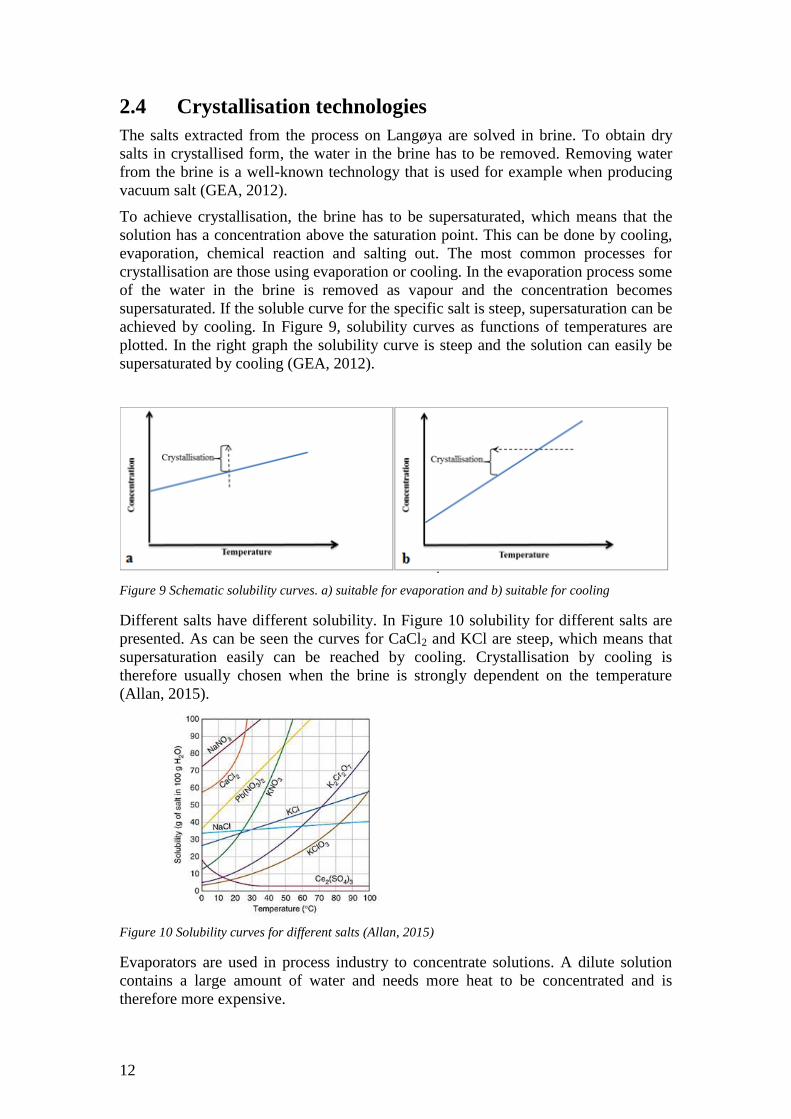
To achieve crystallisation, the brine has to be supersaturated, which means that the
solution has a concentration above the saturation point. This can be done by cooling,
evaporation, chemical reaction and salting out. The most common processes for
crystallisation are those using evaporation or cooling. In the evaporation process some
of the water in the brine is removed as vapour and the concentration becomes
supersaturated. If the soluble curve for the specific salt is steep, supersaturation can be
achieved by cooling. In Figure 9, solubility curves as functions of temperatures are
plotted. In the right graph the solubility curve is steep and the solution can easily be
supersaturated by cooling (GEA, 2012).
Figure 9 Schematic solubility curves. a) suitable for evaporation and b) suitable for cooling
Different salts have different solubility. In Figure 10 solubility for different salts are
presented. As can be seen the curves for CaCl2 and KCl are steep, which means that
supersaturation easily can be reached by cooling. Crystallisation by cooling is
therefore usually chosen when the brine is strongly dependent on the temperature
(Allan, 2015).
Figure 10 Solubility curves for different salts (Allan, 2015)
Evaporators are used in process industry to concentrate solutions. A dilute solution
contains a large amount of water and needs more heat to be concentrated and is
therefore more expensive.
13
In warm countries solar evaporation of sea salt is a common way to crystallise NaCl
but in Scandinavian the climate is too cold for this method. Instead, an external heat
source such as steam produced from waste heat is used to evaporate the brine. There
are many different evaporation techniques available such as spray evaporation, falling
film evaporation, forced circulation (FC), turbulence crystalliser (DTB) and OSLO
crystalliser. For crystallisation of salts, the three last mentioned are the most common
methods. The principle in those three are similar but the mixing of energy and
retention time differs. This difference will affect the size of the crystals. The crystal
size is 0.2-0.6 mm for a FC crystalliser, 0.5-1.5 mm for a DTB crystalliser and above
1.5 mm for an OSLO crystalliser (GEA, 2012). The crystal size is of great interest for
road salt.
When a single evaporator is used for concentration the process is called single effect
evaporator. When a number of sequential effects are used in a sequential serial, it is
called multiple effect evaporators. Single effect evaporators are simple but the
efficiency is low, while the multiple has a higher efficiency. More details can be
studied in (Nayak, 2012). This means that the variable costs are lower for a multiple
effect evaporator, while the fixed cost during installation is lower for the single effect
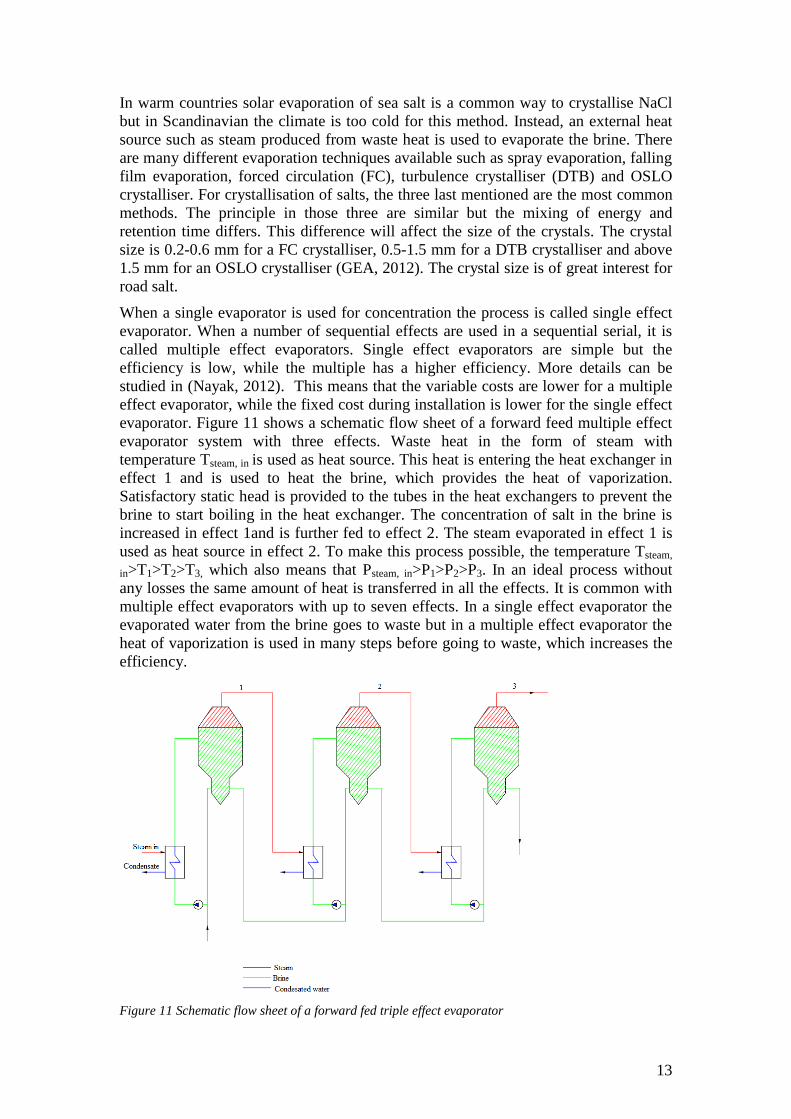
evaporator. Figure 11 shows a schematic flow sheet of a forward feed multiple effect
evaporator system with three effects. Waste heat in the form of steam with
temperature Tsteam, in is used as heat source. This heat is entering the heat exchanger in
effect 1 and is used to heat the brine, which provides the heat of vaporization.
Satisfactory static head is provided to the tubes in the heat exchangers to prevent the
brine to start boiling in the heat exchanger. The concentration of salt in the brine is
increased in effect 1and is further fed to effect 2. The steam evaporated in effect 1 is
used as heat source in effect 2. To make this process possible, the temperature Tsteam,
in>T1>T2>T3, which also means that Psteam, in>P1>P2>P3. In an ideal process without
any losses the same amount of heat is transferred in all the effects. It is common with
multiple effect evaporators with up to seven effects. In a single effect evaporator the
evaporated water from the brine goes to waste but in a multiple effect evaporator the
heat of vaporization is used in many steps before going to waste, which increases the
efficiency.
Figure 11 Schematic flow sheet of a forward fed triple effect evaporator

14
Backward feed multiple effect evaporator is also a common method. The principle is
the same as in Figure 11 but the brine is fed in the opposite direction. In this case a
pump is needed between all the effects to increase the pressure in each stage. In a
backward feed multiple effect evaporation process the temperature of the final product
is higher, which can be desirable. (Nayak, 2012).
In a multiple effect evaporator different salts can be separated from each other. The
technology is based on the fact that different salts are precipitated at various
concentrations. By extracting salts between each evaporator the salts can be separated.
The technology is easy to carry out when separating NaCl from CaCl2 due to the big
difference in solubility. It is more difficult to separate NaCl from KCl since their
solubilities are similar (Hailong, et al., 2014).
15
3 Method
In this chapter the aim is to present tools and methods that were used to answer the
questions mentioned in purpose, chapter 1.2
3.1 Regulations for road salt in Scandinavia
This part of the investigation is a kind of research task. Information about road salt
was collected and analysed for the whole Scandinavia. Experts in the road salt field
was contacted and interviewed. Information that was of interest was what kind of salt,
such as NaCl, MgCl2 and CaCl2, that was used. Limitations of substances, such as
toxic metal compounds, for the different countries were also investigated. The size
fraction of the salt crystals is an important parameter but this is not analysed in depth.
3.2 Extraction of salt from the process on Langøya
The experiment to recover salt from fly ash was performed at the NOAH AS facility
on Langøya in Norway. The fly ash is treated in different steps in the process on
Langøya. The experiment was performed for ash slurry extracted from three different
positions at three different times. That means that totally nine samples were extracted.
The sample positions can be seen in Figure 8.
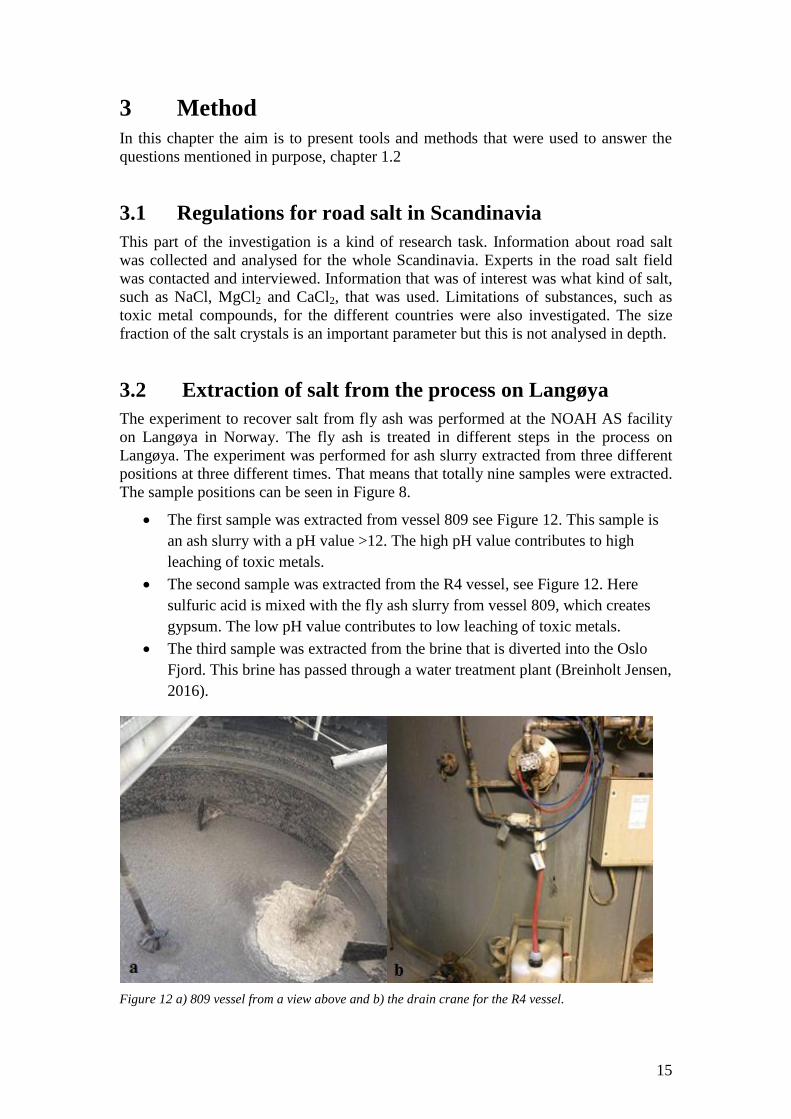
The first sample was extracted from vessel 809 see Figure 12. This sample is
an ash slurry with a pH value >12. The high pH value contributes to high
leaching of toxic metals.
The second sample was extracted from the R4 vessel, see Figure 12. Here
sulfuric acid is mixed with the fly ash slurry from vessel 809, which creates
gypsum. The low pH value contributes to low leaching of toxic metals.
The third sample was extracted from the brine that is diverted into the Oslo
Fjord. This brine has passed through a water treatment plant (Breinholt Jensen,
2016).
Figure 12 a) 809 vessel from a view above and b) the drain crane for the R4 vessel.
16
The samples were extracted from the process at 2016-02-11, 2016-02-23 and 2016-
03-02. Approximately a 4.5 kg sample was taken from each sample position
mentioned above. All the 4.5 kg samples were vacuum filtered through a filter paper
from Whatman. The filter paper with a diameter of 110 mm was ashless. This filter
paper collects small particles (<2 μm) and is commonly used for determination of
insoluble particles.
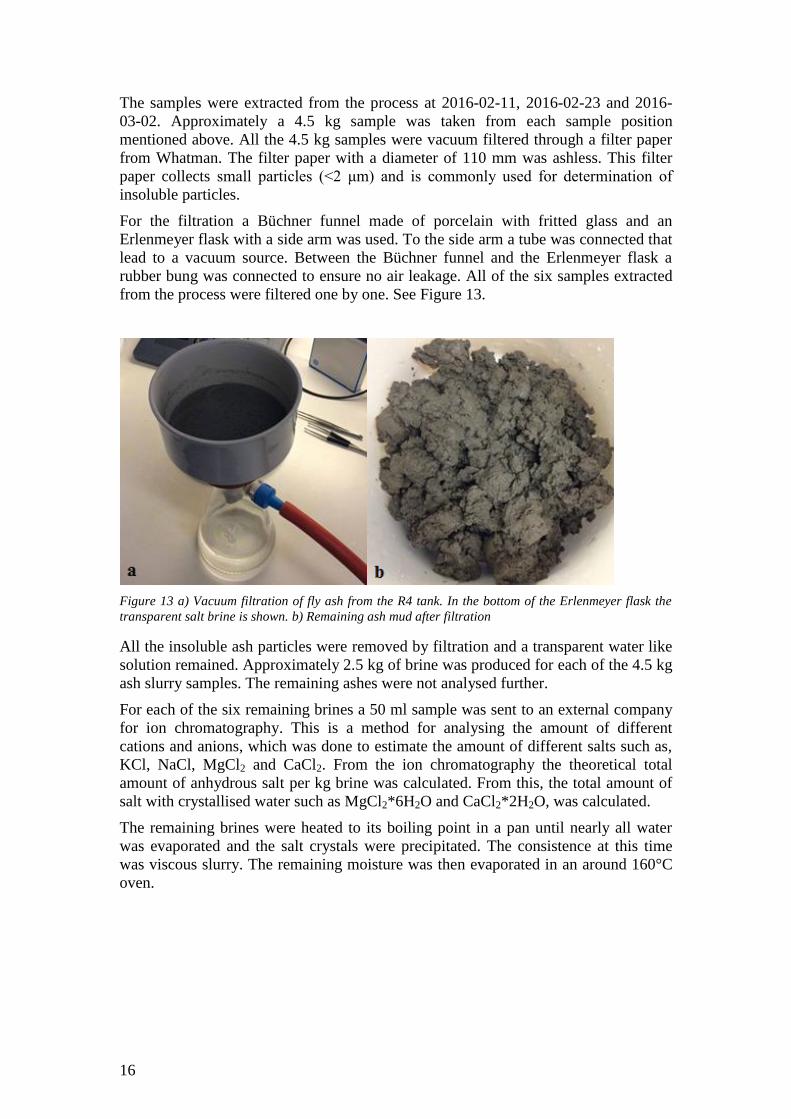
For the filtration a Büchner funnel made of porcelain with fritted glass and an
Erlenmeyer flask with a side arm was used. To the side arm a tube was connected that
lead to a vacuum source. Between the Büchner funnel and the Erlenmeyer flask a
rubber bung was connected to ensure no air leakage. All of the six samples extracted
from the process were filtered one by one. See Figure 13.
Figure 13 a) Vacuum filtration of fly ash from the R4 tank. In the bottom of the Erlenmeyer flask the
transparent salt brine is shown. b) Remaining ash mud after filtration
All the insoluble ash particles were removed by filtration and a transparent water like
solution remained. Approximately 2.5 kg of brine was produced for each of the 4.5 kg
ash slurry samples. The remaining ashes were not analysed further.
For each of the six remaining brines a 50 ml sample was sent to an external company
for ion chromatography. This is a method for analysing the amount of different
cations and anions, which was done to estimate the amount of different salts such as,
KCl, NaCl, MgCl2 and CaCl2. From the ion chromatography the theoretical total
amount of anhydrous salt per kg brine was calculated. From this, the total amount of
salt with crystallised water such as MgCl2*6H2O and CaCl2*2H2O, was calculated.
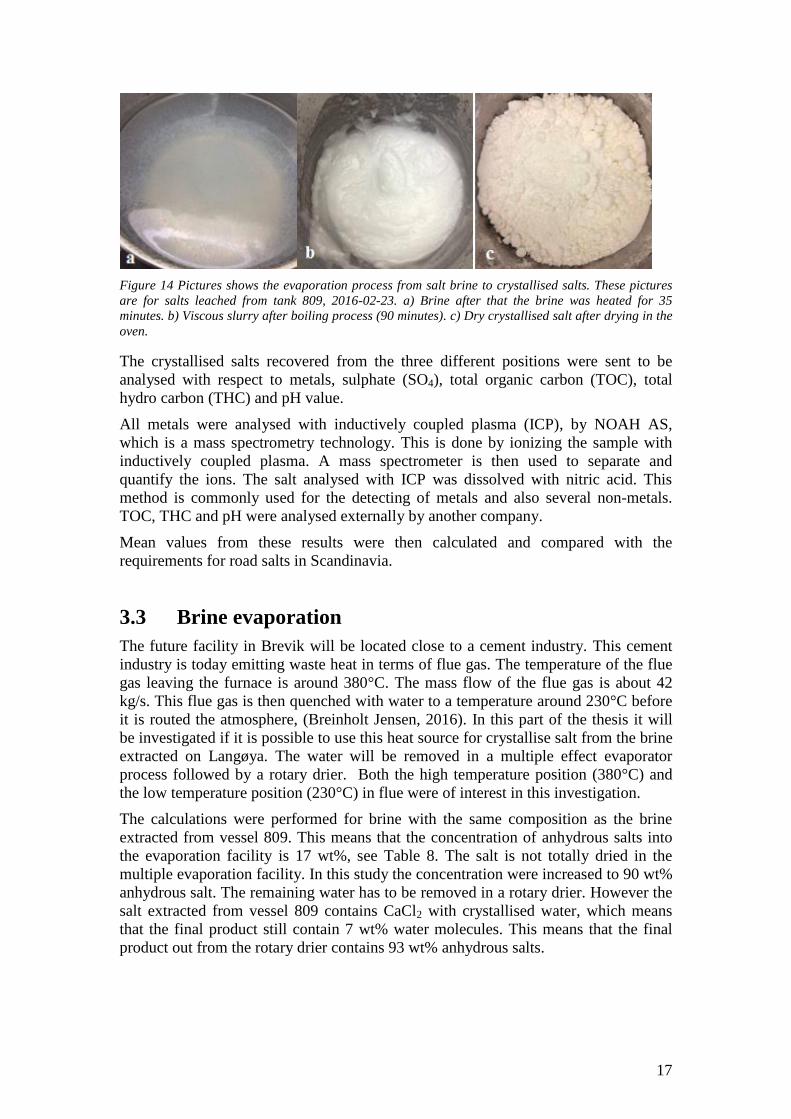
The remaining brines were heated to its boiling point in a pan until nearly all water
was evaporated and the salt crystals were precipitated. The consistence at this time
was viscous slurry. The remaining moisture was then evaporated in an around 160°C
oven.
17
Figure 14 Pictures shows the evaporation process from salt brine to crystallised salts. These pictures
are for salts leached from tank 809, 2016-02-23. a) Brine after that the brine was heated for 35
minutes. b) Viscous slurry after boiling process (90 minutes). c) Dry crystallised salt after drying in the
oven.
The crystallised salts recovered from the three different positions were sent to be
analysed with respect to metals, sulphate (SO4), total organic carbon (TOC), total
hydro carbon (THC) and pH value.
All metals were analysed with inductively coupled plasma (ICP), by NOAH AS,
which is a mass spectrometry technology. This is done by ionizing the sample with
inductively coupled plasma. A mass spectrometer is then used to separate and
quantify the ions. The salt analysed with ICP was dissolved with nitric acid. This
method is commonly used for the detecting of metals and also several non-metals.
TOC, THC and pH were analysed externally by another company.
Mean values from these results were then calculated and compared with the
requirements for road salts in Scandinavia.
3.3 Brine evaporation
The future facility in Brevik will be located close to a cement industry. This cement
industry is today emitting waste heat in terms of flue gas. The temperature of the flue
gas leaving the furnace is around 380°C. The mass flow of the flue gas is about 42
kg/s. This flue gas is then quenched with water to a temperature around 230°C before
it is routed the atmosphere, (Breinholt Jensen, 2016). In this part of the thesis it will
be investigated if it is possible to use this heat source for crystallise salt from the brine
extracted on Langøya. The water will be removed in a multiple effect evaporator
process followed by a rotary drier. Both the high temperature position (380°C) and
the low temperature position (230°C) in flue were of interest in this investigation.
The calculations were performed for brine with the same composition as the brine
extracted from vessel 809. This means that the concentration of anhydrous salts into
the evaporation facility is 17 wt%, see Table 8. The salt is not totally dried in the
multiple evaporation facility. In this study the concentration were increased to 90 wt%
anhydrous salt. The remaining water has to be removed in a rotary drier. However the
salt extracted from vessel 809 contains CaCl2 with crystallised water, which means
that the final product still contain 7 wt% water molecules. This means that the final
product out from the rotary drier contains 93 wt% anhydrous salts.
18
The evaporating process uses steam as a heat source and the energy released to
condense the steam is used for the evaporating process. Therefore steam has to be
produced in a heat recovery steam generator (HRSG), which uses the heat in the flue
gas. The flue gas at the two different positions is assumed to be an ideal gas with a
specific heat capacity equal 1 kJ/kgK. The change in total energy of an ideal gas is
given by equation 6 (Nikolai, 1997).
∆𝑄 = �̇�(ℎ2 − ℎ1) = �̇�𝐶𝑝(𝑇2 − 𝑇1) [J] (6)
where:
∆Q = Transferred heat [kW]
Cp= Specific heat capacity [kJ/kgK]
�̇� = mass flow [kg/s]
T= Temperature [°C]
h= Enthalpy [kj/kg]
As seen from equation 6, a high flue gas inlet temperature (T1) and a low flue gas
exhaust temperature (T2) entail a large energy exchange. However the exhaust flue
gas temperature from the HRSG needs to be at least 150°C since the flue gas is
containing sulphur. A lower temperature than this will result in sulphur dew point
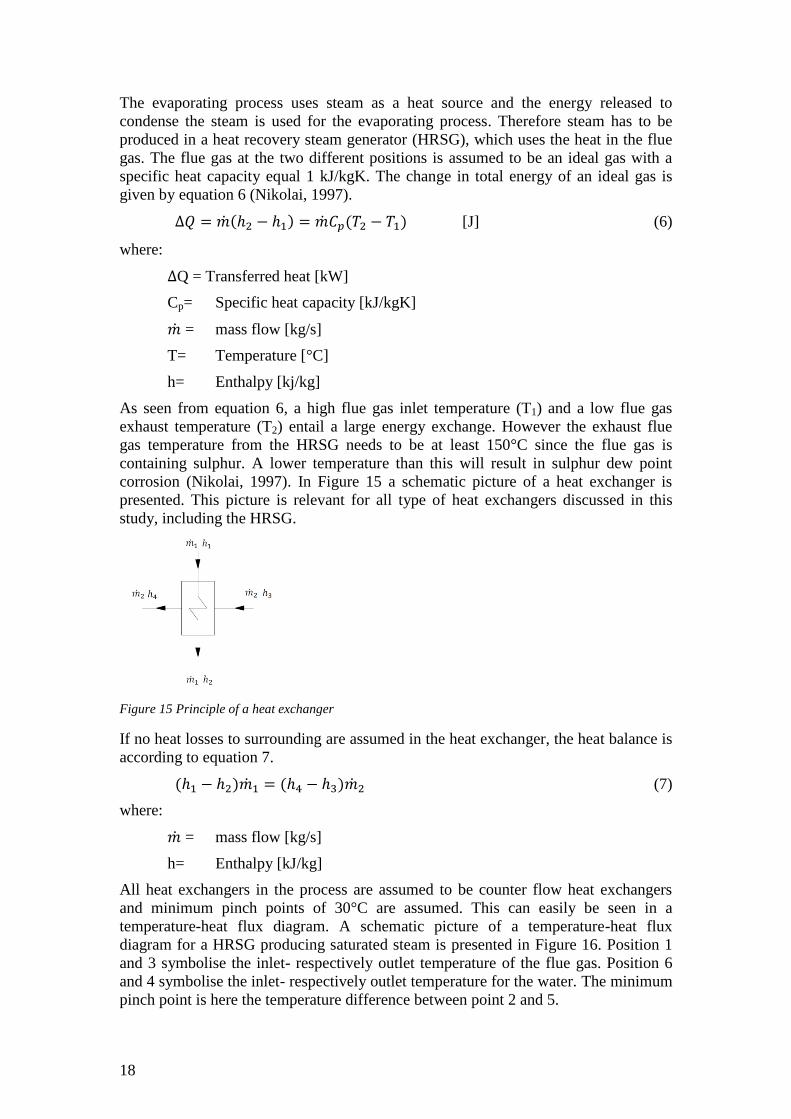
corrosion (Nikolai, 1997). In Figure 15 a schematic picture of a heat exchanger is
presented. This picture is relevant for all type of heat exchangers discussed in this
study, including the HRSG.
Figure 15 Principle of a heat exchanger
If no heat losses to surrounding are assumed in the heat exchanger, the heat balance is
according to equation 7.
(ℎ1 − ℎ2)�̇�1 = (ℎ4 − ℎ3)�̇�2 (7)
where:
�̇� = mass flow [kg/s]
h= Enthalpy [kJ/kg]
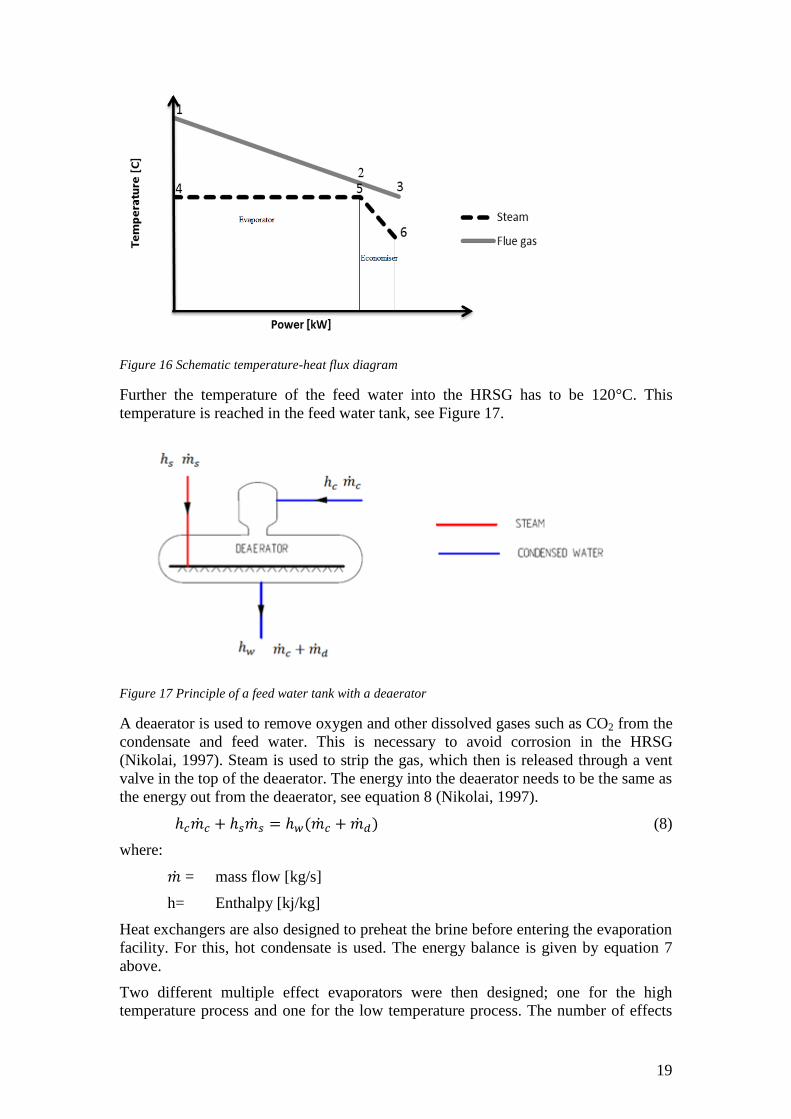
All heat exchangers in the process are assumed to be counter flow heat exchangers
and minimum pinch points of 30°C are assumed. This can easily be seen in a
temperature-heat flux diagram. A schematic picture of a temperature-heat flux
diagram for a HRSG producing saturated steam is presented in Figure 16. Position 1
and 3 symbolise the inlet- respectively outlet temperature of the flue gas. Position 6
and 4 symbolise the inlet- respectively outlet temperature for the water. The minimum
pinch point is here the temperature difference between point 2 and 5.
19
Figure 16 Schematic temperature-heat flux diagram
Further the temperature of the feed water into the HRSG has to be 120°C. This
temperature is reached in the feed water tank, see Figure 17.
Figure 17 Principle of a feed water tank with a deaerator
A deaerator is used to remove oxygen and other dissolved gases such as CO2 from the
condensate and feed water. This is necessary to avoid corrosion in the HRSG
(Nikolai, 1997). Steam is used to strip the gas, which then is released through a vent
valve in the top of the deaerator. The energy into the deaerator needs to be the same as
the energy out from the deaerator, see equation 8 (Nikolai, 1997).
ℎ𝑐�̇�𝑐 + ℎ𝑠�̇�𝑠 = ℎ𝑤(�̇�𝑐 + �̇�𝑑) (8)
where:
�̇� = mass flow [kg/s]
h= Enthalpy [kj/kg]
Heat exchangers are also designed to preheat the brine before entering the evaporation
facility. For this, hot condensate is used. The energy balance is given by equation 7
above.
Two different multiple effect evaporators were then designed; one for the high
temperature process and one for the low temperature process. The number of effects
20
depends on the temperature of the heat source, which in this case is saturated steam
produced by the flue gas. The pinch points for the heat exchangers in the evaporators
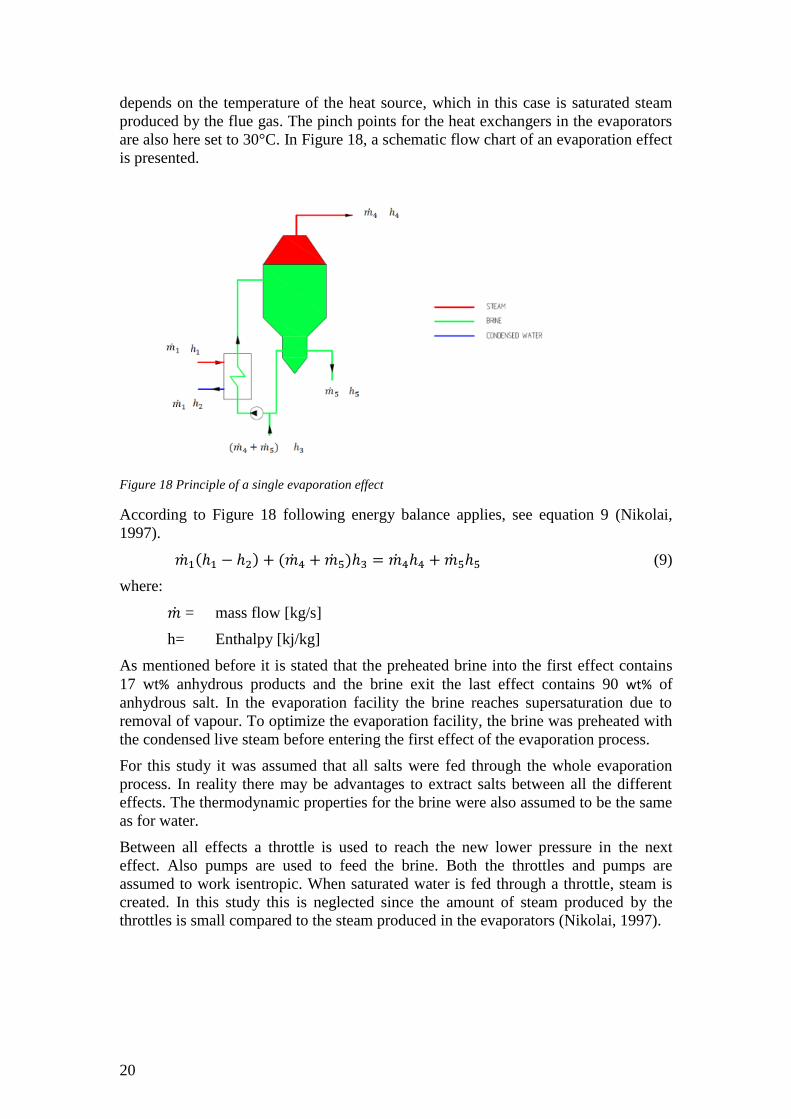
are also here set to 30°C. In Figure 18, a schematic flow chart of an evaporation effect
is presented.
Figure 18 Principle of a single evaporation effect
According to Figure 18 following energy balance applies, see equation 9 (Nikolai,
1997).
�̇�1(ℎ1 − ℎ2) + (�̇�4 + �̇�5)ℎ3 = �̇�4ℎ4 + �̇�5ℎ5 (9)
where:
�̇� = mass flow [kg/s]
h= Enthalpy [kj/kg]
As mentioned before it is stated that the preheated brine into the first effect contains
17 wt% anhydrous products and the brine exit the last effect contains 90 wt% of
anhydrous salt. In the evaporation facility the brine reaches supersaturation due to
removal of vapour. To optimize the evaporation facility, the brine was preheated with
the condensed live steam before entering the first effect of the evaporation process.
For this study it was assumed that all salts were fed through the whole evaporation
process. In reality there may be advantages to extract salts between all the different
effects. The thermodynamic properties for the brine were also assumed to be the same
as for water.
Between all effects a throttle is used to reach the new lower pressure in the next
effect. Also pumps are used to feed the brine. Both the throttles and pumps are
assumed to work isentropic. When saturated water is fed through a throttle, steam is
created. In this study this is neglected since the amount of steam produced by the
throttles is small compared to the steam produced in the evaporators (Nikolai, 1997).

21
4 Regulations for road salt in Scandinavia
The salt extracted from the process on Langøya has to meet the today’s limitations to
be approved as road salt. In this chapter regulatory framework for the Scandinavian
counties is presented. In addition a future European standardisation concerning salts is
presented since it will probably be of great importance in a few years. Important
parameters for road salt is moisture content, amount of other substances than salts,
such as toxic metals, pH value, anti-caking agents, size fraction of the salt crystals and
proportion of different salts for blends. The size fraction of the salt crystals is an
important parameter. If the crystals are too small it leads to large lumps and the time
for the salt to be dissolved will increase. Too large crystals will also increase the
dissolution time. However, all this data is not stated in detail in this report but to give
a glimpse of how the requirements for crystal fraction might look, Table 1 below
shows the Norwegian requirement.
Table 1 Salt fraction analyse for road salt in Norway
4.1 European standardisation
The European Committee for Standardization (CEN) has developed a new standard
for road salt usage, which most likely will be released 2017-07-08 (CEN, 2016). CEN,
also called European standard, is a federation that establishes standards for 33
European countries. CEN is one of three standardization organizations in Europe.
European committee for Electro technical Standardization (CENLEC), and European
Telecommunication Standards Institute (ETSI) is the other two. The CEN
organization is located in Brussels and is cooperation with the European Union since
2013-01-01. CEN is an organization for development of European Standards and
technical documents. CEN establishes standards for many different sectors such as
chemicals, construction, etc. (CEN, 2016).
The CEN plays an important role for the European market. It makes it easier for
companies to sell their products or services to customers around Europe (CEN, 2016).
It is important to note that this is only a standard and not a regulation but it will
probably have a great impact in the long term because there are no clear regular
frameworks existing today. Standards are voluntary and regulations are mandatory
(CEN, 2015). The European standard for road salt usage specifies requirements of
NaCl, MgCl2 CaCl2 and multi chloride blends for using on roadways for winter
maintenance. The requirements are specified for salt both in crystallised form and for
salt in brine (Azifi, 2016).
Salt fraction analysis for road salt in Norway
Sieve size [mm] Salt sifted through the sieve [wt%]
0.125 ≤ 5
1 20-100
4 80-100
6.3 100
22
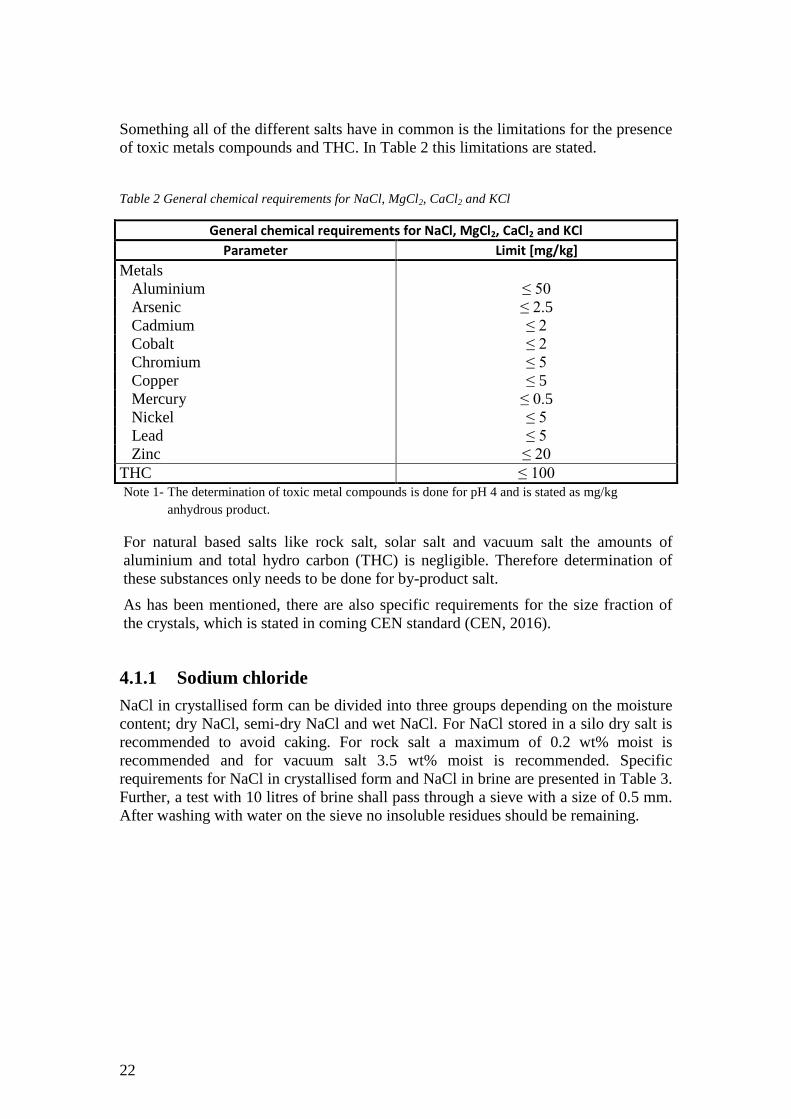
Something all of the different salts have in common is the limitations for the presence
of toxic metals compounds and THC. In Table 2 this limitations are stated.
Table 2 General chemical requirements for NaCl, MgCl2, CaCl2 and KCl
General chemical requirements for NaCl, MgCl2, CaCl2 and KCl
Parameter Limit [mg/kg]
Metals
Aluminium ≤ 50
Arsenic ≤ 2.5
Cadmium ≤ 2
Cobalt ≤ 2
Chromium ≤ 5
Copper ≤ 5
Mercury ≤ 0.5
Nickel ≤ 5
Lead ≤ 5
Zinc ≤ 20
THC ≤ 100
Note 1- The determination of toxic metal compounds is done for pH 4 and is stated as mg/kg
anhydrous product.
For natural based salts like rock salt, solar salt and vacuum salt the amounts of
aluminium and total hydro carbon (THC) is negligible. Therefore determination of
these substances only needs to be done for by-product salt.
As has been mentioned, there are also specific requirements for the size fraction of
the crystals, which is stated in coming CEN standard (CEN, 2016).
4.1.1 Sodium chloride
NaCl in crystallised form can be divided into three groups depending on the moisture
content; dry NaCl, semi-dry NaCl and wet NaCl. For NaCl stored in a silo dry salt is
recommended to avoid caking. For rock salt a maximum of 0.2 wt% moist is
recommended and for vacuum salt 3.5 wt% moist is recommended. Specific
requirements for NaCl in crystallised form and NaCl in brine are presented in Table 3.
Further, a test with 10 litres of brine shall pass through a sieve with a size of 0.5 mm.
After washing with water on the sieve no insoluble residues should be remaining.
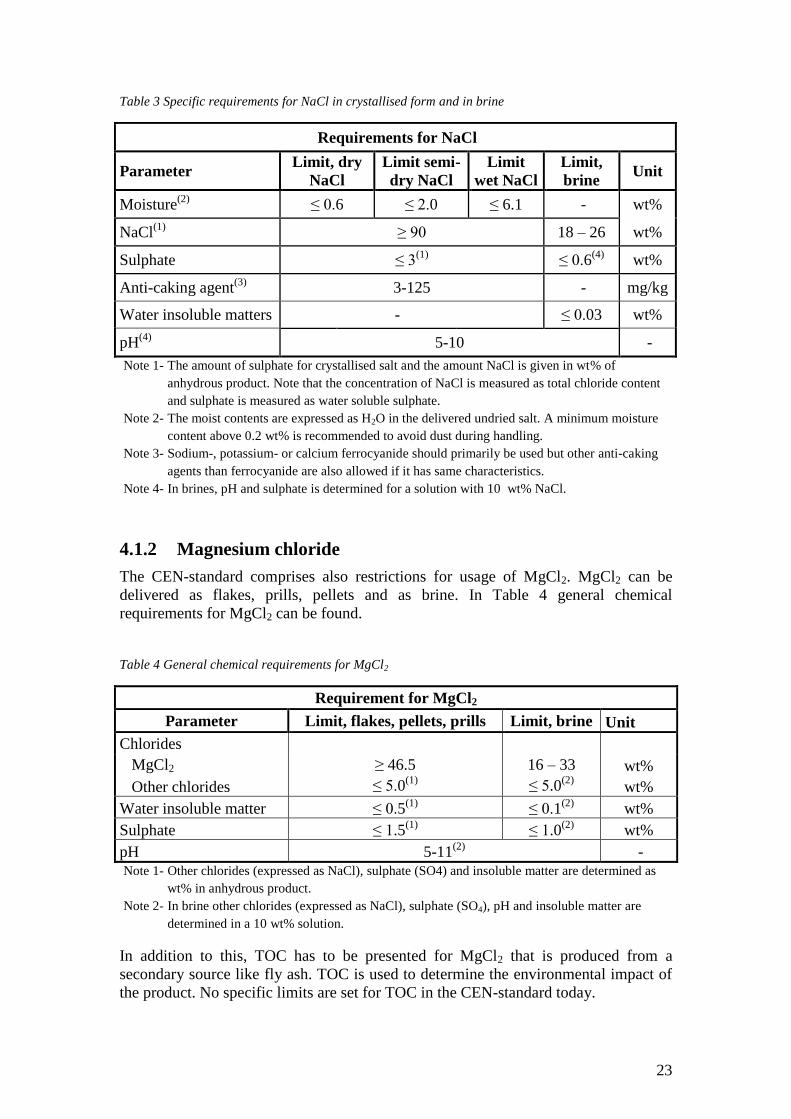
23
Table 3 Specific requirements for NaCl in crystallised form and in brine
Requirements for NaCl
Parameter Limit, dry
NaCl
Limit semi-
dry NaCl
Limit
wet NaCl
Limit,
brine Unit
Moisture(2)
≤ 0.6 ≤ 2.0 ≤ 6.1 - wt%
NaCl(1)
≥ 90 18 – 26
wt%
Sulphate ≤ 3(1)
≤ 0.6(4)
wt%
Anti-caking agent(3)
3-125 - mg/kg
Water insoluble matters - ≤ 0.03
wt%
pH(4)
5-10 -
Note 1- The amount of sulphate for crystallised salt and the amount NaCl is given in wt% of
anhydrous product. Note that the concentration of NaCl is measured as total chloride content
and sulphate is measured as water soluble sulphate.
Note 2- The moist contents are expressed as H2O in the delivered undried salt. A minimum moisture
content above 0.2 wt% is recommended to avoid dust during handling.
Note 3- Sodium-, potassium- or calcium ferrocyanide should primarily be used but other anti-caking
agents than ferrocyanide are also allowed if it has same characteristics.
Note 4- In brines, pH and sulphate is determined for a solution with 10 wt% NaCl.
4.1.2 Magnesium chloride
The CEN-standard comprises also restrictions for usage of MgCl2. MgCl2 can be
delivered as flakes, prills, pellets and as brine. In Table 4 general chemical
requirements for MgCl2 can be found.
Table 4 General chemical requirements for MgCl2
Requirement for MgCl2
Parameter Limit, flakes, pellets, prills Limit, brine Unit
Chlorides
MgCl2 ≥ 46.5 16 – 33 wt%
Other chlorides ≤ 5.0(1)
≤ 5.0(2)
wt%
Water insoluble matter ≤ 0.5(1)
≤ 0.1(2)
wt%
Sulphate ≤ 1.5(1)
≤ 1.0(2)
wt%
pH 5-11(2)
- Note 1- Other chlorides (expressed as NaCl), sulphate (SO4) and insoluble matter are determined as
wt% in anhydrous product.
Note 2- In brine other chlorides (expressed as NaCl), sulphate (SO4), pH and insoluble matter are
determined in a 10 wt% solution.
In addition to this, TOC has to be presented for MgCl2 that is produced from a
secondary source like fly ash. TOC is used to determine the environmental impact of
the product. No specific limits are set for TOC in the CEN-standard today.
24
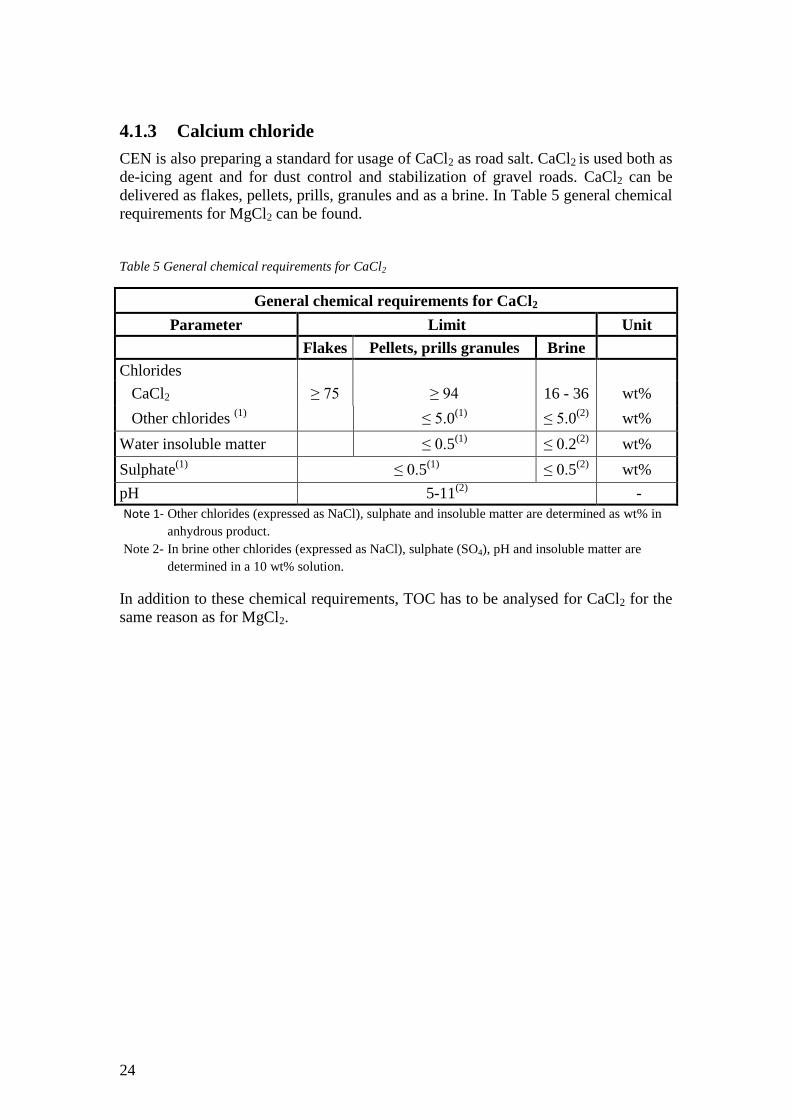
4.1.3 Calcium chloride
CEN is also preparing a standard for usage of CaCl2 as road salt. CaCl2 is used both as
de-icing agent and for dust control and stabilization of gravel roads. CaCl2 can be
delivered as flakes, pellets, prills, granules and as a brine. In Table 5 general chemical
requirements for MgCl2 can be found.
Table 5 General chemical requirements for CaCl2
General chemical requirements for CaCl2
Parameter Limit Unit
Flakes Pellets, prills granules Brine
Chlorides
CaCl2 ≥ 75 ≥ 94 16 - 36 wt%
Other chlorides (1)
≤ 5.0(1)
≤ 5.0(2)
wt%
Water insoluble matter
≤ 0.5(1)
≤ 0.2(2)
wt%
Sulphate(1)
≤ 0.5(1)
≤ 0.5(2)
wt%
pH 5-11(2)
-
Note 1- Other chlorides (expressed as NaCl), sulphate and insoluble matter are determined as wt% in
anhydrous product.
Note 2- In brine other chlorides (expressed as NaCl), sulphate (SO4), pH and insoluble matter are
determined in a 10 wt% solution.
In addition to these chemical requirements, TOC has to be analysed for CaCl2 for the
same reason as for MgCl2.
25
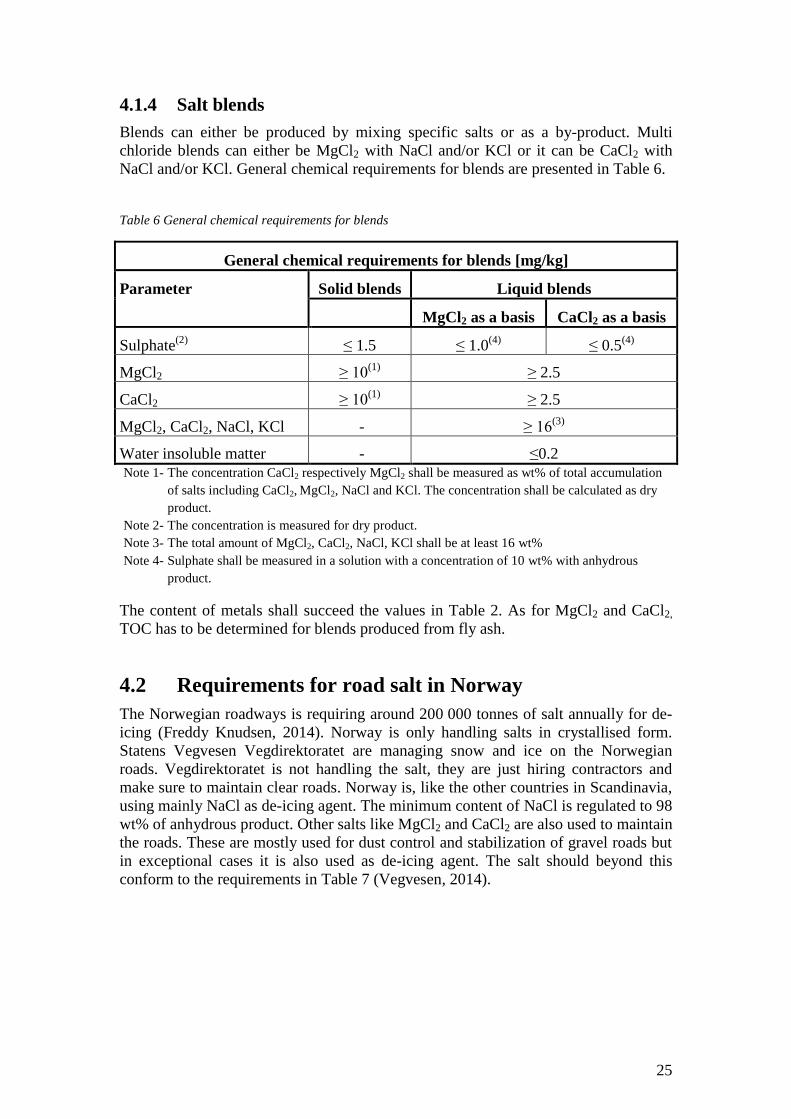
4.1.4 Salt blends
Blends can either be produced by mixing specific salts or as a by-product. Multi
chloride blends can either be MgCl2 with NaCl and/or KCl or it can be CaCl2 with
NaCl and/or KCl. General chemical requirements for blends are presented in Table 6.
Table 6 General chemical requirements for blends
General chemical requirements for blends [mg/kg]
Parameter Solid blends Liquid blends
MgCl2 as a basis CaCl2 as a basis
Sulphate(2)
≤ 1.5 ≤ 1.0(4)
≤ 0.5(4)
MgCl2 ≥ 10(1)
≥ 2.5
CaCl2 ≥ 10(1)
≥ 2.5
MgCl2, CaCl2, NaCl, KCl - ≥ 16(3)
Water insoluble matter - ≤0.2
Note 1- The concentration CaCl2 respectively MgCl2 shall be measured as wt% of total accumulation
of salts including CaCl2, MgCl2, NaCl and KCl. The concentration shall be calculated as dry
product.
Note 2- The concentration is measured for dry product.
Note 3- The total amount of MgCl2, CaCl2, NaCl, KCl shall be at least 16 wt%
Note 4- Sulphate shall be measured in a solution with a concentration of 10 wt% with anhydrous
product.
The content of metals shall succeed the values in Table 2. As for MgCl2 and CaCl2,
TOC has to be determined for blends produced from fly ash.
4.2 Requirements for road salt in Norway
The Norwegian roadways is requiring around 200 000 tonnes of salt annually for de-
icing (Freddy Knudsen, 2014). Norway is only handling salts in crystallised form.
Statens Vegvesen Vegdirektoratet are managing snow and ice on the Norwegian
roads. Vegdirektoratet is not handling the salt, they are just hiring contractors and
make sure to maintain clear roads. Norway is, like the other countries in Scandinavia,
using mainly NaCl as de-icing agent. The minimum content of NaCl is regulated to 98
wt% of anhydrous product. Other salts like MgCl2 and CaCl2 are also used to maintain
the roads. These are mostly used for dust control and stabilization of gravel roads but
in exceptional cases it is also used as de-icing agent. The salt should beyond this
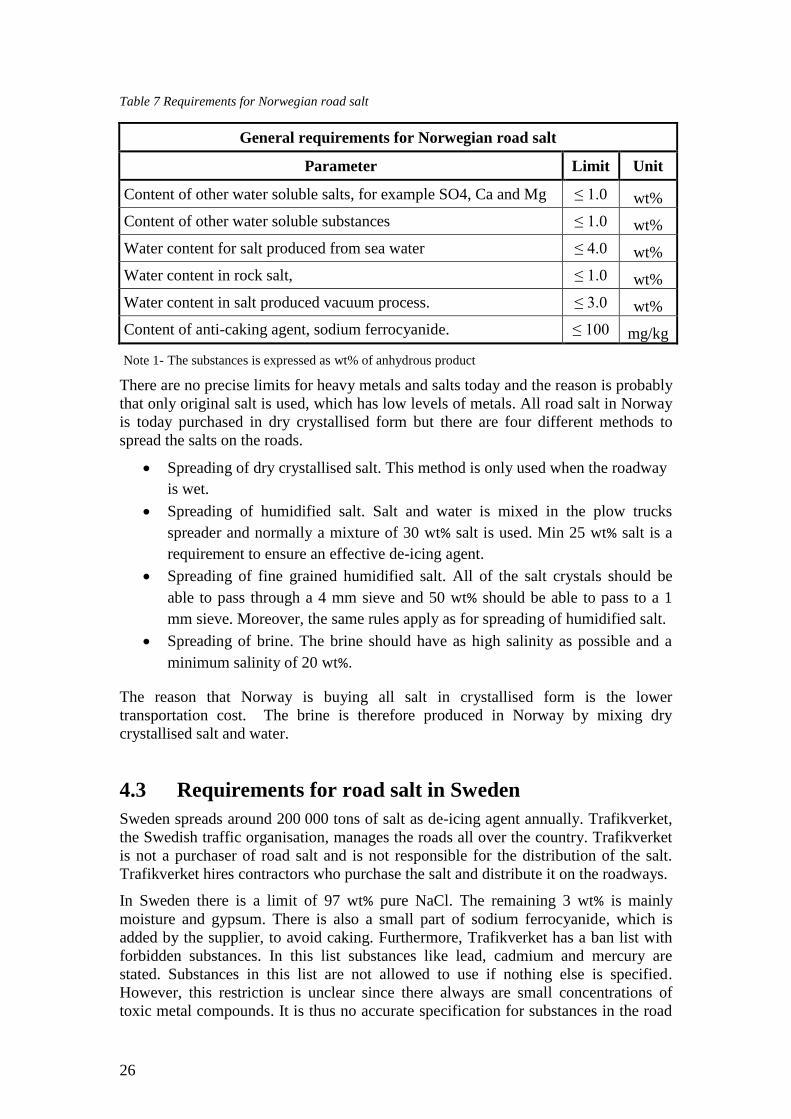
conform to the requirements in Table 7 (Vegvesen, 2014).
26
Table 7 Requirements for Norwegian road salt
General requirements for Norwegian road salt
Parameter Limit Unit
Content of other water soluble salts, for example SO4, Ca and Mg ≤ 1.0 wt%
Content of other water soluble substances ≤ 1.0 wt%
Water content for salt produced from sea water ≤ 4.0 wt%
Water content in rock salt, ≤ 1.0 wt%
Water content in salt produced vacuum process. ≤ 3.0 wt%
Content of anti-caking agent, sodium ferrocyanide. ≤ 100 mg/kg
Note 1- The substances is expressed as wt% of anhydrous product
There are no precise limits for heavy metals and salts today and the reason is probably
that only original salt is used, which has low levels of metals. All road salt in Norway
is today purchased in dry crystallised form but there are four different methods to
spread the salts on the roads.
Spreading of dry crystallised salt. This method is only used when the roadway
is wet.
Spreading of humidified salt. Salt and water is mixed in the plow trucks
spreader and normally a mixture of 30 wt% salt is used. Min 25 wt% salt is a
requirement to ensure an effective de-icing agent.
Spreading of fine grained humidified salt. All of the salt crystals should be
able to pass through a 4 mm sieve and 50 wt% should be able to pass to a 1
mm sieve. Moreover, the same rules apply as for spreading of humidified salt.
Spreading of brine. The brine should have as high salinity as possible and a
minimum salinity of 20 wt%.
The reason that Norway is buying all salt in crystallised form is the lower
transportation cost. The brine is therefore produced in Norway by mixing dry
crystallised salt and water.
4.3 Requirements for road salt in Sweden
Sweden spreads around 200 000 tons of salt as de-icing agent annually. Trafikverket,
the Swedish traffic organisation, manages the roads all over the country. Trafikverket
is not a purchaser of road salt and is not responsible for the distribution of the salt.
Trafikverket hires contractors who purchase the salt and distribute it on the roadways.
In Sweden there is a limit of 97 wt% pure NaCl. The remaining 3 wt% is mainly
moisture and gypsum. There is also a small part of sodium ferrocyanide, which is
added by the supplier, to avoid caking. Furthermore, Trafikverket has a ban list with
forbidden substances. In this list substances like lead, cadmium and mercury are
stated. Substances in this list are not allowed to use if nothing else is specified.
However, this restriction is unclear since there always are small concentrations of
toxic metal compounds. It is thus no accurate specification for substances in the road
27
salt. Trafikverket strives for salt not containing more toxic substances than the
background nature where the salt is used (Trafikverket, 2015).
Furthermore, they rank chemicals in four groups with perspective to environmental
impact, BASTA- and BETA-criteria (Trafikverket, 2014). However there are no
labelling requirements for road salt in Sweden, which means that the content of
substances is unclear.
In addition to this the amount of carbon dioxide in ton per kg produced salt is of great
interest. There are no limits for this today but these restrictions are likely to be
tightened in the future. This can probably open up opportunities for salt recovered
from fly ash.
Most of the Swedish road salt is purchased as rock salt. This salt is pure and cheap
and it is possible to decide the size of the salt particles. However, vacuum salt is
sometimes used in southern Sweden as well as sea salt.
4.4 Requirements for road salt in Denmark
Road salt that is used in Denmark is mostly NaCl but MgCl2 and CaCl2 are also used.
Sometimes also urea and calcium acetate are used as de-icing agent. Denmark is using
around 40 000- 100 000 tonnes of salt annually. In Denmark Vejdirektoratet is
managing the roads but, like in Norway and Sweden the contractors are the ones
handling with the salt. The road salt used in Denmark shall not contain substances that
can be harmful for human or the environment in normal use. Further, the road salt
should not contain any substances that can substantially reduce the friction of the road
way (Vejdirektoratet, 2006).
NaCl is delivered as sea salt, rock salt or vacuum salt. Following information must be
presented when delivering NaCl.
Particle shape/structure of the NaCl particles. This affects the salts ability to
clumping.
Salt fraction analysis.
Moisture content when delivering.
Amount and type of anti-caking substance. The maximum amount is 150
mg/kg if potassium ferrocyanide is used and 120 mg/kg if sodium ferrocyanide
is used.
Content of other substances than NaCl, both soluble and insoluble. The
maximum content for soluble substances is 1,5 wt%.
Regulations for moisture content of NaCl are different depending on the salts origin.
The maximum content of moisture is 3 wt% for vacuum salt, 4 wt% for sea salt and 1
wt% for rock salt.
CaCl2 and MgCl2 are also used in Denmark, mostly at temperatures below -15 C.
CaCl2 can also be used in mix with NaCl to achieve a better result. Further, CaCl2 and
MgCl2 are used for dust control and stabilization of gravel roads in Denmark.

28
Following information must be presented when delivering CaCl2 and MgCl2
(Vejdirektoratet, 2006).
Particle size and shape/structure.
Content of CaCl2 determined as anhydrous product.
If it is delivered in crystallised form, brine or powder.
Content of other substances than NaCl, both soluble and insoluble. The
maximum content for soluble substances is 2 wt%.
29
5 Results and discussion
Based on the aim and objectives with this study, the results are presented and
discussed in this chapter.
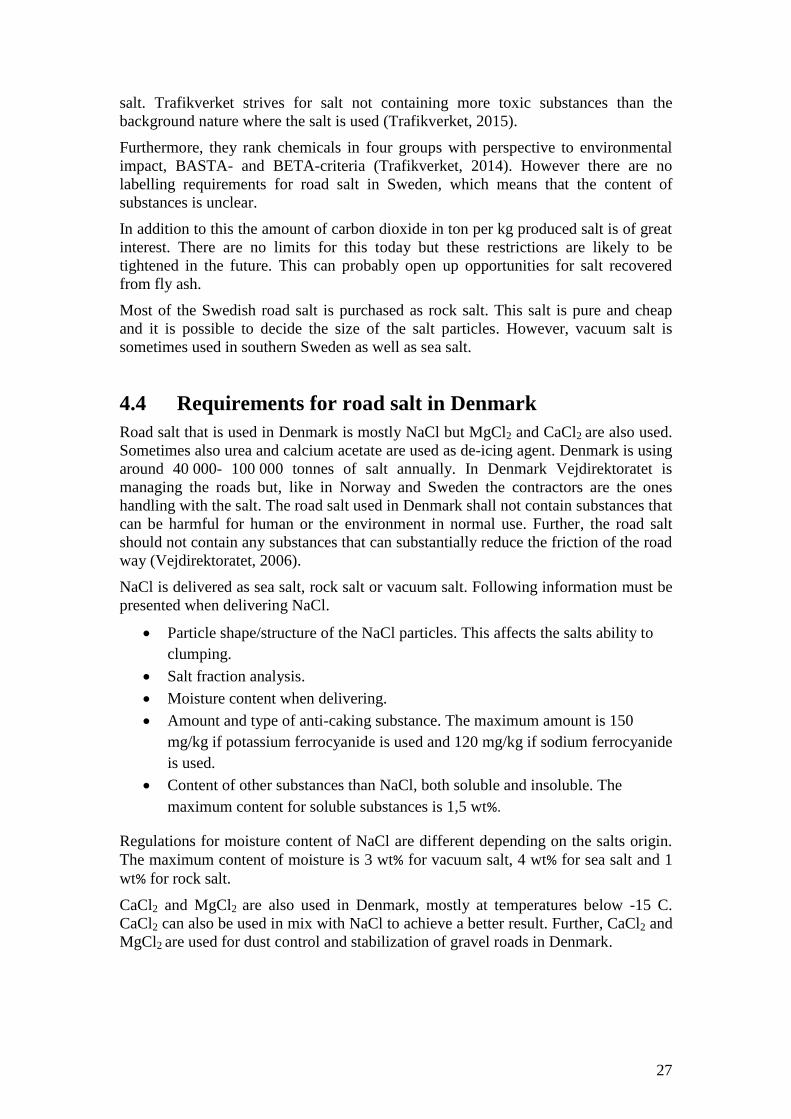
5.1 Salt composition
By the filtration process brines were generated. An important parameter is the amount
of salts dissolved in the brine. A higher concentration entails lower energy usage
during the crystallisation process. The results from the ion chromatography are
presented in Appendix B – Raw data. The elements are presented as ions dissolved in
the water. To calculate the proportion of different salts created when evaporating all
the water, an assumption is made. It is assumed that all chlorides is bonded to K, Mg,
Ca respectively Na. Determinations also shows that the amount of Cl is consumed at
the same time as all the metals K, Mg, Ca and Na are consumed. This confirms that
the assumption was reasonable. In Table 8 the amount of different salts dissolved in
the brine is presented. As can be seen, the brine from all the three sample points
consists of mostly NaCl, CaCl2 and KCl. Low concentrations of MgCl2 are also
presented. It can also be seen that the highest concentration of salts is in the brine
extracted from vessel 809 where the concentration of anhydrous salt is 17.3 wt%. The
diverted brine has low concentrations of salts because the brine is diluted by rainfall.
For this reason, brines extracted from vessel R4 and 809 are of greater interest.
Table 8 Salt concentration in brines from three different positions in the process
Salt concentration in brine [wt%]
Parameter R4, pH<12 809, pH>12 Diverted brine
NaCl 5.5 7.0 3.5
KCl 2.9 3.8 1.7
MgCl2 0.2 0.0 0.1
CaCl2 3.5 6.4 1.9
Sum anhydrous salt 12.2 17.3 7.1
Crystallised water H2O 1.4 2.1 0.7
Sum salt, crystallised water 13.6 19.4 7.9
The salt in the brines generated from the three different sample positions were
crystallised. The colours of the generated salts vary, see Figure 19. The reason for the
red hue, for the salts extracted from R4 vessel and from the salt extracted from the
brine diverted to the sea, is the increased amount of iron, which originates from the
sulfuric acid.

30
Figure 19 Salt extracted from the process on Langøya. The picture shows a) 809, b) R4 and c) diverted
brine. The sample positions can be seen in Figure 8.
In Table 9, the proportions of different anhydrous salts are presented. As seen the
highest concentration is NaCl in all the three different samples. The reason that the
amount of CaCl2 is lower in the R4 vessel than in vessel 809 is the reaction between
the sulfuric acid and the calcium that creates solid gypsum that precipitates from the
brine, see equation 10
𝐶𝑎 + 𝐻2𝑆𝑂4 → 𝐶𝑎𝑆𝑂4 + 𝐻2𝑂 (10)
Table 9 Proportion of different salts for anhydrous products
Proportion of different salts for anhydrous product [wt%]
Parameter R4, pH<12 809, pH>12 Diverted brine
NaCl 45.4 40.5 48.4
KCl 24.1 22.2 24.0
MgCl2 2.0 0.0 1.7
CaCl2 28.5 37.3 26.0
Sum 100 100 100
If the values instead is presented for CaCl2*2H2O and MgCl2*6H2O, the
concentrations of different salts in the dry product are different, see Table 10. These
values are of great interest since the salt, CaCl2 and MgCl2 are traded with crystallised
water and the price is also presented for salt with crystallised water.

31
Table 10 Proportion of different salts for salt with crystallised water
Proportion of different salts for salt with crystallised water [wt%]
Parameter R4, pH<12 809, pH>12 Diverted brine
CaCl2*2H2O 33.9 44.1 31.2
KCl 21.6 19.8 21.7
MgCl2*6H2O 3.8 0.0 3.2
NaCl 40.8 36.1 43.9
Sum 100 100 100
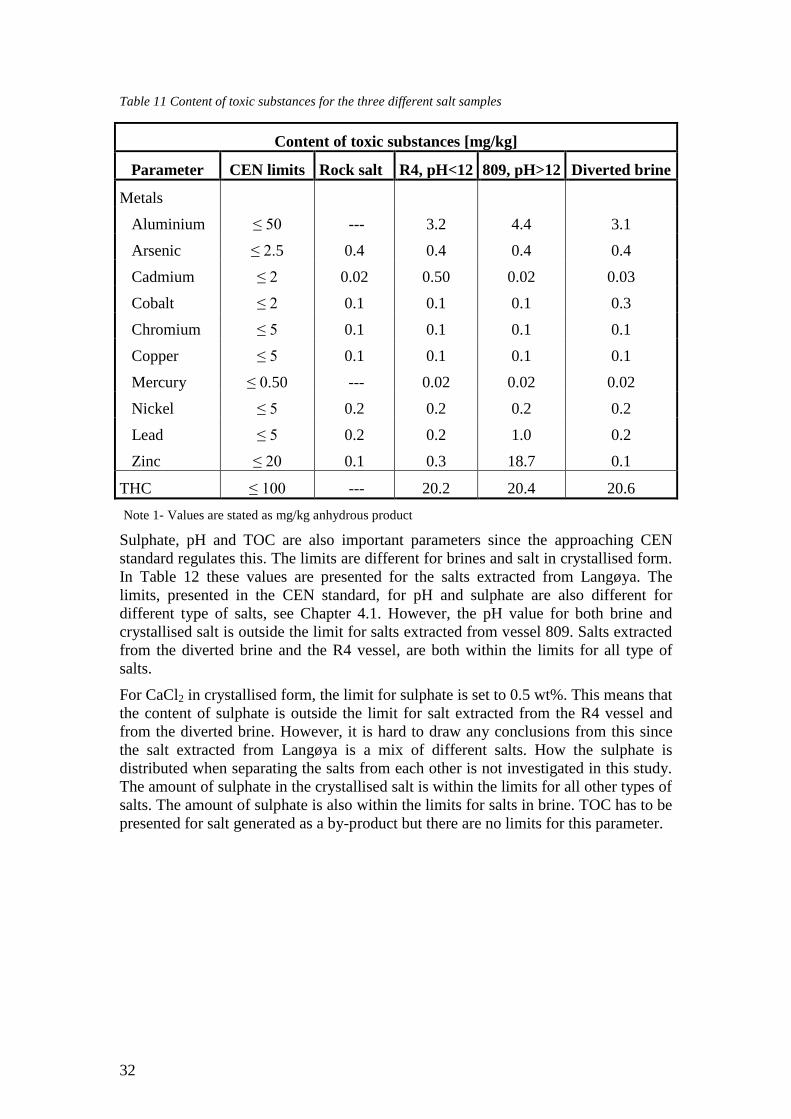
Since specific limits for toxic materials, like toxic metal compounds are unclear for
the Scandinavian countries, these parameters are compared with the CEN standard.
For metals and THC the limits are independent of what kind of salt that is studied.
The generated salts from Langøya compared with the CEN standard can be seen in
Table 11. For specific values for all the different samples, see Appendix B – Raw
data. The values are also compared with a NaCl rock salt that is spread on the
Scandinavian roads today. As can be seen, all values are within the limits and most of
them with a comfortable marginal. The only value that is close to the limit is zinc for
the salt extracted from vessel 809. As can be seen in Appendix B – Raw data, this
value is also over the limits, 24, respectively 29 mg/kg, for two of the three different
samples. This is equal to a standard deviation of 11,2. Salt extracted from vessel 809
may therefore cause problem when trading it as road salt if the zinc is not removed.
The amount of zinc can probably be reduced by decreasing the pH value, which
causes precipitation of zinc. For salt extracted from vessel R4 and from the diverted
water, all values are well within the limits. It can also be seen that the values for the
salt extracted from vessel R4 and from the diverted brine is close to the values for the
rock salt, which contributes to good opportunities for further usage as road salt. A
higher pH value entails that more metal compounds are leached to the brine. This is
the reason for the higher amount of metal compounds such as zinc and aluminium in
vessel 809 than in the R4 vessel.
32
Table 11 Content of toxic substances for the three different salt samples
Content of toxic substances [mg/kg]
Parameter CEN limits Rock salt R4, pH<12 809, pH>12 Diverted brine
Metals
Aluminium ≤ 50 --- 3.2 4.4 3.1
Arsenic ≤ 2.5 0.4 0.4 0.4 0.4
Cadmium ≤ 2 0.02 0.50 0.02 0.03
Cobalt ≤ 2 0.1 0.1 0.1 0.3
Chromium ≤ 5 0.1 0.1 0.1 0.1
Copper ≤ 5 0.1 0.1 0.1 0.1
Mercury ≤ 0.50 --- 0.02 0.02 0.02
Nickel ≤ 5 0.2 0.2 0.2 0.2
Lead ≤ 5 0.2 0.2 1.0 0.2
Zinc ≤ 20 0.1 0.3 18.7 0.1
THC ≤ 100 --- 20.2 20.4 20.6
Note 1- Values are stated as mg/kg anhydrous product
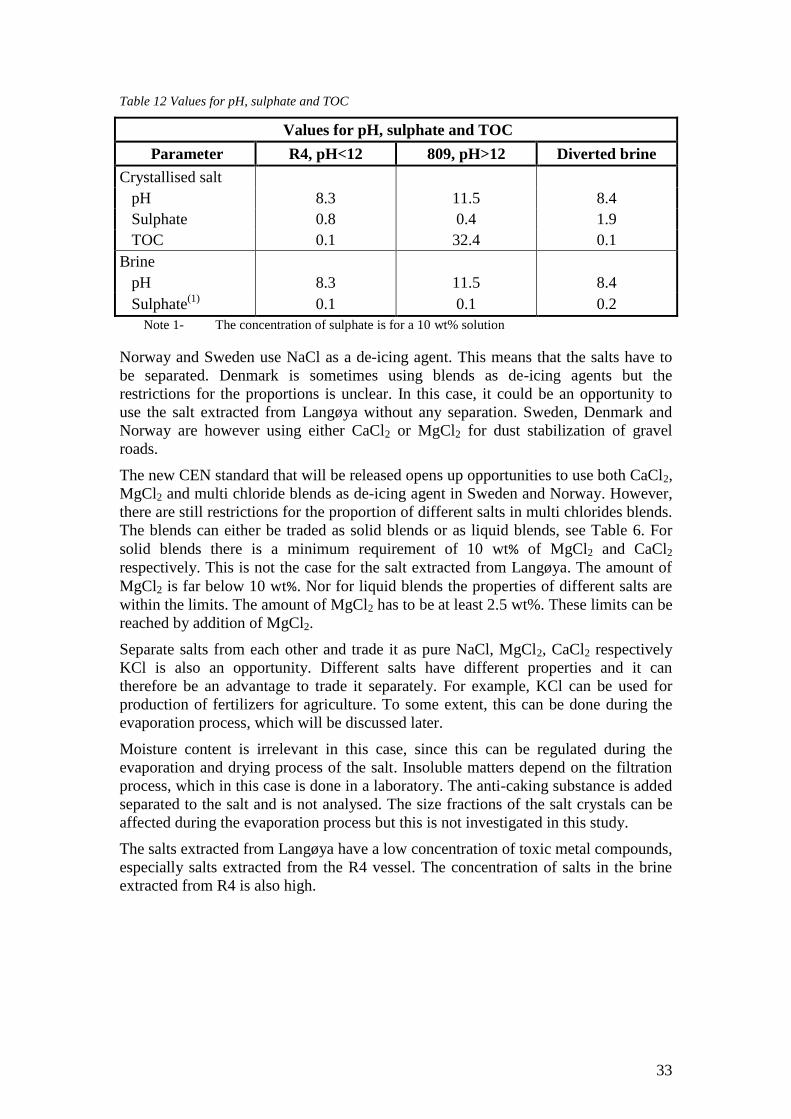
Sulphate, pH and TOC are also important parameters since the approaching CEN
standard regulates this. The limits are different for brines and salt in crystallised form.
In Table 12 these values are presented for the salts extracted from Langøya. The
limits, presented in the CEN standard, for pH and sulphate are also different for
different type of salts, see Chapter 4.1. However, the pH value for both brine and
crystallised salt is outside the limit for salts extracted from vessel 809. Salts extracted
from the diverted brine and the R4 vessel, are both within the limits for all type of
salts.
For CaCl2 in crystallised form, the limit for sulphate is set to 0.5 wt%. This means that
the content of sulphate is outside the limit for salt extracted from the R4 vessel and
from the diverted brine. However, it is hard to draw any conclusions from this since
the salt extracted from Langøya is a mix of different salts. How the sulphate is
distributed when separating the salts from each other is not investigated in this study.
The amount of sulphate in the crystallised salt is within the limits for all other types of
salts. The amount of sulphate is also within the limits for salts in brine. TOC has to be
presented for salt generated as a by-product but there are no limits for this parameter.
33
Table 12 Values for pH, sulphate and TOC
Values for pH, sulphate and TOC
Parameter R4, pH<12 809, pH>12 Diverted brine
Crystallised salt
pH 8.3 11.5 8.4
Sulphate 0.8 0.4 1.9
TOC 0.1 32.4 0.1
Brine
pH 8.3 11.5 8.4
Sulphate(1)
0.1 0.1 0.2
Note 1- The concentration of sulphate is for a 10 wt% solution
Norway and Sweden use NaCl as a de-icing agent. This means that the salts have to
be separated. Denmark is sometimes using blends as de-icing agents but the
restrictions for the proportions is unclear. In this case, it could be an opportunity to
use the salt extracted from Langøya without any separation. Sweden, Denmark and
Norway are however using either CaCl2 or MgCl2 for dust stabilization of gravel
roads.
The new CEN standard that will be released opens up opportunities to use both CaCl2,
MgCl2 and multi chloride blends as de-icing agent in Sweden and Norway. However,
there are still restrictions for the proportion of different salts in multi chlorides blends.
The blends can either be traded as solid blends or as liquid blends, see Table 6. For
solid blends there is a minimum requirement of 10 wt% of MgCl2 and CaCl2
respectively. This is not the case for the salt extracted from Langøya. The amount of
MgCl2 is far below 10 wt%. Nor for liquid blends the properties of different salts are
within the limits. The amount of MgCl2 has to be at least 2.5 wt%. These limits can be
reached by addition of MgCl2.
Separate salts from each other and trade it as pure NaCl, MgCl2, CaCl2 respectively
KCl is also an opportunity. Different salts have different properties and it can
therefore be an advantage to trade it separately. For example, KCl can be used for
production of fertilizers for agriculture. To some extent, this can be done during the
evaporation process, which will be discussed later.
Moisture content is irrelevant in this case, since this can be regulated during the
evaporation and drying process of the salt. Insoluble matters depend on the filtration
process, which in this case is done in a laboratory. The anti-caking substance is added
separated to the salt and is not analysed. The size fractions of the salt crystals can be
affected during the evaporation process but this is not investigated in this study.
The salts extracted from Langøya have a low concentration of toxic metal compounds,
especially salts extracted from the R4 vessel. The concentration of salts in the brine
extracted from R4 is also high.
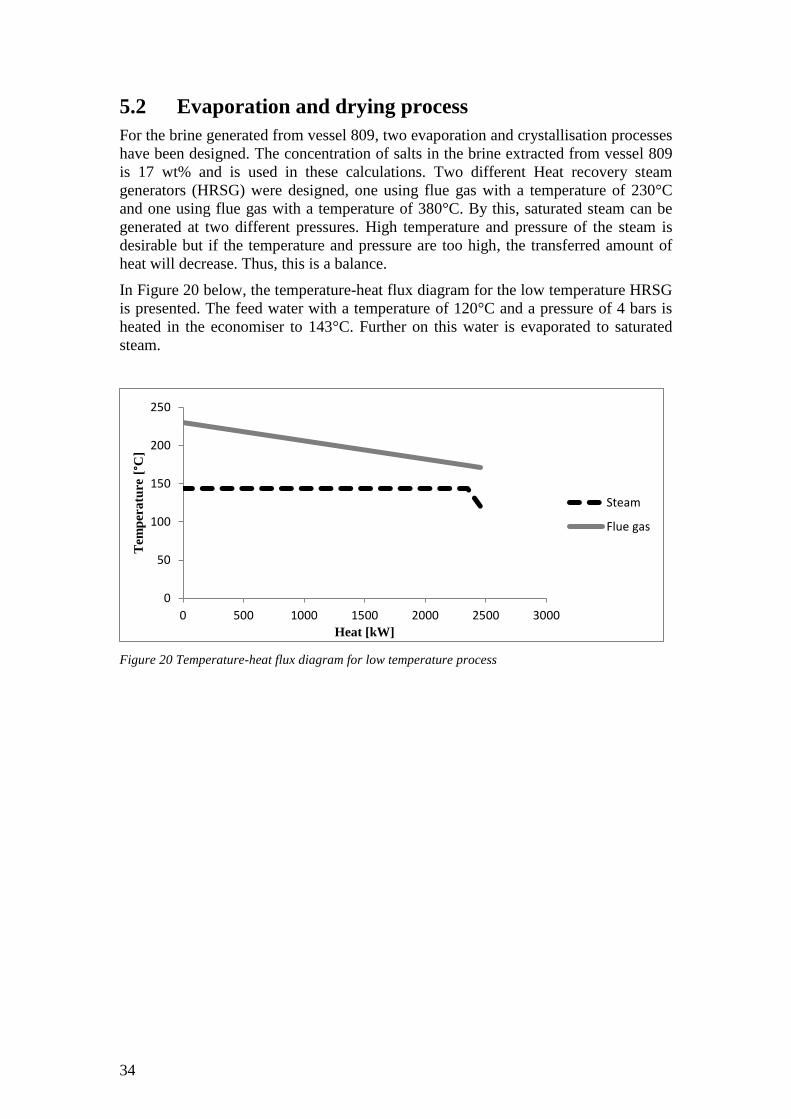
34
5.2 Evaporation and drying process
For the brine generated from vessel 809, two evaporation and crystallisation processes
have been designed. The concentration of salts in the brine extracted from vessel 809
is 17 wt% and is used in these calculations. Two different Heat recovery steam
generators (HRSG) were designed, one using flue gas with a temperature of 230°C
and one using flue gas with a temperature of 380°C. By this, saturated steam can be
generated at two different pressures. High temperature and pressure of the steam is
desirable but if the temperature and pressure are too high, the transferred amount of
heat will decrease. Thus, this is a balance.
In Figure 20 below, the temperature-heat flux diagram for the low temperature HRSG
is presented. The feed water with a temperature of 120°C and a pressure of 4 bars is
heated in the economiser to 143°C. Further on this water is evaporated to saturated
steam.
Figure 20 Temperature-heat flux diagram for low temperature process
0
50
100
150
200
250
0 500 1000 1500 2000 2500 3000
Tem
per
atu
re [
°C]
Heat [kW]
Steam
Flue gas
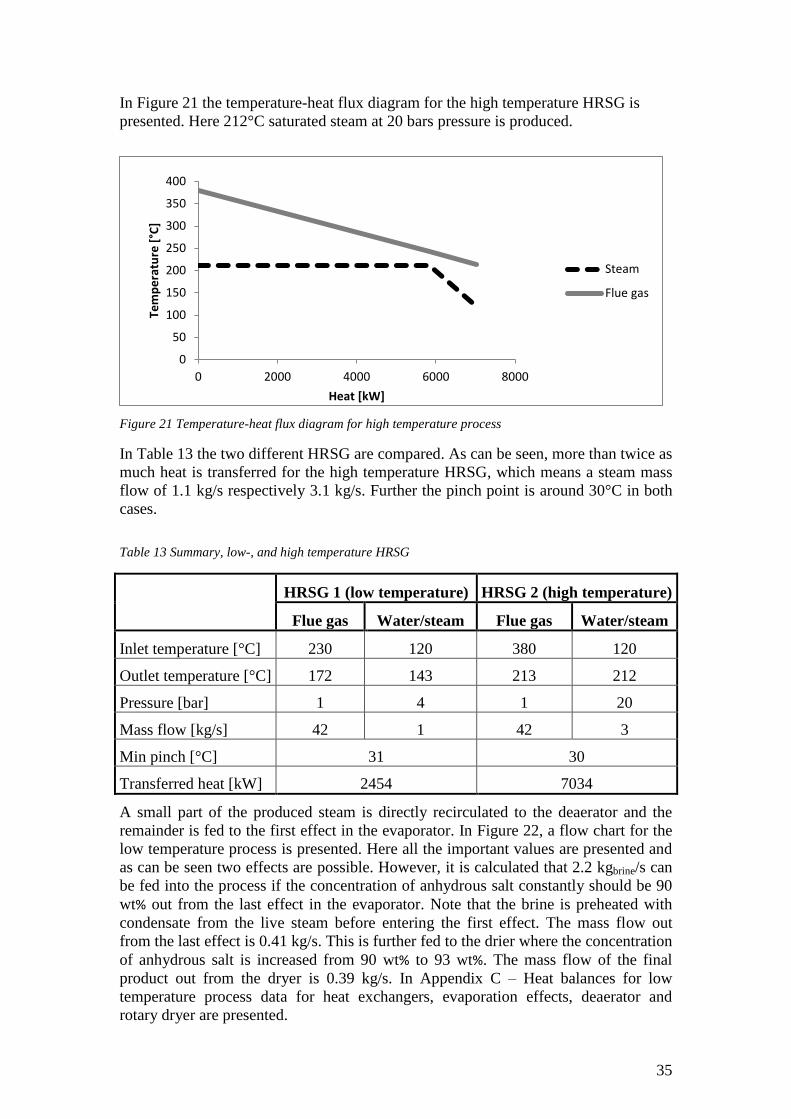
35
In Figure 21 the temperature-heat flux diagram for the high temperature HRSG is
presented. Here 212°C saturated steam at 20 bars pressure is produced.
Figure 21 Temperature-heat flux diagram for high temperature process
In Table 13 the two different HRSG are compared. As can be seen, more than twice as
much heat is transferred for the high temperature HRSG, which means a steam mass
flow of 1.1 kg/s respectively 3.1 kg/s. Further the pinch point is around 30°C in both
cases.
Table 13 Summary, low-, and high temperature HRSG
HRSG 1 (low temperature) HRSG 2 (high temperature)
Flue gas Water/steam Flue gas Water/steam
Inlet temperature [°C] 230 120 380 120
Outlet temperature [°C] 172 143 213 212
Pressure [bar] 1 4 1 20
Mass flow [kg/s] 42 1 42 3
Min pinch [°C] 31 30
Transferred heat [kW] 2454 7034
A small part of the produced steam is directly recirculated to the deaerator and the
remainder is fed to the first effect in the evaporator. In Figure 22, a flow chart for the
low temperature process is presented. Here all the important values are presented and
as can be seen two effects are possible. However, it is calculated that 2.2 kgbrine/s can
be fed into the process if the concentration of anhydrous salt constantly should be 90
wt% out from the last effect in the evaporator. Note that the brine is preheated with
condensate from the live steam before entering the first effect. The mass flow out
from the last effect is 0.41 kg/s. This is further fed to the drier where the concentration
of anhydrous salt is increased from 90 wt% to 93 wt%. The mass flow of the final
product out from the dryer is 0.39 kg/s. In Appendix C – Heat balances for low
temperature process data for heat exchangers, evaporation effects, deaerator and
rotary dryer are presented.
0
50
100
150
200
250
300
350
400
0 2000 4000 6000 8000
Tem
pe
ratu
re [
°C]
Heat [kW]
Steam
Flue gas
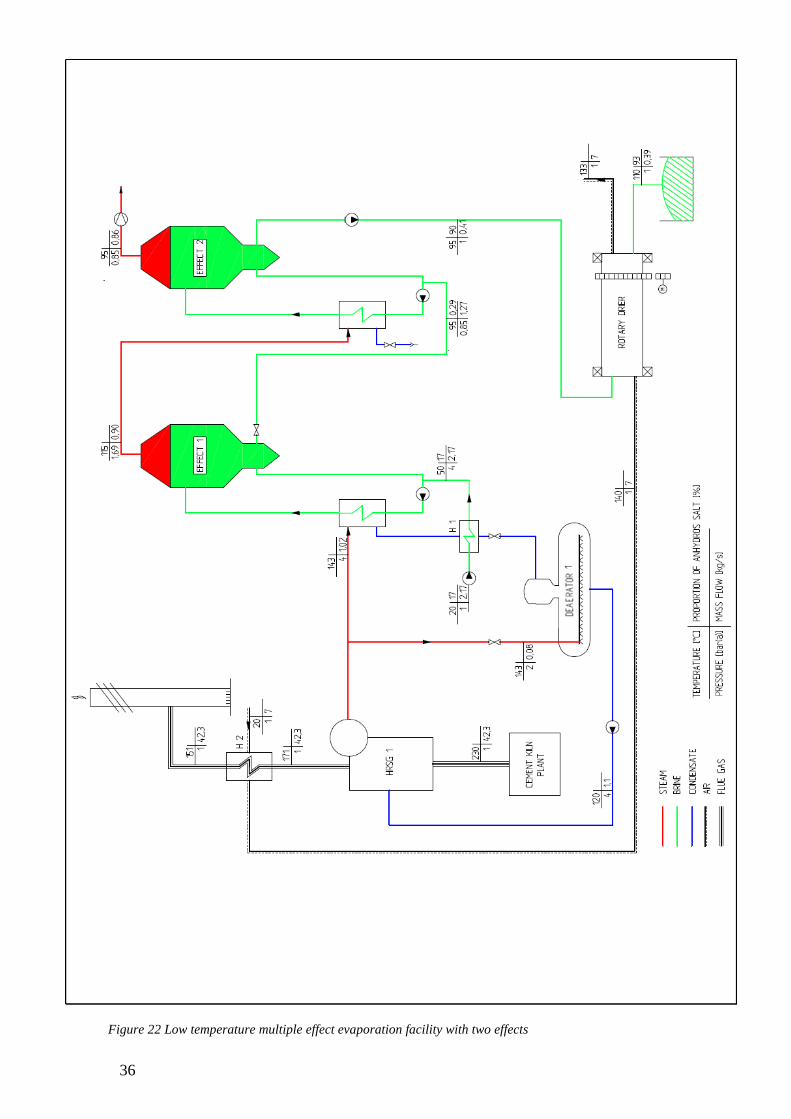
36
Figure 22 Low temperature multiple effect evaporation facility with two effects

37
In Figure 23, the flow chart for the high temperature process are shown where also all
important values are presented. The principle is the same as for the low temperature
evaporator facility. Since the temperature and pressure of the live steam is higher, 5
effects are possible. Here, 13.2 kgbrine/s are fed into the first effect. This brine is
preheated in two steps. The mass flow out from the last effect is 2.5 kg/s. The slurry
containing 90 wt% anhydrous salt is then dried in the rotary dryer to 93 wt%
anhydrous salt. The mass flow of the final product out from the dryer is 2.4 kg/s. In
Appendix D – Heat balances for high temperature process, data for heat exchangers,
evaporation effects, deaerator and rotary dryer are presented.
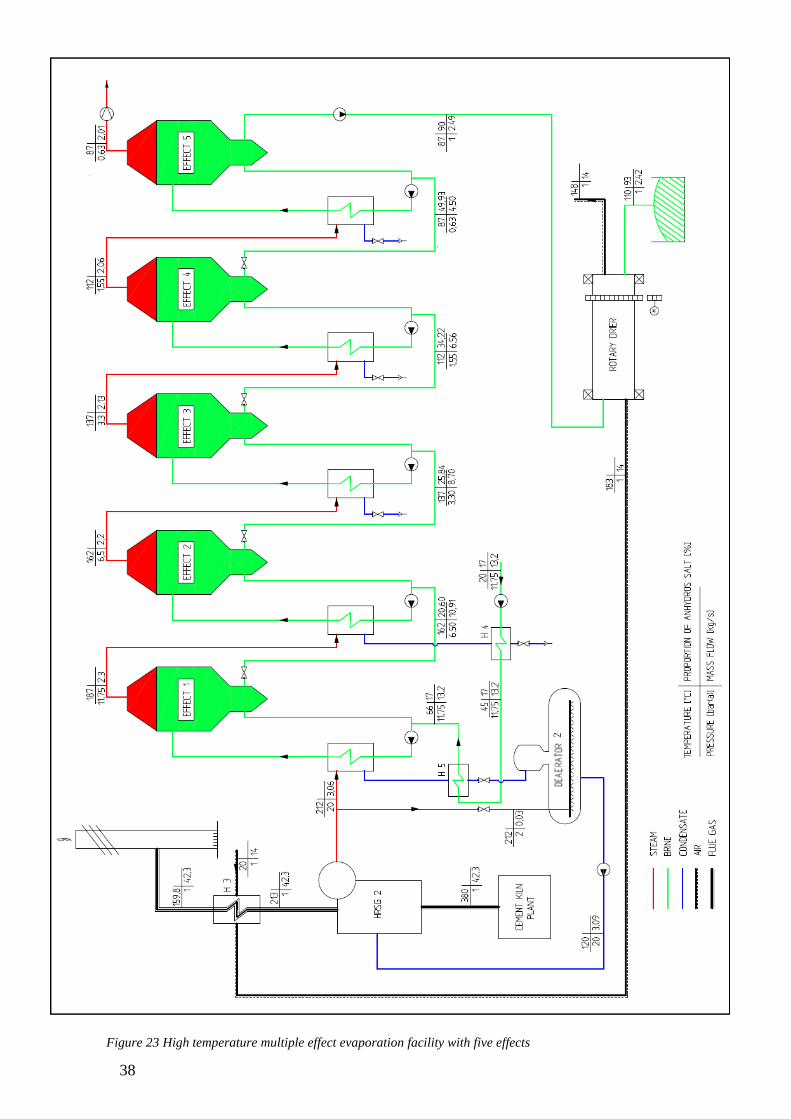
38
Figure 23 High temperature multiple effect evaporation facility with five effects
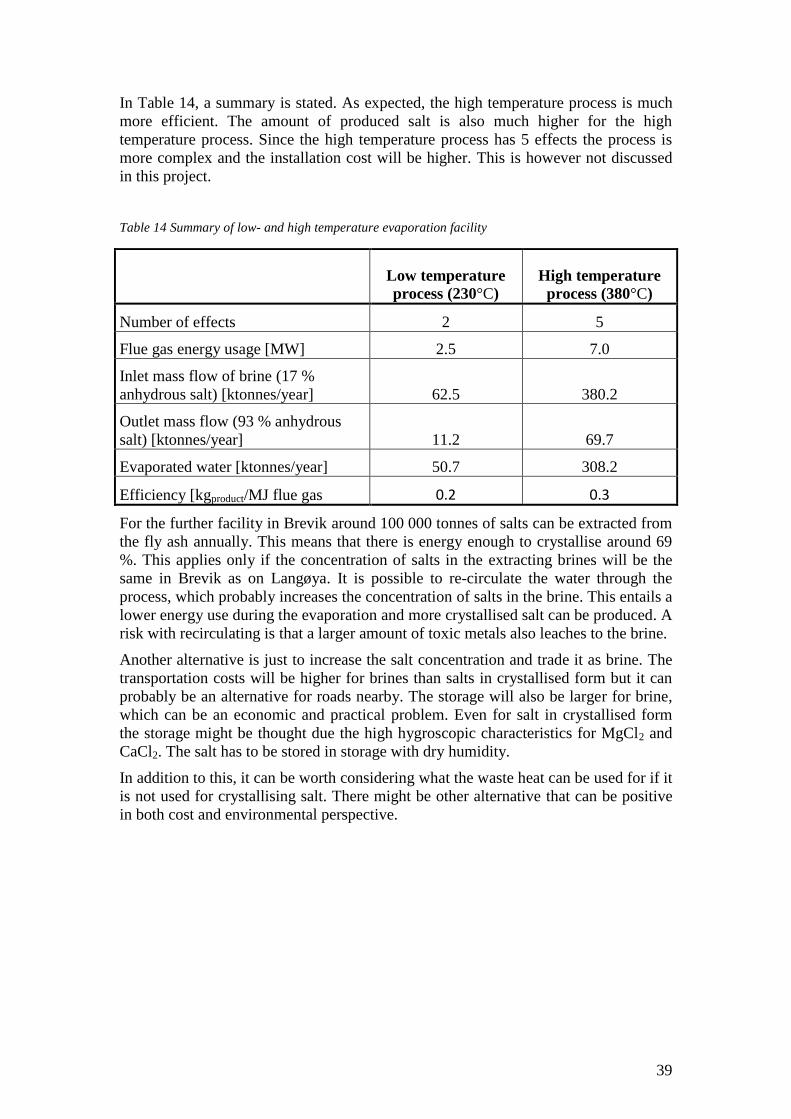
39
In Table 14, a summary is stated. As expected, the high temperature process is much
more efficient. The amount of produced salt is also much higher for the high
temperature process. Since the high temperature process has 5 effects the process is
more complex and the installation cost will be higher. This is however not discussed
in this project.
Table 14 Summary of low- and high temperature evaporation facility
Low temperature
process (230°C)
High temperature
process (380°C)
Number of effects 2 5
Flue gas energy usage [MW] 2.5 7.0
Inlet mass flow of brine (17 %
anhydrous salt) [ktonnes/year] 62.5 380.2
Outlet mass flow (93 % anhydrous
salt) [ktonnes/year] 11.2 69.7
Evaporated water [ktonnes/year] 50.7 308.2
Efficiency [kgproduct/MJ flue gas 0.2 0.3
For the further facility in Brevik around 100 000 tonnes of salts can be extracted from
the fly ash annually. This means that there is energy enough to crystallise around 69
%. This applies only if the concentration of salts in the extracting brines will be the
same in Brevik as on Langøya. It is possible to re-circulate the water through the
process, which probably increases the concentration of salts in the brine. This entails a
lower energy use during the evaporation and more crystallised salt can be produced. A
risk with recirculating is that a larger amount of toxic metals also leaches to the brine.
Another alternative is just to increase the salt concentration and trade it as brine. The
transportation costs will be higher for brines than salts in crystallised form but it can
probably be an alternative for roads nearby. The storage will also be larger for brine,
which can be an economic and practical problem. Even for salt in crystallised form
the storage might be thought due the high hygroscopic characteristics for MgCl2 and
CaCl2. The salt has to be stored in storage with dry humidity.
In addition to this, it can be worth considering what the waste heat can be used for if it
is not used for crystallising salt. There might be other alternative that can be positive
in both cost and environmental perspective.
40
6 Conclusions
Salt was extracted from three different positions in NOAH´s facility on Langøya. The
most important thing in this study was to find out whether the properties of the
extracted salt reaches the regularly framework in Scandinavia today. Since the
regulatory framework for road salt in Scandinavia today is flawed, many parameters
were compared to a new CEN-standard, which handles road salt. The concentration of
toxic metals is well within the limits for the salt extracted from the R4 vessel and
from the diverted brine. For salt extracted from vessel 809 the concentration of zinc is
close to the limit, which is probably due to the high pH value. Further the pH value is
too high for the salt extracted from vessel 809. Since the salt extracted from the R4
vessel is neutralised with sulfuric acid the pH value is lower and within the limits.
This means that in this case the salt extracted from the R4 vessel is the best
alternative. However the concentration of salts in the R4 vessel is lower than in the
vessel 809. This is a drawback during the crystallisation process.
The salt extracted from all the samples is a mixture of mainly CaCl2 KCl and NaCl. A
small part is also MgCl2. Today most of the salt used for de-icing is NaCl, mainly
because of the low price. Other salts are also used sometimes for de-icing and CaCl2
and MgCl2 are also used for dust control of gravel roads. A mix of different salts is
used sometimes but there are still regulations for the proportions of different salts.
The salts extracted from Langøya are not totally within these limits.
There are two ways to solve this problem. One way is to add specific salts to reach the
right proportions for the blend. The other way is to separate the different salts from
each other. This can probably be done during the crystallisation process.
The salt can be traded both as brine and in crystallised form. Most of the salt is today
traded in crystallised form due to the lower transportation cost. For NOAH´s further
facility in Brevik waste heat from Norcem AS cement industry can be used to
evaporate the water in the brine. Two different calculations were performed for two
different temperatures of the waste heat, 230 °C and 380 °C. The multiple effect
evaporation facility designed for the highest temperature was found to be much better.
The high temperature evaporation facility was designed with 5 effects and a following
drier. From this process around 380 000 tonnes can be evaporated annually. This
means a total production of around 70 000 ton of salts annually, which corresponds to
18 % of the total consumption of road salt in Scandinavia. The high temperature
evaporating facility produces more than six times more salt than the low temperature
evaporation facility, which only has two effects.
In a multiple effect evaporator there are also possibilities to separate different salts
from each other, which can be desirable. If the different salts are separated from each
other, KCl can be used for production of fertilizer for the agriculture. There is a
company that has succeeded to separate salts, with similar compositions, from each
other, which prove that this is possible (Ragn-Sells, 2016). There is a great potential
in this project and the obstacles are small. There are still some areas, which need to
investigate in more detail before a complete concept can be presented.
41
7 Further challenges
The salt extracted from Langøya is a mix of mainly CaCl2 KCl and NaCl. It
may be favourable to trade with the salts separated from each other. This
separation might eventually be done during the evaporation process by
utilizing precipitation of various salts at different concentrations. To know if
this is possible, further tests need to done. A test where the brine is evaporated
in many steps and where the precipitated crystals after each step are separated
by filtering should be performed. All these salt samples must then be analysed.
NaCl and CaCl2 have saturation points far away from each other and are thus
theoretically easy to separate. It is more difficult to separate NaCl from KCl.
The temperature of the brine during the evaporation in different steps can also
be varied since the solubility as a function of temperature is various for
different salts. In a real process the precipitated salt crystals have to be
extracted between each step. By changing the number of effects and the
pressure in each effect, the concentration and amount of precipitated crystals
can be varied. In this way salts can be separated from each other, completely
or partially.
The concentration of toxic metal compounds in the salt extracted from
Langøya is low, especially for the salt extracted from the R4 vessel. However
it is still unclear how the toxic substances are affected if the salts are separated
from each other. A new test for separated salts has to be done to assure that not
all toxic metals are bound to a certain salt. This can entail that the toxic
contents are above the limits.
The energy usage during the evaporation process can be minimised by
increasing the concentration of salts in the incoming brine. This can eventually
be done by recirculating the water that is used for leaching the salts from the
fly ash. A risk with this is that also the concentration of toxic metals increase
in the brine. Further test with recirculating water can advantageously be
carried out.
An important parameter for road salts is the fractions of the crystals. Different
evaporation technologies lead to different size of the salts. This has to be
investigated in more detail.
A possibility is to trade the salt as brine. The amount of energy during the
evaporation process will reduce but on other hand the transportation- and
storage cost will increase. An economic- and environmental evaluation has to
be prepared.

42
An economic calculation for both running cost and the fixed cost for
installation of a new facility has to be prepared. The revenues for the traded
salt should cover these costs.
Analyse the salts in order to find out if there are presence of other toxic
substances, such as dioxins. It is not likely but should still be checked for
safety.
43
8 List of literature
Allan, 2015. [Online]
Available at: http://www.sciencegeek.net/Chemistry/taters/solubility.htm
[Used 24 04 2016].
Anon., 2009. [Online]
Available at: http://pudeb.com/reciprocating-grate-wood-boiler-and-heating-systems-
wellons-fei/
[Used 22 05 2016].
Anon., 2012. http://www.fhwa.dot.gov/publications/research/safety/95202/005.cfm.
[Online]
Available at: http://www.fhwa.dot.gov/publications/research/safety/95202/005.cfm
[Used 03 06 2016].
Azifi, A., 2016. Interview With Anissa Azifi, CEN, Brussel [Intervju] (11 02 2016).
Breinholt Jensen, M., 2015. Ny behandlingsmetode av farlig avfall med CO2-rik røykgass,
u.o.: NOAH AS.
Breinholt Jensen, M., 2016. [Intervju] (15 02 2016).
CEN, 2016. European Committee for standardization. [Online]
Available at: https://www.cen.eu/about/Pages/default.aspx
[Used 15 02 2016].
CEN, 2016. European Committee for standardization. [Online]
Available at: https://www.cen.eu/about/RoleEurope/Pages/default.aspx
[Used 15 02 2016].
CEN, 2016. Winter service equipment and products - De-icing agents -Part 1: Sodium chloride
- Requirements and test methods, Brussel: European committee for standardization.
CEN, 2016. Winter services equipment and products - De-icing agents - Part 2: Calcium
chloride and Magnesium chloride - Requirements and test methods, u.o.: CEN.
Cewep, 2009. Enviromentally sound use of bottom ash, u.o.: Cewep.
Choi, B. S., 2005. CRYSTALLIZATION CHARACTERISTICS OF NaCl CRYSTAL SIZE DISTRIBUTION
ASSOCIATED WITH A CMSMPR CRYSTALLIZER, u.o.: The University of Utah.
Demmer, R., 2014. Vission on winter road maintenance , u.o.: Akzo Nobell.
Eide, F., 2016. Hansson % Möhring [Intervju] (18 02 2016).
Freddy Knudsen, K. N. A. A. B. N. K. M. R., 2014. Vintertjeneste i de Nordiske land.
Statusrapport 2014, Norge: NVF.
GEA, 2012. Mass Crystallization from solutions, Duisburg: GEA.

44
Geertman, R. M., 2000. Sodium Chloride: Crysallization, u.o.: Akzo Nobel.
Gustafsson, M., Blomqvist, G., Jonsson, G. & Ferm, M., 2010. Effekter av dammbindning av
belagda vägar, u.o.: IVL.
Hailong, T., Aris, E. & Yangsheng, L., 2014. Recovery of soluble chlorides salts from the
wastewater generated during the washing process of municipal solid wastes incineration fly
ash, Bijing: Peking University.
Karlfeldt Fedje, K., 2010. Metals in MSWI fly ash - problems or opportunities, Göteborg:
Chalmers Univeristy of Technology.
Larson, D., 2008. [Online]
Available at: http://www.foothill.edu/attach/psme/sinha.fpdepression.pdf
[Used 14 03 2016].
Marit Lægreid , 2014. Oppsummering av aske fra A til Å, u.o.: NOAH AS.
Metso, 2010. Metso Power AB. u.o.:u.n.
Nayak, M., 2012. Design and simulation of a multiple-effect evaporator using vapor bleeding,
u.o.: Department of chemical engineering national institute of technology, Rourkela.
Nikolai, V. K., 1997. Advanced energy systems. Berlin: Taylor & Francis.
NOAH, 2016. [Online]
Available at: http://www.NOAH.no/wp-content/uploads/2016/03/Behandlingssted-
Lang%C3%B8ya.jpg
[Used 13 05 2016].
NOAH, 2016. NOAH AS. [Online]
Available at: http://www.NOAH.no/For-kunder/Behandlingssteder/Lang%C3%B8ya
[Used 14 03 2016].
Peña, J. A. P., 2011. Bubbling Fluidized Bed (BFB), When to use this technology?, Madrid:
Foster Wheeler Global Power Group.
Ragn-Sells, 2016. Ragn-Sells. [Online]
Available at: http://www.mynewsdesk.com/se/ragnsells/pressreleases/kommersiella-salter-
utvinns-ur-aska-fraan-avfallsfoerbraenning-1402014
[Used 17 05 2016].
Rasmussen, E., 2015. Sambehandling af RGA og scrubber væske fra forbrændingsanlæg med
HALOSEP processen, København: Miljøstyrelsen.
Renova, u.d. [Online]
Available at: http://www.renova.se/om-renova/anlaggningar/avfallskraftvarmeverket/
[Used 21 05 2016].

45
Ronald D. Bell, G. E. S. F. B. M. M. R. G., u.d. CALCIUM CARBONATE SCRUBBING OF
HYDROGEN CHLORIDE IN FLUE GASES, Texas: u.n.
Sassan, S., 2009. Human Settlement Development. 3 red. Oxford: UNESCO.
Teir, S., 2002. Modern Boiler Types and Applications, Helsinki: Helsinki University of
Technology Department of Mechanical Engineering .
Trafikverket, 2014. Trafikverket. [Online]
Available at: http://www.trafikverket.se/for-dig-i-branschen/miljo/Material-och-kemiska-
produkter/Farliga-amnen-i-material-och-varor/Kriterier-for-bedomning-av-farliga-amnen-i-
material-och-varor/
[Used 19 02 2016].
Trafikverket, 2015. Trafikverket. [Online]
Available at: http://www.trafikverket.se/resa-och-trafik/underhall-av-vag-och-jarnvag/Sa-
skoter-vi-vagar/Vintervaghallning/Vagsalt/
[Used 01 02 2016].
Trafikverket, 2015. Trafikverket. [Online]
Available at: http://www.trafikverket.se/resa-och-trafik/underhall-av-vag-och-jarnvag/Sa-
skoter-vi-vagar/Vintervaghallning/Vagsalt/Om-vagsalt/
[Used 01 02 2016].
Vegvesen, S., 2014. D2 Tegninger og supplerende dokumenter D2-ID9300a Bruk av salt, u.o.:
Statens vegvesen.
Vejdirektoratet, 2006. VEJEDRIFT Tømidler, sand og grus til glatførebekæmpelse, u.o.: u.n.
Westin, J., 2013. Avfallsverige. [Online]
Available at: http://www.avfallsverige.se/statistik-index/avfallsstatistik/
[Used 29 01 2016].
Wikman, K., Berg, M. & Nordin, A., 2003. Termisk rening av askor, Stockholm : u.n.
Wikström, A., 2016. Saltning av vintervägar - en otidsenlig metod, Luleå: Luleå tekniska
universitet.
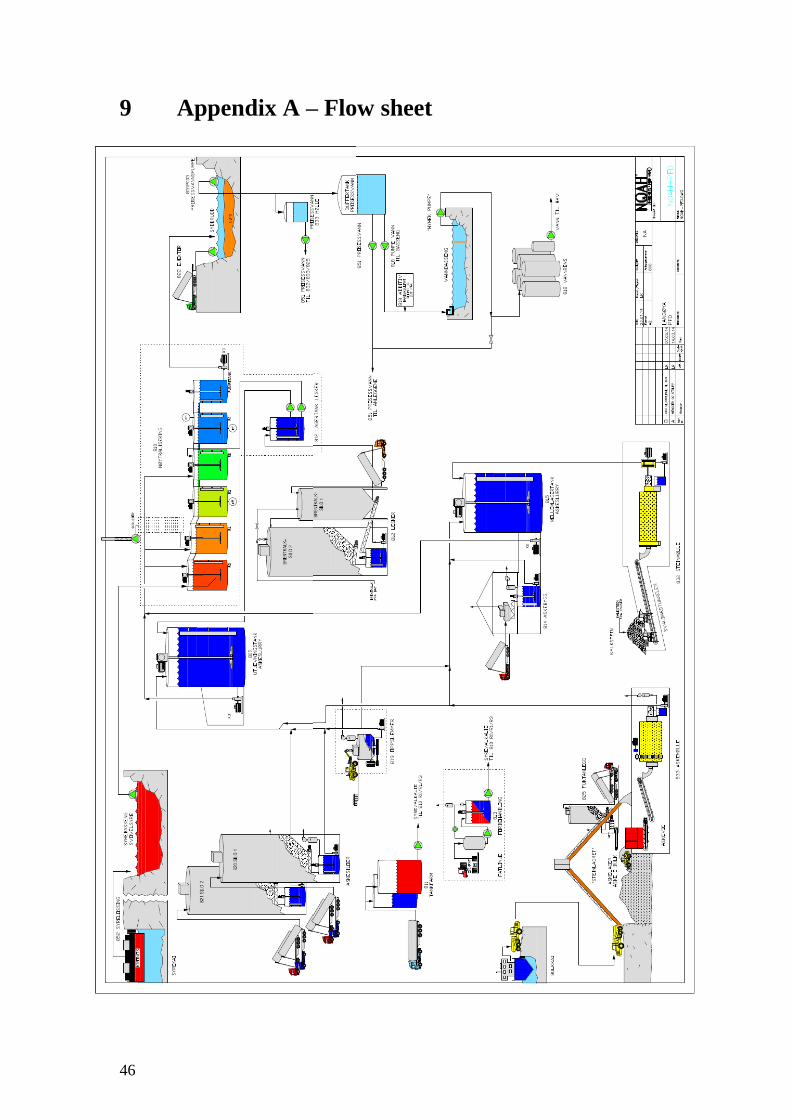
46
9 Appendix A – Flow sheet
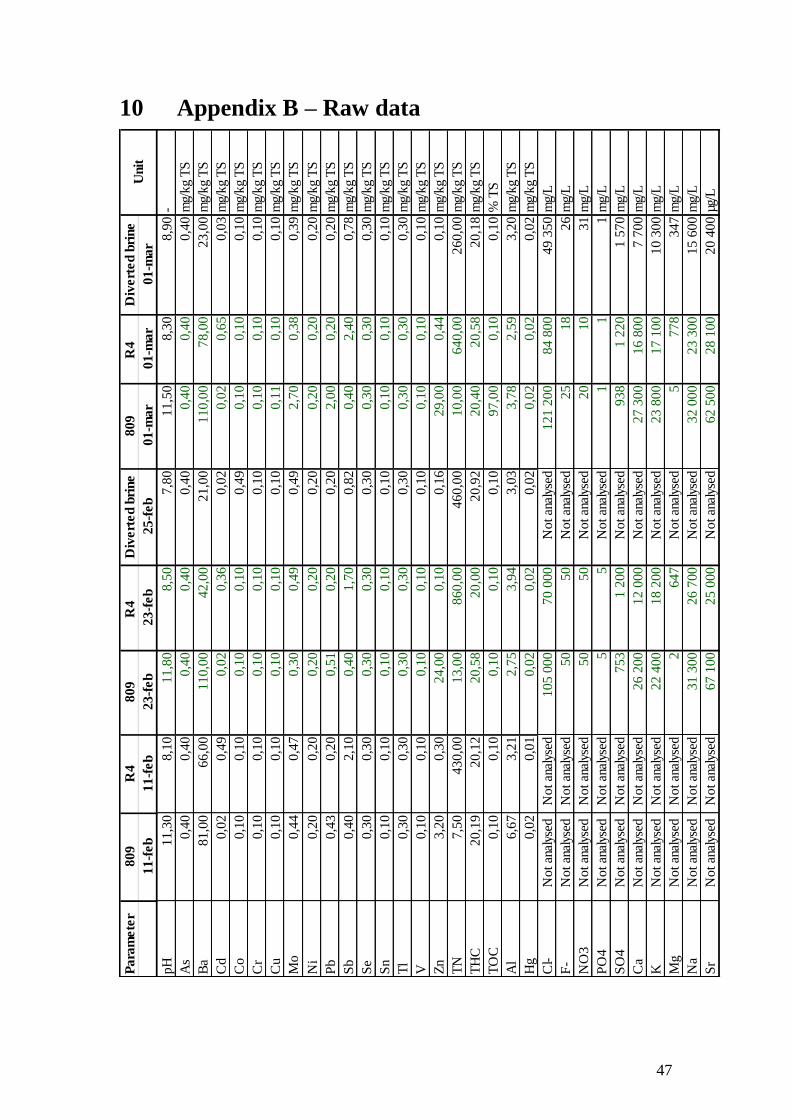
47
10 Appendix B – Raw data
Pa
ram
ete
r809
R4
809
R4
D
ivert
ed b
rine
809
R4
D
ivert
ed b
rine
11
-feb
11
-feb
23
-feb
23
-feb
25
-feb
01
-ma
r0
1-m
ar
01
-ma
r
pH
11,3
08,1
011,8
08,5
07,8
011,5
08,3
08,9
0-
As
0,4
00,4
00,4
00,4
00,4
00,4
00,4
00,4
0m
g/k
g T
S
Ba
81,0
066,0
0110,0
042,0
021,0
0110,0
078,0
023,0
0m
g/k
g T
S
Cd
0,0
20,4
90,0
20,3
60,0
20,0
20,6
50,0
3m
g/k
g T
S
Co
0,1
00,1
00,1
00,1
00,4
90,1
00,1
00,1
0m
g/k
g T
S
Cr
0,1
00,1
00,1
00,1
00,1
00,1
00,1
00,1
0m
g/k
g T
S
Cu
0,1
00,1
00,1
00,1
00,1
00,1
10,1
00,1
0m
g/k
g T
S
Mo
0,4
40,4
70,3
00,4
90,4
92,7
00,3
80,3
9m
g/k
g T
S
Ni
0,2
00,2
00,2
00,2
00,2
00,2
00,2
00,2
0m
g/k
g T
S
Pb
0,4
30,2
00,5
10,2
00,2
02,0
00,2
00,2
0m
g/k
g T
S
Sb
0,4
02,1
00,4
01,7
00,8
20,4
02,4
00,7
8m
g/k
g T
S
Se
0,3
00,3
00,3
00,3
00,3
00,3
00,3
00,3
0m
g/k
g T
S
Sn
0,1
00,1
00,1
00,1
00,1
00,1
00,1
00,1
0m
g/k
g T
S
Tl
0,3
00,3
00,3
00,3
00,3
00,3
00,3
00,3
0m
g/k
g T
S
V0,1
00,1
00,1
00,1
00,1
00,1
00,1
00,1
0m
g/k
g T
S
Zn
3,2
00,3
024,0
00,1
00,1
629,0
00,4
40,1
0m
g/k
g T
S
TN
7,5
0430,0
013,0
0860,0
0460,0
010,0
0640,0
0260,0
0m
g/k
g T
S
TH
C20,1
920,1
220,5
820,0
020,9
220,4
020,5
820,1
8m
g/k
g T
S
TO
C0,1
00,1
00,1
00,1
00,1
097,0
00,1
00,1
0%
TS
Al
6,6
73,2
12,7
53,9
43,0
33,7
82,5
93,2
0m
g/k
g T
S
Hg
0,0
20,0
10,0
20,0
20,0
20,0
20,0
20,0
2m
g/k
g T
S
Cl-
No
t an
alys
ed
No
t an
alys
ed105 0
00
70 0
00
No
t an
alys
ed121 2
00
84 8
00
49 3
50
mg/
L
F-
No
t an
alys
ed
No
t an
alys
ed50
50
No
t an
alys
ed25
18
26
mg/
L
NO
3N
ot an
alys
ed
No
t an
alys
ed50
50
No
t an
alys
ed20
10
31
mg/
L
PO
4N
ot an
alys
ed
No
t an
alys
ed5
5N
ot an
alys
ed1
11
mg/
L
SO
4N
ot an
alys
ed
No
t an
alys
ed753
1 2
00
No
t an
alys
ed938
1 2
20
1 5
70
mg/
L
Ca
No
t an
alys
ed
No
t an
alys
ed26 2
00
12 0
00
No
t an
alys
ed27 3
00
16 8
00
7 7
00
mg/
L
KN
ot an
alys
ed
No
t an
alys
ed22 4
00
18 2
00
No
t an
alys
ed23 8
00
17 1
00
10 3
00
mg/
L
Mg
No
t an
alys
ed
No
t an
alys
ed2
647
No
t an
alys
ed5
778
347
mg/
L
Na
No
t an
alys
ed
No
t an
alys
ed31 3
00
26 7
00
No
t an
alys
ed32 0
00
23 3
00
15 6
00
mg/
L
Sr
No
t an
alys
ed
No
t an
alys
ed67 1
00
25 0
00
No
t an
alys
ed62 5
00
28 1
00
20 4
00
µg/L
Unit

48
11 Appendix C – Heat balances for low
temperature process
In following appendix heat balances for all equipment in the low temperature
evaporator process are presented. All tables and figures below can be coupled the
flow sheet presented in Figure 22
HRSG 1
Primary side Secondary side
Flue gas
inlet
Flue gas
outlet
Water
inlet
Steam
outlet
Temperature [°C] 230.0 171.6 120.0 143.0
Pressure [bar] 1.0 4.0
Cp [kJ/(kgK)] 1.0 4.2 ---
Enthalpy [kJ/kg] --- 503.8 2738.0
Mass flow [kg/s] 42.0 1.1
Heat of vaporization [kJ/kg] --- 2134.0
Min pinch [°C] 31.1
Transferred heat [kW] 2453.7
Air heater (HX1)
Flue gas Air
Inlet temperature [°C] 171.6 20.0
Outlet temperature [°C] 151.6 140.0
Cp [kJ/(kgK)] 1.0 1.0
Mass flow [kg/s] 42.0 7.0
Min pinch [°C] 31.6
Transferred heat [kW] 840.0
0
20
40
60
80
100
120
140
160
180
200
0 200 400 600 800 1000
Tem
per
atu
re [
°C]
Heat [kW]
Air heater HX1
Air
Flue gas
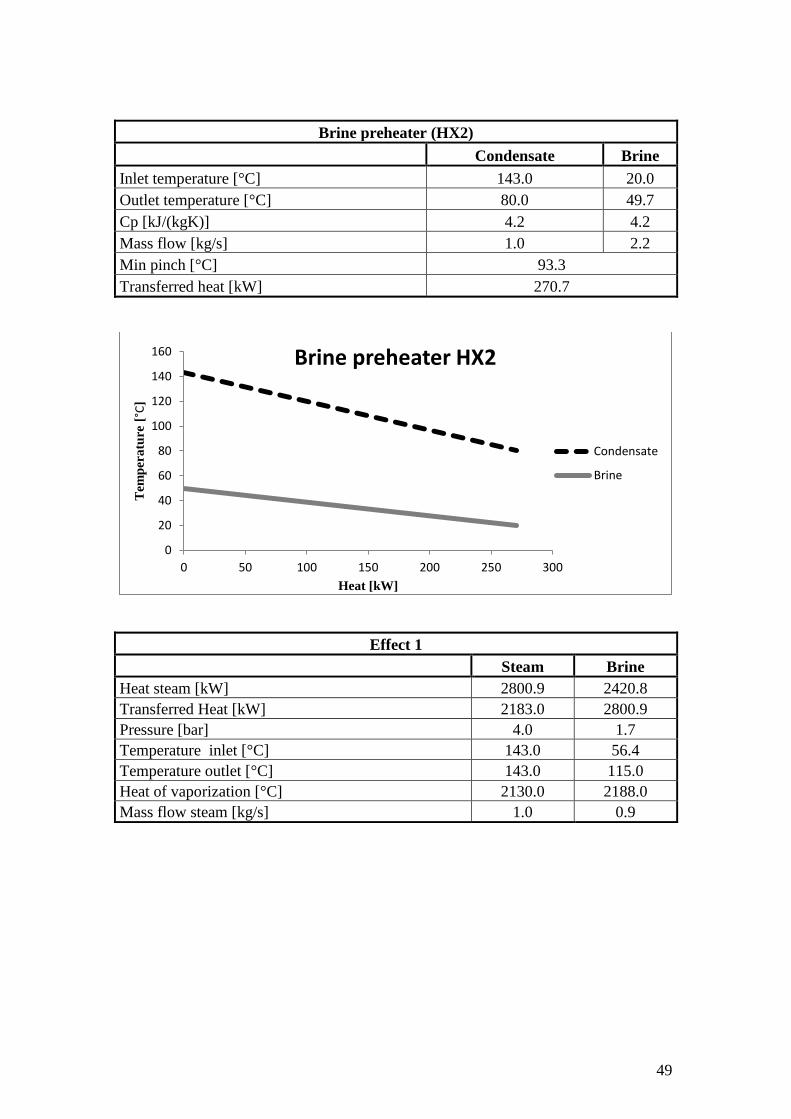
49
Brine preheater (HX2)
Condensate Brine
Inlet temperature [°C] 143.0 20.0
Outlet temperature [°C] 80.0 49.7
Cp [kJ/(kgK)] 4.2 4.2
Mass flow [kg/s] 1.0 2.2
Min pinch [°C] 93.3
Transferred heat [kW] 270.7
Effect 1
Steam Brine
Heat steam [kW] 2800.9 2420.8
Transferred Heat [kW] 2183.0 2800.9
Pressure [bar] 4.0 1.7
Temperature inlet [°C] 143.0 56.4
Temperature outlet [°C] 143.0 115.0
Heat of vaporization [°C] 2130.0 2188.0
Mass flow steam [kg/s] 1.0 0.9
0
20
40
60
80
100
120
140
160
0 50 100 150 200 250 300
Tem
per
atu
re [
°C]
Heat [kW]
Brine preheater HX2
Condensate
Brine
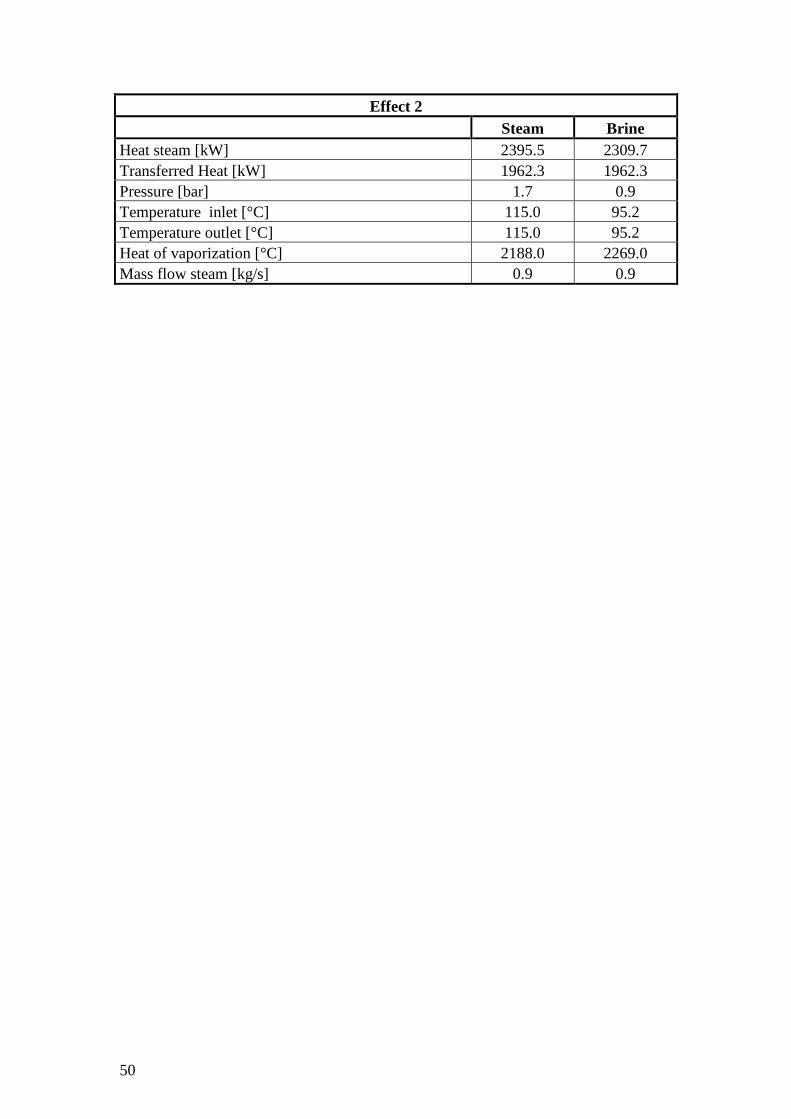
50
Effect 2
Steam Brine
Heat steam [kW] 2395.5 2309.7
Transferred Heat [kW] 1962.3 1962.3
Pressure [bar] 1.7 0.9
Temperature inlet [°C] 115.0 95.2
Temperature outlet [°C] 115.0 95.2
Heat of vaporization [°C] 2188.0 2269.0
Mass flow steam [kg/s] 0.9 0.9
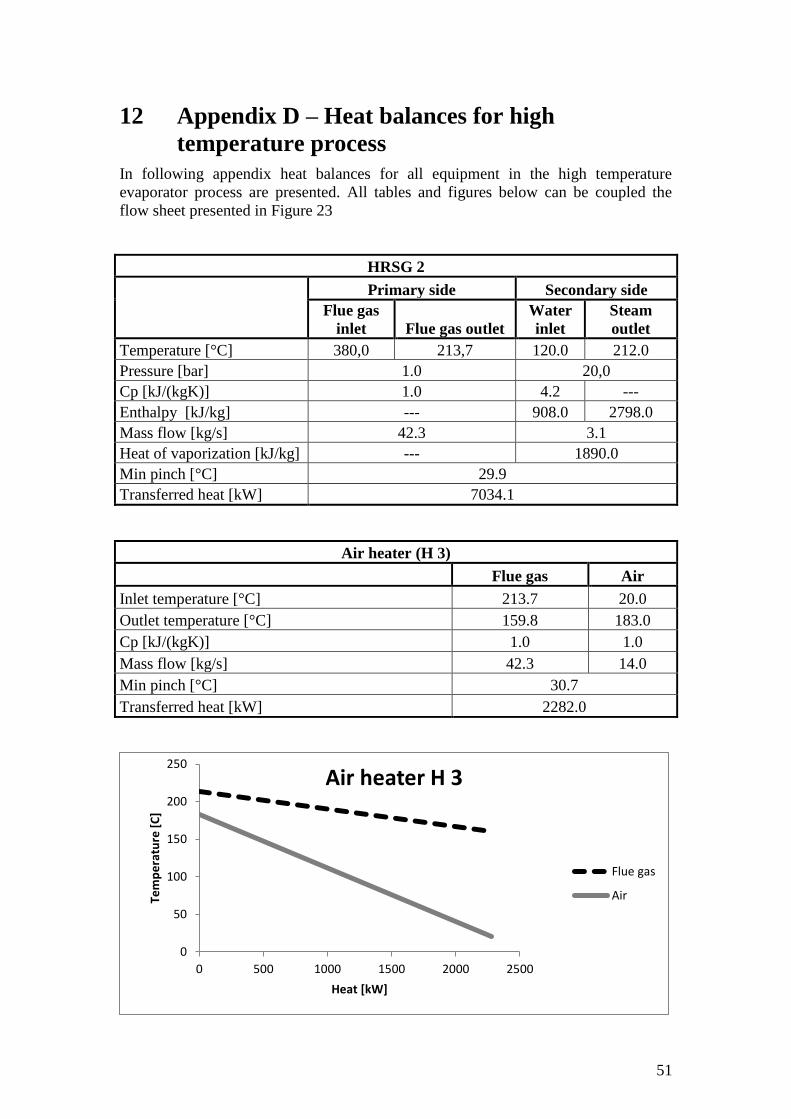
51
12 Appendix D – Heat balances for high
temperature process
In following appendix heat balances for all equipment in the high temperature
evaporator process are presented. All tables and figures below can be coupled the
flow sheet presented in Figure 23
HRSG 2
Primary side Secondary side
Flue gas
inlet Flue gas outlet
Water
inlet
Steam
outlet
Temperature [°C] 380,0 213,7 120.0 212.0
Pressure [bar] 1.0 20,0
Cp [kJ/(kgK)] 1.0 4.2 ---
Enthalpy [kJ/kg] --- 908.0 2798.0
Mass flow [kg/s] 42.3 3.1
Heat of vaporization [kJ/kg] --- 1890.0
Min pinch [°C] 29.9
Transferred heat [kW] 7034.1
Air heater (H 3)
Flue gas Air
Inlet temperature [°C] 213.7 20.0
Outlet temperature [°C] 159.8 183.0
Cp [kJ/(kgK)] 1.0 1.0
Mass flow [kg/s] 42.3 14.0
Min pinch [°C] 30.7
Transferred heat [kW] 2282.0
0
50
100
150
200
250
0 500 1000 1500 2000 2500
Tem
pe
ratu
re [
C]
Heat [kW]
Air heater H 3
Flue gas
Air
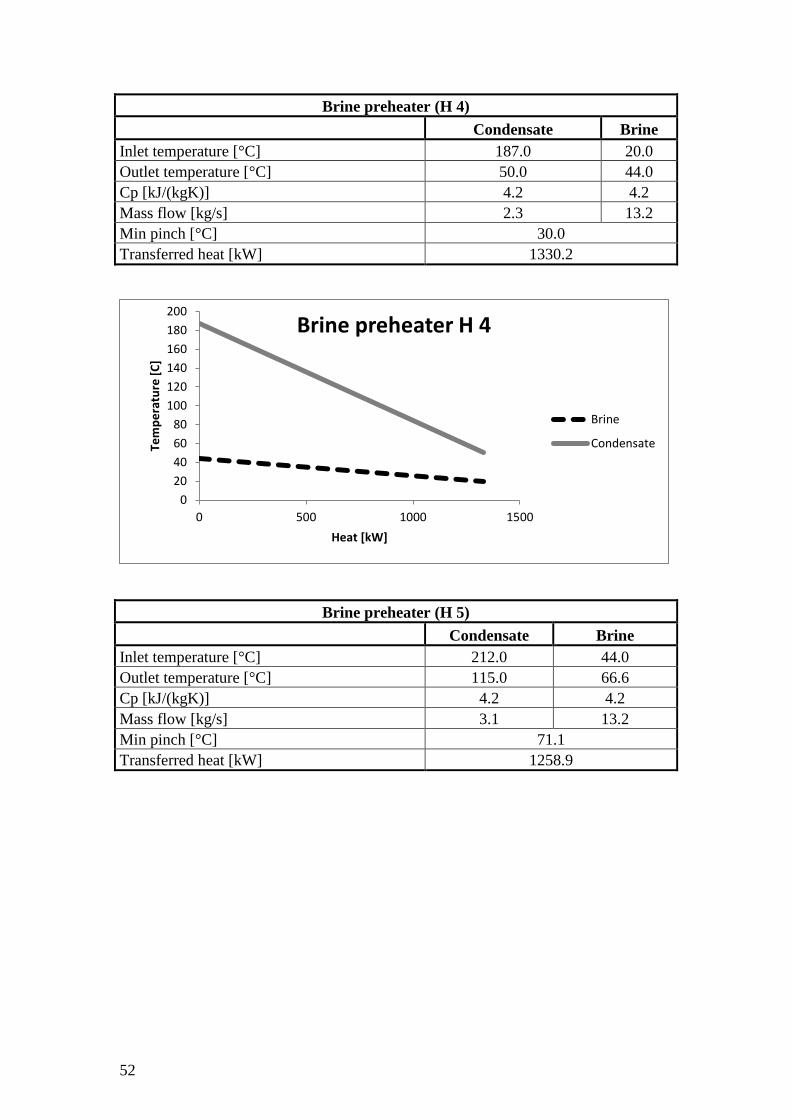
52
Brine preheater (H 4)
Condensate Brine
Inlet temperature [°C] 187.0 20.0
Outlet temperature [°C] 50.0 44.0
Cp [kJ/(kgK)] 4.2 4.2
Mass flow [kg/s] 2.3 13.2
Min pinch [°C] 30.0
Transferred heat [kW] 1330.2
Brine preheater (H 5)
Condensate Brine
Inlet temperature [°C] 212.0 44.0
Outlet temperature [°C] 115.0 66.6
Cp [kJ/(kgK)] 4.2 4.2
Mass flow [kg/s] 3.1 13.2
Min pinch [°C] 71.1
Transferred heat [kW] 1258.9
0
20
40
60
80
100
120
140
160
180
200
0 500 1000 1500
Tem
pe
ratu
re [
C]
Heat [kW]
Brine preheater H 4
Brine
Condensate
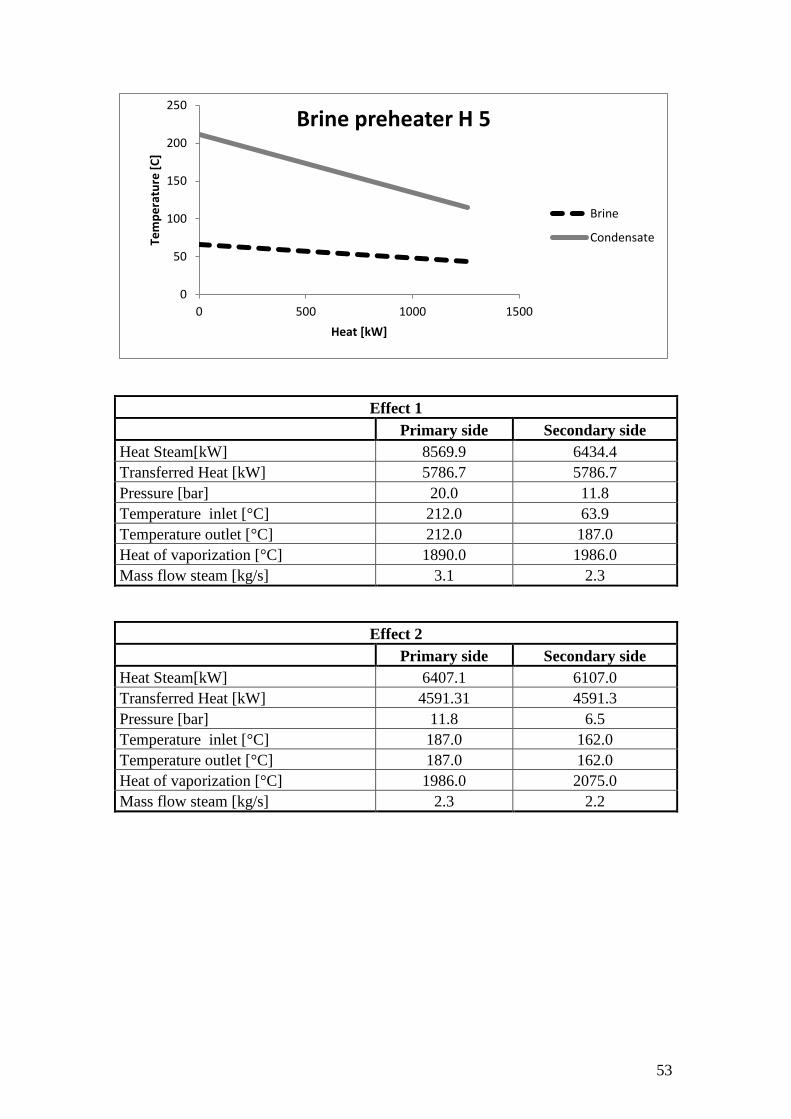
53
Effect 1
Primary side Secondary side
Heat Steam[kW] 8569.9 6434.4
Transferred Heat [kW] 5786.7 5786.7
Pressure [bar] 20.0 11.8
Temperature inlet [°C] 212.0 63.9
Temperature outlet [°C] 212.0 187.0
Heat of vaporization [°C] 1890.0 1986.0
Mass flow steam [kg/s] 3.1 2.3
Effect 2
Primary side Secondary side
Heat Steam[kW] 6407.1 6107.0
Transferred Heat [kW] 4591.31 4591.3
Pressure [bar] 11.8 6.5
Temperature inlet [°C] 187.0 162.0
Temperature outlet [°C] 187.0 162.0
Heat of vaporization [°C] 1986.0 2075.0
Mass flow steam [kg/s] 2.3 2.2
0
50
100
150
200
250
0 500 1000 1500
Tem
pe
ratu
re [
C]
Heat [kW]
Brine preheater H 5
Brine
Condensate
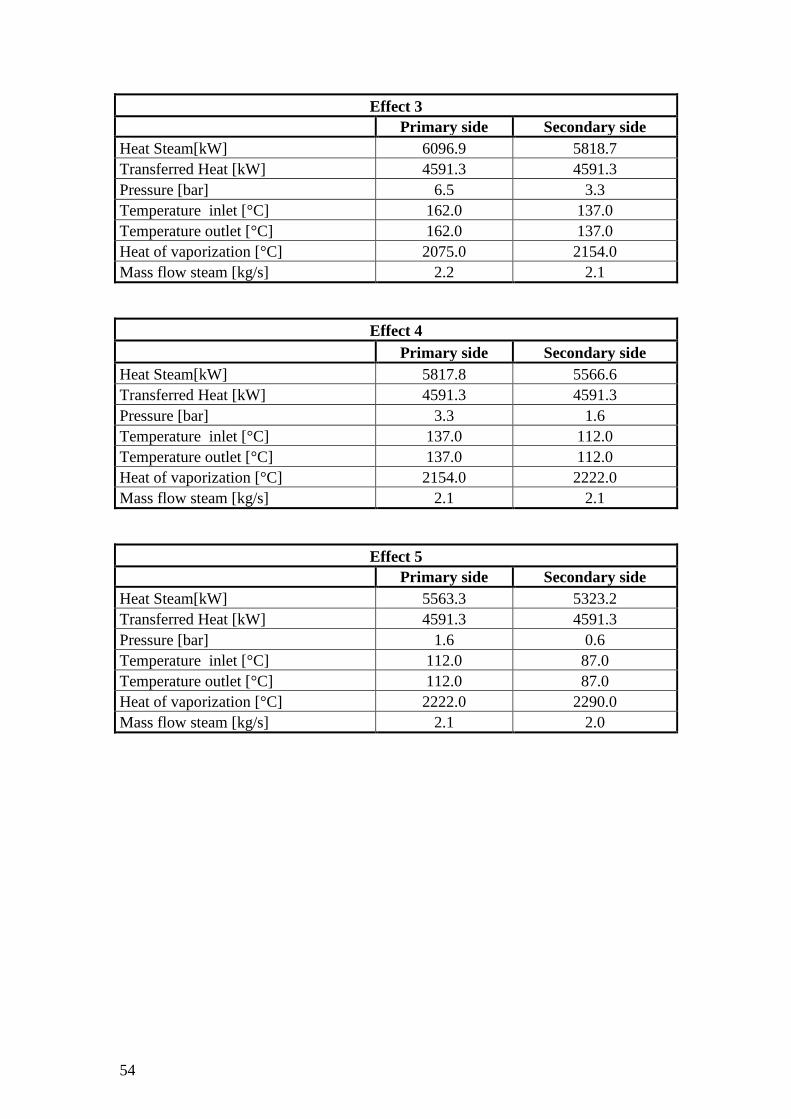
54
Effect 3
Primary side Secondary side
Heat Steam[kW] 6096.9 5818.7
Transferred Heat [kW] 4591.3 4591.3
Pressure [bar] 6.5 3.3
Temperature inlet [°C] 162.0 137.0
Temperature outlet [°C] 162.0 137.0
Heat of vaporization [°C] 2075.0 2154.0
Mass flow steam [kg/s] 2.2 2.1
Effect 4
Primary side Secondary side
Heat Steam[kW] 5817.8 5566.6
Transferred Heat [kW] 4591.3 4591.3
Pressure [bar] 3.3 1.6
Temperature inlet [°C] 137.0 112.0
Temperature outlet [°C] 137.0 112.0
Heat of vaporization [°C] 2154.0 2222.0
Mass flow steam [kg/s] 2.1 2.1
Effect 5
Primary side Secondary side
Heat Steam[kW] 5563.3 5323.2
Transferred Heat [kW] 4591.3 4591.3
Pressure [bar] 1.6 0.6
Temperature inlet [°C] 112.0 87.0
Temperature outlet [°C] 112.0 87.0
Heat of vaporization [°C] 2222.0 2290.0
Mass flow steam [kg/s] 2.1 2.0