salt and fluid balance in ckd stage 5 - kdigo · salt and fluid balance in ckd stage 5 kdigo...
TRANSCRIPT

Salt and Fluid Balance in CKD Stage 5
KDIGO - Controversies Conference
Cardiovascular Disease in CKD: What is it and
What can we do about it?29-31 October, 2010
London, England
Salt and Fluid Balance in CKD Stage 5
Charles ChazotNephroCare Tassin
France

• The sodium is the « backbone » of
extra-cellular volume
Physiological paradigms
• The kidney is the key organ of
extracellular fluid balance

CKD and sodium
and fluid imbalanceand fluid imbalance

Langstan, Circ Res 1963

GFR:30% of normal + Na intake x 6Guyton, Hypertension 1992

From dog to human being…
Koomans, Hypertension, 1985
55--day periodday period
7-g salt intake

Kim et al, Circulation 1972;46:456

Mechanisms of vascular remodeling
• Na+/K+ inhibitors
• NO/ADMA imbalance
• Non osmotically-active sodium stores

Role of inhibitors of Na+/K+ pumps
Digitalis-like immunoreactive substance
Ouabain-like compound
Twardowski HD Int 2008
Na/Ca exchanger

Sodium and NO metabolismFujiwara, Circulation 2OOO
Essential hypertension patients

The hidden sodium
• Non renal-regulated sodium pool
• Sodium accumulation in tissues like skin acting as a reservoir
• Role of polyanionic glycosamino-glycans of extracellular matrix
• Non osmotically active: water-free sodium pool
• Decreased by low sodium diet in animals (↓ 40%) without water losses
• Associated with osmo-dependent lympangiogenesis (contribution to ↑ ECF?)
Rabelink&Rotmans, NDT 2009
Titze Semin Dial 2009

Fluid accumulation in early CKD (1)
Essig, NDT 2008
CKD-1 CKD-2 CKD-3

Fluid accumulation in early CKD (2)
Essig, NDT 2008

Fluid accumulation in early CKD (3)
ECF (L)Essig, NDT 2008

Fluid accumulation in early CKD (4)
Essig, NDT 2008

Summary #1
Sodium is one of the most dangerous uremic toxin
Sodium imbalance is responsible for fluid
accumulation early in CKD evolutionaccumulation early in CKD evolution
Fluid accumulation in CKD leads to vascular
remodeling and hypertension

What is fluid retention in HD patients?
How does it influence patient outcomes?How does it influence patient outcomes?

Sequential fluid retention in HD patients:
Related to interdialytic weight gain (IDWG)
Treated by sequential UF
Measured with a scale

IDWG>3.9%
Sequential fluid retention and mortality (1)
IDWG<3%
3.1<IDWG<3.9%
Lopez-Gomez KI 2005
IDWG correlated with nutritional markers and predialysis blood pressure. No multivariate analysis
Log rank <0.01

Sequential fluid retention and mortality (2)
Kalantar-Z. Circulation 2009

Sequential fluid retention and mortality (3)
Movili, NDT 2007

Outcome RR p value
Adjusted 1,09 0,02
Ultrafiltration rate > 10 ml/hr/kg
A high UF rate is associated with all-cause mortality in DOPPS
Sequential fluid retention and mortality (4)
Adjusted
all-cause mortality1,09 0,02
Adjusted
cardiopulmonary
mortality
1,04 0,41
Saran, Kidney Int 2006
Cut-off : 10 ml/kg/hour

The dry weight method is demanding with standard dialysis because of hemodynamic effect of high UF rates
Davenport, KI 2008
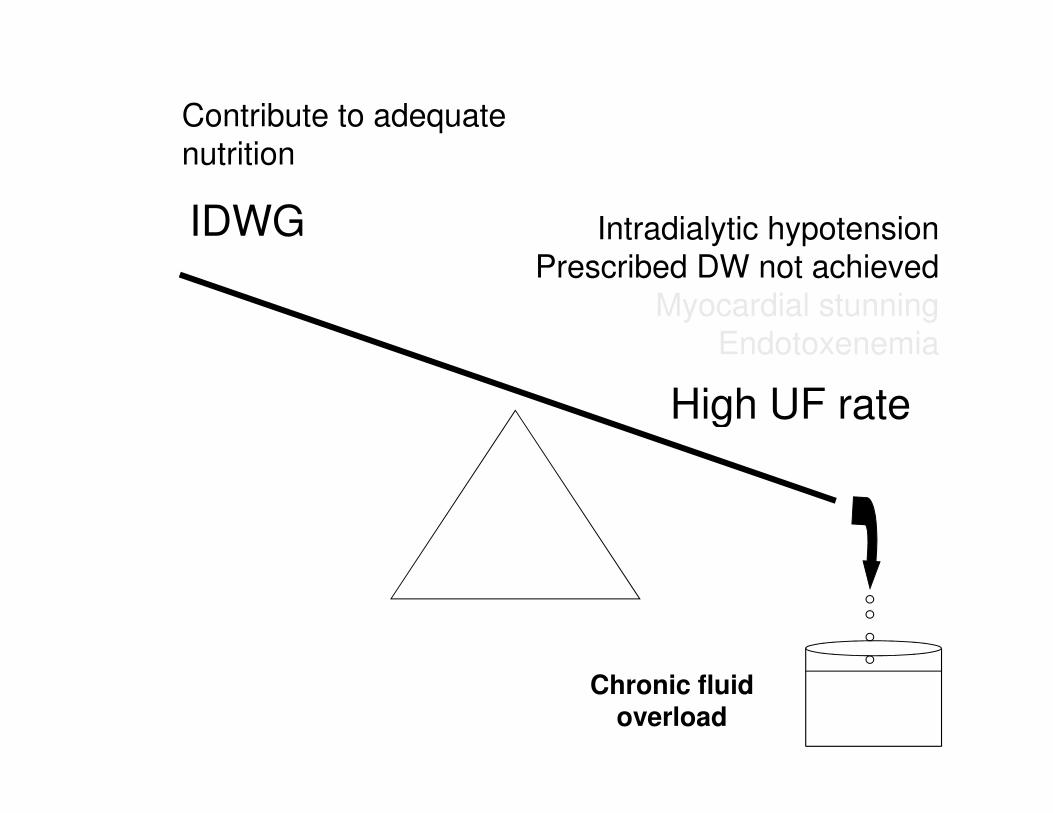
IDWG
High UF rate
Contribute to adequate
nutrition
Intradialytic hypotension
Prescribed DW not achieved
Myocardial stunning
Endotoxenemia
High UF rate
Chronic fluid overload

Chronic fluid retention in HD patients:
Permanent extracellular volume accumulation
beyond IDWG remaining between dialysis
Measured with chest X-ray, BIA, plasma volume
monitoring

Chronic fluid retention and mortality (1)
Ozkahya NDT 2006,21:3506
Cardio-thoracic index and survival

Chronic fluid retention and mortality (2)
Wizemann NDT 2009

Tassin: 51 HD patients clinically at dry weight (Dr Charra)
Giessen: 180 non selected HD patients
Overhydration (%): Fluid excess/ECW >15%
1.2 ± 7%
7.9 ± 8.8%
1.2 ± 7%
P Wabel courtesy

P Wabel courtesy

Chronic fluid retention and mortality (3)
Relative Plasma Monitoring – Refilling status
Agarwal Hypertension 2010
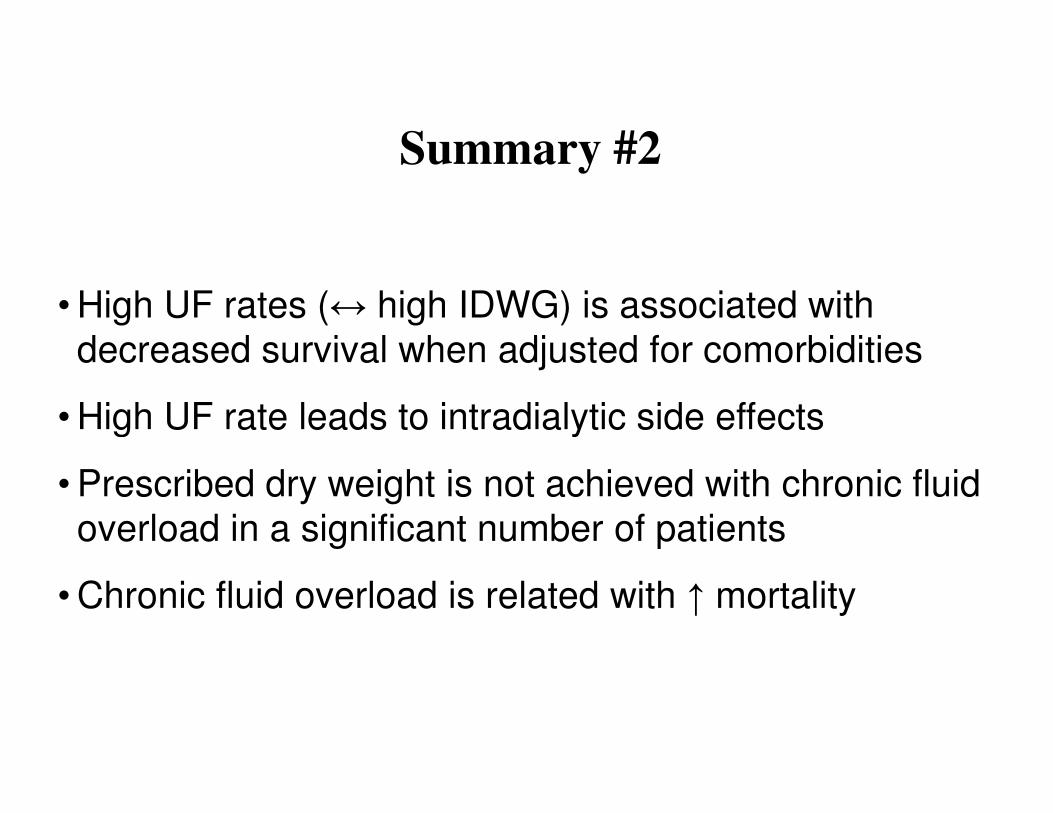
Summary #2
• High UF rates (↔ high IDWG) is associated with
decreased survival when adjusted for comorbidities
• High UF rate leads to intradialytic side effects • High UF rate leads to intradialytic side effects
• Prescribed dry weight is not achieved with chronic fluid
overload in a significant number of patients
• Chronic fluid overload is related with ↑ mortality
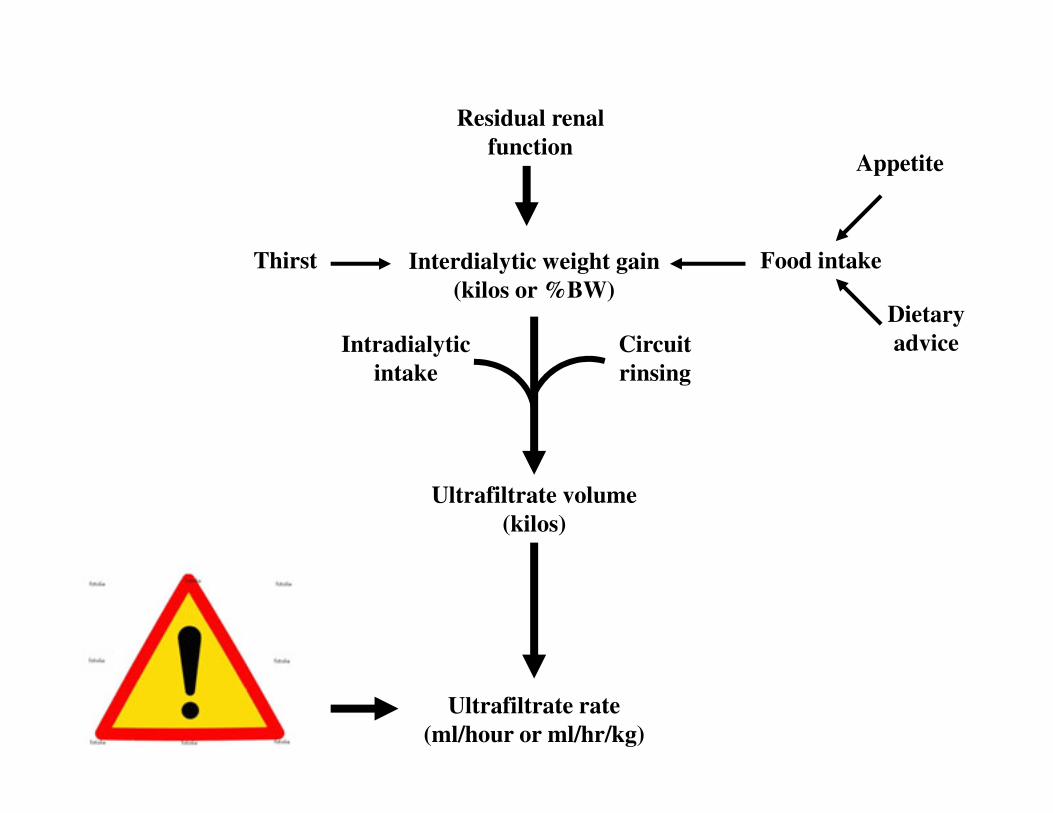
Interdialytic weight gain
(kilos or %BW)
Thirst
Residual renal
function
Food intake
Appetite
Dietary
adviceIntradialytic
intake
Circuit
rinsing
Ultrafiltrate volume
(kilos)
Ultrafiltrate rate
(ml/hour or ml/hr/kg)

Interdialytic weight gain
(kilos or %BW)
Thirst
Residual renal
function
Food intake
Appetite
Dietary
adviceIntradialytic
intake
Circuit
rinsing
Na+ intake
Intradialytic Na+
balance
Glycemic control
Ultrafiltrate volume
(kilos)
Ultrafiltrate rate
(ml/hour or ml/hr/kg)
Session
time/frequency
prescription

Clinical effects of strict UF policy Clinical effects of strict UF policy
and low salt diet

Dry weight method applied in 308 incident patients between 2000-2008
Age=65.8 (20.5-95.7) F/M (%)=37/63 Diabetes=36.4% Average TT:6.6 hours
136
138
140
142
144
68
68,5
69
69,5
Syst BP
BW
Syst BP
BW
AntiHTA drugs
2.38 0.51 0.44 0.35
Personal data
128
130
132
134
136
Start M2 M3 M6 M12
66
66,5
67
67,5BW

135.00
140.00
145.00
150.00
155.00M
ean p
re d
ialy
sis
SB
P (
mm
Hg)
USA (95% CI)
Tassin (95% CI)
Sipahioglu, ASN San Diego 2009
125.00
130.00
1 4 7
10
13
16
19
22
25
28
31
34
37
40
43
46
49
52
Weeks from start of dialysis
Mean p
re d
ialy
sis
SB
P (
mm
Hg)

Start 6 12 24 36 >36
n Patients 67 67 60 43 22 19
Correction of HTN with standard dialysis and DW method
3x4 hours/week in prevalent patients Strict UF policy, low salt diet, extra UF sessions
36 months of follow-up
BW (kg) 64.5±13 63.5±14 65.0±11 67±9 66±12 67±13
IDWG (kg) 2.9±1.3 1.7±0.9 1.8±1.0 1.8±1.1 1.9±1.2 1.8±1.2
CTI (%) 52±4 47±3 45±3 43±3 42±4 42±5
Syst BP (mmHg) 173±17 139±16 131±17 122±11 118±12 114±10
Dia BP (mmHg) 102±9 86±11 81±9 76±6 73±6 71±7
Ozkahya, Am J Kid Dis 1999,34:218-221

2500
2750
3000
3250
Wate
r (m
l)
Water = 892,65 + 149,054 * NaCl
r=0,47 ; p<0,0001
Relationship between salt and water intakes
500
750
1000
1250
1500
1750
2000
2250
2500
Wate
r (m
l)
1 2 3 4 5 6 7 8
NaCl
Chazot Sem Dial 2009

Ejection fraction and long-slow Ultrafiltration
Uremic cardiomyopathy
50%*
Toz, HD Int 2007
Increased TT with slow UF
31%
12 pts
20 to 120 days
-12±10 kgs
CTI:0.59 to 0.47

Interventional studies on salt restriction
Chazot, Sem Dial 2009

Effect of strict UF control + salt-restricted diet
Ozkahya NDT 1998
Left Ventricular Mass Index: 175±60 → 105±39 gm²
15 patients during 37±11 months

Centre A Salt restriction strict UF policy
Centre B Standard
Loose DW policy
n 190 204
HTN history (%) 78 83
Effect of salt restriction Retrospective cross-sectional study
Kayikcioglu, NDT 2009
HTN history (%) 78 83
Anti-HTN drugs 7% 42%**
IDWG 2.29 kilos 3.31 kilos**
Predial BP 126/75 126/75
% SBP>140 18% 37%*
BP drops 11% 27%*
LV hypertrophy 74% 88%*

Do not forget dialysate [Na]…

40
50
60
70
Pa
tie
nts
po
urc
en
tag
e
62.4%
Cross-sectional study among 189 HD patients with Na+ dialysate
concentration at 138 mmoles/l
0
10
20
30
Pa
tie
nts
po
urc
en
tag
e
-20 -15 -10 -5 0 5 10 15
P-D Na+ gradient (Mmole/L)
62.4%
19.6% 16.4%
ISBP meeting Rotterdam 2005

4,00
5,00
6,00
7,00
Wei
gh
t g
ain
(k
ilos)
r=-0,26
p=0,0004
Weight gain ∆∆∆∆ versus P-D Na+ gradient
0
1,00
2,00
3,00
4,00
Wei
gh
t g
ain
(k
ilos)
-12 -10 -8 -6 -4 -2 0 2 4 6
Plasma-Dialysate [Na+] gradient
ISBP meeting Rotterdam 2005

De Paula, Kidney Int 2004,66:1232
27 stable HD patients studied 6 weeks
Cross-over study :
Na dialysate=138 mmoles/l vs Na dialysate = 0,95 x Plasma Na
(average= 134 mmoles/l)
Sodium dialysate individualization
(average= 134 mmoles/l)
• ↓Thirst ↓ IDWG ↓ HD-related symptoms
• ↓ pre-HD BP (in patients with uncontrolled BP at baseline)

Correction of vascular remodeling or Correction of vascular remodeling or
the lag phenomenon

0
1
2
3
4
Bo
dy
wei
gh
t v
ari
ati
on
(%
)
MAP (mmHg)100
105
110
115
MAP (mmHg)
The lag phenomenon Charra et al, AJKD 1998
Time (months)
0 2 4 6 8 10 12 14 16 18 20 22 24
-5
-4
-3
-2
-1
Bo
dy
wei
gh
t v
ari
ati
on
(%
)
∆∆∆∆ BW (%)
80
85
90
95
Chazot, NDT 1999

Twardowski
HDI 2008
Shown with nocturnal daily HD (Chan Hypertension 2003)

Conclusions
• Sodium: a true uremic toxin, the main factor responsible for fluid accumulation in CKD, hypertension and vascular remodeling
• Correction of EC fluid excess by the dry weight method + salt restricted diet lowers BP and may correct CV remodeling
• High UF rates: the enemy to apply dry weight method because of intradialytic side-effects, especially hypotension leading to chronic fluid overload
• High UF volumes and chronic fluid excess are associated with decreased patient survival and ↑ CV mortality
• Salt restriction is the main and only tool to limit the UF rate when session time/frequency increase is not possible. Patient education is the key

BH Scribner G Laurent
B Charra