chapter 1: ckd in the general population - usrds · kdigo 2012 clinical practice guideline for the...
TRANSCRIPT

Chapter 1: CKD in the General Population
Introduction
In this chapter we provide single-sample, cross-sectional estimates of kidney function through data downloaded in 2014 from the National Health and Nutrition Examination Survey (NHANES) database, a valuable source of information for assessing disease prevalence and at-risk subsets in a representative sample of non-institutionalized U.S. adults. Note that there was no data collection in NHANES during 1995-1998.
The biochemical data available in NHANES are used to evaluate kidney function, usually by estimating glomerular filtration rate (eGFR) and urinary albumin excretion. As with assessment of prevalence of other diseases in this national survey, kidney function is estimated at a single point in time. In clinical practice, defining chronic kidney disease (CKD) would typically require multiple assessments of kidney function and urine protein over weeks or months. Due to the fact that repeated measures of kidney function were only conducted in a voluntary subset of the 1988–1994 NHANES participants, we are forced to rely on a single, cross-sectional sample to estimate the prevalence of CKD in the U.S. adult population, and to determine CKD trends over time. Thus, estimates of CKD reported in this chapter will be higher than would be the case if measures of eGFR and urine albumin/creatinine ratio (ACR) were repeated over time to fulfill the persistence criterion in the clinical definition of CKD.
Other chapters in this volume identify presence of CKD and its related stages based on ICD-9-CM (International Classification of Diseases, 9th revision, clinical modification) diagnosis codes. Because the NHANES database does not contain diagnostic information, we must use alternate definitions. For this Annual Data Report, we developed criteria underlying the definition of CKD based upon the KDIGO 2012 Clinical Practice Guideline for the
Evaluation and Management of Chronic Kidney Disease (KDIGO, 2012). First, we evaluate kidney function by eGFR; individuals with eGFR <60 ml/min/1.73m2 are considered to have reduced kidney function (eGFR was calculated using the CKD-EPI creatinine equation [Levey et al., 2009]). Secondly, we use the ACR to assess urinary albumin excretion and consider three categories of measurements: <30 mg/g, 30-300 mg/g (microalbuminuria), and >300 mg/g (macroalbuminuria). Lastly, we consider a measure composed of both eGFR and ACR, and classify individuals to have CKD if they have either an eGFR <60 ml/min/1.73m2 or ACR ≥30 mg/g. Staging of kidney disease follows the Kidney Disease Outcomes and Quality Improvement (KDOQI) CKD guidelines (NKF, 2002).
The chapter begins with an examination of the prevalence of CKD in the U.S. among individuals age 20 or older. We also evaluate the population distributions of eGFR and ACR over time, and the cross-tabulations of the two measures in the 2007-2012 samples, based on the KDIGO categorization. Next, we assess the burden of CKD and interactions with interrelated conditions of public health relevance—diabetes mellitus (DM), hypertension (HTN), self-reported cardiovascular disease (SR CVD), and obesity—by comparing prevalence estimates based on eGFR to those based on ACR. Table 1.1 displays the importance of CKD as a non-communicable disease, and shows that a large proportion of individuals with kidney disease also suffer from DM, SR CVD, or has all three conditions.
Stages of CKD - KDOQI 2002 definitionsStage 1: eGFR ≥ 90 ml/min/1.73m2 and ACR ≥ 30 mg/gStage 2: eGFR 60-89 ml/min/1.73m2 and ACR ≥ 30 mg/gStage 3: eGFR 15-29 ml/min/1.73m2
Stage 4: eGFR 15-29 ml/min/1.73m2
Stage 5: eGFR < 15 ml/min/1.73m2
2014 USRDS Annual Data Report | Volume 1 - CKD
12
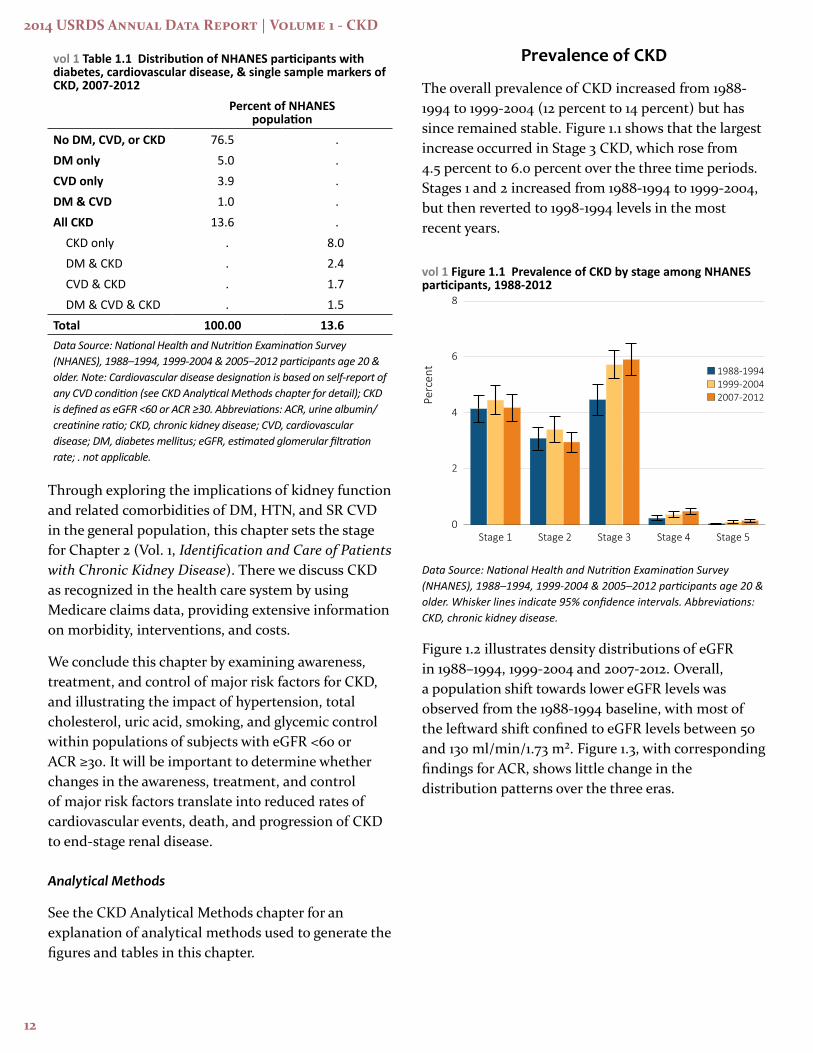
vol 1 Table 1.1 Distribution of NHANES participants with diabetes, cardiovascular disease, & single sample markers of CKD, 2007-2012
Percent of NHANES population
No DM, CVD, or CKD 76.5 .DM only 5.0 .CVD only 3.9 .DM & CVD 1.0 .All CKD 13.6 .
CKD only . 8.0DM & CKD . 2.4CVD & CKD . 1.7DM & CVD & CKD . 1.5
Total 100.00 13.6Data Source: National Health and Nutrition Examination Survey (NHANES), 1988–1994, 1999-2004 & 2005–2012 participants age 20 & older. Note: Cardiovascular disease designation is based on self-report of any CVD condition (see CKD Analytical Methods chapter for detail); CKD is defined as eGFR <60 or ACR ≥30. Abbreviations: ACR, urine albumin/creatinine ratio; CKD, chronic kidney disease; CVD, cardiovascular disease; DM, diabetes mellitus; eGFR, estimated glomerular filtration rate; . not applicable.
Through exploring the implications of kidney function and related comorbidities of DM, HTN, and SR CVD in the general population, this chapter sets the stage for Chapter 2 (Vol. 1, Identification and Care of Patients with Chronic Kidney Disease). There we discuss CKD as recognized in the health care system by using Medicare claims data, providing extensive information on morbidity, interventions, and costs.
We conclude this chapter by examining awareness, treatment, and control of major risk factors for CKD, and illustrating the impact of hypertension, total cholesterol, uric acid, smoking, and glycemic control within populations of subjects with eGFR <60 or ACR ≥30. It will be important to determine whether changes in the awareness, treatment, and control of major risk factors translate into reduced rates of cardiovascular events, death, and progression of CKD to end-stage renal disease.
Analytical Methods
See the CKD Analytical Methods chapter for an explanation of analytical methods used to generate the figures and tables in this chapter.
Prevalence of CKD
The overall prevalence of CKD increased from 1988-1994 to 1999-2004 (12 percent to 14 percent) but has since remained stable. Figure 1.1 shows that the largest increase occurred in Stage 3 CKD, which rose from 4.5 percent to 6.0 percent over the three time periods. Stages 1 and 2 increased from 1988-1994 to 1999-2004, but then reverted to 1998-1994 levels in the most recent years.
vol 1 Figure 1.1 Prevalence of CKD by stage among NHANES participants, 1988-2012
Data Source: National Health and Nutrition Examination Survey (NHANES), 1988–1994, 1999-2004 & 2005–2012 participants age 20 & older. Whisker lines indicate 95% confidence intervals. Abbreviations: CKD, chronic kidney disease.
Figure 1.2 illustrates density distributions of eGFR in 1988–1994, 1999-2004 and 2007-2012. Overall, a population shift towards lower eGFR levels was observed from the 1988-1994 baseline, with most of the leftward shift confined to eGFR levels between 50 and 130 ml/min/1.73 m². Figure 1.3, with corresponding findings for ACR, shows little change in the distribution patterns over the three eras.

Chapter1:CKDintheGeneralPopulation
13
vol 1 Figure 1.2 eGFR distribution curves among NHANES participants, 1988-2012
Data Source: National Health and Nutrition Examination Survey (NHANES), 1988–1994, 1999-2004 & 2005–2012 participants age 20 & older. Single-sample estimates of eGFR & ACR; eGFR calculated using the CKD-EPI equation. Abbreviations: ACR, urine albumin/creatinine ratio; eGFR, estimated glomerular filtration rate.
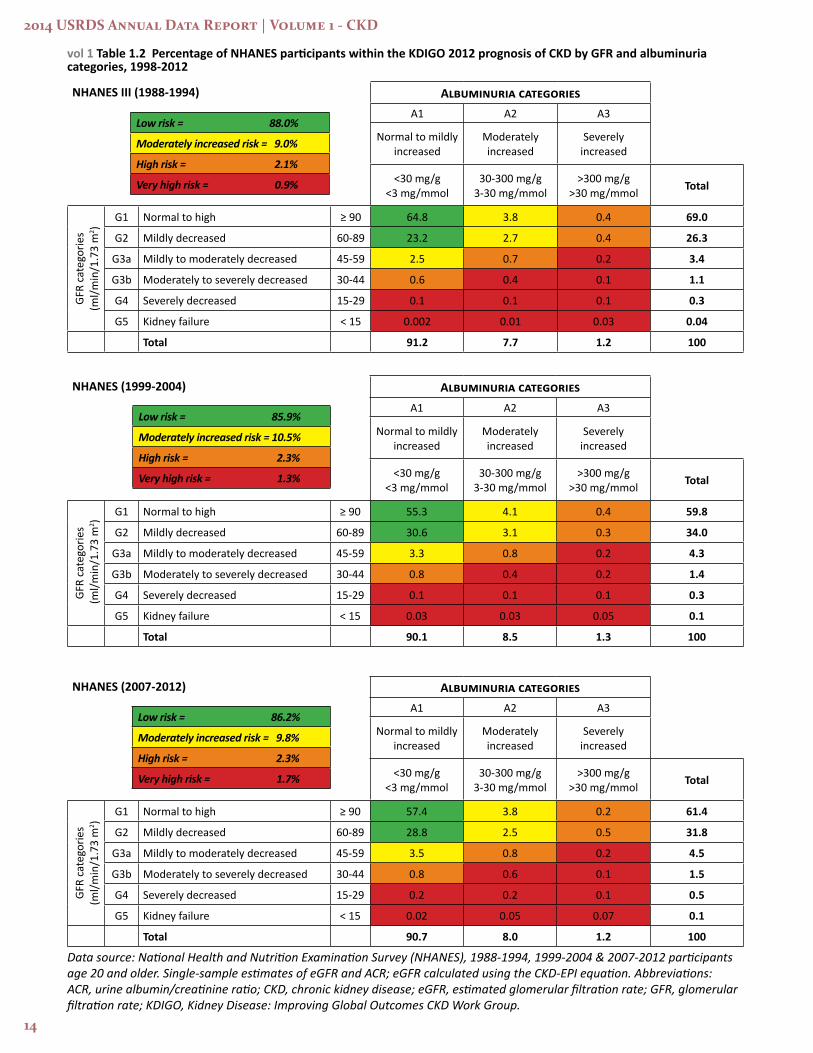
Albuminuria increases as kidney function decreases. For example, in the 2007 to 2012 NHANES sample, 6.5 percent of persons with normal (>90 eGFR) kidney function had some evidence of albuminuria. This rate increases rapidly as kidney function declines, to 9.4 percent for eGFR 60-90, 22.2 percent for 45-59, and 46.7 percent for 30-44. For persons with very poor kidney function (eGFR <30), over half have evidence of micro or macroalbuminuria (Table 1.2). Over these time periods there was also an increase in the percent of individuals in the higher risk KDIGO categories, increasing from 12 percent of 1988-1994 participants to approximately 14 percent for both 1999-2004 and 2007-2012 participants.
vol 1 Figure 1.3 Urine albumin/creatinine ratio distribution of NHANES participants, 1988-2012
Data Source: National Health and Nutrition Examination Survey (NHANES), 1988–1994, 1999-2004 & 2005–2012 participants age 20 & older. Single-sample estimates of eGFR & ACR; eGFR calculated using the CKD-EPI equation. Abbreviations: ACR, urine albumin/creatinine ratio; eGFR, estimated glomerular filtration rate.
2014 USRDS Annual Data Report | Volume 1 - CKD
14
vol 1 Table 1.2 Percentage of NHANES participants within the KDIGO 2012 prognosis of CKD by GFR and albuminuria categories, 1998-2012
Data source: National Health and Nutrition Examination Survey (NHANES), 1988-1994, 1999-2004 & 2007-2012 participants age 20 and older. Single-sample estimates of eGFR and ACR; eGFR calculated using the CKD-EPI equation. Abbreviations: ACR, urine albumin/creatinine ratio; CKD, chronic kidney disease; eGFR, estimated glomerular filtration rate; GFR, glomerular filtration rate; KDIGO, Kidney Disease: Improving Global Outcomes CKD Work Group.
NHANES III (1988-1994) Albuminuria categoriesA1 A2 A3
Normal to mildly increased
Moderately increased
Severely increased
<30 mg/g <3 mg/mmol
30-300 mg/g 3-30 mg/mmol
>300 mg/g >30 mg/mmol Total
GFR
cate
gorie
s (m
l/min
/1.7
3 m
2 )
G1 Normal to high ≥ 90 64.8 3.8 0.4 69.0
G2 Mildly decreased 60-89 23.2 2.7 0.4 26.3
G3a Mildly to moderately decreased 45-59 2.5 0.7 0.2 3.4
G3b Moderately to severely decreased 30-44 0.6 0.4 0.1 1.1
G4 Severely decreased 15-29 0.1 0.1 0.1 0.3
G5 Kidney failure < 15 0.002 0.01 0.03 0.04
Total 91.2 7.7 1.2 100
NHANES (1999-2004) Albuminuria categoriesA1 A2 A3
Normal to mildly increased
Moderately increased
Severely increased
<30 mg/g <3 mg/mmol
30-300 mg/g 3-30 mg/mmol
>300 mg/g >30 mg/mmol Total
GFR
cate
gorie
s (m
l/min
/1.7
3 m
2 )
G1 Normal to high ≥ 90 55.3 4.1 0.4 59.8
G2 Mildly decreased 60-89 30.6 3.1 0.3 34.0
G3a Mildly to moderately decreased 45-59 3.3 0.8 0.2 4.3
G3b Moderately to severely decreased 30-44 0.8 0.4 0.2 1.4
G4 Severely decreased 15-29 0.1 0.1 0.1 0.3
G5 Kidney failure < 15 0.03 0.03 0.05 0.1
Total 90.1 8.5 1.3 100
NHANES (2007-2012) Albuminuria categoriesA1 A2 A3
Normal to mildly increased
Moderately increased
Severely increased
<30 mg/g <3 mg/mmol
30-300 mg/g 3-30 mg/mmol
>300 mg/g >30 mg/mmol Total
GFR
cate
gorie
s (m
l/min
/1.7
3 m
2 )
G1 Normal to high ≥ 90 57.4 3.8 0.2 61.4
G2 Mildly decreased 60-89 28.8 2.5 0.5 31.8
G3a Mildly to moderately decreased 45-59 3.5 0.8 0.2 4.5
G3b Moderately to severely decreased 30-44 0.8 0.6 0.1 1.5
G4 Severely decreased 15-29 0.2 0.2 0.1 0.5
G5 Kidney failure < 15 0.02 0.05 0.07 0.1
Total 90.7 8.0 1.2 100
Low risk = 85.9%
Moderately increased risk = 10.5%
High risk = 2.3%
Very high risk = 1.3%
Low risk = 86.2%
Moderately increased risk = 9.8%
High risk = 2.3%
Very high risk = 1.7%
Low risk = 88.0%
Moderately increased risk = 9.0%
High risk = 2.1%
Very high risk = 0.9%
Chapter1:CKDintheGeneralPopulation
15
Comorbidity and Risk Factors
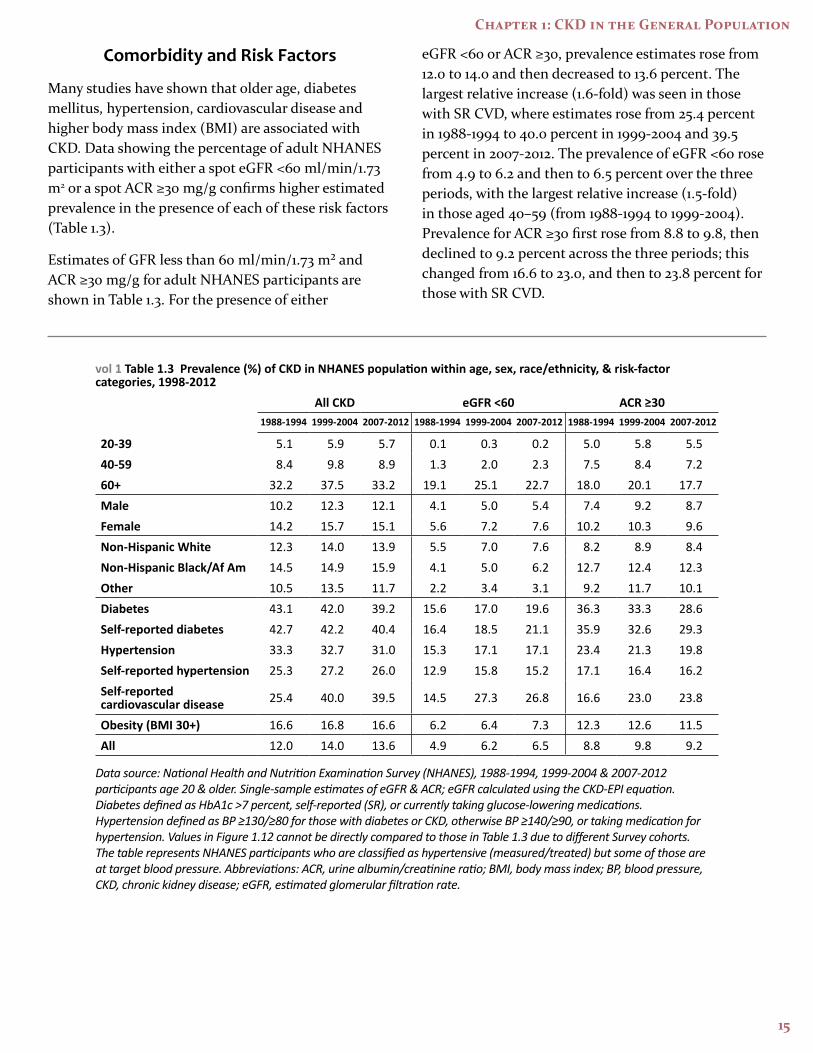
Many studies have shown that older age, diabetes mellitus, hypertension, cardiovascular disease and higher body mass index (BMI) are associated with CKD. Data showing the percentage of adult NHANES participants with either a spot eGFR <60 ml/min/1.73 m2 or a spot ACR ≥30 mg/g confirms higher estimated prevalence in the presence of each of these risk factors (Table 1.3).
Estimates of GFR less than 60 ml/min/1.73 m² and ACR ≥30 mg/g for adult NHANES participants are shown in Table 1.3. For the presence of either
eGFR <60 or ACR ≥30, prevalence estimates rose from 12.0 to 14.0 and then decreased to 13.6 percent. The largest relative increase (1.6-fold) was seen in those with SR CVD, where estimates rose from 25.4 percent in 1988-1994 to 40.0 percent in 1999-2004 and 39.5 percent in 2007-2012. The prevalence of eGFR <60 rose from 4.9 to 6.2 and then to 6.5 percent over the three periods, with the largest relative increase (1.5-fold) in those aged 40–59 (from 1988-1994 to 1999-2004). Prevalence for ACR ≥30 first rose from 8.8 to 9.8, then declined to 9.2 percent across the three periods; this changed from 16.6 to 23.0, and then to 23.8 percent for those with SR CVD.
vol 1 Table 1.3 Prevalence (%) of CKD in NHANES population within age, sex, race/ethnicity, & risk-factor categories, 1998-2012
All CKD eGFR <60 ACR ≥30 1988-1994 1999-2004 2007-2012 1988-1994 1999-2004 2007-2012 1988-1994 1999-2004 2007-2012
20-39 5.1 5.9 5.7 0.1 0.3 0.2 5.0 5.8 5.540-59 8.4 9.8 8.9 1.3 2.0 2.3 7.5 8.4 7.260+ 32.2 37.5 33.2 19.1 25.1 22.7 18.0 20.1 17.7Male 10.2 12.3 12.1 4.1 5.0 5.4 7.4 9.2 8.7Female 14.2 15.7 15.1 5.6 7.2 7.6 10.2 10.3 9.6Non-Hispanic White 12.3 14.0 13.9 5.5 7.0 7.6 8.2 8.9 8.4Non-Hispanic Black/Af Am 14.5 14.9 15.9 4.1 5.0 6.2 12.7 12.4 12.3Other 10.5 13.5 11.7 2.2 3.4 3.1 9.2 11.7 10.1Diabetes 43.1 42.0 39.2 15.6 17.0 19.6 36.3 33.3 28.6Self-reported diabetes 42.7 42.2 40.4 16.4 18.5 21.1 35.9 32.6 29.3Hypertension 33.3 32.7 31.0 15.3 17.1 17.1 23.4 21.3 19.8Self-reported hypertension 25.3 27.2 26.0 12.9 15.8 15.2 17.1 16.4 16.2Self-reported cardiovascular disease 25.4 40.0 39.5 14.5 27.3 26.8 16.6 23.0 23.8
Obesity (BMI 30+) 16.6 16.8 16.6 6.2 6.4 7.3 12.3 12.6 11.5All 12.0 14.0 13.6 4.9 6.2 6.5 8.8 9.8 9.2
Data source: National Health and Nutrition Examination Survey (NHANES), 1988-1994, 1999-2004 & 2007-2012 participants age 20 & older. Single-sample estimates of eGFR & ACR; eGFR calculated using the CKD-EPI equation. Diabetes defined as HbA1c >7 percent, self-reported (SR), or currently taking glucose-lowering medications. Hypertension defined as BP ≥130/≥80 for those with diabetes or CKD, otherwise BP ≥140/≥90, or taking medication for hypertension. Values in Figure 1.12 cannot be directly compared to those in Table 1.3 due to different Survey cohorts. The table represents NHANES participants who are classified as hypertensive (measured/treated) but some of those are at target blood pressure. Abbreviations: ACR, urine albumin/creatinine ratio; BMI, body mass index; BP, blood pressure, CKD, chronic kidney disease; eGFR, estimated glomerular filtration rate.
2014 USRDS Annual Data Report | Volume 1 - CKD
16
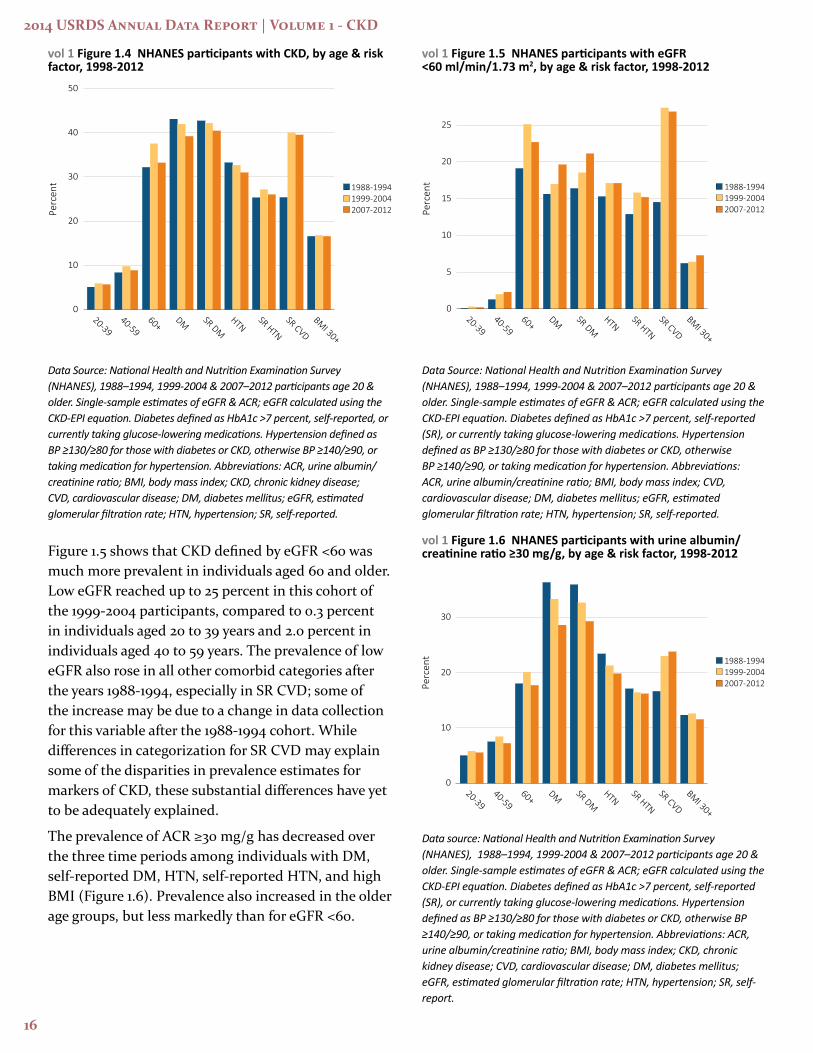
vol 1 Figure 1.4 NHANES participants with CKD, by age & risk factor, 1998-2012
Data Source: National Health and Nutrition Examination Survey (NHANES), 1988–1994, 1999-2004 & 2007–2012 participants age 20 & older. Single-sample estimates of eGFR & ACR; eGFR calculated using the CKD-EPI equation. Diabetes defined as HbA1c >7 percent, self-reported, or currently taking glucose-lowering medications. Hypertension defined as BP ≥130/≥80 for those with diabetes or CKD, otherwise BP ≥140/≥90, or taking medication for hypertension. Abbreviations: ACR, urine albumin/creatinine ratio; BMI, body mass index; CKD, chronic kidney disease; CVD, cardiovascular disease; DM, diabetes mellitus; eGFR, estimated glomerular filtration rate; HTN, hypertension; SR, self-reported.
Figure 1.5 shows that CKD defined by eGFR <60 was much more prevalent in individuals aged 60 and older. Low eGFR reached up to 25 percent in this cohort of the 1999-2004 participants, compared to 0.3 percent in individuals aged 20 to 39 years and 2.0 percent in individuals aged 40 to 59 years. The prevalence of low eGFR also rose in all other comorbid categories after the years 1988-1994, especially in SR CVD; some of the increase may be due to a change in data collection for this variable after the 1988-1994 cohort. While differences in categorization for SR CVD may explain some of the disparities in prevalence estimates for markers of CKD, these substantial differences have yet to be adequately explained.
The prevalence of ACR ≥30 mg/g has decreased over the three time periods among individuals with DM, self-reported DM, HTN, self-reported HTN, and high BMI (Figure 1.6). Prevalence also increased in the older age groups, but less markedly than for eGFR <60.
vol 1 Figure 1.5 NHANES participants with eGFR <60 ml/min/1.73 m2, by age & risk factor, 1998-2012
Data Source: National Health and Nutrition Examination Survey (NHANES), 1988–1994, 1999-2004 & 2007–2012 participants age 20 & older. Single-sample estimates of eGFR & ACR; eGFR calculated using the CKD-EPI equation. Diabetes defined as HbA1c >7 percent, self-reported (SR), or currently taking glucose-lowering medications. Hypertension defined as BP ≥130/≥80 for those with diabetes or CKD, otherwise BP ≥140/≥90, or taking medication for hypertension. Abbreviations: ACR, urine albumin/creatinine ratio; BMI, body mass index; CVD, cardiovascular disease; DM, diabetes mellitus; eGFR, estimated glomerular filtration rate; HTN, hypertension; SR, self-reported.
vol 1 Figure 1.6 NHANES participants with urine albumin/creatinine ratio ≥30 mg/g, by age & risk factor, 1998-2012
Data source: National Health and Nutrition Examination Survey (NHANES), 1988–1994, 1999-2004 & 2007–2012 participants age 20 & older. Single-sample estimates of eGFR & ACR; eGFR calculated using the CKD-EPI equation. Diabetes defined as HbA1c >7 percent, self-reported (SR), or currently taking glucose-lowering medications. Hypertension defined as BP ≥130/≥80 for those with diabetes or CKD, otherwise BP ≥140/≥90, or taking medication for hypertension. Abbreviations: ACR, urine albumin/creatinine ratio; BMI, body mass index; CKD, chronic kidney disease; CVD, cardiovascular disease; DM, diabetes mellitus; eGFR, estimated glomerular filtration rate; HTN, hypertension; SR, self-report.

Chapter1:CKDintheGeneralPopulation
17
In Figure 1.7 we present the occurrence of eGFR <60 ml/min/1.73 m2 and ACR ≥30 mg/g among adult NHANES 2007–2012 participants with diabetes mellitus, hypertension, SR CVD, and body mass index ≥30 kg/m2. eGFR <60 was most prevalent in those with SR CVD, at 26.8 percent, followed by those with diabetes mellitus, hypertension, and high body mass index, at 20.3, 17.2 and 7.4 percent, respectively. ACR ≥30 was most common in those with diabetes mellitus, at 29.3 percent, followed by those with SR CVD, hypertension, and high body mass index, at 19.8, 13.7, and 11.5 percent. The presence of both eGFR <60 and ACR ≥30 was most common with SR CVD, at 15.8 percent, followed by diabetes mellitus, hypertension, and high body mass index, at 9.7, 5.8, and 2.2 percent.
vol 1 Figure 1.7 Distribution of markers of CKD in NHANES participants with diabetes, hypertension, self-reported cardiovascular disease, & obesity, 2007–2012
Data Source: National Health and Nutrition Examination Survey (NHANES), 2007–2012 participants age 20 & older. Single-sample estimates of eGFR & ACR; eGFR calculated using the CKD-EPI equation. Abbreviations: ACR, urine albumin/creatinine ratio; BMI, body mass index; CKD, chronic kidney disease; SR CVD, self-reported cardiovascular disease; eGFR, estimated glomerular filtration rate; HTN, hypertension.
The increase in the odds of eGFR <60 ml/min/1.73 m2, ACR ≥ 30 mg/g, and either eGFR <60 or ACR ≥30 for each of the comorbid conditions are shown in Figures 1.8-1.10 (adjusted for age, sex, and race).
vol 1 Figure 1.8 Adjusted odds ratios of CKD in NHANES participants by risk factor, 1998-2012
Data Source: National Health and Nutrition Examination Survey (NHANES), 1988–1994, 1999-2004 & 2007–2012 participants age 20 & older; single-sample estimates of eGFR & ACR. Adj: age, sex, & race; eGFR calculated using the CKD-EPI equation. Whisker lines indicate 95% confidence intervals. Abbreviations: ACR, urine albumin/creatinine ratio; BMI, body mass index; CKD, chronic kidney disease; CVD, cardiovascular disease; DM, diabetes mellitus; eGFR, estimated glomerular filtration rate; HTN, hypertension; SR, self-report.
Adjusted odds ratios for eGFR <60 ml/min/1.73 m² or ACR ≥30 mg/g (Figure 1.8) were lower in NHANES 1999-2004 and 2007–2012 participants than in 1988–1994, for each risk factor except SR CVD, where adjusted odds ratios rose from 1.61 to 2.25. For eGFR <60 alone (Figure 1.9), adjusted odds ratios followed a similar pattern, except for diabetes and self-reported diabetes, where the odds increased from 1.66 to approximately 2.35 in both groups. Also, eGFR <60 showed a very strong association with age, with adjusted odds ratios in the 100 range. For ACR ≥30 alone (Figure 1.10), a substantial decline in the adjusted odds ratio is seen among those in both diabetes mellitus (from 4.70 to 3.60) and hypertension categories (from 6.37 to 4.40), while a substantial increase in the adjusted odds ratio is seen for SR CVD (from 1.59 to 2.17).

2014 USRDS Annual Data Report | Volume 1 - CKD
18
vol 1 Figure 1.9 Adjusted odds ratios of eGFR <60 ml/min/1.73m2 in NHANES participants by age & risk factor, 1998-2012
(a) Age category (b) CKD risk factor
Reference
Data Source: National Health and Nutrition Examination Survey (NHANES), 1988–1994, 1999-2004 & 2007–2012 participants age 20 & older; single-sample estimates of eGFR & ACR. Adj: age, sex, & race; eGFR calculated using the CKD-EPI equation. Whisker lines indicate 95% confidence intervals. Abbreviations: ACR, urine albumin/creatinine ratio; BMI, body mass index; CKD, chronic kidney disease; CVD, cardiovascular disease; DM, diabetes mellitus; eGFR, estimated glomerular filtration rate; HTN, hypertension; SR, self-report.
vol 1 Figure 1.10 Adjusted odds ratios of urine albumin/creatinine ratio ≥30 mg/g in NHANES participants by age & risk factor, 1998-2012
Data Source: National Health and Nutrition Examination Survey (NHANES), 1988–1994, 1999-2004 & 2007–2012 participants age 20 & older; single-sample estimates of eGFR & ACR. Adjusted: age, sex, & race; eGFR calculated using the CKD-EPI equation. Whisker lines indicate 95% confidence intervals. Abbreviations: ACR, urine albumin/creatinine ratio; BMI, body mass index; CKD, chronic kidney disease; CVD, cardiovascular disease; DM, diabetes mellitus; eGFR, estimated glomerular filtration rate; HTN, hypertension; SR, self-report.

Chapter1:CKDintheGeneralPopulation
19
Awareness, Treatment, and Control
Among the individuals that are classified as having CKD by laboratory measurements, the percent of those individuals being aware of their kidney disease has remained low over the years 1999-2010 (Figure 1.11), with improvement between the years 2003-2006 and 2007-2010, among Stage 4 individuals. Note that 4-year cohorts are examined in this graphic, the awareness variable was not included in the in the years 1988-1994 and is not available for 2011-2012 sampling of NHANES. Awareness is not presented for Stage 5 CKD due to very small sample size.
Table 1.4 presents awareness, treatment, and control of hypertension, hyperlipidemia, and diabetes mellitus in NHANES 1988–1994, 1999-2004 and 2007–2012 adult participants with eGFR <60 ml/min/1.73 m² or ACR ≥30 mg/g. While the prevalence of hypertension among CKD patients was similar in the three periods, at 70 versus 74 percent, the proportion of participants unaware of their hypertension rose from 36 percent to 51 percent in the first two survey time frames and then declined to 24 percent by the third survey period. The proportion of individuals who were aware, treated, and disease-controlled rose steadily from approximately 12 percent in the early cohorts to 27 percent in the 2007-2012 cohort. In the subgroup with diabetes mellitus, glycemic control improved firmly from 31 to 39 and then to 45 percent over the three survey periods.
Data Source: National Health and Nutrition Examination Survey (NHANES), 1988–1994, 1999-2004 & 2007–2012 participants age 20 & older. Abbreviations: CKD, chronic kidney disease.
vol 1 Figure 1.11 NHANES participants with CKD aware of their kidney disease, 1999-2010

2014 USRDS Annual Data Report | Volume 1 - CKD
20
vol 1 Table 1.4 Awareness, treatment, & measures of control of risk factors (% of NHANES participants), 1998-2012
All CKD eGFR <60 ml/min/1.73m2
ACR ≥30
1988-1994 1999-2004 2007-2012 1988-1994 1999-2004 2007-2012 1988-1994 1999-2004 2007-2012
Hypertension, by current hypertensive statusa
Non-hypertensive status 30.7 26.5 26.0 18.4 14.3 15.9 32.0 30.4 29.1Hypertensive (measured/treated) 69.3 73.5 74.0 81.6 85.7 84.1 68.0 69.6 70.9
Control of hypertension among hypertensive patientsb
Unaware 33.4 50.6 22.5 22.8 44.2 16.4 36.0 54.7 25.1Aware, not treated 14.7 6.3 6.5 12.1 4.2 2.8 15.7 7.1 8.7Aware, treated, uncontrolled 39.2 31.5 43.9 47.8 36.4 46.6 38.4 30.2 44.8Aware, treated, controlled 12.7 11.5 27.2 17.3 15.2 34.2 9.9 8.0 21.4
Total cholesterolc
<200 (desirable) 35.1 46.6 58.7 27.2 45.6 62.1 38.2 47.5 58.2200–239 (borderline high) 33.5 32.6 26.4 32.7 33.7 23.5 32.8 31.9 27.3240+ (high) 31.4 20.8 14.9 40.0 20.7 13.4 29.0 20.6 14.5
Uric AcidNormal 69.6 69.2 69.2 54.4 55.2 55.1 73.9 74.0 75.4High 30.4 30.8 30.8 45.6 44.8 44.9 26.1 26.0 24.6
SmokingCurrent 22.2 16.9 14.6 11.9 7.8 8.2 27.0 21.3 17.6Former 35.2 32.3 32.6 43.2 39.4 40.1 31.5 29.1 29.7Never 42.6 50.7 52.8 44.9 52.8 51.6 41.5 49.6 52.6
Control of diabetes among patients with diabetesd
Glycohemoglobin <7% (controlled) 31.5 39.2 45.3 37.1 50.9 55.0 29.6 33.6 37.9Glycohemoglobin 7% or higher (uncontrolled) 68.5 60.8 55.7 62.9 49.1 45.0 70.4 66.4 62.1
Data Source: National Health and Nutrition Examination Survey (NHANES), 1988–1994, 1999-2004 & 2007–2012 participants age 20 & older. Single-sample estimates of eGFR & ACR; eGFR calculated using the CKD-EPI equation. Abbreviations: ACR, urine albumin/creatinine ratio; CKD, chronic kidney disease; eGFR, estimated glomerular filtration rate. a. Hypertension defined as blood pressure ≥130/≥80 for those with CKD and diabetes; otherwise ≥140/≥90, or self- reported treatment for hypertension. b. Awareness and treatment are self-reported. Control defined as <130/<80 for those with CKD and diabetes; otherwise <140/<90. c. Total cholesterol classified according to Adult Treatment Panel III blood cholesterol guidelines (ATP III). d. Glycohemoglobin classified according to American Diabetes Association guidelines.

Chapter1:CKDintheGeneralPopulation
21
vol 1 Figure 1.12 NHANES participants at target blood pressure, 1998-2012
Data Source: National Health and Nutrition Examination Survey (NHANES), 1988–1994, 1999-2004 & 2007–2012 participants age 20 & older. Single-sample estimates of eGFR & ACR; eGFR calculated using the CKD-EPI equation. Figure represents all hypertensives plus those hypertensive participants that are at target blood pressure, probably due to medication. Abbreviations: ACR, urine albumin/creatinine ratio; CKD, chronic kidney disease; eGFR, estimated glomerular filtration rate.
vol 1 Figure 1.13 NHANES participants within uric acid normal range, 1998-2012
Data Source: National Health and Nutrition Examination Survey (NHANES), 1988–1994, 1999-2004 & 2007–2012 participants age 20 & older. Single-sample estimates of eGFR & ACR; eGFR calculated using the CKD-EPI equation. Abbreviations: ACR, urine albumin/creatinine ratio; CKD, chronic kidney disease; eGFR, estimated glomerular filtration rate.
vol 1 Figure 1.14 NHANES participants not currently smoking, 1998-2012
Data Source: National Health and Nutrition Examination Survey (NHANES), 1988–1994, 1999-2004 & 2007–2012 participants age 20 & older. Single-sample estimates of eGFR & ACR; eGFR calculated using the CKD-EPI equation. Abbreviations: ACR, urine albumin/creatinine ratio; CKD, chronic kidney disease; eGFR, estimated glomerular filtration rate.
vol 1 Figure 1.15 Diabetic NHANES participants with glycohemoglobin <7%, 1998-2012
Data Source: National Health and Nutrition Examination Survey (NHANES),1988–1994, 1999-2004 & 2007–2012 participants age 20 & older. Single-sample estimates of eGFR & ACR; eGFR calculated using the CKD-EPI equation. Abbreviations: ACR, urine albumin/creatinine ratio; CKD, chronic kidney disease; eGFR, estimated glomerular filtration rate.
As illustrated by Figures 1.12-1.15, over the periods of 1988–1994, 1999-2004 and 2007–2012, improvements in the management of hypertension, smoking, and hyperglycemia among diabetic participants were present, regardless of whether eGFR or ACR was used for subgroup definition.
2014 USRDS Annual Data Report | Volume 1 - CKD
22
References
Levey AS, Stevens LA, Schmid CH, Zhang YL, Castro AF, Feldman HI, Kusek JW, Eggers P, Van Lente F, Greene T, Coresh J. A new equation to estimate glomerular filtration rate. Annals of Internal Medicine 2009;150(9):604-612.
National Kidney Foundation. K/DOQI Clinical Practice Guidelines for Chronic Kidney Disease: Evaluation, Classification, and Stratification. American Journal of Kidney Diseases 2002 Feb;39(2 Suppl 1):S1-266.