salesforce announces fiscal 2018 first quarter results...
TRANSCRIPT

John Cummings Salesforce Investor Relations 415-778-4188 [email protected] Gina Sheibley Salesforce Public Relations 917-297-8988
Salesforce Announces Fiscal 2018 First Quarter Results Raises FY18 Revenue Guidance to $10.25 Billion to $10.30 Billion
• First Quarter Revenue of $2.39 Billion, up 25% Year-Over-Year, 25% in Constant Currency • First Quarter Operating Cash Flow of $1.23 Billion, up 17% Year-Over-Year • Deferred Revenue of $5.04 Billion, up 26% Year-Over-Year, 27% in Constant Currency • Unbilled Deferred Revenue of Approximately $9.6 Billion, up 26% Year-Over-Year • Initiates Second Quarter Revenue Guidance of $2.51 Billion to $2.52 Billion • Raises FY18 GAAP Earnings Per Share Guidance to $0.06 to $0.08 • Raises FY18 Non-GAAP Earnings Per Share Guidance to $1.28 to $1.30
SAN FRANCISCO, Calif. – May 18, 2017 – Salesforce (NYSE: CRM), the global leader in CRM, today announced results for its fiscal first quarter ended April 30, 2017. “With our outstanding first quarter results, we are thrilled to be raising our fiscal 2018 revenue guidance by $100 million and raising our GAAP and non-GAAP earnings per share expectations for the year,” said Marc Benioff, chairman and CEO, Salesforce. “Salesforce has once again been named the CRM market leader, and we continue to grow our share in CRM -- the fastest growing enterprise software market.” Salesforce delivered the following results for its fiscal first quarter 2018:
Revenue: Total Q1 revenue was $2.39 billion, an increase of 25% year-over-year, and 25% in constant currency. Subscription and support revenues were $2.2 billion, an increase of 24% year-over-year. Professional services and other revenues were $187 million, an increase of 32% year-over-year. Earnings per Share: Q1 GAAP loss per share was ($0.01), and non-GAAP diluted earnings per share was $0.28. Cash: Cash generated from operations for the first quarter was $1.23 billion, an increase of 17% year-over-year. Total cash, cash equivalents and marketable securities finished the quarter at $3.22 billion.
Deferred Revenue: Deferred revenue on the balance sheet as of April 30, 2017 was $5.04 billion, an increase of 26% year-over-year, and 27% in constant currency. Unbilled deferred revenue, representing business that is contracted but unbilled and off balance sheet, ended the first quarter at approximately $9.6 billion, up 26% year-over-year. This includes approximately $450 million related to unbilled deferred revenue from Demandware.
As of May 18, 2017, the company is initiating revenue, earnings per share, and deferred revenue guidance for its second quarter of fiscal year 2018. In addition, the company is raising its full fiscal year

2018 revenue and earnings per share guidance, and maintaining its operating cash flow guidance, previously provided on February 28, 2017.
Q2 FY18 Guidance: Revenue is projected to be approximately $2.51 billion to $2.52 billion, an increase of 23% to 24% year-over-year. GAAP diluted earnings per share is projected to be $0.00 to $0.01, while non-GAAP diluted earnings per share is projected to be $0.31 to $0.32. On balance sheet deferred revenue growth is projected to be approximately 22% year-over-year.
Full Year FY18 Guidance: Revenue is projected to be approximately $10.25 billion to $10.30 billion, an increase of 22% to 23% year-over-year. GAAP diluted earnings per share is projected to be $0.06 to $0.08, while non-GAAP diluted earnings per share is projected to be $1.28 to $1.30. Operating cash flow growth is projected to be 20% to 21% year-over-year.
The following is a per share reconciliation of GAAP diluted earnings per share to non-GAAP diluted earnings per share guidance for the next quarter and the full year:
For additional information regarding non-GAAP financial measures see the reconciliation of results and related explanations below. Quarterly Conference Call Salesforce will host a conference call at 2:00 p.m. (PT) / 5:00 p.m. (ET) today to discuss its financial results with the investment community. A live web broadcast of the event will be available on the Salesforce Investor Relations website at www.salesforce.com/investor. A live dial-in is available domestically at 866-901-SFDC or 866-901-7332 and internationally at 706-902-1764, passcode 14740454. A replay will be available at (800) 585-8367 or (855) 859-2056 until midnight (ET) June 18, 2017.
Q2 FY2018
GAAP diluted EPS range* $0.00 - $0.01 $0.06 - $0.08PlusAmortization of purchased intangibles 0.10$ 0.39$ Stock-based expense 0.33$ 1.34$ Amortization of debt discount, net 0.01$ 0.04$ LessIncome tax effects and adjustments** (0.13)$ (0.55)$ Non-GAAP diluted EPS $0.31 - $0.32 $1.28 - $1.30
Shares used in computing basic net income per share (millions) 713 716Shares used in computing diluted net income per share (millions) 729 733
Fiscal 2018
** The Company’s non-GAAP tax provision uses a long-term projected tax rate of 34.5%.
* For Q2 GAAP diluted EPS, diluted number of shares used for calculation and expected tax rate of 65%. For FY18 GAAP diluted EPS, diluted number of shares used for calculation and expected tax rate of 58%.

About Salesforce Salesforce, Intelligent Customer Success Platform and world’s #1 CRM provider, empowers companies to connect with their customers in a whole new way. Salesforce has headquarters in San Francisco, with offices in Europe and Asia, and trades on the New York Stock Exchange under the ticker symbol "CRM." For more information about Salesforce, visit: www.salesforce.com.
###
"Safe harbor" statement under the Private Securities Litigation Reform Act of 1995: This press release contains forward-looking statements about our financial results, which may include expected GAAP and non-GAAP financial and other operating and non-operating results, including revenue, net income (loss), diluted earnings (loss) per share, operating cash flow growth, operating margin improvement, deferred revenue growth, expected revenue run rate, expected tax rates, stock-based compensation expenses, amortization of purchased intangibles, amortization of debt discount and shares outstanding. The achievement or success of the matters covered by such forward-looking statements involves risks, uncertainties and assumptions. If any such risks or uncertainties materialize or if any of the assumptions prove incorrect, the company’s results could differ materially from the results expressed or implied by the forward-looking statements we make. The risks and uncertainties referred to above include -- but are not limited to -- risks associated with possible fluctuations in the company’s financial and operating results; the company’s rate of growth and anticipated revenue run rate, including the company’s ability to convert deferred revenue and unbilled deferred revenue into revenue and, cash flow, and ability to maintain continued growth of deferred revenue and unbilled deferred revenue; foreign currency exchange rates; errors, interruptions or delays in the company’s services or the company’s Web hosting; breaches of the company’s security measures; the financial and other impact of any previous and future acquisitions; the nature of the company’s business model, including risks related to government contracts; the company’s ability to continue to release, and gain customer acceptance of, new and improved versions of the company’s services; successful customer deployment and utilization of the company’s existing and future services; changes in the company’s sales cycle; competition; various financial aspects of the company’s subscription model; unexpected increases in attrition or decreases in new business; the company’s ability to realize benefits from strategic partnerships and strategic investments; the emerging markets in which the company operates; unique aspects of entering or expanding in international markets, including the compliance with United States export control laws, the company’s ability to hire, retain and motivate employees and manage the company’s growth; changes in the company’s customer base; technological developments; regulatory developments; litigation related to intellectual property and other matters, and any related claims, negotiations and settlements; unanticipated changes in the company’s effective tax rate; factors affecting the company’s outstanding convertible notes, term loan, and revolving credit facility; fluctuations in the number of company shares outstanding and the price of such shares; collection of receivables; interest rates; factors affecting the company’s deferred tax assets and ability to value and utilize them; the potential negative impact of indirect tax exposure; the risks and expenses associated with the company’s real estate and office facilities space; and general developments in the economy, financial markets, and the impact of current and future accounting pronouncements and other financial reporting standards and credit markets. Further information on these and other factors that could affect the company’s financial results is included in the reports on Forms 10-K, 10-Q and 8-K and in other filings we make with the Securities and Exchange Commission from time to time. These documents are available on the SEC Filings section of the Investor Information section of the company’s website at www.salesforce.com/investor. Salesforce.com, inc. assumes no obligation and does not intend to update these forward-looking statements, except as required by law. © 2017 salesforce.com, inc. All rights reserved. Salesforce and other marks are trademarks of salesforce.com, inc. Other brands featured herein may be trademarks of their respective owners.

salesforce.com, inc.Consolidated Statements of Operations(in thousands, except per share data)(unaudited)
Three Months Ended April 30,
2017
As a % ofTotal
Revenues 2016
As a % ofTotal
Revenues
Revenues:Subscription and support $ 2,200,908 92 % $ 1,775,493 93%Professional services and other 186,671 8 141,110 7
Total revenues 2,387,579 100 1,916,603 100Cost of revenues (1)(2):
Subscription and support 462,921 19 351,101 18Professional services and other 187,634 8 145,880 8
Total cost of revenues 650,555 27 496,981 26Gross profit 1,737,024 73 1,419,622 74Operating expenses (1)(2):
Research and development 376,081 16 260,970 14Marketing and sales 1,109,504 46 895,860 46General and administrative 260,321 11 210,806 11
Total operating expenses 1,745,906 73 1,367,636 71Income (loss) from operations (8,882) 0 51,986 3Investment income 5,266 0 8,122 0Interest expense (22,196) (1) (22,011) (1)Other income (expense) (1) 2,849 0 (13,806) (1)Gains from acquisitions of strategic investments 0 0 12,864 1Income (loss) before benefit from income taxes (22,963) (1) 37,155 2Benefit from income taxes 13,756 1 1,604 0Net income (loss) $ (9,207) 0 % $ 38,759 2%Basic net income (loss) per share $ (0.01) $ 0.06Diluted net income (loss) per share $ (0.01) $ 0.06Shares used in computing basic net income (loss) per share 706,174 677,514Shares used in computing diluted net income (loss) per share 706,174 686,799
(1) Amounts include amortization of purchased intangibles from business combinations, as follows:
Three Months Ended April 30,
2017
As a % ofTotal
Revenues 2016
As a % ofTotal
RevenuesCost of revenues $ 43,586 2% $ 22,215 1%Marketing and sales 30,644 1 15,386 1Other non-operating expense 375 0 706 0
(2) Amounts include stock-based expense, as follows:
Three Months Ended April 30,
2017
As a % ofTotal
Revenues 2016
As a % ofTotal
Revenues
Cost of revenues $ 31,510 1% $ 26,634 1%Research and development 63,915 3 35,168 2Marketing and sales 118,996 5 95,474 5General and administrative 37,148 2 31,643 2

salesforce.com, inc.Consolidated Balance Sheets(in thousands)
April 30,2017
January 31,2017
(unaudited)
AssetsCurrent assets:
Cash and cash equivalents $ 2,024,904 $ 1,606,549Marketable securities 1,194,646 602,338Accounts receivable, net 1,439,875 3,196,643Deferred commissions 297,419 311,770Prepaid expenses and other current assets 447,647 279,527
Total current assets 5,404,491 5,996,827Property and equipment, net 1,846,413 1,787,534Deferred commissions, noncurrent 220,507 227,849Capitalized software, net 141,685 141,671Strategic investments 639,191 566,953Goodwill 7,290,025 7,263,846Intangible assets acquired through business combinations, net 1,041,384 1,113,374Other assets, net 475,234 486,869Total assets $ 17,058,930 $ 17,584,923Liabilities and stockholders’ equityCurrent liabilities:
Accounts payable, accrued expenses and other liabilities $ 1,459,686 $ 1,752,664Deferred revenue 5,042,652 5,542,802Convertible 0.25% senior notes, net 1,123,525 0
Total current liabilities 7,625,863 7,295,466Convertible 0.25% senior notes, net 0 1,116,360Term loan 497,509 497,221Loan assumed on 50 Fremont 198,336 198,268Revolving credit facility 0 196,542Other noncurrent liabilities 802,734 780,939Total liabilities 9,124,442 10,084,796Stockholders’ equity:
Common stock 712 708Additional paid-in capital 8,398,380 8,040,170Accumulated other comprehensive income (loss) 9,513 (75,841)Accumulated deficit (474,117) (464,910)
Total stockholders’ equity 7,934,488 7,500,127Total liabilities and stockholders’ equity $ 17,058,930 $ 17,584,923

salesforce.com, inc.Consolidated Statements of Cash Flows(in thousands)(unaudited)
Three Months Ended April 30,
2017 2016Operating activities:Net income (loss) $ (9,207) $ 38,759
Adjustments to reconcile net income (loss) to net cash provided by operating activities:
Depreciation and amortization 185,108 132,772Amortization of debt discount and issuance costs 7,717 7,185Gains from acquisitions of strategic investments 0 (12,864)Amortization of deferred commissions 106,142 88,514Expenses related to employee stock plans 251,569 188,919Changes in assets and liabilities, net of business combinations:
Accounts receivable, net 1,757,507 1,307,312Deferred commissions (84,449) (63,519)Prepaid expenses and other current assets and other assets (183,411) (56,671)Accounts payable, accrued expenses and other liabilities (301,242) (286,228)Deferred revenue (500,150) (293,117)Net cash provided by operating activities 1,229,584 1,051,062
Investing activities:Business combinations, net of cash acquired (19,781) (1,799)Strategic investments, net (458) (22,061)Purchases of marketable securities (698,561) (589,336)Sales of marketable securities 103,837 222,934Maturities of marketable securities 3,850 23,285Capital expenditures (156,602) (83,301)
Net cash used in investing activities (767,715) (450,278)Financing activities:Proceeds from employee stock plans 159,807 89,141Principal payments on capital lease obligations (9,443) (49,968)Payments on revolving credit facility (200,000) 0
Net cash provided by (used in) financing activities (49,636) 39,173Effect of exchange rate changes 6,122 763Net increase in cash and cash equivalents 418,355 640,720Cash and cash equivalents, beginning of period 1,606,549 1,158,363Cash and cash equivalents, end of period $ 2,024,904 $ 1,799,083
salesforce.com, inc.Additional Metrics(Unaudited)
Apr 30,2017
Jan 31, 2017
Oct 31, 2016
Jul 31,2016
Apr 30, 2016
Jan 31, 2016
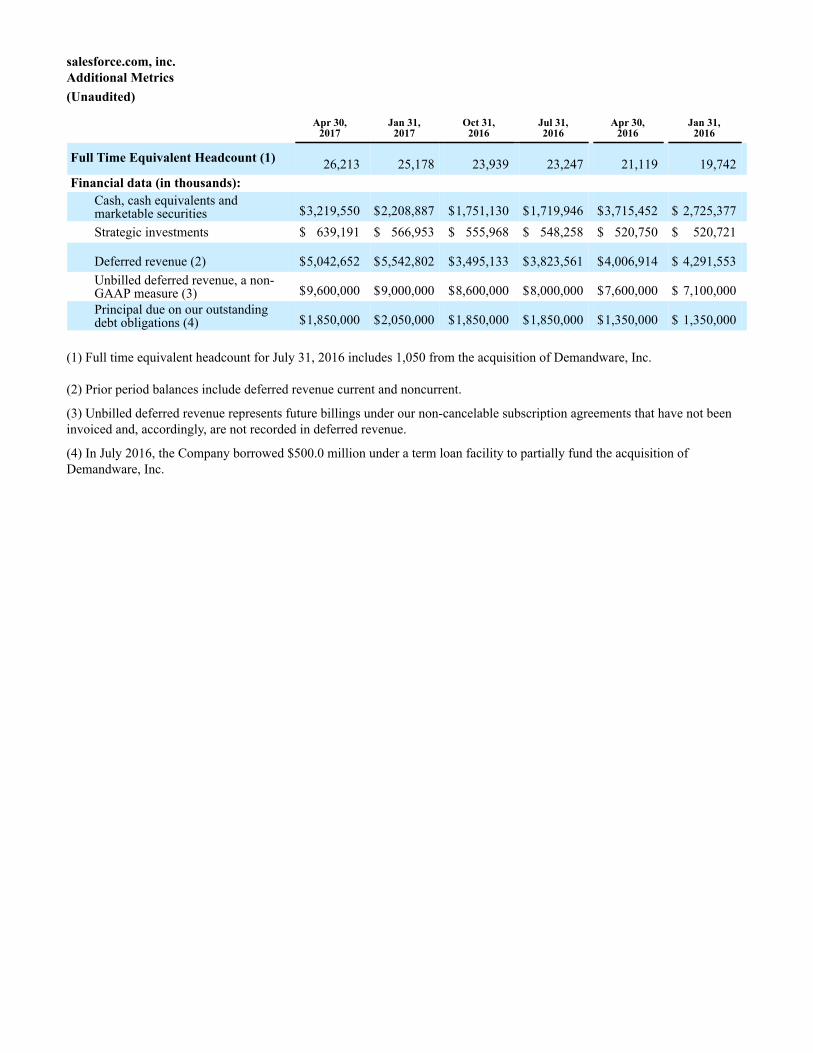
Full Time Equivalent Headcount (1) 26,213 25,178 23,939 23,247 21,119 19,742Financial data (in thousands):
Cash, cash equivalents andmarketable securities $3,219,550 $2,208,887 $1,751,130 $1,719,946 $3,715,452 $ 2,725,377Strategic investments $ 639,191 $ 566,953 $ 555,968 $ 548,258 $ 520,750 $ 520,721
Deferred revenue (2) $5,042,652 $5,542,802 $3,495,133 $3,823,561 $4,006,914 $ 4,291,553Unbilled deferred revenue, a non-GAAP measure (3) $9,600,000 $9,000,000 $8,600,000 $8,000,000 $7,600,000 $ 7,100,000Principal due on our outstandingdebt obligations (4) $1,850,000 $2,050,000 $1,850,000 $1,850,000 $1,350,000 $ 1,350,000
(1) Full time equivalent headcount for July 31, 2016 includes 1,050 from the acquisition of Demandware, Inc.
(2) Prior period balances include deferred revenue current and noncurrent.
(3) Unbilled deferred revenue represents future billings under our non-cancelable subscription agreements that have not been invoiced and, accordingly, are not recorded in deferred revenue.
(4) In July 2016, the Company borrowed $500.0 million under a term loan facility to partially fund the acquisition of Demandware, Inc.

Selected Balance Sheet Accounts (in thousands):
April 30,
2017January 31,
2017
Prepaid Expenses and Other Current Assets Prepaid income taxes $ 69,134 $ 26,932Other taxes receivable 33,687 34,177Prepaid expenses and other current assets 344,826 218,418
$ 447,647 $ 279,527Property and Equipment, net
Land $ 183,888 $ 183,888Buildings and building improvements 621,950 621,377Computers, equipment and software 1,503,140 1,440,986Furniture and fixtures 122,435 112,564Leasehold improvements 696,902 627,069
3,128,315 2,985,884Less accumulated depreciation and amortization (1,281,902) (1,198,350)
$ 1,846,413 $ 1,787,534Intangible Assets Acquired Through Business Combinations, net
Acquired developed technology $ 471,016 $ 514,232Customer relationships 562,125 589,579Trade name and trademark 4,091 4,601Territory rights and other 3,096 3,53050 Fremont lease intangibles 1,056 1,432
$ 1,041,384 $ 1,113,374
Other Assets, net Deferred income taxes, noncurrent, net $ 29,312 $ 28,939Long-term deposits 23,874 23,597Domain names and patents, net of accumulated amortization 34,784 39,213Customer contract asset 255,387 281,733Other 131,877 113,387
$ 475,234 $ 486,869
Accounts Payable, Accrued Expenses and Other Liabilities Accounts payable $ 128,065 $ 115,257Accrued compensation 434,899 730,390Non-cash equity liability 60,870 68,355Accrued other liabilities 562,848 521,405Accrued income and other taxes payable 192,434 239,699Accrued professional costs 38,098 38,254Accrued rent 22,777 19,710Financing obligation - leased facility, current 19,695 19,594
$ 1,459,686 $ 1,752,664Other Noncurrent Liabilities
Deferred income taxes and income taxes payable $ 106,303 $ 99,378Financing obligation - leased facility 200,129 200,711Long-term lease liabilities and other 496,302 480,850
$ 802,734 $ 780,939
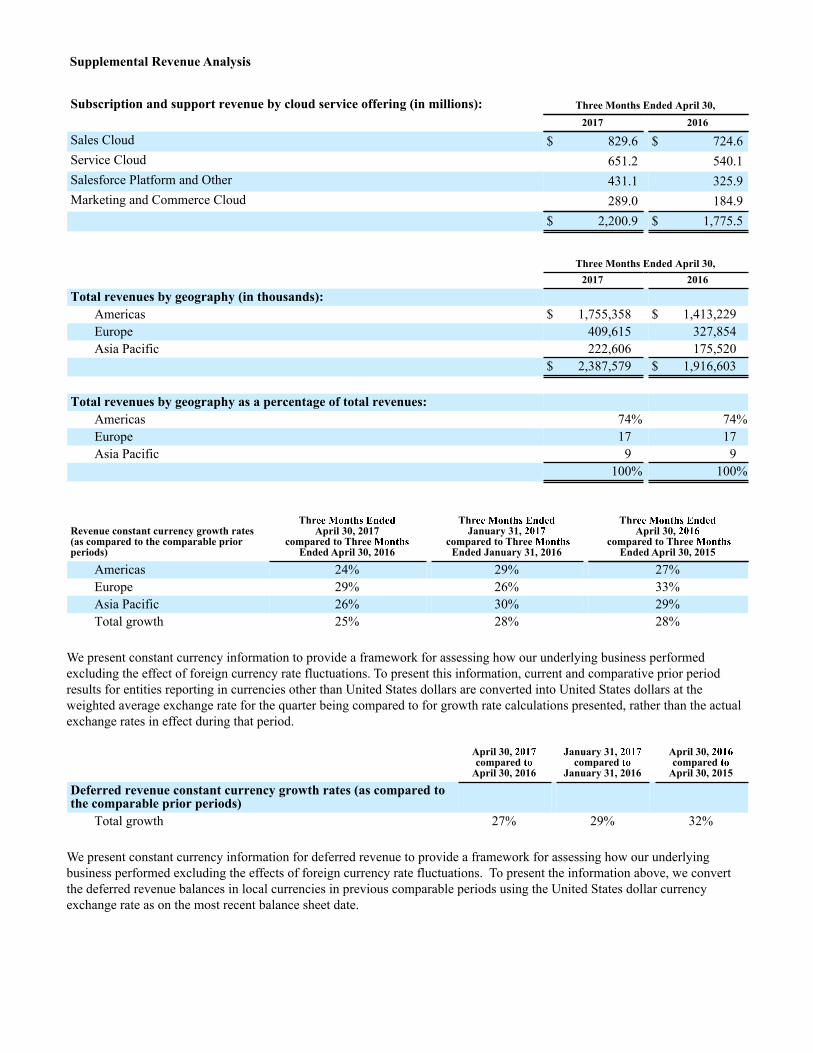
Supplemental Revenue Analysis
Subscription and support revenue by cloud service offering (in millions): Three Months Ended April 30,
2017 2016
Sales Cloud $ 829.6 $ 724.6Service Cloud 651.2 540.1Salesforce Platform and Other 431.1 325.9Marketing and Commerce Cloud 289.0 184.9
$ 2,200.9 $ 1,775.5
Three Months Ended April 30, 2017 2016
Total revenues by geography (in thousands):Americas $ 1,755,358 $ 1,413,229Europe 409,615 327,854Asia Pacific 222,606 175,520
$ 2,387,579 $ 1,916,603
Total revenues by geography as a percentage of total revenues:Americas 74% 74%Europe 17 17Asia Pacific 9 9
100% 100%
Revenue constant currency growth rates(as compared to the comparable prior periods)
ThrApril 30, 2017
compared to Three Ended April 30, 2016
ThrJanuary 31,
compared to Three Ended January 31, 2016
ThrApril 30,
compared to Three Ended April 30, 2015
Americas 24% 29% 27%Europe 29% 26% 33%Asia Pacific 26% 30% 29%Total growth 25% 28% 28%
We present constant currency information to provide a framework for assessing how our underlying business performed excluding the effect of foreign currency rate fluctuations. To present this information, current and comparative prior period results for entities reporting in currencies other than United States dollars are converted into United States dollars at the weighted average exchange rate for the quarter being compared to for growth rate calculations presented, rather than the actual exchange rates in effect during that period.
April 30, compared
April 30, 2016
January 31, compared
January 31, 2016
April 30, compared
April 30, 2015
Deferred revenue constant currency growth rates (as compared tothe comparable prior periods)
Total growth 27% 29% 32%
We present constant currency information for deferred revenue to provide a framework for assessing how our underlying business performed excluding the effects of foreign currency rate fluctuations. To present the information above, we convert the deferred revenue balances in local currencies in previous comparable periods using the United States dollar currency exchange rate as on the most recent balance sheet date.

Supplemental Non-GAAP Diluted Share Count Information(share data in thousands)
Three Months Ended April 30, 2017 2016
Weighted-average shares outstanding for basic earnings per share 706,174 677,514Effect of dilutive securities: (1)
Convertible senior notes (2) 3,390 945Employee stock awards 11,986 8,340
Adjusted weighted-average shares outstanding and assumed conversions for Non-GAAP diluted earnings per share 721,550 686,799
(1) The effect of these dilutive securities were not included in the GAAP calculation of diluted net loss per share for the three months ended April 30, 2017 because the effect would have been anti-dilutive.
(2) The 0.25% senior notes were not convertible, however there was a dilutive effect for shares outstanding for all periods presented.
Supplemental Cash Flow InformationFree cash flow analysis, a non-GAAP measure(in thousands)
Three Months Ended April 30, 2017 2016
Operating cash flowGAAP net cash provided by operating activities $ 1,229,584 $ 1,051,062Less:Capital expenditures (156,602) (83,301)Free cash flow $ 1,072,982 $ 967,761
Our free cash flow analysis includes GAAP net cash provided by operating activities less capital expenditures. The capital expenditures balance does not include our strategic investments.
Comprehensive Income(in thousands)(Unaudited)
Three Months Ended April 30, 2017 2016
Net income (loss) $ (9,207) $ 38,759Other comprehensive income, before tax and net of reclassification adjustments:
Foreign currency translation and other losses 14,024 10,256Unrealized gains on investments 71,330 11,084
Other comprehensive income, before tax 85,354 21,340Tax effect 0 0Other comprehensive income, net of tax 85,354 21,340Comprehensive income $ 76,147 $ 60,099

salesforce.com, inc.GAAP Results Reconciled to non-GAAP ResultsThe following table reflects selected GAAP results reconciled to non-GAAP results. (in thousands, except per share data)(Unaudited) Three Months Ended April 30, 2017 2016
Non-GAAP gross profitGAAP gross profit $ 1,737,024 $ 1,419,622Plus:Amortization of purchased intangibles (a) 43,586 22,215Stock-based expense (b) 31,510 26,634Non-GAAP gross profit $ 1,812,120 $ 1,468,471Non-GAAP operating expensesGAAP operating expenses $ 1,745,906 $ 1,367,636Less:Amortization of purchased intangibles (a) (30,644) (15,386)Stock-based expense (b) (220,059) (162,285)Non-GAAP operating expenses $ 1,495,203 $ 1,189,965Non-GAAP income from operationsGAAP income (loss) from operations $ (8,882) $ 51,986Plus:Amortization of purchased intangibles (a) 74,230 37,601Stock-based expense (b) 251,569 188,919Non-GAAP income from operations $ 316,917 $ 278,506Non-GAAP non-operating loss (c)GAAP non-operating loss $ (14,081) $ (14,831)Plus:Amortization of debt discount, net 6,383 6,226Amortization of acquired lease intangible 375 706Less:Gains from acquisitions of strategic investments 0 (12,864)Non-GAAP non-operating loss $ (7,323) $ (20,763)Non-GAAP net income GAAP net income (loss) $ (9,207) $ 38,759Plus:Amortization of purchased intangibles (a) 74,230 37,601Amortization of acquired lease intangible 375 706Stock-based expense (b) 251,569 188,919Amortization of debt discount, net 6,383 6,226Less:Gains from acquisitions of strategic investments 0 (12,864)Income tax effects and adjustments (120,566) (91,814)Non-GAAP net income $ 202,784 $ 167,533

Three Months Ended April 30,2017 2016
Non-GAAP diluted earnings per shareGAAP diluted net income (loss) per share $ (0.01) $ 0.06Plus:Amortization of purchased intangibles 0.10 0.05Amortization of acquired lease intangible 0.00 0.00Stock-based expense 0.35 0.28Amortization of debt discount, net 0.01 0.01Less:Gains from acquisitions of strategic investments 0.00 (0.02)Income tax effects and adjustments (0.17) (0.14)Non-GAAP diluted earnings per share $ 0.28 $ 0.24
Shares used in computing Non-GAAP diluted net income per share 721,550 686,799
a) Amortization of purchased intangibles were as follows:
Three Months Ended April 30, 2017 2016
Cost of revenues $ 43,586 $ 22,215Marketing and sales 30,644 15,386
$ 74,230 $ 37,601
b) Stock-based expense was as follows:
Three Months Ended April 30, 2017 2016
Cost of revenues $ 31,510 $ 26,634Research and development 63,915 35,168Marketing and sales 118,996 95,474General and administrative 37,148 31,643
$ 251,569 $ 188,919
c) GAAP non-operating loss consists of investment income, interest expense, other expense and gains from acquisitions of strategic investments.

salesforce.com, inc.Computation of Basic and Diluted GAAP and non-GAAP Net Income (Loss) Per Share (in thousands, except per share data)(Unaudited)
Three Months Ended April 30, 2017 2016
GAAP Basic Net Income (Loss) Per ShareNet income (loss) $ (9,207) $ 38,759Basic net income (loss) per share $ (0.01) $ 0.06Shares used in computing basic net income (loss) per share 706,174 677,514
Three Months Ended April 30, 2017 2016
Non-GAAP Basic Net Income Per ShareNon-GAAP net income $ 202,784 $ 167,533Basic Non-GAAP net income per share $ 0.29 $ 0.25Shares used in computing basic Non-GAAP net income per share 706,174 677,514
Three Months Ended April 30, 2017 2016
GAAP Diluted Net Income (Loss) Per ShareNet income (loss) $ (9,207) $ 38,759Diluted net income (loss) per share $ (0.01) $ 0.06Shares used in computing diluted net income (loss) per share 706,174 686,799
Three Months Ended April 30, 2017 2016
Non-GAAP Diluted Net Income Per ShareNon-GAAP net income $ 202,784 $ 167,533Diluted Non-GAAP net income per share $ 0.28 $ 0.24Shares used in computing diluted Non-GAAP net income per share 721,550 686,799

Non-GAAP Financial Measures: This press release includes information about non-GAAP diluted earnings per share, non-GAAP tax rates, non-GAAP free cash flow, and constant currency revenue and constant currency deferred revenue growth rates (collectively the “non-GAAP financial measures”). These non-GAAP financial measures are measurements of financial performance that are not prepared in accordance with U.S. generally accepted accounting principles and computational methods may differ from those used by other companies. Non-GAAP financial measures are not meant to be considered in isolation or as a substitute for comparable GAAP measures and should be read only in conjunction with the company’s consolidated financial statements prepared in accordance with GAAP. Management uses both GAAP and non-GAAP measures when planning, monitoring, and evaluating the company’s performance. The primary purpose of using non-GAAP measures is to provide supplemental information that may prove useful to investors and to enable investors to evaluate the company’s results in the same way management does. Management believes that supplementing GAAP disclosure with non-GAAP disclosure provides investors with a more complete view of the company’s operational performance and allows for meaningful period-to-period comparisons and analysis of trends in the company’s business. Further, to the extent that other companies use similar methods in calculating non-GAAP measures, the provision of supplemental non-GAAP information can allow for a comparison of the company’s relative performance against other companies that also report non-GAAP operating results. Non-GAAP diluted earnings per share excludes the impact of the following items: stock-based compensation, amortization of acquisition-related intangibles, amortization of acquired leases, the net amortization of debt discount on the company’s convertible senior notes, gains/losses on sales of land and building improvements, gains/losses on company-initiated acquisitions of entities in which the company held an equity investment, and termination of office leases, as well as income tax adjustments. These items are excluded because the decisions which gave rise to these items were not made to increase revenue in a particular period, but were made for the company’s long-term benefit over multiple periods. Specifically, management is excluding the following items from its non-GAAP earnings per share, as applicable, for the periods presented in the Q1 FY18 financial statements and for its non-GAAP estimates for Q2 and FY18:
• Stock-Based Expenses: The company’s compensation strategy includes the use of stock-based compensation to attract and retain employees and executives. It is principally aimed at aligning their interests with those of our stockholders and at long-term employee retention, rather than to motivate or reward operational performance for any particular period. Thus, stock-based compensation expense varies for reasons that are generally unrelated to operational decisions and performance in any particular period.
• Amortization of Purchased Intangibles and Acquired Leases: The company views amortization of acquisition- and building-related intangible assets, such as the amortization of the cost associated with an acquired company’s research and development efforts, trade names, customer lists and customer relationships, and acquired lease intangibles, as items arising from pre-acquisition activities determined at the time of an acquisition. While these intangible assets are continually evaluated for impairment, amortization of the cost of purchased intangibles is a static expense, one that is not typically affected by operations during any particular period.
• Amortization of Debt Discount: Under GAAP, certain convertible debt instruments that may be settled in cash (or other assets) on conversion are required to be separately accounted for as liability (debt) and equity (conversion option) components of the instrument in a manner that reflects the issuer’s non-convertible debt borrowing rate. Accordingly, for GAAP purposes we are required to recognize imputed interest expense on the company’s $1.15 billion of convertible senior notes due 2018 that were issued in a private placement in March 2013. The imputed interest rate was approximately 2.5% for the convertible notes due 2018, while the actual coupon interest rate of the notes is 0.25%. The difference between the imputed interest expense and
the coupon interest expense, net of the interest amount capitalized, is excluded from management’s assessment of the company’s operating performance because management believes that this non-cash expense is not indicative of ongoing operating performance.
• Gains on Acquisitions of Strategic Investments: The company views gains on sales of its strategic investments resulting from acquisitions initiated by the company in which an equity interest was previously held as discrete events and not indicative of operational performance during any particular period.
• Income Tax Effects and Adjustments: The company utilizes a fixed long-term projected non-
GAAP tax rate in order to provide better consistency across the interim reporting periods by eliminating the effects of items such as changes in the tax valuation allowance and tax effects of acquisitions-related costs, since each of these can vary in size and frequency. When projecting this long-term rate, the company evaluated a three-year financial projection that excludes the direct impact of the following non-cash items: stock-based expenses, amortization of purchased intangibles, amortization of acquired leases, amortization of debt discount, gains/losses on the sales of land and building improvements, gains on sales of strategic investments, and termination of office leases. The projected rate also assumes no new acquisitions in the three-year period, and considers other factors including the company’s tax structure, its tax positions in various jurisdictions and key legislation in major jurisdictions where the company operates. This long-term rate could be subject to change for a variety of reasons, such as significant changes in the geographic earnings mix including acquisition activity, or fundamental tax law changes in major jurisdictions where the company operates. The company re-evaluates this long-term rate on an annual basis or if any significant events that may materially affect this long-term rate occur. The non-GAAP tax rate for fiscal 2018 is 34.5 percent.
The company defines the non-GAAP measure free cash flow as GAAP net cash provided by operating activities, less capital expenditures. For this purpose, capital expenditures does not include our strategic investments, nor does it include any costs or activities related to our purchase of 50 Fremont land and building, and building - leased facilities.