sales forecasting of short-life cycle products using
TRANSCRIPT

Sales forecasting of short-life cycle products using clustering and classification
techniques
ABSTRACT: Technology and globalization have created strong competition among
companies in many industries. This has led to the rapid development of
technological products resulted in a shorter life cycle. Forecasting is essential to
decrease supply chain costs; however, traditional methods of forecasting are not
suitable in this situation because of the lack of historical data and volatile demand.
The literature addresses this challenge using two stages of data mining techniques
by clustering the existing products then classifying the new ones into these
clusters. This paper adopts this technique by using the K-means algorithm to
cluster products with similar sales profiles. Then, the rule induction is used to
generate the criteria of the product in each cluster. The generated rules are used
to forecast the sales profile of a new product using the assigned clusters. A case
study is used to validate the algorithm by comparing the proposed technique with
the literature shows significant improvement by using the suggested
preprocessing and rule induction.
Keywords: sales forecasting, retail industry, technological parts, data mining,
preprocessing, k-means clustering, decision tree, rule induction classification.
1. Introduction
Sales forecasting plays an essential role in all fields of business. Sales forecasting is the first issue,
and good forecasting leads to significant cost savings, reduced inventory levels, improved
customer satisfaction, and increased competitiveness. Sales forecasting can provide retailers a
long way toward optimizing their merchandising life cycle and simultaneously creating for the
customers. It can help in understanding customer demand and buying experience and can also
reveal future potential. Medium and short life cycle products are widely diffused in technological
products (phones, computers, and their accessories) and fashion. A typical sales pattern for such
products is characterized by rapid growth, maturity, and decline phases. At the introduction
stage, the sales are volatile and uncertain. Short life cycle products do not have enough historical
data, so traditional methods cannot handle this type of product.
Artificial intelligence (AI) methods such as neural networks, evolutionary algorithms,
support vector machines, and fuzzy inference systems are widely used in forecasting activities
[1,2]. AI methods to cope well with complexity and uncertainty, and they have better forecasting
accuracy compared to statistical methods. However, they usually require a long computational
time, which makes them less appealing to the fast-changing market of fashion and high
technology products.
GSJ: Volume 9, Issue 3, March 2021, Online: ISSN 2320-9186 www.globalscientificjournal.com
GSJ: Volume 9, Issue 3, March 2021 ISSN 2320-9186 1294
GSJ© 2021 www.globalscientificjournal.com

Recently, various hybrid methods, such as fuzzy neural systems are proposed in the
literature to enhance demand forecast [3, 4]. Hybrid methods utilize the strengths of different
models to form a new forecasting method. They can learn complex relations in an uncertain
environment, and many of them are considered to be more accurate and efficient than the pure
statistical and AI models. In an attempt to cope with the lack of historical data of short life cycle
products, some references use the data of similar products for which sufficient history is available
to forecast the demand of new products [5–7]. For example, a hybrid method based on the k-
means clustering technique and a decision tree classifier was developed to estimate the demand
for textile fashion products [5]. Happiette introduced a similar approach that uses the self-
organizing map and the neural network techniques[6]. This paper suggests an alternative data
mining technique to improve demand forecasting in the context of a large retail company. The
proposed hybrid method depends on the new data treatment to clustering and data
transformation to rule induction classification. Data treatment is in data mining techniques
because, low quality data will lead to low-quality mining [8]. In particular, the k-means clustering
technique and the RULE IDUCTION classification learning algorithm will be employed.
The outline of this paper is as follows. Section 2 reviews the basic concepts of data mining
with a particular focus on clustering and rule induction methods, while section 3 presents the
proposed model of forecasting approach. Section 4 reports the results, and the analysis obtained
with data from the retail industry before concluding the paper in section 5.
2. Background
Data mining is the process of discovering interesting patterns and knowledge from large amounts
of data. The data sources can include databases, data warehouses, the Web, other information
repositories, or data that is streamed into the system dynamically. It has been successfully used
in many applications to uncover hidden patterns and predict future trends and behaviors. There
are three steps in data mining, namely, data preprocessing (data cleaning, integration, selection,
and transformation), data modeling, and pattern evaluation and knowledge presentation [8, 9]. 2.1. Clustering technique
Clustering techniques are concerned with the partitioning of data sets into several homogeneous
clusters. These techniques assign a large number of data objects to a relatively small number of
groups so that data objects in a group share the same properties. Many clustering techniques
have been proposed over the years from different research disciplines [10]. K-means is one of
the best known and commonly used clustering algorithms [11]. The algorithm forms K clusters
that are represented by the mean value of the data points belonging to each of them. It is an
iterative process that searches for a division of data objects into k clusters to minimize the sum
of the Euclidean distances between each object and its closest cluster center. The k-means
algorithm is relatively scalable and efficient in clusters, large data sets because its computational
complexity grows linearly with the number of data objects.
GSJ: Volume 9, Issue 3, March 2021 ISSN 2320-9186 1295
GSJ© 2021 www.globalscientificjournal.com

2.2.Classification technique
Classification learning employs a set of recategorized data objects to develop a model that can be
used to classify new data objects from the same population or to provide a better understanding of
the data objects’ characteristics. Among the various classification learning techniques developed,
inductive learning may be the most commonly used in real-world applications [12]. Inductive
learning techniques relatively fast compare to other techniques. There are many sequential
covering algorithms. Popular variations include AQ, CN2, and the more recent RIPPER (Repeated
Incremental Pruning to Produce Error Reduction) [13] is a rule induction based on reducing error
pruning. Ripper includes three stages of rule processing: building, optimizing, and cleaning up.
The general strategy is as follows. Rules are learned one at a time. Each time a rule is learned, the
tuples covered by the rule are removed, and the process repeats on the remaining tuples. This
sequential learning of rules is in contrast to decision tree induction. Because the path to each leaf
in a decision tree corresponds to a rule, we can consider decision tree induction as learning a set
of rules simultaneously, as shown in Figure 1. Here, the rules learn in one class at a time. Ideally,
when learning a rule for a class, C, we would like the rule to cover all (or many) of the training
tuples of class C and none (or few) of the tuples from other classes. In this way, the rules learned
should be of high accuracy. The rules may not be of high coverage because there may be more
than one rule for a class, so that different rules may cover different tuples within the same class.
The process continues until the terminating condition is met, such as when there are no more
training tuples or the quality of a rule returned is below a user-specified threshold. The Learn One
Rule procedure finds the “best” rule for the current class, given the current set of training tuples. Figure 2 Basic sequential covering algorithm. To date, the Ripper algorithm is considered as a state
of the art in rule induction [14] and implemented in the machine learning library WEKA under the
name of JRip [9].
Many researches use rule induction in classification technique (Jrip technique) in many fields
as in health care [15], for URLs detection [16], for solving unplanned machine stops in plastic
Algorithm: Sequential covering. Learn a set of IF-THEN rules for classification. Input:
o D, a data set of class-labeled tuples; o Att-vals, the set of all attributes and their possible values.
Output: A set of IF-THEN rules. Method
(1) Rule-set = {}; // initial set of rules learned is empty (2) for each class c do (3) repeat (4) Rule = Learn-One-Rule (D, Att-vals, c); (5) remove tuples covered by Rule from D; (6) Rule-set = Rule-set + Rule; // add new rule to rule set (7) until terminating condition; (8) endfor (9) return Rule-Set;
Figure 1. Rule induction algorithm
GSJ: Volume 9, Issue 3, March 2021 ISSN 2320-9186 1296
GSJ© 2021 www.globalscientificjournal.com

injection molding [17], for detecting systems’ intrusion for protecting network resources from
illegal penetrations [18], and for solving engineering problems [19].
3. The proposed sales forecasting model
The primary goal of this model is to compute midterm forecasting of the sales profiles for new
items with no historical data. The inputs of the model are the historical sales data and descriptive
criteria of old products and only the descriptive criteria for new products. Data mining techniques
are used to achieve this goal with more focus on data preparation to improve the quality of the
model outcome. (Data transformation). The proposed model used the Waikato Environment of
Knowledge Analysis (WEKA) package, which is developed at the University of Waikato in New
Zealand, for data grouping and rules extracting because of its scalability to handle the analyzed
data efficiently.
As illustrated in Figure 2, sales of historical items and their sales-related attributes are
collected; however, for new items, only those attributes can be noticed. The model starts with
preparing and transforming the available sales data into a suitable format before clustering them
into groups of similar sales profiles. Then, it utilizes rules-induction to build a classification model
that links the descriptive attributes of the historical items and the clustered sales profiles. The
classification model is used to forecast the sales profiles of the new products based on their
descriptive attributes.
3.1. Data preparation
The data used in this research are the sales of mobile-phones obtained from a large
electronics’ retailer for the period from 2012 to 2015. The sales data for 2016 is used to evaluate
the model results. Based on a set of structured interviews with the product managers of the
company, the descriptive criteria of items that have a significant influence on the observed sales
are identified to be the price, brand, and discount in addition to a set of phones’ technical
specifications. The proposed model uses a different data pre-processing strategy than
Fiordaliso’s model [5], which stretches the life span of all items to the study horizon. The
proposed model normalizes the technical specifications of the products into the relative
specifications. Therefore, instead of using the speed of a mobile processor, it is replaced by the
relative processor speed compared to the competing products. Such relative specifications of any
product are affected by the introduction of new competing products into the market. Therefore,
the proposed model divides the life span of the items into six-month period.
The use of this short period life cycle normalizes the life span of the products and coincide
GSJ: Volume 9, Issue 3, March 2021 ISSN 2320-9186 1297
GSJ© 2021 www.globalscientificjournal.com

Historical items
New items
Data warehouse of
company
Collect sales data
Sales of historical items
Preprocess data to clusters
Sales profiles
Apply k-means
Website database
Collect the attributes
Attributes affect on sales
Preprocess attributes data
Descriptive criteria
Apply rule induction
Rules
If ...then If ...then If ...then If ...then If ...then If ...then
Extract new items
New itemsCollect
attributes of new items
Attributes of new items
Preprocess attributes data
Ranked Descriptive
criteria
Extract rules
Predicted clusters
Define predicted
profile Predicted
profile
clusters
Figure 2. The proposed model
GSJ: Volume 9, Issue 3, March 2021 ISSN 2320-9186 1298
GSJ© 2021 www.globalscientificjournal.com

The relative specifications of the products by considering the newly introduced products,
as shown in Figure 3.
Proposed model
Figure 3. Product life span normalization
To prepare the data for further analysis, the following pre-processing steps are implemented
1. Aggregate the sales for each product into monthly time buckets to cope with high
uncertainty and volatility in sales patterns.
2. Filter the data by removing the negative sales numbers for customer returns.
3. Normalize the sales volume of all products during the sales period to enable comparison
between the time series of products having different sales volumes.
4. Divide the product life by six months.
5. Delete the divisions that have months less than 3.
6. Normalize the life span to all divisions of all products to 6 months.
7. Organize the time series sales and descriptive attributes of the products into a data object
format that is suitable for data mining algorithms and WEKA applications.
GSJ: Volume 9, Issue 3, March 2021 ISSN 2320-9186 1299
GSJ© 2021 www.globalscientificjournal.com

3.2. Clustering
The purpose here is clustering similar-items in terms of sales profiles. The cluster center
represents a sales profile, which characterizes the sales behavior of items included in the cluster.
The k-means algorithm achieves exclusive clusters and requires to determine the desired number
of clusters, which influences the quality of the partition and the efficiency of the rule induction
(second stage of the forecasting system). The optimal number of clusters is estimated by
minimizing the mean absolute error of the system's ability to forecast the sales of the validation
items. The whole system is run for fifteen times, and the error is calculated using a 10-fold cross-
validation. The optimal number of clusters k* for the analyzed data was estimated to be fourteen,
as shown in Figure 4.
Using the K-means, fourteen clusters of product profiles are generated, as shown in Table
1. The four examples of the clustering results shown in Figure 5 reflect that the proposed model
is effectively capable of producing groups of products with similar time series sales. The sales
behavior of the products belonging to the different clusters is accurately described by the
associated sales profiles (indicated in bold). Table 1 shows the number of items included in each
cluster and their mean absolute error (MAE). Figure 8 illustrates some examples of clusters that
have the maximum error.
Table 1. Number of items included in each cluster and mean absolute error between real profiles
and prototypes
cluster 0 1 2 3 4 5 6 7 8 9 10 11 12 13
number of
items 13 13 17 7 20 23 28 32 33 17 12 13 20 18
0
0.05
0.1
0.15
2 3 4 5 6 7 8 9 10 11 12 13 14 15 16
mea
n a
bso
lute
err
or
number of cluster
Mean absolute error
Figure 4. Absolute error between real profiles and their forecasts according to the number
of clusters.
GSJ: Volume 9, Issue 3, March 2021 ISSN 2320-9186 1300
GSJ© 2021 www.globalscientificjournal.com

3.3. Rule induction
After clustering the time series data of the historical products, labels such as 𝒄𝒍𝟏, 𝒄𝒍𝟐, ..., 𝒄𝒍𝒊, …,
𝒄𝒍𝒌 representing the sales profiles of the formed groups, are assigned to the discovered clusters.
A training set for the classification algorithm is then constructed using the descriptive attributes
and cluster labels. Each product is described by the descriptive attributes as an input, while the
cluster to which it belongs is considered as the output. The rules-induction (RIPPER) algorithm is
used to extract if-then rules from the training data set to provide a comprehensive insight into
the data and to predict the sales profiles of the new products based on their descriptive
attributes. The ripper algorithm was applied to the classification training data created from the
descriptive attributes and the discovered sales profiles. Figure 6 illustrates the produced set of
rules to describe the training data. It is noteworthy that the number of generated-rules is
significantly lower than the number of data-points in the training set, and that the number of
features describing each rule is drastically reduced. The generated ruleset is a compressed
description of the training data that could be used to predict the sales profiles of new products.
Figure 5. Four examples of profile clusters and their associated items.
GSJ: Volume 9, Issue 3, March 2021 ISSN 2320-9186 1301
GSJ© 2021 www.globalscientificjournal.com

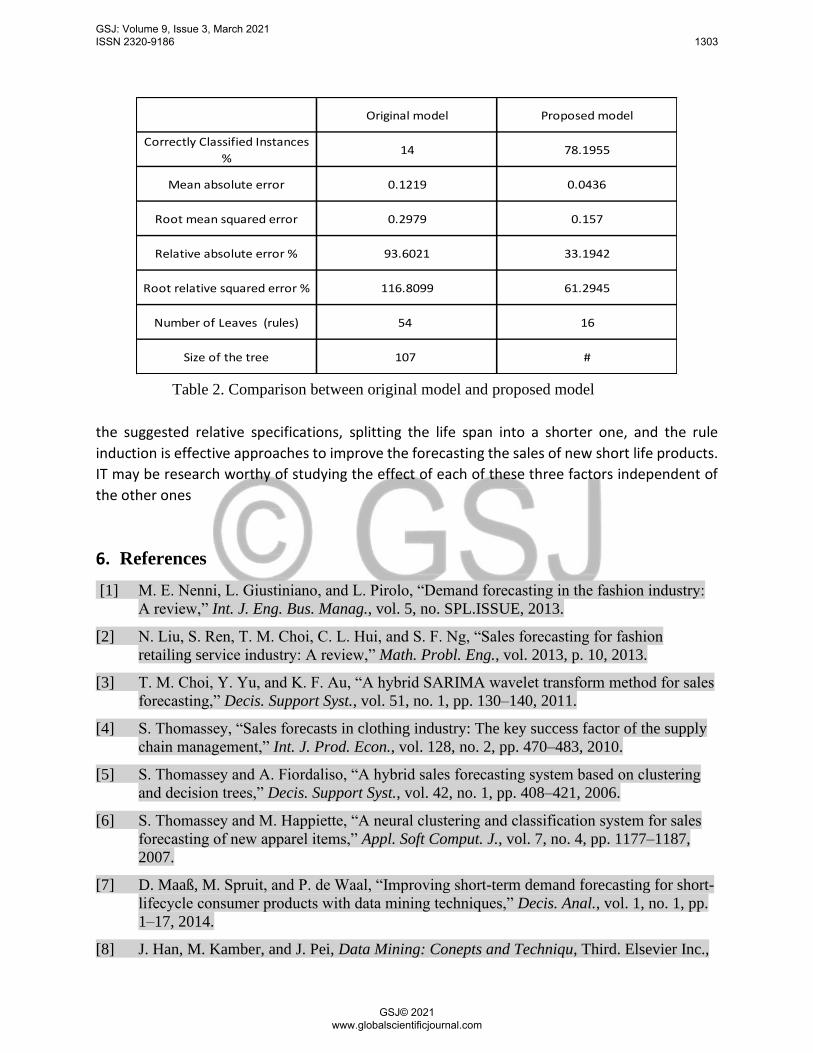
4. Results and analysis
The model is compared with Fiordaliso’s hybrid model that uses k-means clustering and decision
tree classification in the fashion retail industry [5]. As described above, the proposed model uses
different data preprocessing strategies than Fiordaliso’s model and uses the rule induction (Jrip
technique) clustering algorithm instead of the decision tree (C4.5) used by Fiordaliso’s model. The
comparison between Fiordaliso’s hybrid model and proposed model, this comparison proves
that the proposed model outperforms Fiordaliso’s model, as shown in Table 2.
Figure 6. Rules derived by ripper (J-rip weka) from the retail data
5. Conclusion
The constraints of the retail market make the sales forecasting a challenging task. This paper
proposed a forecasting approach based on the k-means clustering algorithm and the Jrip rule
induction classifier to estimate the sales profiles of new products. The performance of the
proposed forecasting procedure outperformed the comparable model. It is evident that using
1. If α1 = 10 then Cluster=3
2. If α2 >= 9 and α3 >= 5 then Cluster=10
3. If α6 = 1 and α1 <= 6 then Cluster=1
4. If α4 = 5 and α5 <= 4 then Cluster=11
5. If α2 = 2 then Cluster=0
6. If α6 = 2 and α8 = 1 and α4 <= 4 then Cluster=2
7. If α2 =7 and α7 >= 3 and α8 <= 3 then Cluster=2
8. If α6 = 5 then Cluster=9
9. If α6 = 2 and α2 <= 6 then Cluster=13
10. If α1 >= 8 and α2 >= 9 then Cluster=12
11. If α2 <= 1then Cluster=4
12. α1 >= 6 and α4<= 3 then Cluster=5
13. If α1 >= 6 and α9 >= 5 then Cluster=5
14. If α8 = 5 then Cluster=6
15. If α1=1 then Cluster=7
16. If α2=3 then Cluster=8
➢ 9 attributes from α1 to α9 to build rules
➢ for example, α1 is price rank & α2 is average discount
percentage and so on
GSJ: Volume 9, Issue 3, March 2021 ISSN 2320-9186 1302
GSJ© 2021 www.globalscientificjournal.com
the suggested relative specifications, splitting the life span into a shorter one, and the rule
induction is effective approaches to improve the forecasting the sales of new short life products.
IT may be research worthy of studying the effect of each of these three factors independent of
the other ones
6. References
[1] M. E. Nenni, L. Giustiniano, and L. Pirolo, “Demand forecasting in the fashion industry:
A review,” Int. J. Eng. Bus. Manag., vol. 5, no. SPL.ISSUE, 2013.
[2] N. Liu, S. Ren, T. M. Choi, C. L. Hui, and S. F. Ng, “Sales forecasting for fashion
retailing service industry: A review,” Math. Probl. Eng., vol. 2013, p. 10, 2013.
[3] T. M. Choi, Y. Yu, and K. F. Au, “A hybrid SARIMA wavelet transform method for sales
forecasting,” Decis. Support Syst., vol. 51, no. 1, pp. 130–140, 2011.
[4] S. Thomassey, “Sales forecasts in clothing industry: The key success factor of the supply
chain management,” Int. J. Prod. Econ., vol. 128, no. 2, pp. 470–483, 2010.
[5] S. Thomassey and A. Fiordaliso, “A hybrid sales forecasting system based on clustering
and decision trees,” Decis. Support Syst., vol. 42, no. 1, pp. 408–421, 2006.
[6] S. Thomassey and M. Happiette, “A neural clustering and classification system for sales
forecasting of new apparel items,” Appl. Soft Comput. J., vol. 7, no. 4, pp. 1177–1187,
2007.
[7] D. Maaß, M. Spruit, and P. de Waal, “Improving short-term demand forecasting for short-
lifecycle consumer products with data mining techniques,” Decis. Anal., vol. 1, no. 1, pp.
1–17, 2014.
[8] J. Han, M. Kamber, and J. Pei, Data Mining: Conepts and Techniqu, Third. Elsevier Inc.,
Original model Proposed model
Correctly Classified Instances
%14 78.1955
Mean absolute error 0.1219 0.0436
Root mean squared error 0.2979 0.157
Relative absolute error % 93.6021 33.1942
Root relative squared error % 116.8099 61.2945
Number of Leaves (rules) 54 16
Size of the tree 107 #
Table 2. Comparison between original model and proposed model
GSJ: Volume 9, Issue 3, March 2021 ISSN 2320-9186 1303
GSJ© 2021 www.globalscientificjournal.com

2012.
[9] I. H. Witten, E. Frank, M. A. Hall, and C. J. Pal, Data Mining: Practical Machine
Learning Tools and Techniques, Fourth Edi. Todd Green, Charlotte Kent, 2016.
[10] D. T. Pham and A. A. Afify, “Clustering techniques and their applications in
engineering,” Proc. Inst. Mech. Eng. Part C J. Mech. Eng. Sci., vol. 221, no. 11, pp.
1445–1459, 2007.
[11] A. Demiriz, “Demand forecasting based on pairwise item associations,” Procedia Comput.
Sci., vol. 36, no. C, pp. 261–268, 2014.
[12] D. T. Pham and A. A. Afify, “Machine-learning techniques and their applications in
manufacturing,” Proc. Inst. Mech. Eng. Part B J. Eng. Manuf., vol. 219, no. 5, pp. 395–
412, 2005.
[13] W. W. Cohen, “Fast Effective Rule Induction,” Mach. Learn. Proc. 1995, pp. 115–123,
1995.
[14] E. V. Kotelnikov and V. R. Milov, “Comparison of rule induction, decision trees and
formal concept analysis approaches for classification,” J. Phys. Conf. Ser., vol. 1015, no.
3, p. 6, 2018.
[15] G. Scala, A. Federico, V. Fortino, D. Greco, and B. Majello, “Knowledge generation with
rule induction in cancer Omics,” Int. J. Mol. Sci., vol. 21, no. 1, 2020.
[16] K. S. Adewole, A. G. Akintola, S. A. Salihu, N. Faruk, and R. G. Jimoh, “Hybrid Rule-
Based Model for Phishing URLs Detection,” Soc. Telecommun. Eng. LNICST, vol. 285,
pp. 119–135, 2019.
[17] L. Wu, H. Liu, and K. Su, “Exploring the dual effect of effectuation on new product
development speed and quality,” J. Bus. Res., vol. 106, no. 135, pp. 82–93, 2020.
[18] A. Panigrahi and M. R. Patra, “Intrusion Detection using Rule Learning based
Classifiers,” Int. J. Appl. Eng. Res., vol. 14, no. 17, pp. 3616–3621, 2019.
[19] J. Diaz-Rozo, C. Bielza, and P. Larrañaga, “Machine-tool condition monitoring with
Gaussian mixture models-based dynamic probabilistic clustering,” Eng. Appl. Artif. Intell.,
vol. 89, no. November 2019, p. 103434, 2020.
GSJ: Volume 9, Issue 3, March 2021 ISSN 2320-9186 1304
GSJ© 2021 www.globalscientificjournal.com