safe discharge of landfill leachate to the environment...
TRANSCRIPT

Safe Discharge of Landfill Leachate to the Environment
March 2015
Author
Daniel E. Meeroff Florida Atlantic University
Department of Civil, Environmental & Geomatics Engineering
And
Co-Author
Joseph Lakner Florida Atlantic University
Department of Civil, Environmental & Geomatics Engineering
Hinkley Center for Solid and Hazardous Waste Management University of Florida
P.O. Box 116016 Gainesville, FL 32611 www.hinkleycenter.org
Report # 1332027-A

ii
ACKNOWLEDGEMENT
The researchers would like to acknowledge the William W. “Bill Hinkley Center for Solid and Hazardous Waste Management for the funding for this project. The researchers would also like to thank the Technical Advisory Group members for their invaluable advice, feedback, and support of this work.
A special thank you goes to our wives Erin Meeroff and Kitti Lakner for providing unflinching support of our academic careers. Without them, none of this would have been possible.
We also wish to thank Craig K. Jones, Ph.D. for his gracious contributions with respect to the critical orifice device, and our hearts go out to his family after he lost his battle with cancer earlier this year. We hope to honor his memory by completing the work he started.
iii
ABSTRACT:
Some closed or partially closed landfills still produce important quantities of leachate, but instead
of blending this material with active Class I leachate for disposal, there may be better alternatives.
If a relatively inexpensive way to pretreat the leachate and safely dispose of it onsite can be
developed, a giant step toward the potential for zero liquid discharge can be achieved. FAU has
pioneered the advancement of landfill leachate treatment systems using photochemical iron-
mediated aeration and TiO2 photocatalysis at laboratory scale in previous research funded by the
Hinkley Center, which has led to the development of reactor prototypes for pilot scale testing. The
objective of the proposed research is to test a prototype photooxidative reactor at pilot scale for
the removal of COD/BOD, heavy metals (i.e. arsenic, lead, and iron), ammonia, color, chlorides,
and pathogens to determine the feasibility of safely discharging or reusing this leachate as a
resource on-site.

iv
LIST OF ABBREVIATIONS, ACRONYMS & UNITS OF MEASUREMENT
AOP Advanced Oxidation Process
BOD Biological Oxidaton Demand
BTEX Contamination from Benzene, Toluene, Ethylbenzend, and Xylene
CB Conduction Band
CO2 Carbon Dioxide
COD Chemical Oxidation Demand
CTL Florida's Soil or Water Cleanup Target Level
EDC Endocrine Disrupting Compound
F. A. C. Florida Administrative Code
FAU Florida Atlantic University, Boca Raton, FL
FDEP Florida Department of Environmental Regulation
g/L Grams per Liter
gpm Gallons per Minute Flow
H2O Hydrogen Dioxide (Water)
HCSHWM Hinkley Center for Solid and Hazardous Waste Management
HDPE High Density Polyethylene Plastic
HELP Hydrologic Evaluation of Landfill Performance Model
Hz Hertz (Frequency- Cycles per second)
IARC International Agency for Research on Cancer
lbs Pounds
Lph Liters per Hour Flow
mg/L Miligrams per Liter
mm Milimeter (10-3 Meters)
NH3 Ammonia
nm Nanometers (10-9 meters)
POTW Publicly-Owned Treatment Works
PVC Polyvinyl Chloride Plastic
RCRA Resource Conservation and Recovery Act
SWA Solid Waste Authority of Palm Beach County, Florida
TDS Total Disolved Solids
TiO2 Titanium Dioxide
TSS Total Suspended Solids
USEPA United State Environmental Protection Agency
UV Ultraviolet Light
UV-A A Portion of the Ultraviolet Spectrum (315 nm - 400 nm)
UV-B B Portion of the Ultraviolet Spectrum (280 nm - 315 nm)
v
LIST OF ABBREVIATIONS, ACRONYMS & UNITS OF MEASUREMENT (Continued)
UV-C C Portion of the Ultraviolet Spectrum (100 nm - 280 nm)
V Volts VB Valence Band VFA Volatile Fatty Acids
W Watt XOC Xenobiotic Compounds

vi
TABLE OF CONTENTS
1. INTRODUCTION ................................................................................................................................... 1
1.1 BACKGROUND .......................................................................................................................... 1
1.2 WATER QUALITY REGULATIONS ......................................................................................... 1
1.3 LEACHATE WATER QUALITY ................................................................................................ 2
1.4 POLLUTANTS OF CONCERN ................................................................................................... 4
1.5 LEACHATE QUANTITIES ......................................................................................................... 6
1.6 METHODS OF LEACHATE MANAGEMENT ......................................................................... 7
1.7 ADVANCED OXIDATION PROCESSES ................................................................................ 11
1.8 OBJECTIVES ............................................................................................................................. 15
2. METHODOLOGY ................................................................................................................................ 16
2.1 LEACHATE COLLECTION ..................................................................................................... 16
2.2 PILOT SCALE REACTOR ........................................................................................................ 19
2.3 FALLING FILM REACTOR ..................................................................................................... 21
2.4 FLOW THROUGH REACTOR ................................................................................................. 22
2.5 IMPROVEMENTS/ADDITIONS .............................................................................................. 23
2.6 EXPERIMENT PROCEDURE ................................................................................................... 25
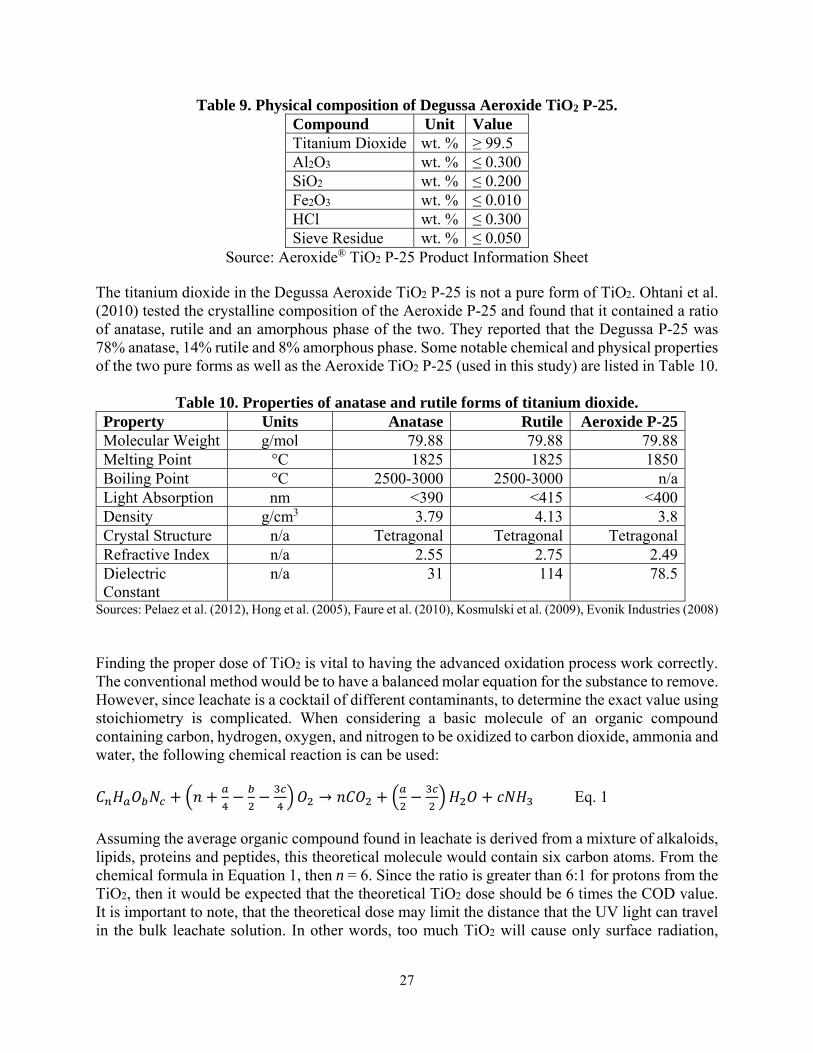
2.7 TiO2 DOSING ............................................................................................................................. 26
2.8 CRITICAL ORIFICE ADVANCED OXIDATION PROCESS ................................................. 28
2.9 CRYSTAL VIOLET TEST ........................................................................................................ 29
2.10 IMPROVING COD REMOVAL ............................................................................................ 30
2.11 ANALYTICAL METHODS FOR PARAMETERS OF INTEREST ......................................... 30
2.11.1 COD .................................................................................................................................... 30
2.11.2 Ammonia-Nitrogen ............................................................................................................. 31
2.11.3 Alkalinity ............................................................................................................................ 32

vii
2.11.4 pH ........................................................................................................................................ 32
2.11.5 Dissolved Oxygen ............................................................................................................... 33
2.11.5 Temperature ........................................................................................................................ 33
2.12 CATALYST RECOVERY ......................................................................................................... 33
2.13 INTENSITY OF UV LIGHT ...................................................................................................... 34
3. RESULTS AND DISCUSSION ............................................................................................................ 35
3.1 FALLING FILM EXPERIMENT #1 .......................................................................................... 35
3.2 FLOW THROUGH EXPERIMENT #2 ..................................................................................... 40
3.3 FLOW THROUGH WITH AERATION EXPERIMENT #3 ..................................................... 45
3.4 FLOW THROUGH WITH AERATION EXPERIMENT #4 WITH 0.2-g/L TiO2 USING THE
150-W LAMP ......................................................................................................................................... 50
3.5 TiO2 DOSING TEST .................................................................................................................. 55
3.6 CRITICAL ORIFICE ADVANCED OXIDATION PROCESS TESTING ............................... 56
3.7 CRYSTAL VIOLET TEST ........................................................................................................ 57
3.8 IMPROVING COD REMOVAL ................................................................................................ 57
3.9 INTENSITY OF UV LIGHT ...................................................................................................... 58
3.10 CATALYST RECOVERY ..................................................................................................... 60
4. CONCLUSION ...................................................................................................................................... 61
4.1 SUMMARY ................................................................................................................................ 61
4.2 RECOMMENDATIONS ............................................................................................................ 61
5. REFERENCES ...................................................................................................................................... 63
viii
LIST OF FIGURES
Figure 1: Dyer Park Historical Leachate Quantities (SWA personal communication 2014). ...................... 7
Figure 2. Dyer Park Landfill sample collection point. ................................................................................ 16
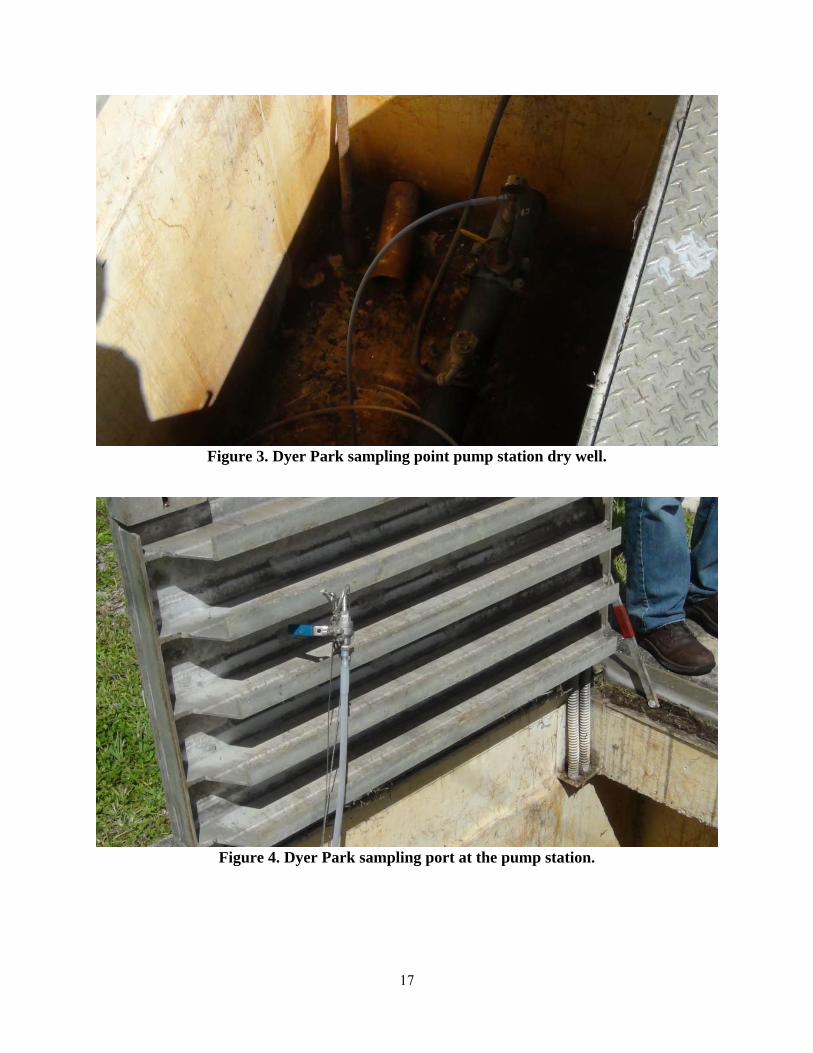
Figure 3. Dyer Park sampling point pump station dry well. ....................................................................... 17
Figure 4. Dyer Park sampling port at the pump station. ............................................................................. 17
Figure 5. Purging the sample port prior to collection. ................................................................................ 18
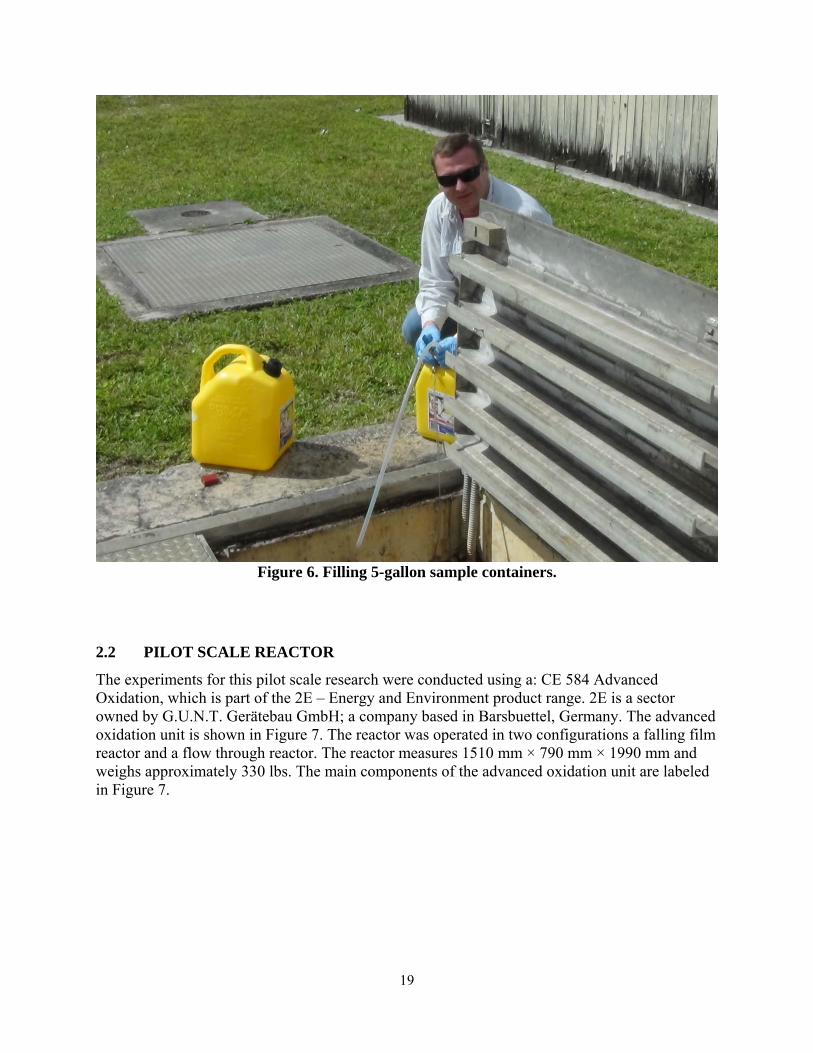
Figure 6. Filling 5-gallon sample containers. ............................................................................................. 19
Figure 7. Main components for the pilot scale reactor. ............................................................................... 20
Figure 8. Irradiation spectrum for the Strahler NNI 125/84 XL low pressure UV lamp as provided by the
manufacturer. .............................................................................................................................................. 21
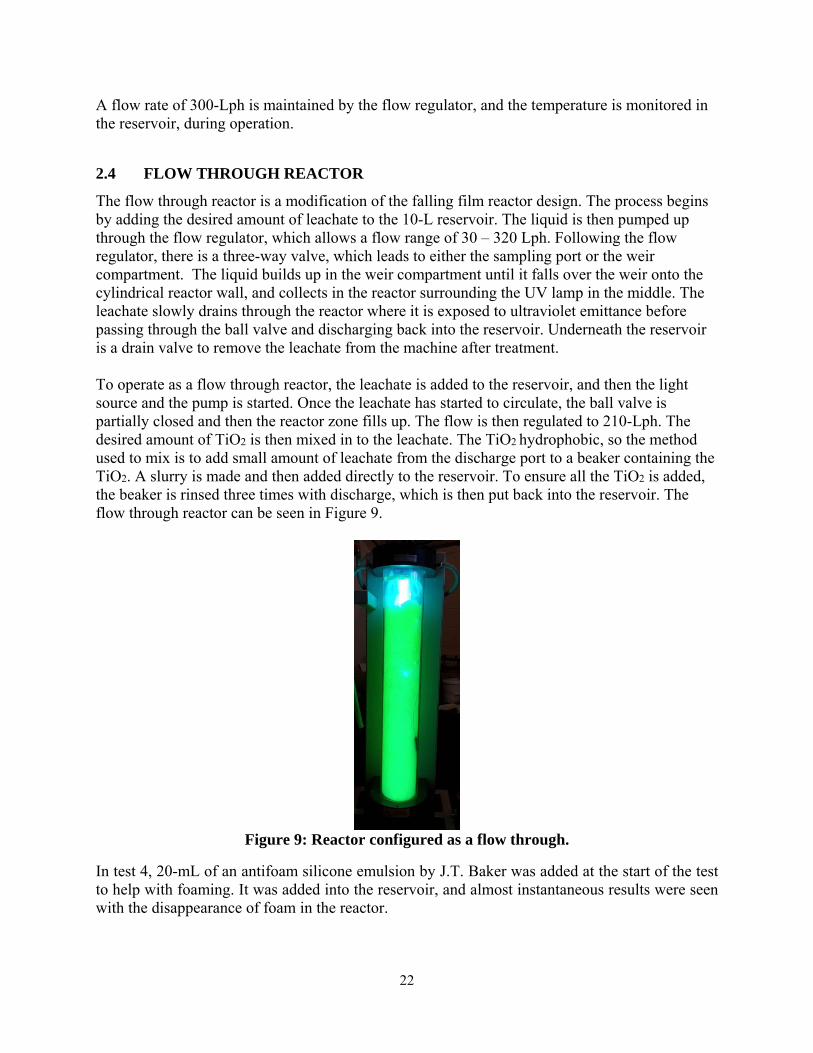
Figure 9: Reactor configured as a flow through.......................................................................................... 22
Figure 10. Photograph of the 304 stainless steel cooling coil. .................................................................... 23
Figure 11. Photograph of custom flow through reactor lid. ........................................................................ 24
Figure 12. Photograph of ball valve. ........................................................................................................... 24
Figure 13. Photograph of aeration system. ................................................................................................. 25
Figure 14. Measuring leachate in a 2000-mL graduated cylinder............................................................... 26
Figure 15: Dilutions created for a standard Beer’s Law curve. .................................................................. 28
Figure 16: Full spectrum absorbance curve from 200-400-nm. .................................................................. 28
Figure 17. Alternative AOP device. ............................................................................................................ 29
Figure 18. Improved COD removal test chamber setup. ............................................................................ 30
Figure 19. Reagent addition to cuvette for ammonia testing. ..................................................................... 31
Figure 20. Sample reading from the HI 95715 Ammonia Medium Range ISM. ........................................ 32
Figure 21. Sedimentation time lapse series over a 10-minute period. ........................................................ 33
Figure 22. Falling Film Reactor Temperature Comparison. ....................................................................... 37
Figure 23. Falling Film Reactor pH Comparison. ...................................................................................... 38
Figure 24. Falling Film Reactor Ammonia Comparison. ........................................................................... 38
Figure 25. Falling Film Reactor Alkalinity Comparison. ........................................................................... 39
Figure 26. Falling Film Reactor COD Comparison. ................................................................................... 39
Figure 27. Flow Through Reactor Temperature Comparison. .................................................................... 42
Figure 28. Flow Through Reactor pH Comparison. ................................................................................... 43
Figure 29. Flow Through Reactor Ammonia Comparison. ........................................................................ 43
Figure 30. Flow Through Reactor Alkalinity Comparison. ........................................................................ 44
Figure 31. Flow Through Reactor COD Comparison. ................................................................................ 45
ix
Figure 32. Flow Through Reactor with Aeration Temperature Comparison .............................................. 47
Figure 33. Flow Through Reactor with Aeration pH Comparison. ............................................................ 48
Figure 34. Flow Through Reactor with Aeration Ammonia Comparison. ................................................. 48
Figure 35. Flow Through Reactor with Aeration Alkalinity Comparison. ................................................. 49
Figure 36. Flow Through Reactor with Aeration COD Comparison. ......................................................... 49
Figure 37. Flow Through Reactor with 150-W Lamp and Aeration using TiO2 = 0.2 g/L Temperature Trend.
.................................................................................................................................................................... 52
Figure 38. Flow Through Reactor with 150-W Lamp and Aeration using TiO2 = 0.2 g/L pH Trend. ..... 53
Figure 39. Flow Through Reactor with 150-W Lamp and Aeration using TiO2 = 0.2 g/L Ammonia Trend.
.................................................................................................................................................................... 54
Figure 40. Flow Through Reactor with 150-W Lamp and Aeration using TiO2 = 0.2 g/L Alkalinity Trend.
.................................................................................................................................................................... 54
Figure 41. Flow Through Reactor with 150-W Lamp with Aeration using TiO2 = 0.2 g/L COD Trend. .. 55
Figure 42. Absorbance curve of TiO2 dosing. ............................................................................................. 56
Figure 43. Petri dish with TiO2 and crystal violet. ...................................................................................... 57

x
LIST OF TABLES
Table 1. USEPA non-hazardous waste landfill effluent limitations (10 CFR 445.21) ................................. 2
Table 2. Typical leachate water quality data from young and mature landfills (Tchobanoglous, Theisen,
and Vigil 1993; Metcalf and Eddy 2003) ...................................................................................................... 2
Table 3. Summary of extreme values for the composition of leachate developed through review of technical
literature. ....................................................................................................................................................... 3
Table 4. Selected water quality parameters of interest from Dyer Park Landfill leachate (Statom, Thyne and
McCray 2004). .............................................................................................................................................. 4
Table 5. Leachate generation rates for 31 Florida landfills (Meeroff and McBarnette 2011). ..................... 6
Table 6. Relative oxidation power of selected oxidizing species (Munter et al. 2001). ............................ 11
Table 7. Summary of COD removal efficiencies of TiO2 photocatalytic oxidation from published
performance studies. ................................................................................................................................... 13
Table 8. Measured UV light intensity. ........................................................................................................ 21
Table 9. Physical composition of Degussa Aeroxide TiO2 P-25. ............................................................... 27
Table 10. Properties of anatase and rutile forms of titanium dioxide. ........................................................ 27
Table 11. Falling film reactor experiment using 150-W light source (TiO2 = 5-g/L). ............................... 36
Table 12. Falling film reactor experiment using 450-W light source (TiO2 = 5-g/L). ................................ 36
Table 13. Flow through reactor experiment using 150-W light source (TiO2 = 10-g/L). ........................... 41
Table 14. Flow through reactor experiment using 450-W light source (TiO2 = 10-g/L). ........................... 41
Table 15. Flow through reactor experiment with aeration using 150-W light source (TiO2 = 10-g/L). ..... 46
Table 16. Flow through reactor experiment with aeration using 450-W light source (TiO2 = 10-g/L). ..... 46
Table 17. Flow through reactor experiment with aeration using 150-W light source (TiO2 = 0.2-g/L). .... 51
Table 18. Alternative AOP test results. ....................................................................................................... 56
Table 19. Summary of results from using metal additives to stimulate COD removal. ............................. 58
Table 20: Falling Film UV Light Intensity. ................................................................................................ 59
Table 21: Flow Through UV Light Intensity. ............................................................................................. 59

xi
ANNUAL REPORT
12/01/2013 – 12/31/2014
PROJECT TITLE: Safe Discharge of Landfill Leachate to the Environment
PRINCIPAL INVESTIGATOR(S): Daniel E. Meeroff, Ph.D.
AFFILIATION: Florida Atlantic University
EMAIL: [email protected] PHONE NUMBER: 561-297-3099
COMPLETION DATE: 12/31/2014
TAG MEMBERS: Jeff Roccapriore, Damaris Lugo, Joe Lurix, Art Torvela, Ravi Kadambala, Kevin Leo, Fred Bloetscher, Dan Schauer, André McBarnette, Frank Youngman, Mark Bruner, Mark Eyeington, Nate Mayer, Amede Dimmonay
KEY WORDS: Leachate, photocatalytic oxidation, COD, ammonia, alkalinity
ABSTRACT: Some closed or partially closed landfills still produce important quantities of leachate, but instead of blending this material with active Class I leachate for disposal, there may be better alternatives. If a relatively inexpensive way to pretreat the leachate and safely dispose of it onsite can be developed, a giant step toward the potential for zero liquid discharge can be achieved. FAU has pioneered the advancement of landfill leachate treatment systems using photochemical iron-mediated aeration and TiO2 photocatalysis at laboratory scale in previous research funded by the Hinkley Center, which has led to the development of reactor prototypes for pilot scale testing. The objective of the proposed research is to test a prototype photooxidative reactor at pilot scale for the removal of COD/BOD, heavy metals (i.e. arsenic, lead, and iron), ammonia, color, chlorides, and pathogens to determine the feasibility of safely discharging or reusing this leachate as a resource on-site. PROJECT WEBSITE: http://labees.civil.fau.edu/leahcate.html
METRICS:
1. List graduate or postdoctoral researchers funded by THIS Hinkley Center project.
Last name, first name Rank Department Professor Institution Lakner, Joseph MSCE Candidate CEGE Meeroff FAU
2. List undergraduate researchers working on THIS Hinkley Center project.
Last name, first name Department Professor Institution Dacey, Justin CEGE Meeroff FAU

xii
3. List research publications resulting from THIS Hinkley Center project. None so far 4. List research presentations resulting from THIS Hinkley Center project TAG meeting presentations only so far 5. List who has referenced or cited your publications from this project: None so far 6. How have the research results from THIS Hinkley Center project been leveraged to secure additional research funding? Year two funding from the Hinkley Center for Solid and Hazardous Waste Management was secured. Additional funding is being pursued through the Solid Waste Authority of Palm Beach County and Waste Management. 7.. What new collaborations were initiated based on THIS Hinkley Center project? F. Bloetscher, Ph.D., P.E., LEED AP and Craig K. Jones, Ph.D. 8/. How have the results from THIS Hinkley Center funded project been used by FDEP or other stakeholders? To date, the results have not been used by stakeholders yet
1
1. INTRODUCTION
1.1 BACKGROUND
The Hazardous and Solid Wastes Amendments of 1984 required treatment of all surface water runoff from landfills. This act was amended in 1991 to require landfills to protect groundwater by employing a bottom liner with a system to collect the liquids that seep through the landfill. This liquid is termed leachate and results from precipitation or other water that comes in contact with waste after collection. This leachate must be treated prior to discharge.
The amount of leachate produced from active Class 1 landfills in Florida (FDEP 2002; Meeroff and Teegavarapu 2010) can be up to 7000 gallons per day per acre, which must be eventually discharged back into the environment. Landfill leachate is characterized by elevated levels of recalcitrant organic material, color, ammonia, chlorides, and heavy metals such as arsenic, lead, iron, etc. A major limitation to the sustainable management of landfill leachate has been the lack of effective methods to guarantee safe long-term discharge back into the natural environment. This is further complicated by the extremely variable water quality and generation rates, along with the ever-changing regulatory environment, which has caused many conventional technologies to fail to meet this goal.
In partially closed landfills, leachate generation rates can be on the order of 400-700 gallons per day per acre (Eyeington 2012). This mature leachate is of very different quality, characterized as being more stable by a lower BOD5/COD ratio, a lower overall organic content, and relatively low ammonia levels (Amokrane et al. 1997; Renou et al. 2008; Meeroff and Teegavarapu 2010; Meeroff and McBarnette 2011; see also Table 3 and references therein). One possible way to reduce costs and energy requirements at closed or partially closed facilities would be to treat the mature leachate on-site and reuse or reclaim the water. To do so, the water quality parameters of concern in the leachate must be determined.
1.2 WATER QUALITY REGULATIONS
The quality of the landfill leachate needs to be analyzed so that the most effective treatment process can be designed. As with domestic and industrial wastewater treatment systems, each one is unique, having different constituents that require specialized treatment. The USEPA sets limits to the effluent discharge for non-hazardous sanitary landfills in 40 CFR 445.21 (Table 1). These limits are the minimum discharge standards. States and local jurisdictions can apply more stringent limits where applicable.

2
Table 1. USEPA non-hazardous waste landfill effluent limitations (40 CFR 445.21) Regulated Parameter
Units Maximum Daily
Maximum Monthly Average
BOD mg/L as O2 140 37TSS mg/L 88 27Ammonia mg/L as N 10 4.9α-Terpineol mg/L 0.033 0.016Benzoic acid mg/L 0.12 0.071ρ-Cresol mg/L 0.025 0.014Phenol mg/L 0.026 0.015Zinc mg/L 0.20 0.11pH Standard units 6-9 6-9
Other limits that are important to note are the USEPA Primary and Secondary Drinking Water Standards, since Florida obtains most of its drinking water from the Floridan or Biscayne aquifers, which are shallow aquifers with direct connections to surface water. Additionally, the Florida Administrative Code F.A.C. 62-550 sets the Florida-specific drinking water standards that must be met. Any landfill that was used prior to the 1976 enactment of the Resource Conservation and Recovery Act (RCRA) may need to apply the F.A.C. 62-777, because before then there was no separation of hazardous and non-hazardous waste. Prior to the 1970 Resource Recovery Act, small quantity generators were allowed to dispose of their hazardous wastes in non-hazardous landfills. F.A.C. 62-777 gives specific suggestions for acceptable discharge levels for arsenic, petroleum, benzene, chlorine, and many others.
1.3 LEACHATE WATER QUALITY
Several excellent reviews have been conducted with the goal of documenting leachate composition according to the location (i.e. the climate and especially the precipitation rate), the age of the landfill, or the type of wastes. Typical values for selected constituents are summarized in Table 2. Table 2. Typical leachate water quality data from young and mature landfills (Tchobanoglous, Theisen, and Vigil 1993; Metcalf and Eddy 2003)
Constituent Units Young Mature Ammonia-nitrogen mg/L as NH3-N 10 – 800 20 – 40 BOD5 mg/L as O2 2000 – 30,000 100 – 200 COD mg/L as O2 3000 – 60,000 100 – 500 Iron (Fe) mg/L 50 – 1200 20 – 200 pH pH units 4.5 – 7.5 6.6 – 7.5 Alkalinity mg/L as CaCO3 1000 – 10,000 200 – 1000 TSS mg/L 200 – 2000 100 – 400
Other important constituents include: i) dissolved organic matter from methane (CH4) to volatile fatty acids (VFA) to more refractory humics and fulvics; ii) inorganic constituents, such as calcium (Ca2+), magnesium (Mg2+), sodium (Na+), potassium (K+), ammonium (NH4
+), iron

3
(Fe2+), manganese (Mn2+), chloride (Cl−), sulfates (SO42-) and bicarbonates (HCO3
-); iii) heavy metals (arsenic, cadmium, chromium, cobalt, copper, lead, mercury, nickel and zinc), in the microgram per liter range; and iv) xenobiotic organic compounds from domestic and industrial sources, comprised of a broad variety of aromatic hydrocarbons, phenols, endocrine disrupting compounds (EDCs), pharmaceuticals, personal care products, pesticides, and chlorinated aliphatics. A review of leachate water quality from 125 sources reported in the literature is summarized in Table 3. The large ranges reported are the result of the high variability among leachates. It is important to note that leachate can have very high concentrations of many different constituents, many of which are known to have deleterious impacts in groundwater and soil. Aside from those listed here, there are numerous other constituents found in leachate ranging from heavy metals (e.g., cadmium, chromium, mercury, arsenic, nickel, selenium, iron, manganese, silver, copper, lead, thallium, zinc and others), other inorganic components (e.g., ammonium, barium, beryllium, bicarbonate, chloride, magnesium, manganese, nitrate, phosphorus, potassium, sodium, sulfate and others) (Qasim and Chiang 1994), and an array of organic constituents including xenobiotic organic compounds (XOCs) such as: BTEX (benzene, toluene, ethylbenzene, and xylene), antibiotics and other pharmaceuticals, pesticides, herbicides and endocrine disrupting compounds (EDCs) (Baun et al. 2003). Specific conditions are not indicated here, as the summary serves to point out the wide variety of leachate water quality that can be found. Clearly, it would be difficult to define a typical landfill leachate water quality because each facility produces varying compositions of leachate at different times depending on waste composition, climate, seasonal variations, rainfall, age of the waste, and solid waste management practices. Table 3. Summary of extreme values for the composition of leachate developed through review of technical literature.
Concentration Parameter Units Range AverageAmmonia mg/L as NH3-N BDL* – 13,000 1,100BOD5 mg/L as O2 BDL* – 80,800 3,100COD mg/L as O2 0.4 – 152,000 8,750Conductivity μS/cm 5.2 – 95,000 15,400Lead (Pb) mg/L BDL* – 5.0 0.41pH pH units 2.0 – 11.3 7.73TDS mg/L 0.1 – 88,000 11,100TSS mg/L 10 – 45,000 1,120Alkalinity mg/L as CaCO3 3,300 – 11,000 9,640Color Platinum-Cobalt Units 3,530 – 40,000 3,630
BDL* = below detection limit.
Sources: Adapted from Abu Amr and Aziz (2012), Adlan et al. (2011), Åkesson and Nilsson (1997), Al‐Yaqout et al. (2005), Amokrane et al. (1997), Anglada et al. (2011), Aziz et al. (2011), Bashir et al. (2010), Bekbölet et al. (1996), Bernard et al. (1997), Bila et al. (2005), Bouhezila et al. (2011), Calli et al. (2005), de Morais and Zamora (2005), Deng and Ezyske (2011), Geenens et al. (2000), Gonze et al. (2003), Hickman (2003), Iaconi et al. (2010), Imai et al. (1998), Ince (1998), Jia et al. (2011), Kim et al. (1997), Kim et al. (2007), Kjeldsen et al. (2002), Kurniawan and Lo (2009), Li et al. (2009), Lin et al. (2000), Mahmud et al. (2011), Mohammad et al. (2004),

4
Mohajeri et al. (2010), Moraes and Bertazzoli (2005), O’Leary and Walsh (1995), Oweis and Kehra (1998), Poblete et al. (2012), Tammemagi (1999), Tatsi et al. (2003), Tchobanoglous and Kreith (2002), Reinhart and Grosh (1998), Reinhart and Townsend (1998), Renou et al. (2008), Salem et al. (2008), Silva et al. (2004), Solid Waste Authority of Palm Beach County (2006), Statom et al. (2004), Steensen (1997), Tamrat et al. (2012), Vilar et al. (2011), Ward et al. (2002), Westlake and Phil (1995), Wichitsathian et al. (2004), Wu et al. (2004), Youcai et al. (2002), Zhao et al. (2010).
In this particular study, the Dyer Park Landfill located in Palm Beach County, FL is the focus because it is a partially closed landfill that generates particularly weak leachate. The Dyer Park landfill operated from 1968 to 1992. However, the lined section of the landfill accepted waste from 1984 to 1992. A 2004 study (Statom, Thyne and McCray 2004) investigated the leachate water chemistry of the Dyer Park landfill and monitored the levels of several contaminants, as summarized in Table 4. Table 4. Selected water quality parameters of interest from Dyer Park Landfill leachate (Statom, Thyne and McCray 2004). Parameter Units No. of
Samples Range Average Standard
Deviation pH Standard
units 50 6.56 – 8.01 7.07 0.27
Conductivity mmhos/cm 49 3.6 – 15 7.64 2.85Temperature °C 50 2.16 – 32.8 27.7 2.14COD mg/L 50 222 – 2000 835 383BOD mg/L 48 <1 – 184 47 40.2Ammonia mg/L 50 5.6 – 1350 473 254Chloride mg/L 49 63 – 1580 837 330Sulfate mg/L 49 <1 – 118 20 26Alkalinity mg/L 31 1160 – 3900 2450 597Bicarbonate mg/L 4 1900 – 3900 2660 928Calcium mg/L 23 132 – 220 176 22Magnesium mg/L 20 41 – 63 54 5.7Iron mg/L 50 1.6 – 9.7 4.8 2.4Boron mg/L 6 2.6 – 4.0 3.2 0.5Arsenic μg/L 49 <5 – 25 nr nrChromium μg/L 49 <5 – 60 20 11Lead μg/L 49 <4 – 110 nr nrSilver μg/L 49 <1 – 25 nr nrZinc μg/L 49 <6 – 488 nr nr
nr = not reported
1.4 POLLUTANTS OF CONCERN
This research focused on the following parameters: chemical oxygen demand (COD), alkalinity, ammonia, color, and pathogens. These constituents are those typically detected in the Dyer Park Landfill leachate. Currently there is no treatment process being used, and the leachate is disposed of via deep well injection.

5
COD was chosen as a measure of the oxygen demand of both organic and inorganic matter in the leachate (USEPA 2012). High levels of COD are caused by the low levels of dissolved oxygen found inside the landfill and the leachate. High concentrations of COD (>400 mg/L) can be devastating to aquatic life by removing all oxygen in the receiving water and causing anoxic conditions leading to asphyxia. The mean value found in 2004 was 835 mg/L. There is no specific treatment target for COD, but the COD that causes dissolved oxygen levels to drop below 3 mg/L will cause adverse aquatic water quality impacts since the ideal range of dissolved oxygen is 5 mg/L or higher for aquatic life. The federal government currently has set limitations for BOD (see Table 1), but not for COD. Local sewer use limitations (for example Broward County Code Chapter 34 Article VI, Ordinance No. 2001-43 Sewer Use Ordinance) typically charge a fine for high strength wastewater if COD concentration exceeds 800 mg/L.
Alkalinity is the amount of protons a solution can except without a measurable change in pH (Tchobanoglous and Kreith 2002). Alkalinity allows the pH range to resist change with the input of acidic or alkaline agents. The pH range that is typical for water containing significant amounts of alkalinity is between 6.0 and 8.5. The average levels of alkalinity for Dyer Park Landfill leachate is 2,450 mg/L with the majority being comprised of bicarbonate. While effects on humans have been found with high levels of alkalinity, the clogging of pipes can effect distribution networks and discharge structures.
Ammonia (NH3) is an inorganic form of nitrogen that is created in the natural anaerobic degradation process of many organic compounds (USEPA 2012). When ammonia in an aqueous solution is exposed to air, it rapidly becomes a colorless gas with a strong noticeable odor (Commonwealth of Australia 2010). The amount of ammonia in an aqueous solution has a direct correlation to temperature and pH (Environmental Protection Agency 1985). Concentrations of ammonia at levels of 0.03 mg/L have been found to be toxic to aquatic life, and the LC50 (concentration which is fatal to 50% of the subjects) for freshwater fish occurs at 0.068 – 2.00 mg/L as NH3-N, during a set exposure time of 96 hours (Eddy 2005). Taste and odor issues have been reported at levels of 35 mg/L and 1.5 mg/L, respectively (WHO 2004). Ammonia concentrations naturally found in groundwater and surface water are usually less than 0.2 mg/L, although anaerobic groundwater may have levels near 3 mg/L. In the state of Florida, ammonia is identified as a “minimum criteria systemic toxicant” and has a groundwater cleanup target level (CTL) of 2.8 mg/L. The CTL is not a regulation or standard, but rather a suggestion for water quality. The concentrations found in leachate, which were shown in Table 2 (20-40 mg/L for mature leachate) and Table 3 (up to 13,000 mg/L as NH3-N) far exceed these levels. Broward County sewer use limitations stipulate high strength wastewater surcharges if the NH3-N is above 25 mg/L as NH3-N, and concentrations exceeding 70 mg/L as NH3-N are not permissible. The target level of ammonia is 4.9 mg/L from EPA 40 CFR 445.21. For comparison purposes, the Dyer Park Landfill leachate historically averages 473 mg/L of ammonia. While color has no effect on the quality of water, it is one of the most noticeable of all its traits. The standard water color set by the USEPA is 15 Platinum-cobalt units (USEPA 2012). With respect to pathogens, which can affect human heath, the lowest amount of pathogens should be discharged from the landfill. Further study is needed regarding this issue in leachate, but the basis for leachate discharge should conform to the drinking water standard of the “no more than 5% of the monthly tests” should test positive for total coliform. This will protect all of the recreational users of the waterway, and not put undo stress on the environment.

6
1.5 LEACHATE QUANTITIES
The volume of leachate generated depends on the amount of rain that percolates through the landfill and the exposed surface area. Other factors that influence the volume of leachate include: surface runoff, groundwater intrusion, liquid waste in the landfill, irrigation, evapotranspiration, landfill depth, and refuse composition (Westlake and Phil 1995), but the quantity of leachate is directly tied to the amount of precipitation and irrigation that the landfill receives. A survey was performed by Florida Atlantic University (Meeroff and Teegavarapu 2010) polling 52 landfills in the state of Florida about their leachate generation rates. Facilities were divided into four different size classes based on their waste capacity: small (500,000 MT/yr), medium (5,000,000 MT/yr), large (15,000,000 MT/yr), and super (> 15,000,000 MT/yr) (USEPA 1999). The results of the survey from the 31 facilities that responded showed leachate volumes ranging from less than 100 to nearly 3,000 gpd/acre (refer to Table 5).
Table 5. Leachate generation rates for 31 Florida landfills (Meeroff and McBarnette 2011). Class Range (gpd/acre) Number of landfillsSmall <100 14Medium 100-300 9Large 300-850 6Super >850 2
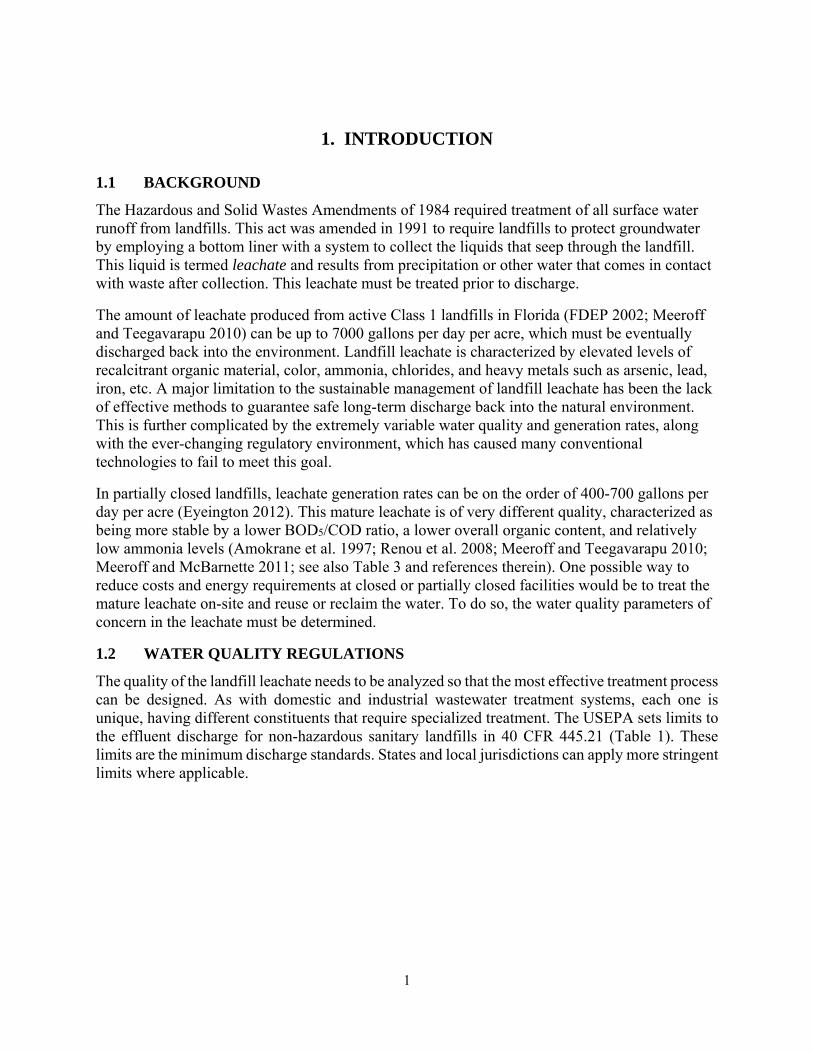
The Hydrologic Evaluation of Landfill Performance (HELP) model is a computer program developed by the Waterways Experiment Station (WES), which is the headquarters for the U.S. Army Engineer Research and Development Center (ERDC) (USEPA 2012). The HELP model is used to estimate the generation of leachate from landfills for comparison efforts in the planning and design of the landfill and leachate collection system. The HELP model gives a theoretical value in the South Florida area of 2,000 – 3,000 gpd/acre, which is the design value used for most landfills in the Southeast Florida region. However, most landfills do not have properly calibrated flow meters to record the actual leachate volumes from active cells, let alone the leachate generated by partially lined cells or older systems (Meeroff and McBarnette 2011), so accurate generation values are not obtainable. The Dyer Park Landfill is a partially capped landfill in that it has a cover over the top flat surface but the side slopes are uncapped, so any irrigation or precipitation that falls on the slope could penetrate into the cell and eventually become leachate. According to historical data, the quantity of leachate generated from the Dyer Park landfill comprises approximately 10-25% of the overall leachate flow for the SWA facility: 600,000 – 5,000,000 gallons per month. The eastern section of Palm Beach County has an average rainfall of 62 inches per year (Statom, Thyne and McCray 2004). Thus, over the 80-acre landfill area, the amount of leachate generated should average 200,000 gallons per month, but data provided by the Solid Waste Authority of Palm Beach County shows a historical average flow of 1.5 million gallons a month with a peak flow of 5 million gallons/month, seen in Figure 1.
7
Figure 1: Dyer Park Historical Leachate Quantities (SWA personal communication 2014).
1.6 METHODS OF LEACHATE MANAGEMENT
As a consequence of collecting these concentrated volumes of leachate, containing synthetic organic compounds, heavy metals, and other constituents of concern as discussed earlier, the liquid waste must be eventually discharged back into the environment. A major limitation to the sustainable management of landfill leachate has been the lack of effective methods to guarantee safe long-term discharge back into the natural environment. This is further complicated by the extremely variable water quality and waste generation rates, along with the ever-changing regulatory environment, which has caused many conventional technologies to fail to meet this goal.
Currently viable leachate management options include: on-site treatment, municipal sewer discharge, deep well injection, hauling offsite, or a combination approach. In the case that deep wells cannot be permitted or hauling is not cost effective, municipal sewer discharge is favored. However, wastewater treatment plants are facing the possibility of having to meet discharge limits (for nutrients and emerging contaminants of concern) that exceed the boundaries of current technologies. Facilities that accept leachate may struggle to meet the proposed new limits (i.e. USEPA numerical nutrient criteria), and may stop accepting the material or impose excessively high surcharges. So it is conceivable that in the future, municipal sewer discharge will become a limited option. Given this scenario, landfill managers may soon be forced into on-site treatment to handle their leachate.
In previous work funded by the HCSHWM, 23 different engineering alternatives for long-term leachate management were evaluated (Meeroff and Teegavarapu 2010). For on-site treatment to
0
1,000,000
2,000,000
3,000,000
4,000,000
5,000,000
6,000,000L
each
ate
Gen
erat
ion
(g
allo
ns
per
m
on
th)
Year

8
work, some form of aerobic treatment would be expected to reduce leachate strength prior to discharge. However, biological systems are not well-suited for the removal of bio-toxics from water and are inefficient in dealing with wastes of varying quality, such as leachate. Thus post-treatment, using constructed wetlands, combined physicochemical treatment, or evaporation systems, would then be required. Unfortunately, technologies such as activated carbon and certain advanced treatment processes, such as ozone, do not adequately address inorganics, and membrane systems or air stripping merely transfer organics to another phase or create a side stream, like concentrate brine, that cannot be discharged readily. Furthermore, multiple barrier systems are complicated to operate, costly, and generally inefficient. For on-site treatment options, the most effective strategies involve technologies that can destroy different classes of harmful contaminants all at once, without producing adverse byproducts and residuals.
There are basically only a few major ways of treating or disposing of leachate. Treatment can be off-site transfer with or without pre-treatment or reused on-site with or without pre-treatment in the form of biodegradation, physicochemical treatment, or a combination approach. The current method used at Dyer Park is deep well injection, which is disposal without treatment. One viable option for landfill managers is hauling off-site. Landfills will collect their leachate and send truckloads of the liquid waste to an ultimate disposal site; typically an off-site publicly-owned treatment works (POTW), where it is combined with domestic wastewater and processed along with the municipal sewage. This method does not address the ultimate disposal of leachate; it simply moves the leachate to another location off-site. The option presents a high transportation risk and can be a potentially expensive solution, depending upon the distance to the receiving site and the treatment performance of the facility accepting the material. If the travel distance is relatively short (<100 miles), the costs can be very competitive, and this can be a viable option. But if the site is located at distances greater than 100 miles, the costs can be potentially limiting. For example, Polk County, FL reported a three-year contract they signed in July 2009 for the disposal of their landfill leachate at $130 per thousand gallons (Blandford 2011). Not all wastewater treatment plants will accept leachate due to the elevated concentrations of constituents found. In addition, leachate generally has low biodegradability and may contain heavy metals. So large volumes of leachate can upset the normal biological treatment processes at the POTW (Boyle and Ham 1974; Booth et al. 1996), which may lead to expensive surcharge rates or even rejection. The costs associated with hauling can also vary depending on: the cost of fuel, the distance the leachate needs to travel, and if there may be a need to pre-treat the liquid waste prior to wastewater treatment plant acceptance. Besides the transportation risk and fuel cost volatility, the most problematic issue is if the contractor at the facility accepting the leachate suddenly decided that the material is not profitable to handle, treat, and dispose of safely, and terminated the agreement to accept the leachate. This will become particularly problematic if regulations governing wastewater disposal were to become more stringent with respect to ammonia-nitrogen, toxic trace metals, and/or inhibitory organic compounds with low biodegradability. The facility accepting the waste may find that leachate volumes are too high (Çeçen and Çakıroglu 2001) compromising the treatment plant’s ability to meet permitted discharge water quality levels. In this case, the treatment facility would likely consider no longer accepting the material. Leachate recirculation is another option for managing leachate. This process consists of reintroducing the landfill leachate back into the landfill. The recirculating leachate accelerates

9
the breakdown of organic materials within the landfill (Xing et al. 2012). This leads to increased methane production which must be managed to prevent elevated photochemical ozone formation (Xing et al. 2012). The build-up of head pressure from the increased amount of leachate in the bottom of the landfill creates higher potential for the leachate to escape the landfill into the environment and towards the ground water and soil. Tropical climates make leachate circulation difficult due to high temperatures and elevated levels of evaporation, which lowers the moisture content of the solid waste thereby diminishing the biological activity. One study determined the effect of applying additional water in order to maintain certain levels of moisture, on the methane production and stabilization of the landfill. It was found that supplementing the leachate with water kept elevated levels of methane production and lower time periods of landfill stabilization (Sanphoti et al. 2006). Recirculation can improve moisture content and distribute nutrients and enzymes throughout the landfill. The COD of the leachate was lowered with this process but it also lowered the methane production of the landfill (Chugh, et al. 1998). The implementation of a leachate recirculation system requires high capital and recurring maintenance costs. Also, odor problems from leachate recirculation are common (McBarnette 2011). If the appropriate aquifer conditions exist and permitting is available, another attractive disposal option for leachate is deep well injection. Essentially, this is the same as transferring the leachate off-site without treatment. In this option, the leachate is pumped deep into the ground below the aquifer and between confining layers to assure separation from the groundwater supply. The biggest concern with deep well injection is the risk of contamination of the drinking water supply (Groundwater Protection Council 2005). The exact geology thousands of feet underground can be difficult to establish with complete certainty. Even a minor fracture can cause a substantial problem as groundwater remediation is an incredibly difficult task at these depths. On July 7, 2000, the United States Environmental Protection Agency (EPA) proposed revisions to the underground injection control (UIC) regulations that would restrict wastewater injection by existing Class I municipal disposal wells that have caused or may cause movement of contaminants into underground sources of drinking water (USDWs) in specific areas of Florida (65 FR 42234) unless the owner met certain additional requirements: 1) secondary wastewater treatment plus filtration and high level disinfection (so that primary health-based drinking water standards would not be violated) with a non-endangerment demonstration (basically the same requirements as for reclaimed water irrigation systems) or 2) in-depth hydrogeological demonstration and added treatment, as necessary. The second option refers to 40CFR146.15(d), which states that to qualify for authorization the owner shall develop and implement a pretreatment program that is no less stringent than the requirements of Chapter 62-625, Florida Administrative Code, or have no significant industrial users as defined in that chapter. Furthermore, the owner must treat the injectate using secondary treatment in a manner that is no less stringent than the requirements of Florida Rule 62-600.420(1)(d), and using high-level disinfection in a manner that is no less stringent than the requirements of Florida Rule 62-600.440(5)(a)-(f). The specified treatment requirements then are designed to achieve an effluent after disinfection containing not more than 20 mg/L CBOD5 and 20 mg/L TSS, or 90% removal of each of these pollutants from the wastewater influent, whichever is more stringent. The bottom line is that the proposed rule requires installation of additional wastewater treatment with high level disinfection by 2015 for Class 1 injection wells. This means that injected water would need to meet at a minimum, secondary treatment and high-level disinfection as defined in the Florida regulations, with filtration required for total suspended solids (TSS) control prior to

10
disinfection (such that the treated wastewater contains no more than 5.0 mg/L of TSS before the application of the disinfectant). The rules apply to: Brevard, Broward, Charlotte, Collier, Flagler, Glades, Hendry, Highlands, Hillsborough, Indian River, Lee, Manatee, Martin, Miami-Dade, Monroe, Okeechobee, Orange, Osceola, Palm Beach, Pinellas, St. Johns, St. Lucie, Sarasota, and Volusia Counties, which were targeted in the proposal because they have the unique geologic conditions that are predominated by carbonate rocks. Class 1 industrial disposal wells are designed with additional levels of protection. It is unclear whether industrial disposal wells have suffered the same issues as municipal disposal wells in Pinellas County, or have incurred construction issues that create apparent migration such as south Miami-Dade or North Broward Counties. The basic regulations for industrial wells are not substantially different from municipal wells, but an additional layer of protection is designed and built into industrial wells including seismic studies for structural integrity, an additional area of review of 2 miles compared to 0.25 miles, modeling studies to show the waste will remain in the injection zone for 10,000 years, automatic alarms and shutdown devices, yearly internal mechanical integrity testing, and additional monitoring and reporting requirements, They are built with a tubing and packer system that places the injection tube inside a liquid filled annulus. This allows for better monitoring of potential leaks. The unique problems associated with deep well injection are not limited to the solid waste manager owning an onsite well. Many of the large publically-owned treatment works (POTWs) in those same counties dispose of treated wastewater effluent via deep wells. Therefore, if the leachate compromises the ability to meet the discharge limits set forth in the injection permit, the POTW may not wish to accept the leachate. This would cause problems for another important leachate management option of municipal sewer discharge. As the options begin to get limited, on-site pretreatment becomes more and more necessary. Typically, some form of aerobic biological treatment would be required to reduce leachate BOD strength prior to discharge. Biodegradation is performed by microorganisms, which degrade organic compounds under aerobic conditions and convert soluble BOD into particulate BOD, which can be readily removed via sedimentation. Anaerobic digestion can also work for dealing with strong leachate but will have long treatment times (Berrueta and Castrillon 1993), but as mentioned previously, are not well-suited for removal of biotoxics from water and are inefficient in dealing with wastes of varying quality, such as leachate. Thus post-treatment, using constructed wetlands, combined physical/chemical/biological treatment, or evaporative systems, is generally required (Booth et al. 1996). Unfortunately, activated carbon and certain advanced treatment processes, such as ozone or ultraviolet light, do not adequately address inorganics, and membrane systems or air stripping merely transfer organics to another phase. Furthermore, multiple barrier systems are complicated to operate, costly, and generally inefficient. Unfortunately, most current processes cannot adequately address inorganics and organics simultaneously. From our previous work funded by the HCSHWM (Meeroff, Gasnier, and Tsai 2006; Meeroff, Gasnier, and Tsai 2008; Meeroff and Teegavarapu 2010), our research team evaluated 23 different engineering alternatives for long-term leachate management. The results indicated that the most effective and sustainable strategies for the future would involve technologies that can destroy different classes of harmful contaminants all at once, without producing adverse byproducts and residuals.

11
Physical and chemical treatment options include flotation, coagulation/flocculation, adsorption, air stripping and chemical oxidation. Coagulation/flocculation is commonly used as a pre-treatment to remove non-biodegradable organic matter using aluminum sulfate (Amokrane, Cornel and Veron 1997). The disadvantage is the large volumes of chemical sludge produced. Flocculation can also foul filters in the treatment process, or require multiple filters to prevent this clogging. Chemical oxidation is widely studied and is of growing interest with a focus on advanced oxidation processes (AOP), which employ strong oxidants and ultraviolet light. The process works best on old, well-stabilized leachate (Renou, et al. 2007).
1.7 ADVANCED OXIDATION PROCESSES
Advanced oxidation processes (AOPs) are methods that promote the creation of and utilization of highly reactive oxidants such as hydroxyl radicals, ozone, and chlorine (Table 6). These oxidation reactions produce radicals which are chemical species that possess an unpaired electron, causing them to be very unstable. The unstable radicals attempt to stabilize themselves by reacting with surrounding species. The radicals will continue to react with substances until stability is reached. Within milliseconds (Peyton and Glaze 1988, cited by Fang et al. 2005), hydroxyl radicals are capable of achieving complete mineralization (i.e. degradation of complex organics to CO2, H2O, and mineral ions) of virtually all organic compounds (Feitz et al. 1999; Cho et al. 2002) rather than concentrate or transfer contaminants into a different phase. In this manner, pollutants that are only partially oxidized are decomposed into components that are more readily biodegradable and less toxic to common microorganisms found in a wastewater treatment plant for instance (Schulte et al. 1995; de Morais and Zamora 2005). Table 6. Relative oxidation power of selected oxidizing species (Munter et al. 2001). Oxidation Species Symbol Relative Oxidation
Power Positively charged hole on titanium dioxide (h+) 2.35Hydroxyl radical (OH·) 2.05Ozone (O3) 1.52Hydrogen peroxide (H2O2) 1.31Permanganate (MnO4
-) 1.24Hypochlorous acid (HOCl) 1.10Chlorine (Cl2) 1.00
The focus of this research is the use of photocatalytic oxidation with titanium dioxide (TiO2), in combination with ultraviolet light energy (UV) in the presence of oxygen. TiO2 is a white semiconducting powder consisting of nanoparticles with an average size of 200-nm. The crystalline structure of TiO2 is available in three forms: anatase, brookite, and rutile (Ohtani, et al. 2010). TiO2 was rated as a Group 2B (possibly carcinogenic to humans) substance by the International Agency for Research on Cancer (IARC) in 2006 as an inhalation hazard because of its nature as a fine dust. The health limitations on TiO2 are only expressed for inhalation, and there are none listed for ingestion. Furthermore, no adverse effects have been measured to fish, daphnia, or bacteria in ecotoxicological studies. The material is extensively used in products such as paints and varnishes, floor coverings, roofing granules, sunscreens and cosmetics, printer inks, ceramics, plastics, paper coatings, pigments used in numerous foods, toothpastes,

12
medicines, dielectric mirrors and tattoo pigments (Department of Health and Human Services 2011). TiO2 particles generate strong oxidizing power when illuminated with UV light at wavelengths less than 400 nm. Irradiation of TiO2 with photons of ultraviolet light energy produce areas of positive charge in the valence band of the semiconductor (“holes”) and free electrons in the conductance band. When the “holes” and free electrons interact with water trapped in the pores of the catalyst, a mixture of indiscriminate oxidants are generated including hydroxyl radical (HO•) and superoxide radical (O2
•-). For photocatalysis to occur, electron “holes” must migrate to the surface of the TiO2 crystal. The “holes” primarily react with hydroxide (OH-) from water acting as electron donors to produce hydroxyl radicals (Rincon and Pulgarin 2005). The electrons primarily react with O2(aq) (dissolved oxygen) in water acting as electron acceptors to yield the superoxide radical. Some of the electron-hole pairs, which do not participate in the redox reaction with water or oxygen, disappear as heat losses via the recombination of holes and electrons. Utilizing the combined oxidation power of holes and hydroxyl radicals generated in the valence band (VB), and electrons and superoxide radicals generated in the conduction band (CB), illuminated TiO2 photocatalysts can decompose organic compounds by participating in a series of mineralization reactions (Rincon and Pulgarin 2005). Chong et al. (2010) explained that the oxidative and reductive reactions from titanium dioxide are due to its unique characteristic of possessing a sole electron in its outer orbital. The reaction process begins when UV light energy photoexcites that lone outer shell electron, which creates an empty outer valence band. Basically, the photocatalytic process is an array of multi-step reactions. The ability of TiO2 photocatalyst to mineralize a wide range of pollutants is an attractive quality, but modeling the kinetics of such a complicated process is a difficult task. Sometimes, complex environmental processes allow only for empirical solutions because not all reactions or mechanisms are known. There may be lumped parameters, surrogates, indicators or just overly complex reaction pathways (Hemond and Fechner-Levy 2000). Recently, we have developed a falling pilot film reactor for preliminary pilot testing at FAU and have been able to achieve removal of 34% COD, 57% color, 84% alkalinity, and 82% ammonia within 24 h of treatment at a TiO2 dose of 4–10 g/L. Although the process did not reduce the COD concentrations to below 800 mg/L, we were able to demonstrate destruction of 1400 – 2400 mg/L of COD in just 24 h. These long-term experiments led us to the conclusion that first order reaction kinetics best fit the observed destruction of most water quality parameters. So it may be possible to meet the requirements of F.A.C. 62-302 for metals and 62-777 for surface water target levels using this technology and to develop parameters for scale-up. Thus it may now be possible to eliminate impurities in water all at once using a single process, and if these processes work as well in the field (at pilot scale) as they do in the laboratory, then we may have the answer for landfill managers when they run out of options for safely managing their leachate. The questions that remain focus on the suitable intensity of the ultraviolet light radiation to apply and a simple method to determine the appropriate amount of photocatalyst to use for treatment due to the concentration dependence discovered in previous work. Refinements of the process still need to be worked out with respect to recovering the photocatalyst after a batch of treatment
13
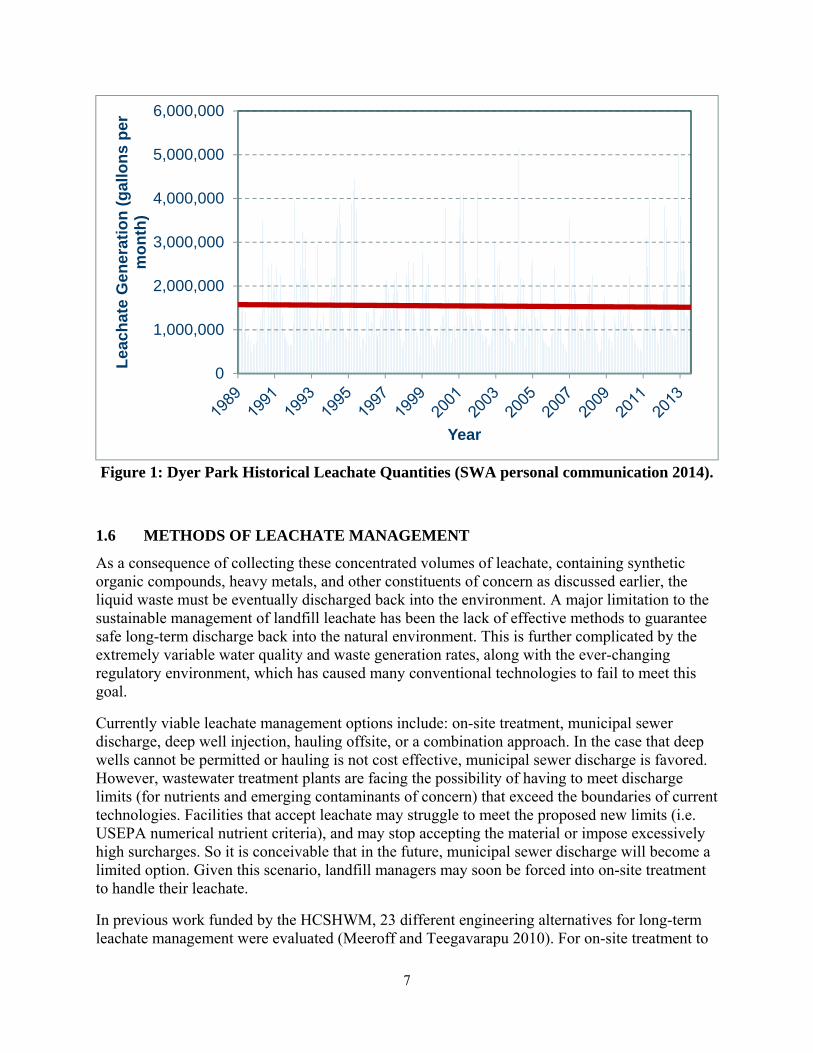
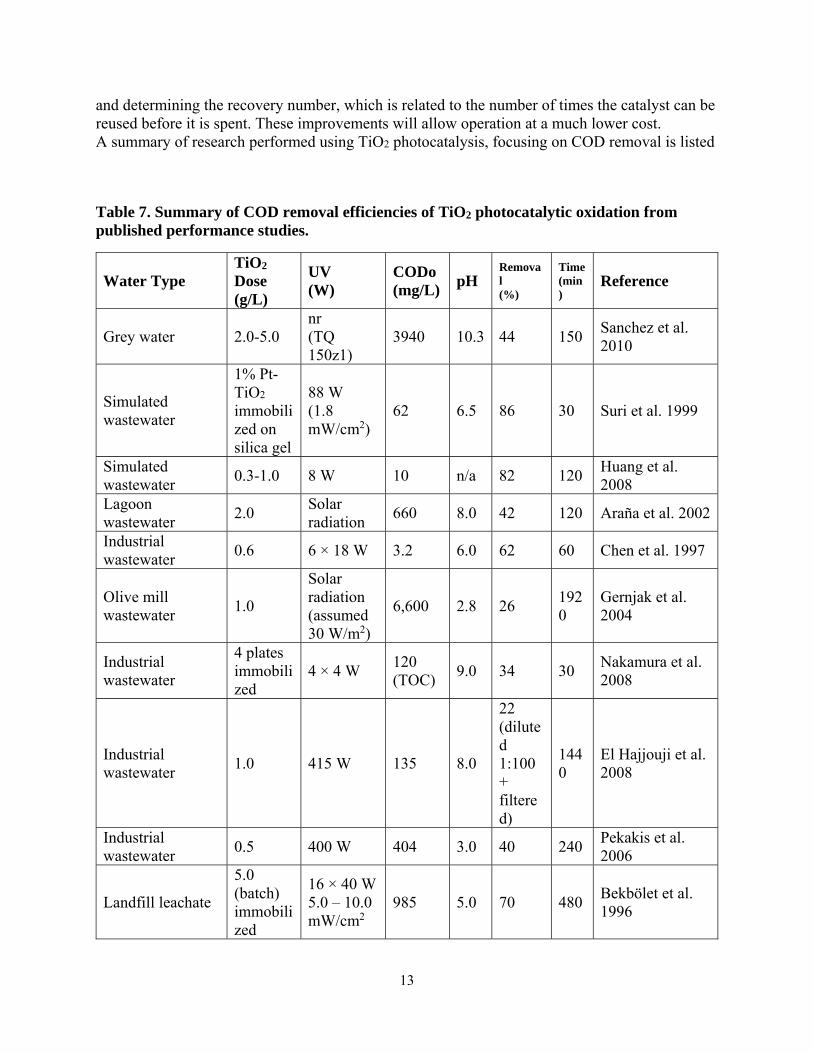
and determining the recovery number, which is related to the number of times the catalyst can be reused before it is spent. These improvements will allow operation at a much lower cost. A summary of research performed using TiO2 photocatalysis, focusing on COD removal is listed
Table 7. Summary of COD removal efficiencies of TiO2 photocatalytic oxidation from published performance studies.
Water Type TiO2 Dose (g/L)
UV (W)
CODo (mg/L)
pH Removal (%)
Time (min)
Reference
Grey water 2.0-5.0 nr (TQ 150z1)
3940 10.3 44 150 Sanchez et al. 2010
Simulated wastewater
1% Pt-TiO2 immobilized on silica gel
88 W (1.8 mW/cm2)
62 6.5 86 30 Suri et al. 1999
Simulated wastewater
0.3-1.0 8 W 10 n/a 82 120 Huang et al. 2008
Lagoon wastewater
2.0 Solar radiation
660 8.0 42 120 Araña et al. 2002
Industrial wastewater
0.6 6 × 18 W 3.2 6.0 62 60 Chen et al. 1997
Olive mill wastewater
1.0
Solar radiation (assumed 30 W/m2)
6,600 2.8 26 1920
Gernjak et al. 2004
Industrial wastewater
4 plates immobilized
4 × 4 W 120 (TOC)
9.0 34 30 Nakamura et al. 2008
Industrial wastewater
1.0 415 W 135 8.0
22 (diluted 1:100 + filtered)
1440
El Hajjouji et al. 2008
Industrial wastewater
0.5 400 W 404 3.0 40 240 Pekakis et al. 2006
Landfill leachate
5.0 (batch) immobilized
16 × 40 W 5.0 – 10.0 mW/cm2
985 5.0 70 480 Bekbölet et al. 1996
14
Water Type TiO2 Dose (g/L)
UV (W)
CODo (mg/L)
pH Removal (%)
Time (min)
Reference
Landfill leachate 3.0 8 W (21 W/cm2)
1,673 8.7 30 720 Cho et al. 2004
Landfill leachate 1.0-2.0 150 W (0.5 mW/cm2)
1,200 7.5 35-57 60 Poblete et al. 2012
Landfill leachate TiO2 coated sheet
120 W 26,000 – 30,000
5-7.6
76-92 150 Chemlal et al. 2013
Industrial wastewater
3.0 7.6 W/m2 20,000 6.8 36.3 1440
Baransi et al. 2012
Waste Activated Sludge
3.0 1.5 mW/cm2
16,249 6.83 45 480 Liu et al. 2012
Landfill leachate 2.0 NA 2,440 8.24 60 4320
Jia et al. 2013
Simulated wastewater
3.2 g of TiO2 coated on immobilized sheet
38 W/m2 157,000
7.0 51.6 255 Yahiat et al. 2011
Paper mill wastewater
0.75 35-45 W/m2
2,075 6.5 70.5 180 Ghaly et al. 2011
Industrial wastewater
0.2 Solar radiation
500 6 32 240 Vineetha et al. 2012
Landfill leachate 200 mg/L
Solar radiation 3270 to
4575 5 63%
1019 kJ/L
Rocha et al. 2011
Landfill leachate 2 to 10 g/L
15 W 2440 8.2 60%
4320
Jia et al. 2012
Swine and bovine manure
Immobilized with 1 g/L suspension
6-100 W UVA
Ammonia 100 ppm
7.1- 8.7
55% 360 Altomare et al. 2012

A primary advantage of photocatalytic technologies over other advanced oxidation processes is that photons in the near-UV range can be used instead of the dangerous radiation of the UV-C region required for UV disinfection or oxidation. Consequently, energized processes can potentially make possible the use of free sunlight instead of expensive mercury lamps (Bolduc and Anderson 1997). To date, experiments conducted at FAU have used less than 2 mW/cm2 of ultraviolet energy, which is 50 times less than natural sunlight (100 mW/cm2). The technology is easy to operate because the process just requires sufficient contact time and does not rely on complex precipitation reactions, chemical addition, or biochemical processes. Another major advantage is the simultaneous removal of organics, metals, and pathogens without merely transferring the pollutant to another medium (i.e. air or sludge). Therefore, this technology may provide an efficient, environmentally-friendly, and sustainable approach to long-term leachate management as well as aquatic water quality protection. Potential applications extend beyond solid waste management and include indirect potable reuse, water recycling, aquifer recharge, advanced wastewater treatment, and even household or portable systems. These methods will allow landfill operators with little training to reliably manage leachate without spending too much time on the task.
1.8 OBJECTIVES
The main purpose of this research is to test UV/TiO2 photocatalytic degradation of selected pollutants (COD, ammonia, alkalinity, and color) in mature landfill leachate using a pilot scale falling film reactor. It is hypothesized that the degradation rate of the contaminants will follow overall first-order reaction kinetics. The primary objective of this study is to determine an optimum dosage of catalyst that meets the water quality goals of one or more of the following: 1) surface water discharge, 2) industrial reuse as cooling water or irrigation, or 3) on-site use as dilution water to reduce leachate clogging issues in pipes.

16
2. METHODOLOGY
2.1 LEACHATE COLLECTION
Leachate for experimental testing was collected from the Dyer Park Landfill located in Palm Beach County, FL. The Dyer Park Landfill is operated by the Solid Waste Authority (SWA) of Palm Beach. The landfill is currently partially closed, no longer accepting waste, and is used as recreational facility. The footprint of the landfill is approximately 80-acres. The leachate collection system is operated by SWA, and the facility collected un-milled municipal solid waste from 1984 to 1992 for disposal. Leachate was sampled with permission from Nathan Mayer, P.E. Samples were collected from the pump station located on the northwest corner of the landfill, designated by the star on Figure 2.
Figure 2. Dyer Park Landfill sample collection point.
The first leachate samples were collected on May 30, 2014. The leachate was collected from the Dyer park leachate pumping station (Figure 3). The samples were taken from a ¼-inch sampling port with valve (Figure 4). The sampling port was purged for one minute before collection started (Figure 5). The leachate sample was collected in a five-gallon HDPE container (Figure 6). Measurements of dissolved oxygen, pH, temperature, and conductivity were taken directly after collection using a YSI 550MPS, as described later. The sample was placed in a cooler to preserve the sample and limit its exposure to light. The sample was stored in a refrigerator at 4°C until treated in the laboratory.
17
Figure 3. Dyer Park sampling point pump station dry well.
Figure 4. Dyer Park sampling port at the pump station.

18
Figure 5. Purging the sample port prior to collection.
19
Figure 6. Filling 5-gallon sample containers.
2.2 PILOT SCALE REACTOR
The experiments for this pilot scale research were conducted using a: CE 584 Advanced Oxidation, which is part of the 2E – Energy and Environment product range. 2E is a sector owned by G.U.N.T. Gerätebau GmbH; a company based in Barsbuettel, Germany. The advanced oxidation unit is shown in Figure 7. The reactor was operated in two configurations a falling film reactor and a flow through reactor. The reactor measures 1510 mm × 790 mm × 1990 mm and weighs approximately 330 lbs. The main components of the advanced oxidation unit are labeled in Figure 7.

20
Figure 7. Main components for the pilot scale reactor.
The unit is equipped with a 10-L reservoir, temperature sensor (0-50°C), 260 Liter per hour (1.1-gpm) circulating centrifugal pump (at 29.5 feet of head), flow meter with regulating valve, sampling port with three-way valve, a weir compartment for distributing flow in the reaction zone. Two different light sources were also used for the research. The first was an Ace Glass Incorporated 450-W medium pressure, quartz, mercury-vapor lamp. The second was a Heraeus Noblelight NNI 125/84 XL 150-W bulb, with irradiance at 254 nm of 0.35-mW/cm2 and radiation flux at 254-nm of 38-W. The irradiation spectrum (Figure 8) shows that the lamp provides most of its intensity from 250 – 260 nm in the UV-C germicidal range. Inside the falling film reactor zone, there is an inner protective tube for the lamp. This tube is made of quartz glass (transmittance = 80-90%) with diameter 43-mm. The reactor wall is made of borosilicate glass with an outside diameter of 110-mm, and the glass tubing is protected with an external tube made of polymethyl methacrylate (PMMA XT) at 140-mm diameter. The borosilicate glass and the PMMA both block the transmittance of UV light at wavelengths less than 300-nm to protect the user.

21
Figure 8. Irradiation spectrum for the Strahler NNI 125/84 XL low pressure UV lamp as provided by the manufacturer.
The UV-C light intensity was measured for both radiation sources using a Sper Scientific 850010 UVC light meter. The results are summarized in Table 8. Table 8. Measured UV light intensity. Light Source UV-A&B UV-C
150-W 0.518 mW/cm2 7.21 mW/cm2
450-W 56 mW/cm2 0.06 mW/cm2
2.3 FALLING FILM REACTOR
The falling film reactor is the basic setup of how the reactor was originally designed to work for previous experiments conducted by FAU (Meeroff and Youngman 2013). The device is designed to oxidize contaminants in water using UV radiation. The process begins by adding the desired liquid to the 10-L reservoir. The liquid is then pumped up through the flow regulator, which allows a flow range of 30 – 320 Lph. Following the flow regulator, there is a three-way valve which leads to either the sampling port or the weir compartment. The liquid builds up in the weir compartment until it falls over the weir onto the cylindrical reactor wall, which surrounds the UV lamp. While the liquid runs down the reactor wall it is exposed to ultraviolet emittance before it falls back into the reservoir. Underneath the reservoir is a drain valve to remove the desired liquid from the machine. To operate as a falling film reactor, the leachate is added to the reservoir, and then the light source and the pump is started. Once the leachate has started to circulate, the desired amount of TiO2 is mixed in to the leachate. The TiO2 is hydrophobic, so the method used to mix is to add small amount of leachate from the discharge port to a beaker containing the TiO2. A slurry is made and then added directly to the reservoir. To ensure all the TiO2 is added the beaker is rinsed three times with discharge which is then put back into the reservoir.
22
A flow rate of 300-Lph is maintained by the flow regulator, and the temperature is monitored in the reservoir, during operation.
2.4 FLOW THROUGH REACTOR
The flow through reactor is a modification of the falling film reactor design. The process begins by adding the desired amount of leachate to the 10-L reservoir. The liquid is then pumped up through the flow regulator, which allows a flow range of 30 – 320 Lph. Following the flow regulator, there is a three-way valve, which leads to either the sampling port or the weir compartment. The liquid builds up in the weir compartment until it falls over the weir onto the cylindrical reactor wall, and collects in the reactor surrounding the UV lamp in the middle. The leachate slowly drains through the reactor where it is exposed to ultraviolet emittance before passing through the ball valve and discharging back into the reservoir. Underneath the reservoir is a drain valve to remove the leachate from the machine after treatment. To operate as a flow through reactor, the leachate is added to the reservoir, and then the light source and the pump is started. Once the leachate has started to circulate, the ball valve is partially closed and then the reactor zone fills up. The flow is then regulated to 210-Lph. The desired amount of TiO2 is then mixed in to the leachate. The TiO2 hydrophobic, so the method used to mix is to add small amount of leachate from the discharge port to a beaker containing the TiO2. A slurry is made and then added directly to the reservoir. To ensure all the TiO2 is added, the beaker is rinsed three times with discharge, which is then put back into the reservoir. The flow through reactor can be seen in Figure 9.
Figure 9: Reactor configured as a flow through.
In test 4, 20-mL of an antifoam silicone emulsion by J.T. Baker was added at the start of the test to help with foaming. It was added into the reservoir, and almost instantaneous results were seen with the disappearance of foam in the reactor.

23
2.5 IMPROVEMENTS/ADDITIONS
The exposure of leachate to UV light creates an exchange of heat and radiation, causing the leachate to increase in temperature. Tests in the pilot reactor were limited to 4 hours because of the inability to cool the leachate and maintain a constant temperature for kinetics testing. The addition of a 50-foot long, 304-stainless steel cooling coil (Figure 10) in the reservoir attached to a VWR Recirculating Chiller 1150S and filled with 13-L of Dynalene HC-50 (hydro-coolant), enabled extended operation times while maintaining the selected temperature range for the leachate treatment.
Figure 10. Photograph of the 304 stainless steel cooling coil.
A new stainless steel pump (Speck Pump Y-2951-W-MK) was also fitted to the reactor. This pump, in addition to being less susceptible to corrosion than the previous 260 Lph circulating centrifugal pump (Speck pump model Y-2951.0344 complete with 0.18kW, single-phase motor, 110V, 60Hz, 3600RPM, frame size 56, IP55, C-UL-US, flange turned 90°) has a magnetic coupled drive. This means that no drive shafts collect directly to the impeller, removing the likelihood of leaking from the bearing seals.
Another modification is a new reactor lid created for the flow through test. This new lid has openings so that aeration can be achieved directly in the reactor. The aeration provides mixing to maintain the photocatalytic particles in suspension within the reactor zone and also supplies oxygen for the oxidation process. The lid was custom-made out of HDPE to the exact specifications of the reactor dimensions (Figure 11).
24
Figure 11. Photograph of custom flow through reactor lid.
To create the flow through reactor from the falling film reactor, a simple 1-inch PVC ball valve was installed in the discharge line of the reactor, see Figure 12. This allows the regulation of the flow from the reactor increasing detention times and allowing us to create a flow through reactor zone.
Figure 12. Photograph of ball valve.
A Sweetwater SL22 linear air pump was utilized in conjunction with a large flask of deionized water (to saturate the air with moisture to limit evaporation) was used for aeration. Aeration is needed in the falling film reactor in the reservoir to keep the TiO2 in suspension. While in the flow through reactor, aeration is also required to keep the proper dissolved oxygen level for the advanced oxidation process to occur. See Figure 13 for pump system setup.

25
Figure 13. Photograph of aeration system.
2.6 EXPERIMENT PROCEDURE
To initiate the experiment, leachate was removed from the storage refrigerator and 10-L was measured out 2-L at a time using a 2000-mL plastic graduated cylinder (see Figure 14). Once the leachate was added to the reservoir, the unit was powered up and the pump would begin circulating. At this point, a 50-mL sample was taken from the reservoir for testing as the initial concentration at to. Next the TiO2 was added in slurry form, the dosing of the TiO2 varied from 120-mg/L to 30-g/L. The TiO2 was weighed on a Mettler-Toledo XS204 DeltaRange Analytical Balance in a 1000-mL HDPE beaker.

26
Figure 14. Measuring leachate in a 2000-mL graduated cylinder.
Once the TiO2 was added, a digital timer was started, and the test began. For the initial runs, 50-mL samples were taken every hour. When the results of the test were examined, it was found that the change over a one hour period was within the range of error, so thereafter, samples were taken at 2-hour increments. Directly after the sample was collected, the temperature, dissolved oxygen content, and pH were taken. The remaining tests were performed after the run was complete.
2.7 TiO2 DOSING
A widely used, high quality TiO2 product (Degussa Aeroxide TiO2 P-25) was used as the photocatlyst for all testing. A breakdown of the composition in Aeroxide TiO2 P-25 is shown in Table 9.
27
Table 9. Physical composition of Degussa Aeroxide TiO2 P-25. Compound Unit Value Titanium Dioxide wt. % ≥ 99.5 Al2O3 wt. % ≤ 0.300SiO2 wt. % ≤ 0.200Fe2O3 wt. % ≤ 0.010HCl wt. % ≤ 0.300Sieve Residue wt. % ≤ 0.050
Source: Aeroxide® TiO2 P-25 Product Information Sheet The titanium dioxide in the Degussa Aeroxide TiO2 P-25 is not a pure form of TiO2. Ohtani et al. (2010) tested the crystalline composition of the Aeroxide P-25 and found that it contained a ratio of anatase, rutile and an amorphous phase of the two. They reported that the Degussa P-25 was 78% anatase, 14% rutile and 8% amorphous phase. Some notable chemical and physical properties of the two pure forms as well as the Aeroxide TiO2 P-25 (used in this study) are listed in Table 10.
Table 10. Properties of anatase and rutile forms of titanium dioxide. Property Units Anatase Rutile Aeroxide P-25Molecular Weight g/mol 79.88 79.88 79.88Melting Point °C 1825 1825 1850Boiling Point °C 2500-3000 2500-3000 n/aLight Absorption nm <390 <415 <400Density g/cm3 3.79 4.13 3.8Crystal Structure n/a Tetragonal Tetragonal TetragonalRefractive Index n/a 2.55 2.75 2.49Dielectric Constant
n/a 31 114 78.5
Sources: Pelaez et al. (2012), Hong et al. (2005), Faure et al. (2010), Kosmulski et al. (2009), Evonik Industries (2008) Finding the proper dose of TiO2 is vital to having the advanced oxidation process work correctly. The conventional method would be to have a balanced molar equation for the substance to remove. However, since leachate is a cocktail of different contaminants, to determine the exact value using stoichiometry is complicated. When considering a basic molecule of an organic compound containing carbon, hydrogen, oxygen, and nitrogen to be oxidized to carbon dioxide, ammonia and water, the following chemical reaction is can be used:
→ Eq. 1
Assuming the average organic compound found in leachate is derived from a mixture of alkaloids, lipids, proteins and peptides, this theoretical molecule would contain six carbon atoms. From the chemical formula in Equation 1, then n = 6. Since the ratio is greater than 6:1 for protons from the TiO2, then it would be expected that the theoretical TiO2 dose should be 6 times the COD value. It is important to note, that the theoretical dose may limit the distance that the UV light can travel in the bulk leachate solution. In other words, too much TiO2 will cause only surface radiation,
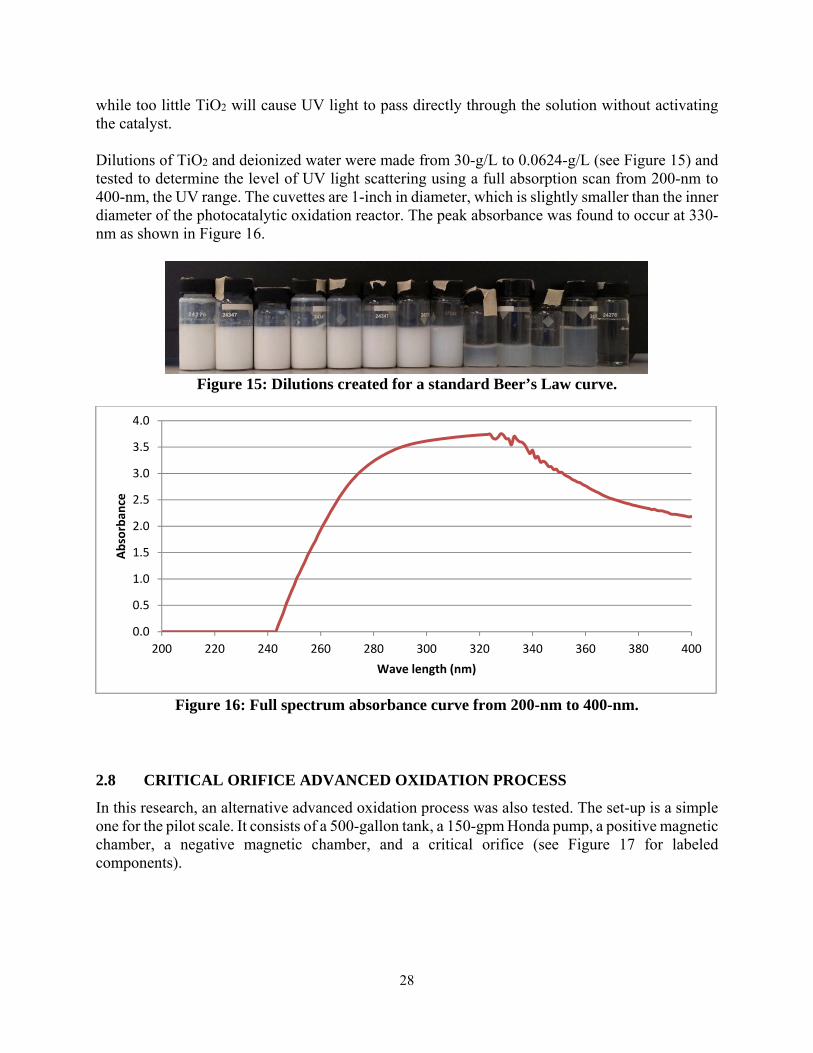
28
while too little TiO2 will cause UV light to pass directly through the solution without activating the catalyst. Dilutions of TiO2 and deionized water were made from 30-g/L to 0.0624-g/L (see Figure 15) and tested to determine the level of UV light scattering using a full absorption scan from 200-nm to 400-nm, the UV range. The cuvettes are 1-inch in diameter, which is slightly smaller than the inner diameter of the photocatalytic oxidation reactor. The peak absorbance was found to occur at 330-nm as shown in Figure 16.
Figure 15: Dilutions created for a standard Beer’s Law curve.
Figure 16: Full spectrum absorbance curve from 200-nm to 400-nm.
2.8 CRITICAL ORIFICE ADVANCED OXIDATION PROCESS
In this research, an alternative advanced oxidation process was also tested. The set-up is a simple one for the pilot scale. It consists of a 500-gallon tank, a 150-gpm Honda pump, a positive magnetic chamber, a negative magnetic chamber, and a critical orifice (see Figure 17 for labeled components).
0.0
0.5
1.0
1.5
2.0
2.5
3.0
3.5
4.0
200 220 240 260 280 300 320 340 360 380 400
Absorban
ce
Wave length (nm)

29
Figure 17. Alternative AOP device.
10-gallons of leachate was collected from Dyer Park and poured in to the 500-gallon tank, it was diluted with 50-gallons of tap water. The pump was turned on, and once the flow was started, a 50-mL sample was taken. Then the rejoining ball valve and the diversion valves were opened causing the leachate to flow through the reaction chamber. Leachate flows from the tank to the pump, and then the pump sends the leachate to the diversion valve. Only about 10% of the leachate is sent through the reactor, as controlled by the diversion ball valve. The rest (~90%) is diverted around the reactor. The leachate that is diverted passes through a positive magnetic field created by neodymium magnets and stainless steel rods. Then the leachate is passed through a critical orifice, where it is pressurized and then ejected at a high velocity creating a vacuum where the dissolved oxygen comes out of solution. This oxygen creates thousands of micro-bubbles with a relatively large combined surface area. This oxygen oxidizes the COD, then the micro-bubbles and leachate travel through the negative chamber and are reintroduced to the by-pass stream of leachate where the micro-bubbles continue to oxidize COD. Samples were taken at 5-minute intervals from a discharge port.
2.9 CRYSTAL VIOLET TEST
The crystal violet test was used to verify the generation of hydroxide ion in the reaction mechanism. The crystal violet test was selected because it is a cation and in the presence of the hydroxide ion, it will be neutralized. This neutralization is visually observed as the discoloration of the dye. This test was performed in a photocatalytic chamber using the 450-W lamp. A glass petri dish containing 25-mL of leachate with 10-g/L TiO2 was prepared. Added to this was 5-mL of 1.0×10⁻⁴ M crystal violet. The lamp was turned on in the empty chamber and allowed to warmup for 15-minutes. Then the sample was placed in the chamber at 4-inches from the light, and observations were taken at 1-minute intervals.
500-Gallon
Tank Critical
Orifice
Positive
Magnetic
Chamber
Negative
Magnetic
Chamber
Diversion
Ball Valve Rejoining
Ball Valve
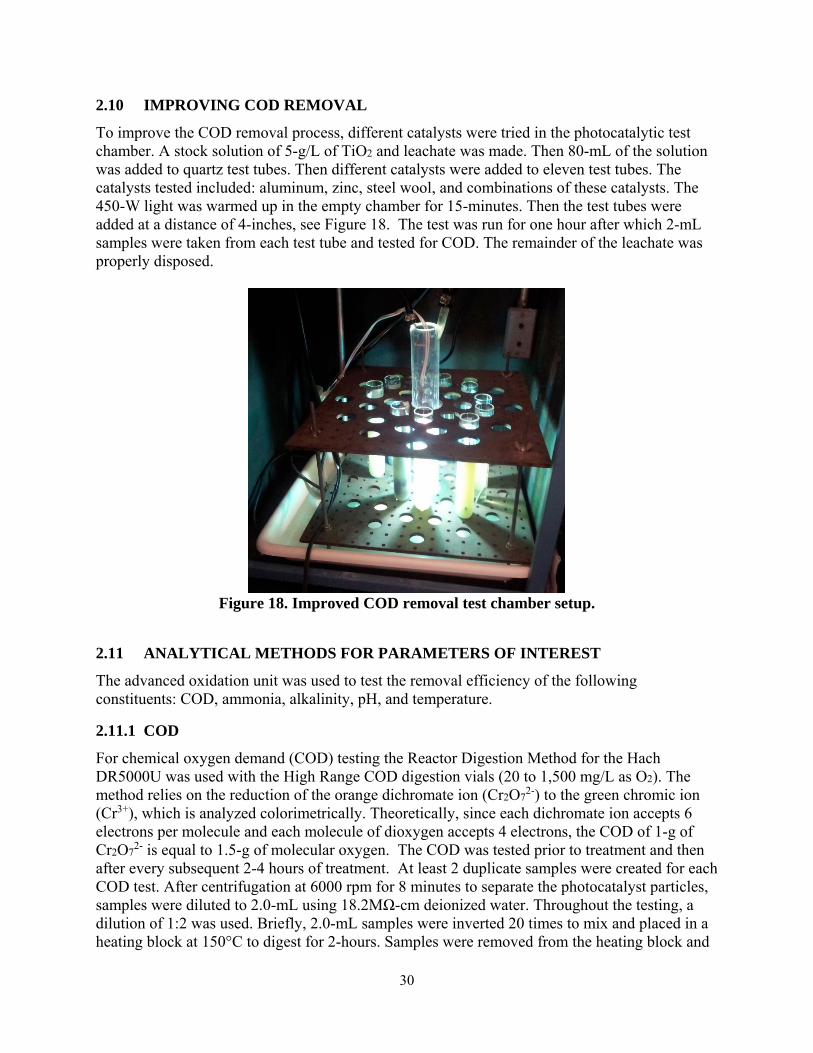
30
2.10 IMPROVING COD REMOVAL
To improve the COD removal process, different catalysts were tried in the photocatalytic test chamber. A stock solution of 5-g/L of TiO2 and leachate was made. Then 80-mL of the solution was added to quartz test tubes. Then different catalysts were added to eleven test tubes. The catalysts tested included: aluminum, zinc, steel wool, and combinations of these catalysts. The 450-W light was warmed up in the empty chamber for 15-minutes. Then the test tubes were added at a distance of 4-inches, see Figure 18. The test was run for one hour after which 2-mL samples were taken from each test tube and tested for COD. The remainder of the leachate was properly disposed.
Figure 18. Improved COD removal test chamber setup.
2.11 ANALYTICAL METHODS FOR PARAMETERS OF INTEREST
The advanced oxidation unit was used to test the removal efficiency of the following constituents: COD, ammonia, alkalinity, pH, and temperature.
2.11.1 COD
For chemical oxygen demand (COD) testing the Reactor Digestion Method for the Hach DR5000U was used with the High Range COD digestion vials (20 to 1,500 mg/L as O2). The method relies on the reduction of the orange dichromate ion (Cr2O7
2-) to the green chromic ion (Cr3+), which is analyzed colorimetrically. Theoretically, since each dichromate ion accepts 6 electrons per molecule and each molecule of dioxygen accepts 4 electrons, the COD of 1-g of Cr2O7
2- is equal to 1.5-g of molecular oxygen. The COD was tested prior to treatment and then after every subsequent 2-4 hours of treatment. At least 2 duplicate samples were created for each COD test. After centrifugation at 6000 rpm for 8 minutes to separate the photocatalyst particles, samples were diluted to 2.0-mL using 18.2MΩ-cm deionized water. Throughout the testing, a dilution of 1:2 was used. Briefly, 2.0-mL samples were inverted 20 times to mix and placed in a heating block at 150°C to digest for 2-hours. Samples were removed from the heating block and

31
inverted another 20 times before being allowed to cool for one hour in the dark. At this point, samples were wiped clean using a Kim-Wipe and analyzed using a Hach DR5000U UV-Vis spectrophotometer. The COD value in mg/L was recorded. A certified reference material (Total Organic Carbon Std. 1,000ppm prepared to EPA Method 415-1 Aqua Solutions, Deer Park, TX) was used to check the instrument calibration. This value varied from 0.1-10% error. One calibration check standard was analyzed per batch of samples. It was discovered that high levels of chloride in the samples can interfere in this test method. When accelerated levels of chloride (>2,000 mg/L) are present in the sample, the chlorides can be quantitatively oxidized by the dichromate, consequently displaying erroneous levels of oxidizable organic compounds. Due to sample dilution, high levels of chlorides that would affect the COD test were not encountered.
2.11.2 Ammonia-Nitrogen
For ammonia-nitrogen, the EPA Method # 350.2 (Detection of Ammonia by Colorimetry), Nessler spectrophotometric method was used. An ammonia (Medium Range: 0.00 to 9.99 mg/L as NH3-N) ion specific meter from Hanna Instruments (Woonsocket, RI) was used. The test began by adding 10-mL of sample to a 10-mL cuvette. The outside of the cuvette was cleaned with a Kim-wipe to remove any fingerprints or dust and placed in the instrument to be zeroed out. Next, four drops of the first reagent (HI 93715A) which is a mineral stabilizer and polyvinyl alcohol dispersing agent were added to the cuvette and the solution was swirled. Then four drops of the second reagent (HI 93715B) which is Nessler’s reagent were added, and the cuvette was swirled (see Figure 19) again.
Figure 19. Reagent addition to cuvette for ammonia testing.
The outside of the cuvette was cleaned once more before being placed back into the instrument. The recommended reaction time of 3.5-minutes was allowed to pass before the reading was taken. The instrument directly displayed the concentration in mg/L of ammonia-nitrogen (NH3-
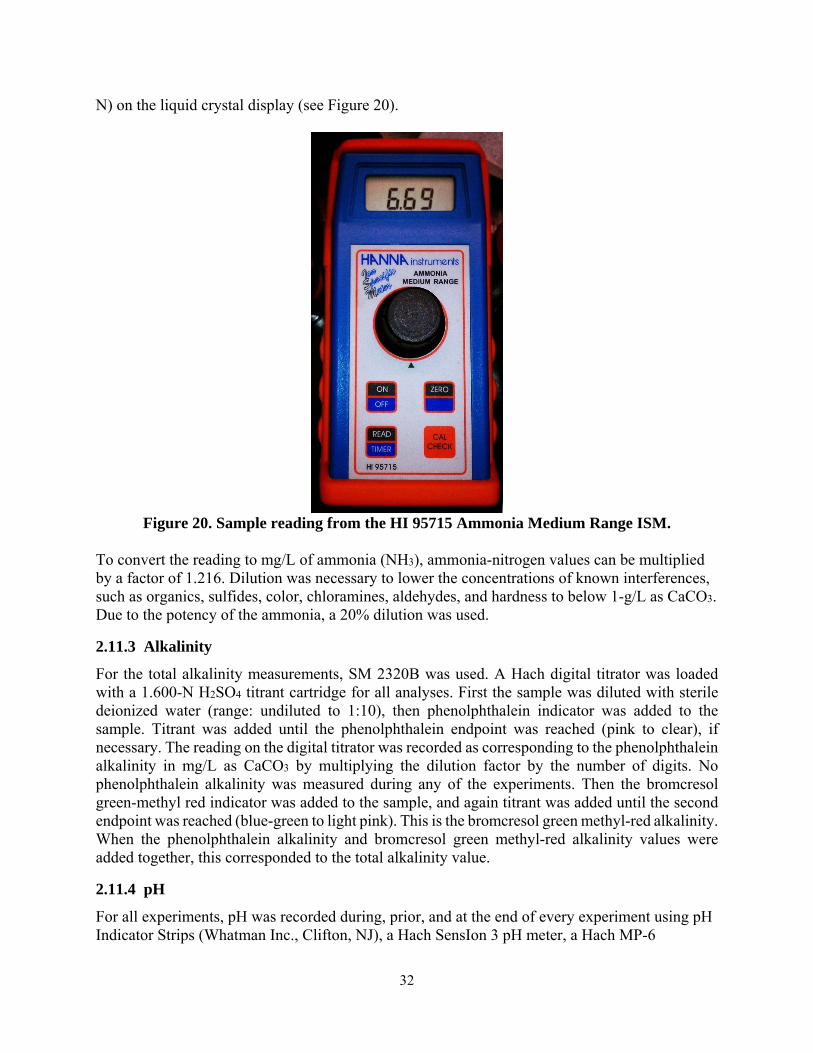
32
N) on the liquid crystal display (see Figure 20).
Figure 20. Sample reading from the HI 95715 Ammonia Medium Range ISM.
To convert the reading to mg/L of ammonia (NH3), ammonia-nitrogen values can be multiplied by a factor of 1.216. Dilution was necessary to lower the concentrations of known interferences, such as organics, sulfides, color, chloramines, aldehydes, and hardness to below 1-g/L as CaCO3. Due to the potency of the ammonia, a 20% dilution was used.
2.11.3 Alkalinity
For the total alkalinity measurements, SM 2320B was used. A Hach digital titrator was loaded with a 1.600-N H2SO4 titrant cartridge for all analyses. First the sample was diluted with sterile deionized water (range: undiluted to 1:10), then phenolphthalein indicator was added to the sample. Titrant was added until the phenolphthalein endpoint was reached (pink to clear), if necessary. The reading on the digital titrator was recorded as corresponding to the phenolphthalein alkalinity in mg/L as CaCO3 by multiplying the dilution factor by the number of digits. No phenolphthalein alkalinity was measured during any of the experiments. Then the bromcresol green-methyl red indicator was added to the sample, and again titrant was added until the second endpoint was reached (blue-green to light pink). This is the bromcresol green methyl-red alkalinity. When the phenolphthalein alkalinity and bromcresol green methyl-red alkalinity values were added together, this corresponded to the total alkalinity value.
2.11.4 pH
For all experiments, pH was recorded during, prior, and at the end of every experiment using pH Indicator Strips (Whatman Inc., Clifton, NJ), a Hach SensIon 3 pH meter, a Hach MP-6

33
multiparameter unit, or a Hach HQ40d Portable pH, Conductivity, Dissolved Oxygen (DO), and ORP probes with a Hach ISE Multi-Parameter Meter, with the latter being used for nearly all of the measurements reported. Probes were calibrated periodically with standard pH buffers (4, 7, and 10). Sensors were rinsed with deionized water and dried with kimwipes in between sample readings.
2.11.5 Dissolved Oxygen
After the first two runs of the pilot reactor, the dissolved oxygen was measured. The dissolved oxygen needs to be known to insure that enough oxygen is available to react with the TiO2 to remove metals. A Hach HQ40d Portable pH, Conductivity, Dissolved Oxygen (DO), and ORP probe was used to measure the dissolved oxygen content in the samples as soon as they were removed from the reactor.
2.11.5 Temperature
The temperature was recorded prior to and during all experiments. The advanced oxidation machine has a built in temperature probe in the 10-L reservoir. The temperature was recorded from the digital output located on the control box of the unit. The temperature was recorded every hour. The leachate temperature was also taken during the DO reading for QA/QC of reservoir thermometer.
2.12 CATALYST RECOVERY
An attempt to collect the used catalyst from the treated leachate for reuse was tried two different ways. The first was sedimentation of a sample of leachate that was taken from the reactor in a glass beaker. The beaker was then allowed to settle quiescently. Pictures were taken at 1-minute increments, see Figure 21.
Figure 21. Sedimentation time lapse series over a 10-minute period.

34
The second trial was filtering with a 1-micron bag filter. The leachate was allowed to settle in a 5-gallon bucket. The dry filter bag was weighed. Then the filter bag was placed over a second 5-gallon bucket, and the leachate was poured through the filter.
2.13 INTENSITY OF UV LIGHT
To measure the amount of UV light that the TiO2 is exposed to in the falling film and the flow through reactor the UV intensity was measured. The UV light was measured in three spectrums the: UVA, UVB and UVC ranges using a Fisher Scientific UV light meter 06-662-65 for UVA and UVB and a Sper Scientific 850010 UVC light meter. The lamps were allowed to warm up for 15-minutes to the correct operating temperature. Then the measuring devices were placed 0.5-inches from the light, and a measurement was taken. This was repeated three times for each light source, and an average of the readings was taken. To calculate the intensity, the arc length of the light and the outer circumference of the lamps protective tube were multiplied to get the total exposure area. This was then multiplied with the measured UV intensity for each spectrum, giving the total power of the lamp to that surface. This was then multiplied by the number of times the leachate volume is recirculated per hour and then by the number of hours the test was conducted for to find the Watt-hours per liter of exposure.

35
3. RESULTS AND DISCUSSION
This chapter explains in detail the results obtained from the experimental procedures that were described in the methodology section.
3.1 FALLING FILM EXPERIMENT #1
The falling film experiment was conducted with both the 150-W and the 450-W lamps. Each was run for 8-hours, with samples taken at 1-hour intervals. For the first set of trials, the TiO2 concentration was set at 5-g/L. The COD removal for the two trials was 0% for the 150-W lamp and 17% for the 450-W lamp. The ammonia removal was 7% for the 150-W lamp and 3% for the 450-W lamp. The alkalinity removal for the 150-W lamp was 9%, while the 450-W lamp was 2%. Results can be seen in Table 11 and Table 12.
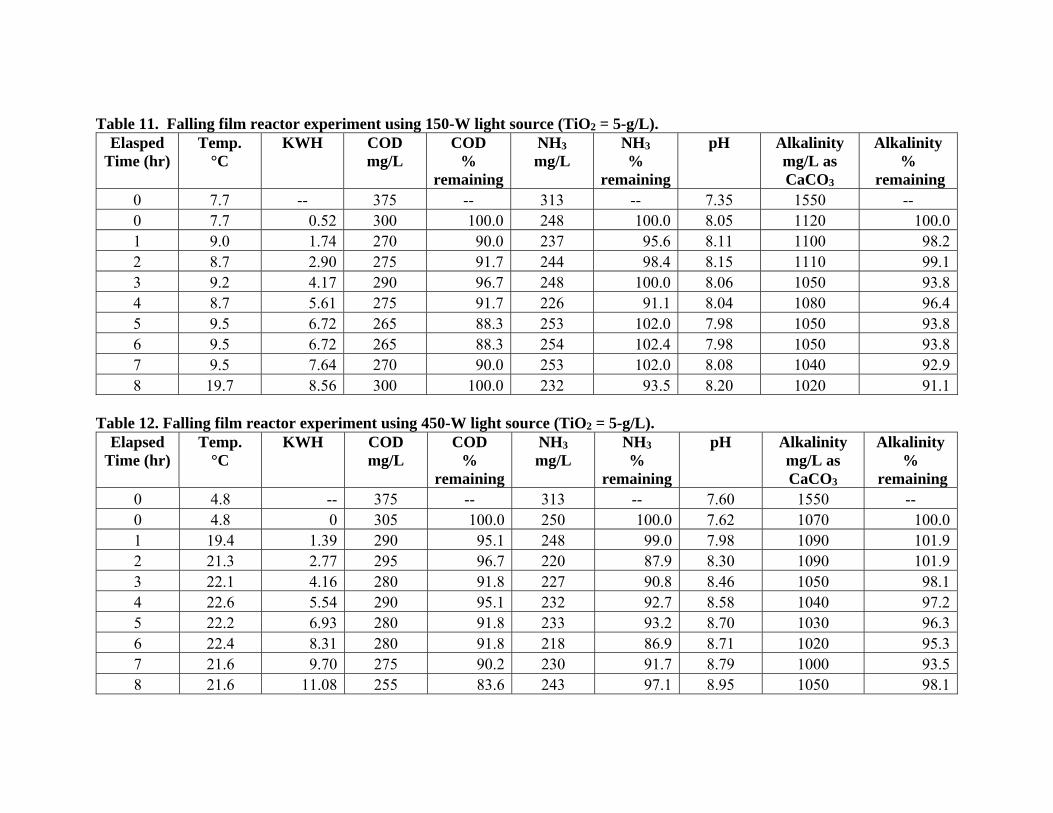
Table 11. Falling film reactor experiment using 150-W light source (TiO2 = 5-g/L).
Elasped Time (hr)
Temp. °C
KWH COD mg/L
COD %
remaining
NH3 mg/L
NH3 %
remaining
pH Alkalinity mg/L as CaCO3
Alkalinity %
remaining 0 7.7 -- 375 -- 313 -- 7.35 1550 -- 0 7.7 0.52 300 100.0 248 100.0 8.05 1120 100.01 9.0 1.74 270 90.0 237 95.6 8.11 1100 98.22 8.7 2.90 275 91.7 244 98.4 8.15 1110 99.13 9.2 4.17 290 96.7 248 100.0 8.06 1050 93.84 8.7 5.61 275 91.7 226 91.1 8.04 1080 96.45 9.5 6.72 265 88.3 253 102.0 7.98 1050 93.86 9.5 6.72 265 88.3 254 102.4 7.98 1050 93.87 9.5 7.64 270 90.0 253 102.0 8.08 1040 92.98 19.7 8.56 300 100.0 232 93.5 8.20 1020 91.1
Table 12. Falling film reactor experiment using 450-W light source (TiO2 = 5-g/L).
Elapsed Time (hr)
Temp. °C
KWH COD mg/L
COD %
remaining
NH3 mg/L
NH3 %
remaining
pH Alkalinity mg/L as CaCO3
Alkalinity %
remaining 0 4.8 -- 375 -- 313 -- 7.60 1550 -- 0 4.8 0 305 100.0 250 100.0 7.62 1070 100.01 19.4 1.39 290 95.1 248 99.0 7.98 1090 101.92 21.3 2.77 295 96.7 220 87.9 8.30 1090 101.93 22.1 4.16 280 91.8 227 90.8 8.46 1050 98.14 22.6 5.54 290 95.1 232 92.7 8.58 1040 97.25 22.2 6.93 280 91.8 233 93.2 8.70 1030 96.36 22.4 8.31 280 91.8 218 86.9 8.71 1020 95.37 21.6 9.70 275 90.2 230 91.7 8.79 1000 93.58 21.6 11.08 255 83.6 243 97.1 8.95 1050 98.1
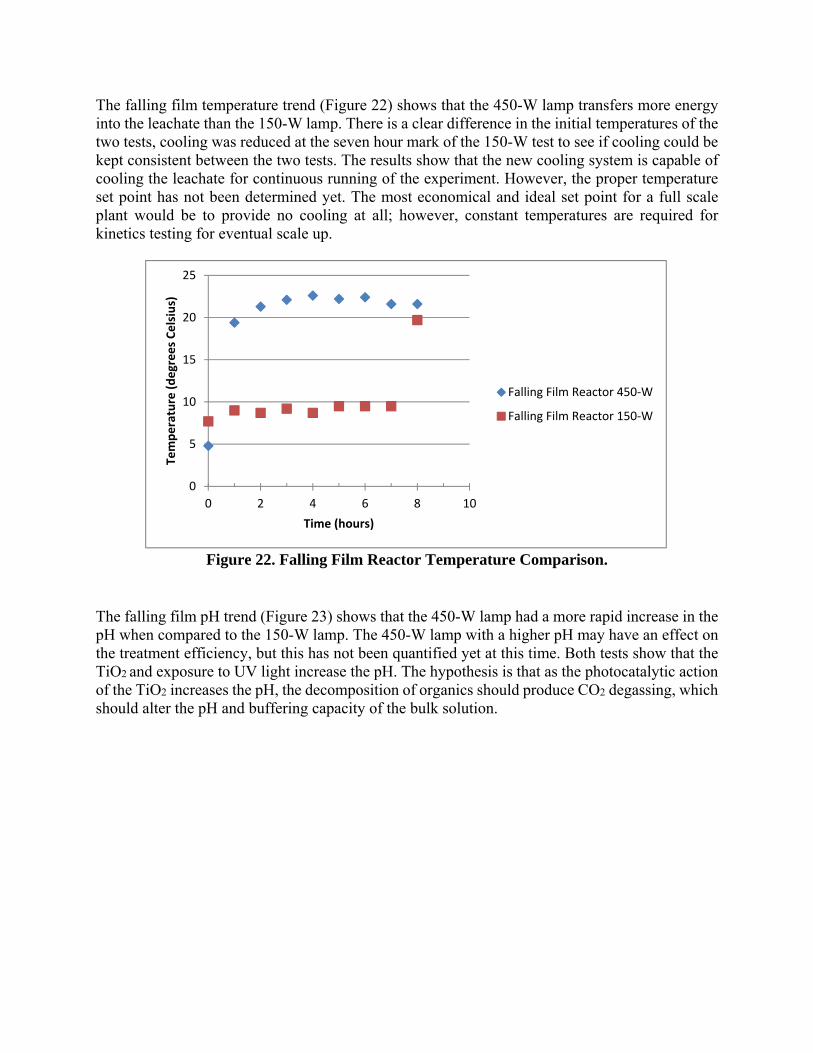
The falling film temperature trend (Figure 22) shows that the 450-W lamp transfers more energy into the leachate than the 150-W lamp. There is a clear difference in the initial temperatures of the two tests, cooling was reduced at the seven hour mark of the 150-W test to see if cooling could be kept consistent between the two tests. The results show that the new cooling system is capable of cooling the leachate for continuous running of the experiment. However, the proper temperature set point has not been determined yet. The most economical and ideal set point for a full scale plant would be to provide no cooling at all; however, constant temperatures are required for kinetics testing for eventual scale up.
Figure 22. Falling Film Reactor Temperature Comparison.
The falling film pH trend (Figure 23) shows that the 450-W lamp had a more rapid increase in the pH when compared to the 150-W lamp. The 450-W lamp with a higher pH may have an effect on the treatment efficiency, but this has not been quantified yet at this time. Both tests show that the TiO2 and exposure to UV light increase the pH. The hypothesis is that as the photocatalytic action of the TiO2 increases the pH, the decomposition of organics should produce CO2 degassing, which should alter the pH and buffering capacity of the bulk solution.
0
5
10
15
20
25
0 2 4 6 8 10
Temperature (degrees Celsius)
Time (hours)
Falling Film Reactor 450‐W
Falling Film Reactor 150‐W
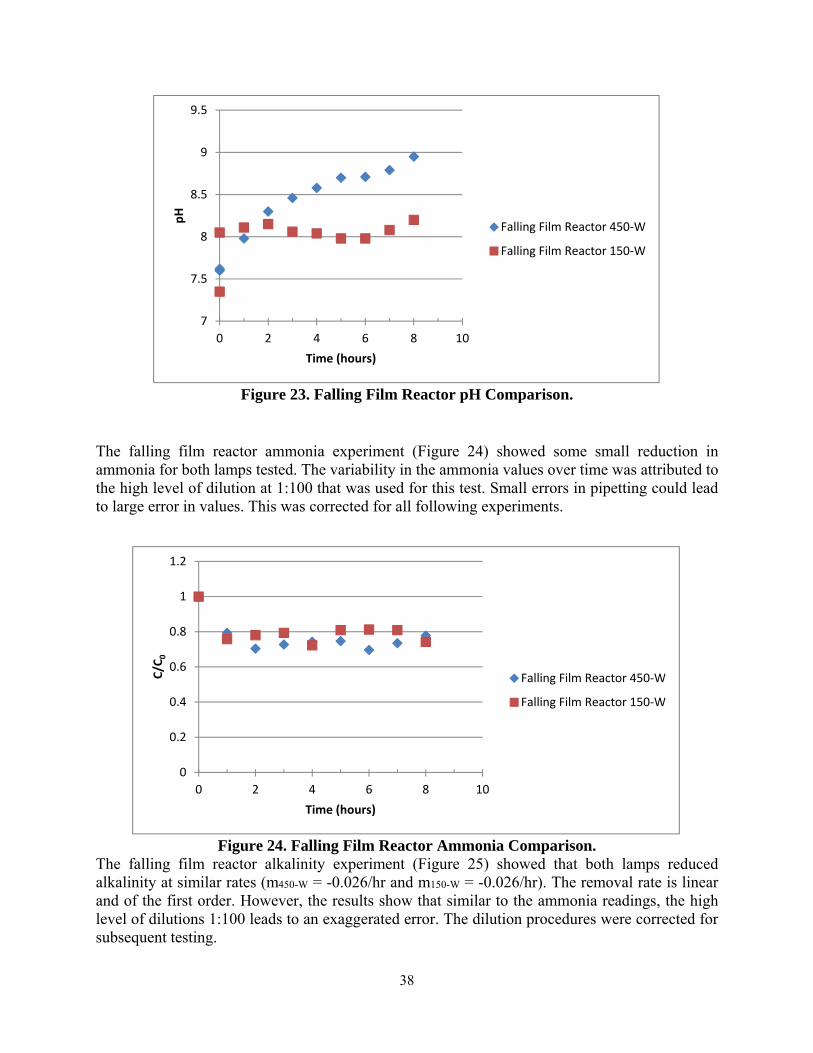
38
Figure 23. Falling Film Reactor pH Comparison.
The falling film reactor ammonia experiment (Figure 24) showed some small reduction in ammonia for both lamps tested. The variability in the ammonia values over time was attributed to the high level of dilution at 1:100 that was used for this test. Small errors in pipetting could lead to large error in values. This was corrected for all following experiments.
Figure 24. Falling Film Reactor Ammonia Comparison.
The falling film reactor alkalinity experiment (Figure 25) showed that both lamps reduced alkalinity at similar rates (m450-W = -0.026/hr and m150-W = -0.026/hr). The removal rate is linear and of the first order. However, the results show that similar to the ammonia readings, the high level of dilutions 1:100 leads to an exaggerated error. The dilution procedures were corrected for subsequent testing.
7
7.5
8
8.5
9
9.5
0 2 4 6 8 10
pH
Time (hours)
Falling Film Reactor 450‐W
Falling Film Reactor 150‐W
0
0.2
0.4
0.6
0.8
1
1.2
0 2 4 6 8 10
C/C
0
Time (hours)
Falling Film Reactor 450‐W
Falling Film Reactor 150‐W

39
Figure 25. Falling Film Reactor Alkalinity Comparison.
The falling film COD experiment (Figure 26) shows that COD removal is taking place, and that each lamp is removing COD at approximately the same rate of first order removal (m450-W = -0.025/hr and m150-W = -0.015/hr). Large spikes at the end of the test were seen for the both the 150-W and 450-W lamps. However, the spikes were in different directions. The 450-W increased removal while the 150-W showed a decrease in removal. Again this is attributed to the dilution that was used, which may have caused an exaggerated error.
Figure 26. Falling Film Reactor COD Comparison.
y = ‐0.026x + 0.8156
y = ‐0.026x + 0.8245
0
0.2
0.4
0.6
0.8
1
1.2
0 2 4 6 8 10
C/C
0
Time (hours)
Falling Film Reactor 450‐W
Falling Film Reactor 150‐W
Linear (Falling Film Reactor450‐W)
Linear (Falling Film Reactor150‐W)
y = ‐0.025x + 0.875
y = ‐0.015x + 0.8273
0
0.2
0.4
0.6
0.8
1
1.2
0 2 4 6 8 10
C/C
0
Time (hours)
Falling Film Reactor 450‐W
Falling Film Reactor 150‐W
Linear (Falling Film Reactor450‐W)
Linear (Falling Film Reactor150‐W)
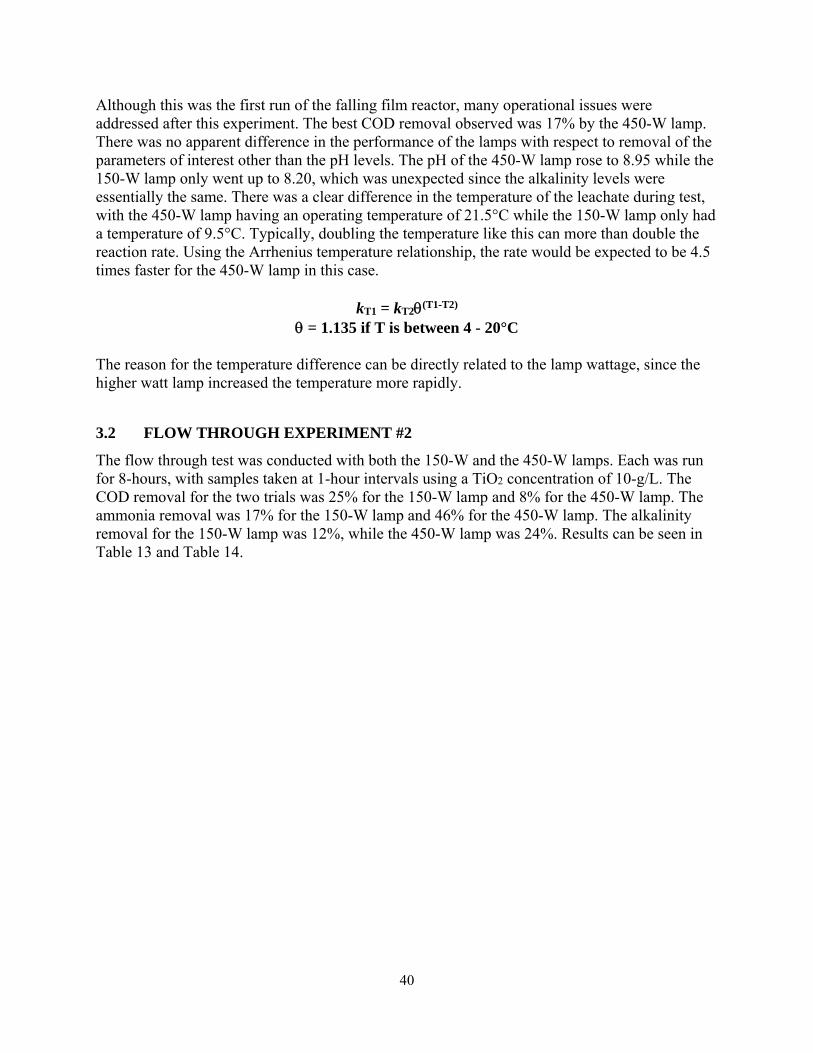
40
Although this was the first run of the falling film reactor, many operational issues were addressed after this experiment. The best COD removal observed was 17% by the 450-W lamp. There was no apparent difference in the performance of the lamps with respect to removal of the parameters of interest other than the pH levels. The pH of the 450-W lamp rose to 8.95 while the 150-W lamp only went up to 8.20, which was unexpected since the alkalinity levels were essentially the same. There was a clear difference in the temperature of the leachate during test, with the 450-W lamp having an operating temperature of 21.5°C while the 150-W lamp only had a temperature of 9.5°C. Typically, doubling the temperature like this can more than double the reaction rate. Using the Arrhenius temperature relationship, the rate would be expected to be 4.5 times faster for the 450-W lamp in this case.
kT1 = kT2(T1-T2) = 1.135 if T is between 4 - 20°C
The reason for the temperature difference can be directly related to the lamp wattage, since the higher watt lamp increased the temperature more rapidly.
3.2 FLOW THROUGH EXPERIMENT #2
The flow through test was conducted with both the 150-W and the 450-W lamps. Each was run for 8-hours, with samples taken at 1-hour intervals using a TiO2 concentration of 10-g/L. The COD removal for the two trials was 25% for the 150-W lamp and 8% for the 450-W lamp. The ammonia removal was 17% for the 150-W lamp and 46% for the 450-W lamp. The alkalinity removal for the 150-W lamp was 12%, while the 450-W lamp was 24%. Results can be seen in Table 13 and Table 14.
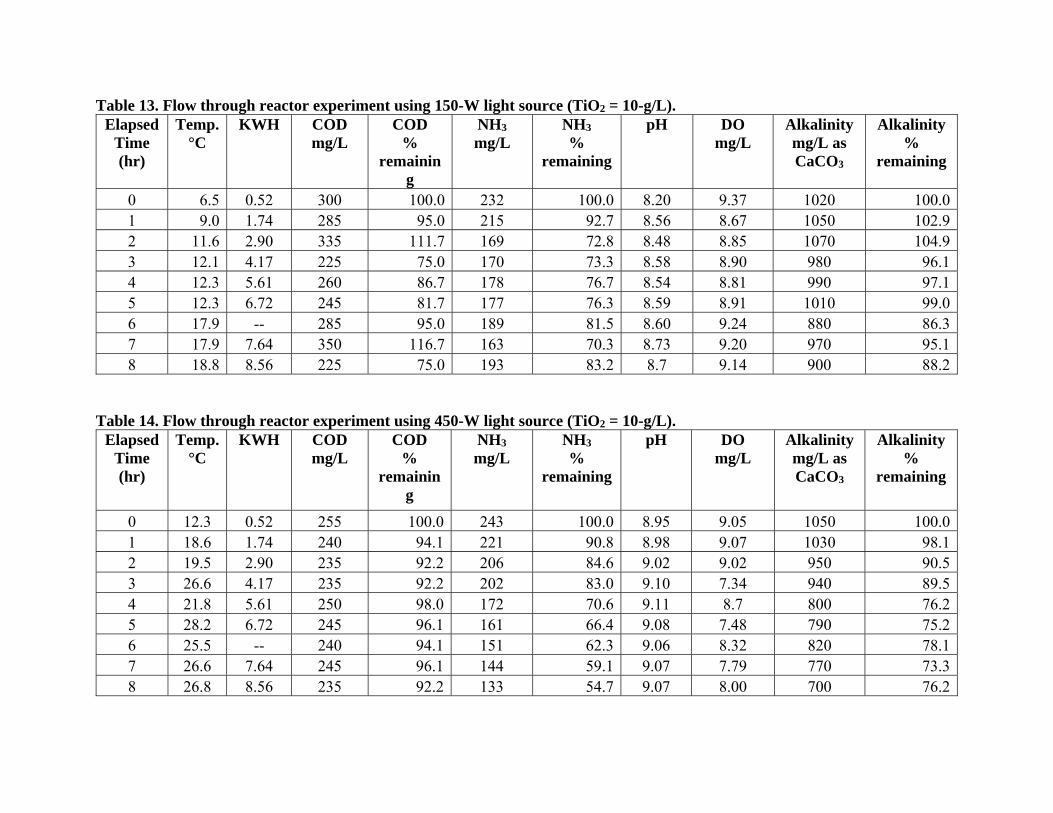
Table 13. Flow through reactor experiment using 150-W light source (TiO2 = 10-g/L). Elapsed
Time (hr)
Temp. °C
KWH COD mg/L
COD %
remaining
NH3 mg/L
NH3 %
remaining
pH DO mg/L
Alkalinity mg/L as CaCO3
Alkalinity %
remaining
0 6.5 0.52 300 100.0 232 100.0 8.20 9.37 1020 100.01 9.0 1.74 285 95.0 215 92.7 8.56 8.67 1050 102.92 11.6 2.90 335 111.7 169 72.8 8.48 8.85 1070 104.93 12.1 4.17 225 75.0 170 73.3 8.58 8.90 980 96.14 12.3 5.61 260 86.7 178 76.7 8.54 8.81 990 97.15 12.3 6.72 245 81.7 177 76.3 8.59 8.91 1010 99.06 17.9 -- 285 95.0 189 81.5 8.60 9.24 880 86.37 17.9 7.64 350 116.7 163 70.3 8.73 9.20 970 95.18 18.8 8.56 225 75.0 193 83.2 8.7 9.14 900 88.2
Table 14. Flow through reactor experiment using 450-W light source (TiO2 = 10-g/L).
Elapsed Time (hr)
Temp. °C
KWH COD mg/L
COD %
remaining
NH3 mg/L
NH3 %
remaining
pH DO mg/L
Alkalinity mg/L as CaCO3
Alkalinity %
remaining
0 12.3 0.52 255 100.0 243 100.0 8.95 9.05 1050 100.01 18.6 1.74 240 94.1 221 90.8 8.98 9.07 1030 98.12 19.5 2.90 235 92.2 206 84.6 9.02 9.02 950 90.53 26.6 4.17 235 92.2 202 83.0 9.10 7.34 940 89.54 21.8 5.61 250 98.0 172 70.6 9.11 8.7 800 76.25 28.2 6.72 245 96.1 161 66.4 9.08 7.48 790 75.26 25.5 -- 240 94.1 151 62.3 9.06 8.32 820 78.17 26.6 7.64 245 96.1 144 59.1 9.07 7.79 770 73.38 26.8 8.56 235 92.2 133 54.7 9.07 8.00 700 76.2
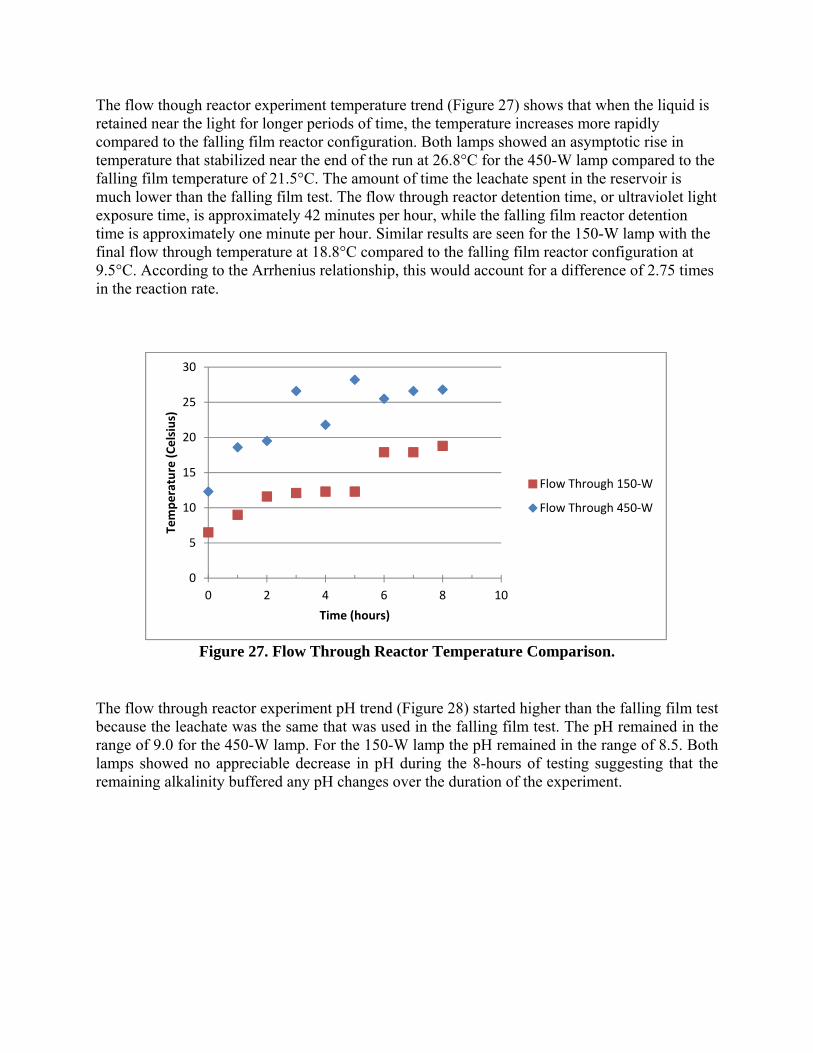
The flow though reactor experiment temperature trend (Figure 27) shows that when the liquid is retained near the light for longer periods of time, the temperature increases more rapidly compared to the falling film reactor configuration. Both lamps showed an asymptotic rise in temperature that stabilized near the end of the run at 26.8°C for the 450-W lamp compared to the falling film temperature of 21.5°C. The amount of time the leachate spent in the reservoir is much lower than the falling film test. The flow through reactor detention time, or ultraviolet light exposure time, is approximately 42 minutes per hour, while the falling film reactor detention time is approximately one minute per hour. Similar results are seen for the 150-W lamp with the final flow through temperature at 18.8°C compared to the falling film reactor configuration at 9.5°C. According to the Arrhenius relationship, this would account for a difference of 2.75 times in the reaction rate.
Figure 27. Flow Through Reactor Temperature Comparison.
The flow through reactor experiment pH trend (Figure 28) started higher than the falling film test because the leachate was the same that was used in the falling film test. The pH remained in the range of 9.0 for the 450-W lamp. For the 150-W lamp the pH remained in the range of 8.5. Both lamps showed no appreciable decrease in pH during the 8-hours of testing suggesting that the remaining alkalinity buffered any pH changes over the duration of the experiment.
0
5
10
15
20
25
30
0 2 4 6 8 10
Temperature (Celsius)
Time (hours)
Flow Through 150‐W
Flow Through 450‐W

43
Figure 28. Flow Through Reactor pH Comparison.
The flow through reactor experiment ammonia trend (Figure 29) showed a 45.3% reduction in ammonia for the 450-W lamp, which appeared to continue to drop over time, compared to the 2.9% reduction from the previous 450-W falling film test. The 150-W flow through reactor configuration showed an ammonia reduction of 26.8% compared with the previous 150-W falling film test of 6.5% and appeared to stabilize. Both lamps showed a remarkable improvement in ammonia removal while in the flow through reactor configuration.
Figure 29. Flow Through Reactor Ammonia Comparison.
7
7.5
8
8.5
9
9.5
0 2 4 6 8 10
pH
Time (hours)
Flow Through 150‐W
Flow Through 450‐W
0
0.2
0.4
0.6
0.8
1
1.2
0 2 4 6 8 10
C/C
o
Time (hours)
Flow Through 150‐W
Flow Through 450‐W

44
The flow through reactor experiment alkalinity trend (Figure 30) shows that the 450-W light removed 45.3% of the ammonia compared to the 450-W falling film reactor configuration, which removed only 2.9%. While the 150-W light in the flow through reactor experiment removed 16.8% compared to the previous flow through reactor configuration ammonia removal of only 6.5%. Both lamps demonstrated that the flow through reactor configuration was more effective at ammonia removal; however, this may also be attributed to the higher temperatures of the test.
Figure 30. Flow Through Reactor Alkalinity Comparison.
The flow through reactor experiment COD removal trend (Figure 31) showed only a small amount of COD removal from both the 450-W and the 150-W lamps. The 450-W light removed 7.8% compared with the falling film reactor configuration COD removal of 16.4%. The flow through reactor for the 150-W lamp showed 25% removal after 8 hours, while the falling film reactor showed essentially no removal over the same time period. From previous work (Meeroff and Youngman 2014), the COD removal is expected to have the lowest removal rate of the parameters tested.
0
0.2
0.4
0.6
0.8
1
1.2
0 2 4 6 8 10
C/C
o
Time (hours)
Flow Through 150‐W
Flow Through 450‐W
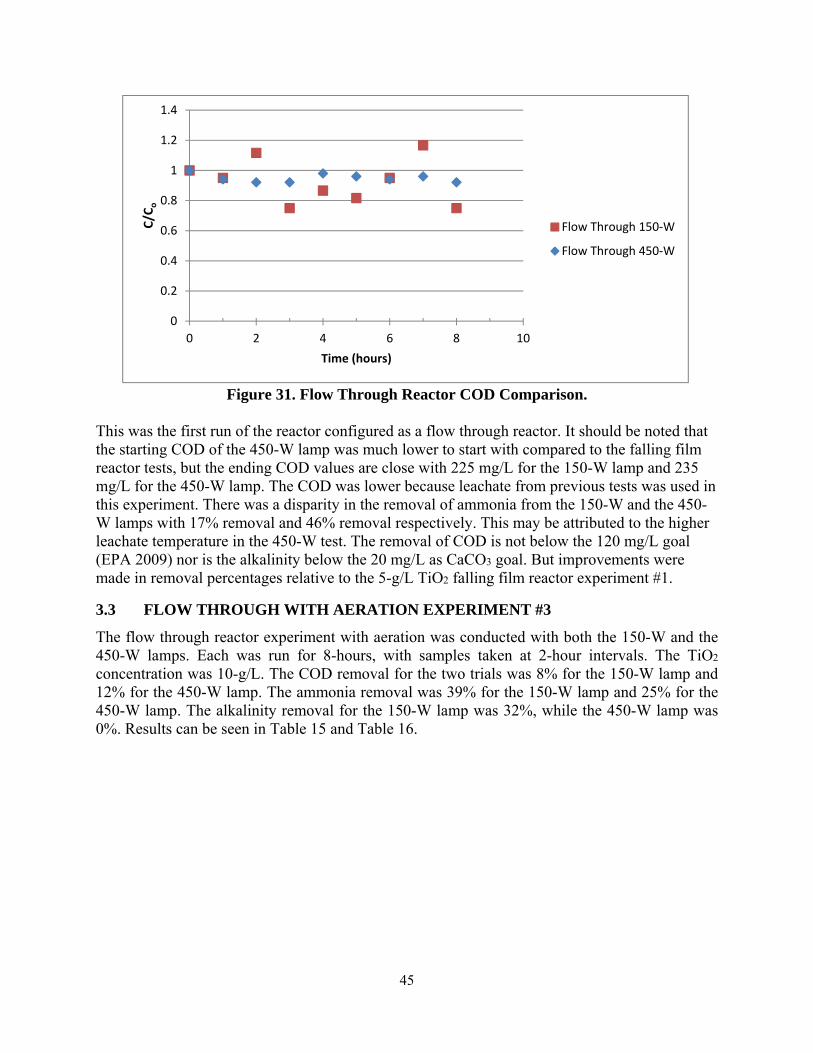
45
Figure 31. Flow Through Reactor COD Comparison.
This was the first run of the reactor configured as a flow through reactor. It should be noted that the starting COD of the 450-W lamp was much lower to start with compared to the falling film reactor tests, but the ending COD values are close with 225 mg/L for the 150-W lamp and 235 mg/L for the 450-W lamp. The COD was lower because leachate from previous tests was used in this experiment. There was a disparity in the removal of ammonia from the 150-W and the 450-W lamps with 17% removal and 46% removal respectively. This may be attributed to the higher leachate temperature in the 450-W test. The removal of COD is not below the 120 mg/L goal (EPA 2009) nor is the alkalinity below the 20 mg/L as CaCO3 goal. But improvements were made in removal percentages relative to the 5-g/L TiO2 falling film reactor experiment #1.
3.3 FLOW THROUGH WITH AERATION EXPERIMENT #3
The flow through reactor experiment with aeration was conducted with both the 150-W and the 450-W lamps. Each was run for 8-hours, with samples taken at 2-hour intervals. The TiO2 concentration was 10-g/L. The COD removal for the two trials was 8% for the 150-W lamp and 12% for the 450-W lamp. The ammonia removal was 39% for the 150-W lamp and 25% for the 450-W lamp. The alkalinity removal for the 150-W lamp was 32%, while the 450-W lamp was 0%. Results can be seen in Table 15 and Table 16.
0
0.2
0.4
0.6
0.8
1
1.2
1.4
0 2 4 6 8 10
C/C
o
Time (hours)
Flow Through 150‐W
Flow Through 450‐W

Table 15. Flow through reactor experiment with aeration using 150-W light source (TiO2 = 10-g/L). Elapsed
Time (hr) Temp.
°C COD mg/L
COD %
remaining
NH3 mg/L
NH3 %
remaining
pH DO mg/L
Alkalinity mg/L as CaCO3
Alkalinity %
remaining
0 12.1 263 100.0 193 100.0 8.70 9.14 900 100.01 18.1 263 100.0 135 69.7 8.62 9.01 680 75.62 18.9 254 96.6 134 69.4 8.63 8.81 680 75.64 20.4 246 93.5 129 66.6 8.71 8.90 680 75.66 21.2 255 97.0 126 65.3 8.81 8.81 630 70.08 22.6 243 92.4 119 61.7 9.00 8.31 620 68.9
Table 16. Flow through reactor experiment with aeration using 450-W light source (TiO2 = 10-g/L).
Elapsed Time (hr)
Temp. °C
COD mg/L
COD %
remaining
NH3 mg/L
NH3 %
remaining
pH DO mg/L
Alkalinity mg/L as CaCO3
Alkalinity %
remaining
0 14.5 240 100.0 100 100.0 8.55 9.34 700 100.0
2 21.7 220 91.7 95 95 8.62 8.57 700 100.0
4 26.9 217 90.4 84 84 8.67 8.13 490 70.06 23.8 210 87.5 77 77 8.69 8.53 430 61.48 28.4 189 78.8 75 75 8.76 7.85 700 100.0
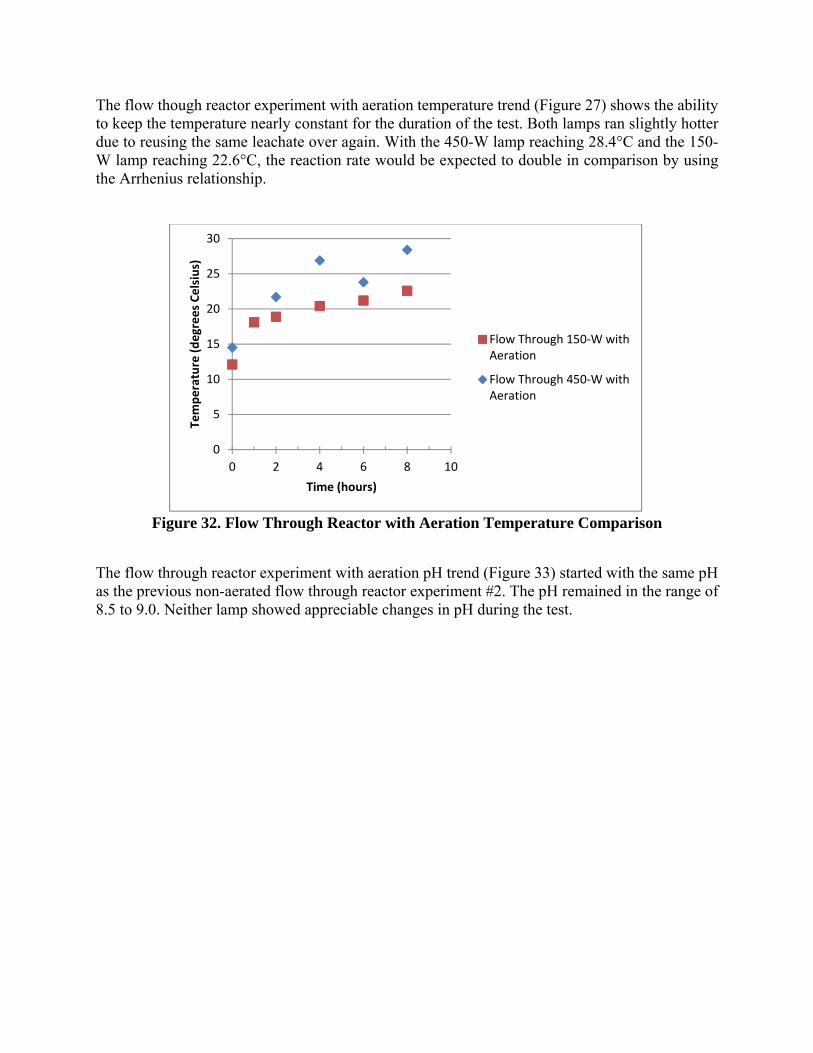
The flow though reactor experiment with aeration temperature trend (Figure 27) shows the ability to keep the temperature nearly constant for the duration of the test. Both lamps ran slightly hotter due to reusing the same leachate over again. With the 450-W lamp reaching 28.4°C and the 150-W lamp reaching 22.6°C, the reaction rate would be expected to double in comparison by using the Arrhenius relationship.
Figure 32. Flow Through Reactor with Aeration Temperature Comparison
The flow through reactor experiment with aeration pH trend (Figure 33) started with the same pH as the previous non-aerated flow through reactor experiment #2. The pH remained in the range of 8.5 to 9.0. Neither lamp showed appreciable changes in pH during the test.
0
5
10
15
20
25
30
0 2 4 6 8 10
Temperature (degrees Celsius)
Time (hours)
Flow Through 150‐W withAeration
Flow Through 450‐W withAeration

48
Figure 33. Flow Through Reactor with Aeration pH Comparison.
The flow through reactor experiment with aeration ammonia trend (Figure 34) showed a 25.0% reduction in ammonia for the 450-W lamp, compared to the 45.3% reduction from the previous 450-W non-aerated flow through reactor experiment #2. The 150-W lamp showed a reduction of 38.3% compared with the 150-W non-aerated flow through reactor experiment #2, which showed only 26.8% removal. The limited removal for the 450-W lamp may be due to the low starting concentration when compared to the 150-W lamp. The 450-W lamp run started with an ammonia concentration of 100 mg/L compared to the 150-W lamp, which started at 193 mg/L.
Figure 34. Flow Through Reactor with Aeration Ammonia Comparison.
7
7.5
8
8.5
9
9.5
0 2 4 6 8 10
pH
Time (hours)
Flow Through 150‐W with Aeration
Flow Through 450‐W with Aeration
0
0.2
0.4
0.6
0.8
1
1.2
0 2 4 6 8 10
C/C
o
Time (hours)
Flow Through 150‐W with Aeration
Flow Through 450‐W with Aeration

49
The flow through reactor experiment with aeration alkalinity trend (Figure 30) shows that the 450-W light removed up to 40% of the alkalinity compared to the previous non-aerated flow through test, which removed 45.3% of the alkalinity. The 150-W light removed 31.1% compared to the non-aerated flow through test, which only removed 16.8%
Figure 35. Flow Through Reactor with Aeration Alkalinity Comparison.
The flow through reactor experiment with aeration COD trend (Figure 36) showed only a small removal from both the 450-W and the 150-W light. The 450-W light removed 21.2 % compared with the non-aerated flow through test removal of 7.8%. The 150-W light removed 27.6%, compared to the previous non-aerated experiment removal of 25%.
Figure 36. Flow Through Reactor with Aeration COD Comparison.
0
0.2
0.4
0.6
0.8
1
1.2
0 2 4 6 8 10
C/C
o
Time (hours)
Flow Through 150‐W with Aeration
Flow Through 450‐W with Aeration
0
0.2
0.4
0.6
0.8
1
1.2
0 2 4 6 8 10
C/C
o
Time (hours)
Flow Through 150‐W with Aeration
Flow Through 450‐W with Aeration
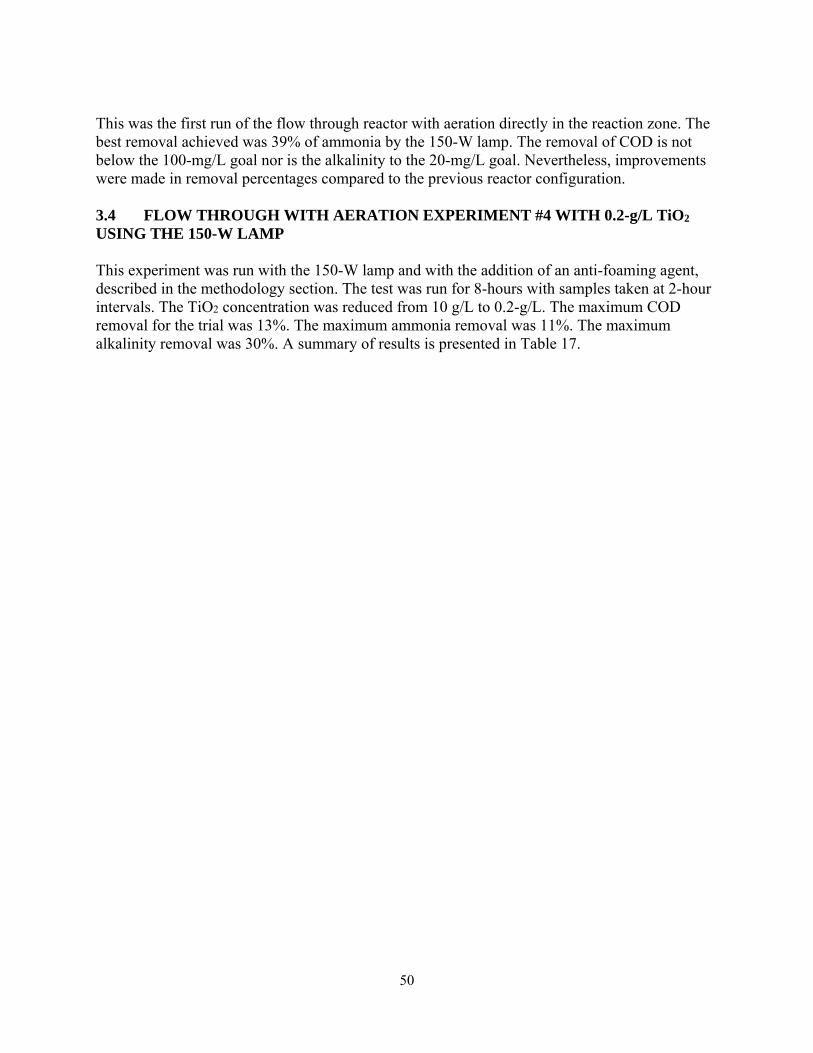
50
This was the first run of the flow through reactor with aeration directly in the reaction zone. The best removal achieved was 39% of ammonia by the 150-W lamp. The removal of COD is not below the 100-mg/L goal nor is the alkalinity to the 20-mg/L goal. Nevertheless, improvements were made in removal percentages compared to the previous reactor configuration. 3.4 FLOW THROUGH WITH AERATION EXPERIMENT #4 WITH 0.2-g/L TiO2 USING THE 150-W LAMP This experiment was run with the 150-W lamp and with the addition of an anti-foaming agent, described in the methodology section. The test was run for 8-hours with samples taken at 2-hour intervals. The TiO2 concentration was reduced from 10 g/L to 0.2-g/L. The maximum COD removal for the trial was 13%. The maximum ammonia removal was 11%. The maximum alkalinity removal was 30%. A summary of results is presented in Table 17.

Table 17. Flow through reactor experiment with aeration using 150-W light source (TiO2 = 0.2-g/L).
Elapsed Time (hr)
Temp. °C
COD mg/L
COD %
remaining
NH3 mg/L
NH3 %
remaining
pH DO mg/L
Alkalinity mg/L as CaCO3
Alkalinity %
remaining
Raw 19.1 294 -- 194 100.0 7.17 6.48 1310 100.0Filtered 17.9 312 -- 192 99.2 7.26 7.41 1290 98.5
Anti-Foam 16.1 441 100.0 190 97.9 7.93 10.06 1240 94.71 15.4 427 96.8 181 93.5 8.41 9.90 1100 84.03 20.1 408 92.5 188 96.9 8.60 9.01 960 73.35 19.7 395 89.6 177 91.5 8.84 9.09 920 70.27 20.0 388 88.0 184 95.1 8.97 8.97 910 69.58 19.8 388 88.0 174 89.7 8.95 9.08 920 70.2

The flow though reactor experiment with aeration using 0.2 g/L TiO2 temperature trend (Figure 37) show the ability to maintain the temperature near constant for the during of the test. But the ability to keep the temperature constant brings in question the effect of the temperature on the removal process. A higher temperature would be expected to cause hardness to fall out of solution, reducing alkalinity in the process. Higher temperatures would also affect the amount of ammonia that the leachate can hold in bulk solution. This effect could potentially be responsible for more removal than the actual TiO2 and UV treatment accounts for.
Figure 37. Flow Through Reactor with 150-W Lamp and Aeration using TiO2 = 0.2 g/L
Temperature Trend.
The flow through reactor experiment with aeration using 0.2 g/L TiO2 pH trend (Figure 38) started with a pH of 7.93. The pH increased to 8.97 during the test. The last two readings were almost the same with 8.97 and 8.95. This shows that during the test, the pH does increase, but if the organics were reacting with the photocatalytic process, the pH should be falling, because of the production of CO2. The alkalinity of the leachate was reduced, making it easier to change pH of the leachate. It was hypothesized that the generation of CO2 from the reduction of organic compound would reduce the pH. However, the pH increased, bringing into question if CO2 was formed as projected.
0
5
10
15
20
25
0 2 4 6 8 10
Temperature (degrees Celsius)
Time (hours)
Flow Through Reactor 150‐W with 0.2 g/LTemperature
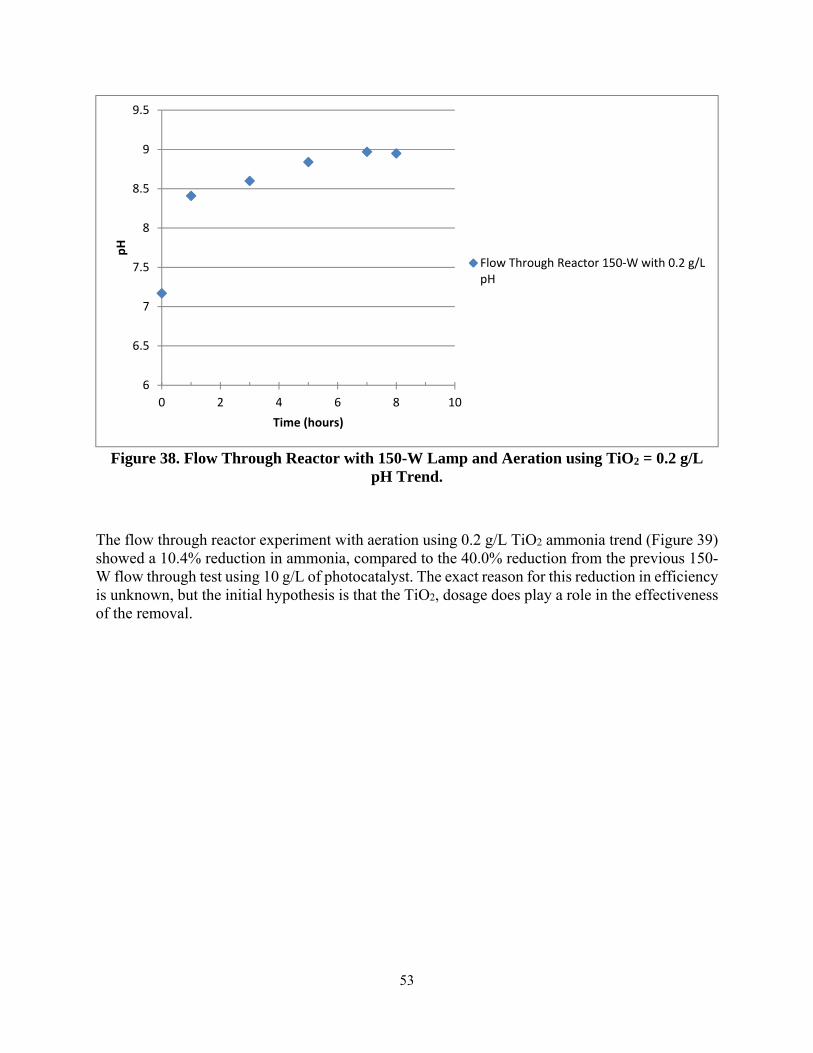
53
Figure 38. Flow Through Reactor with 150-W Lamp and Aeration using TiO2 = 0.2 g/L
pH Trend.
The flow through reactor experiment with aeration using 0.2 g/L TiO2 ammonia trend (Figure 39) showed a 10.4% reduction in ammonia, compared to the 40.0% reduction from the previous 150-W flow through test using 10 g/L of photocatalyst. The exact reason for this reduction in efficiency is unknown, but the initial hypothesis is that the TiO2, dosage does play a role in the effectiveness of the removal.
6
6.5
7
7.5
8
8.5
9
9.5
0 2 4 6 8 10
pH
Time (hours)
Flow Through Reactor 150‐W with 0.2 g/LpH

54
Figure 39. Flow Through Reactor with 150-W Lamp and Aeration using TiO2 = 0.2 g/L
Ammonia Trend.
The flow through reactor experiment with aeration using 0.2 g/L TiO2 alkalinity trend (Figure 40) shows that the 150-W light removed 30.0% of the alkalinity compared to the previous flow through test which removed only 31.1%, which used 10 g/L of photocatalyst. These removal rates are almost identical and suggest that the TiO2 dosage many not be the major contributing factor to the ammonia removal.
Figure 40. Flow Through Reactor with 150-W Lamp and Aeration using TiO2 = 0.2 g/L
Alkalinity Trend.
0
0.2
0.4
0.6
0.8
1
1.2
0 2 4 6 8 10
Ammonia, m
g/L
Time (hours)
Flow Through 150‐W 0.2 g/LAmmonia
0
0.1
0.2
0.3
0.4
0.5
0.6
0.7
0.8
0.9
1
0 2 4 6 8 10
C/C
o
Time (hours)
Flow Through Reactor with Aeration 0.2 g/L,Alkalinity

55
The flow through reactor experiment with aeration using 0.2 g/L TiO2 COD trend (Figure 41) showed 11.3% removal. Compare this to the previous experiment’s 7.7% removal with 10 g/L of photocatalyst, and the result is only slightly better. What is not seen in Figure 41 is that the anti-foaming agent was added to the reactor to make controlling the process easier. This anti-foaming agent raised the starting COD from 294 mg/L for raw leachate to 441 mg/L for the leachate treated with anti-foam. The results of the test show that the final COD removal was still above the raw leachate by 32% because of the addition of the anti-foaming agent.
Figure 41. Flow Through Reactor with 150-W Lamp with Aeration using TiO2 = 0.2 g/L COD Trend.
This was the first run that used anti-foaming agents, and it did make operating the reactor easier. However, it did increase the COD demand by about 130 mg/L after it was added. This was concerning because COD is one of the parameters that is the focus to eliminate, after the 8-hour run, the COD levels had not returned to their original levels in the raw leachate. The best removal was 30% of alkalinity. This test showed improvements in the treatment process.
3.5 TiO2 DOSING TEST
During testing, a question about how much light penetration is achieved came up. Since the flow through reactor light waves must travel 2 inches to reach the full bulk solution, the light absorbance of the TiO2 at various concentrations was measured. In the falling film reactor, light penetration is not an issue because the solution falls in a thin sheet. Twelve cuvettes were prepared with different dilutions to scan at 330-nm (refer to Figure 15), which was the maximum observed absorbance wavelength. The results are plotted in Figure 42.
0
0.2
0.4
0.6
0.8
1
1.2
0 2 4 6 8 10
C/C
o
Time (hours)
Flow Through Reactor withAeration 0.2 g/L, COD
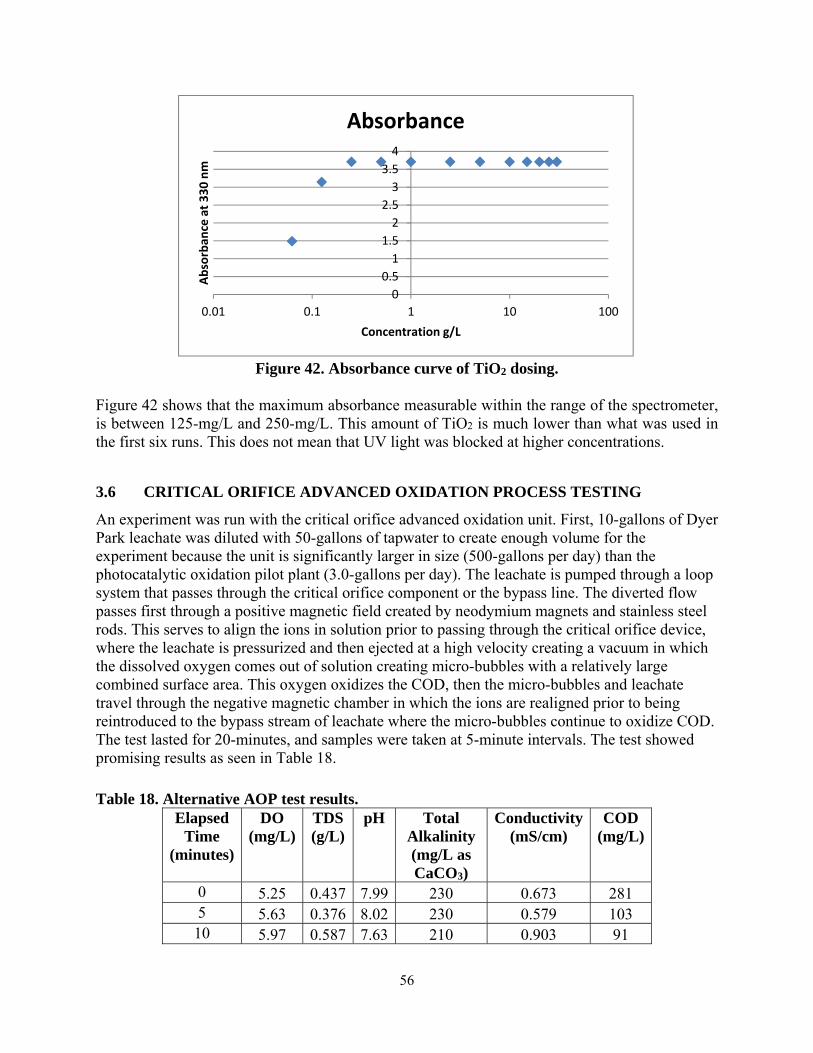
56
Figure 42. Absorbance curve of TiO2 dosing.
Figure 42 shows that the maximum absorbance measurable within the range of the spectrometer, is between 125-mg/L and 250-mg/L. This amount of TiO2 is much lower than what was used in the first six runs. This does not mean that UV light was blocked at higher concentrations.
3.6 CRITICAL ORIFICE ADVANCED OXIDATION PROCESS TESTING
An experiment was run with the critical orifice advanced oxidation unit. First, 10-gallons of Dyer Park leachate was diluted with 50-gallons of tapwater to create enough volume for the experiment because the unit is significantly larger in size (500-gallons per day) than the photocatalytic oxidation pilot plant (3.0-gallons per day). The leachate is pumped through a loop system that passes through the critical orifice component or the bypass line. The diverted flow passes first through a positive magnetic field created by neodymium magnets and stainless steel rods. This serves to align the ions in solution prior to passing through the critical orifice device, where the leachate is pressurized and then ejected at a high velocity creating a vacuum in which the dissolved oxygen comes out of solution creating micro-bubbles with a relatively large combined surface area. This oxygen oxidizes the COD, then the micro-bubbles and leachate travel through the negative magnetic chamber in which the ions are realigned prior to being reintroduced to the bypass stream of leachate where the micro-bubbles continue to oxidize COD. The test lasted for 20-minutes, and samples were taken at 5-minute intervals. The test showed promising results as seen in Table 18.
Table 18. Alternative AOP test results. Elapsed
Time (minutes)
DO (mg/L)
TDS (g/L)
pH Total Alkalinity (mg/L as CaCO3)
Conductivity (mS/cm)
COD (mg/L)
0 5.25 0.437 7.99 230 0.673 281 5 5.63 0.376 8.02 230 0.579 103 10 5.97 0.587 7.63 210 0.903 91
0
0.5
1
1.5
2
2.5
3
3.5
4
0.01 0.1 1 10 100
Absorban
ce at 330 nm
Concentration g/L
Absorbance
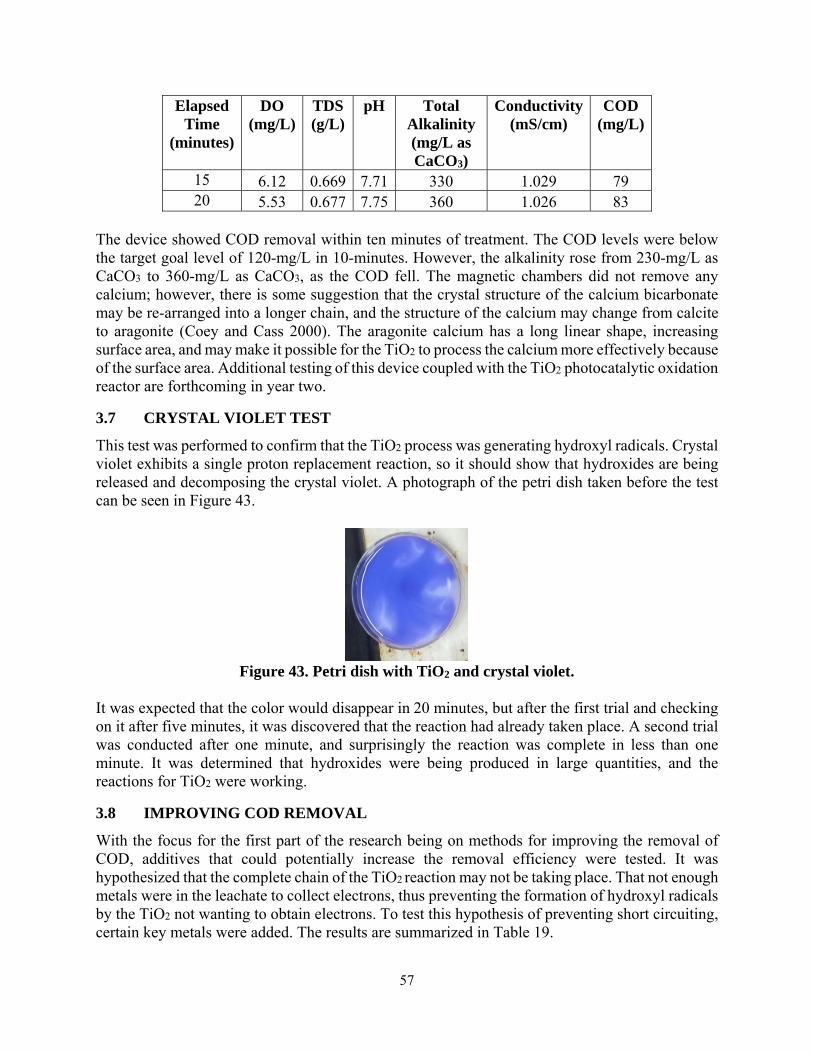
57
Elapsed Time
(minutes)
DO (mg/L)
TDS (g/L)
pH Total Alkalinity (mg/L as CaCO3)
Conductivity (mS/cm)
COD (mg/L)
15 6.12 0.669 7.71 330 1.029 79 20 5.53 0.677 7.75 360 1.026 83
The device showed COD removal within ten minutes of treatment. The COD levels were below the target goal level of 120-mg/L in 10-minutes. However, the alkalinity rose from 230-mg/L as CaCO3 to 360-mg/L as CaCO3, as the COD fell. The magnetic chambers did not remove any calcium; however, there is some suggestion that the crystal structure of the calcium bicarbonate may be re-arranged into a longer chain, and the structure of the calcium may change from calcite to aragonite (Coey and Cass 2000). The aragonite calcium has a long linear shape, increasing surface area, and may make it possible for the TiO2 to process the calcium more effectively because of the surface area. Additional testing of this device coupled with the TiO2 photocatalytic oxidation reactor are forthcoming in year two.
3.7 CRYSTAL VIOLET TEST
This test was performed to confirm that the TiO2 process was generating hydroxyl radicals. Crystal violet exhibits a single proton replacement reaction, so it should show that hydroxides are being released and decomposing the crystal violet. A photograph of the petri dish taken before the test can be seen in Figure 43.
Figure 43. Petri dish with TiO2 and crystal violet.
It was expected that the color would disappear in 20 minutes, but after the first trial and checking on it after five minutes, it was discovered that the reaction had already taken place. A second trial was conducted after one minute, and surprisingly the reaction was complete in less than one minute. It was determined that hydroxides were being produced in large quantities, and the reactions for TiO2 were working.
3.8 IMPROVING COD REMOVAL
With the focus for the first part of the research being on methods for improving the removal of COD, additives that could potentially increase the removal efficiency were tested. It was hypothesized that the complete chain of the TiO2 reaction may not be taking place. That not enough metals were in the leachate to collect electrons, thus preventing the formation of hydroxyl radicals by the TiO2 not wanting to obtain electrons. To test this hypothesis of preventing short circuiting, certain key metals were added. The results are summarized in Table 19.

58
Table 19. Summary of results from using metal additives to stimulate COD removal.
Sample COD Final C/Co Leachate + TiO2 258 0.83Leachate + Zinc + TiO2 solution 262 0.84Leachate + UV 276 0.88Leachate + Zinc + TiO2 coated aluminum+ TiO2 solution 276 0.88Leachate + TiO2 coated aluminum + TiO2 solution 292 0.94Raw Leachate 312 1.00Leachate + TiO2 coated aluminum 312 1.00Leachate + Steel Wool + TiO2 solution 315 1.01Leachate + Steel Wool 317 1.02Leachate + Steel Wool + TiO2 coated aluminum + TiO2 solution 319 1.02Leachate + Zinc 340 1.09
From the results, it is clear that the TiO2 alone is the best, and that there is no short circuiting happening in the process with fresh leachate. Both the zinc and the steel wool caused the COD to rise, but titanium with zinc achieves a similar COD removal of 84% to the titanium and UV.
3.9 INTENSITY OF UV LIGHT
Calculations for energy that the titanium dioxide was exposed to per liter were made for both the falling film and the flow through reactor. The energy available for titanium dioxide to absorb in conjunction with exposure time should be directly related to efficiency. The results can be seen in Table 20 and Table 21.

Table 20: Falling Film UV Light Intensity.
Table 21: Flow Through UV Light Intensity.
LightArch
Length (cm) Circumference
(cm)Area (cm2)
Measured UV (mW/cm2)
Total Power (W)
Test Size (L)
Falling time
(Seconds)
Expsoure time (Seconds)
Recirculated Rate (L/hr)
Number of Pass per liter per hour
Expsoure Time per hour
(Seconds)
Energry per Hour per liter
(W/L)
Length of test (hours)
Total Watt Hours/ Liter
(Whr/L)450W UV A&B 27.94 15.70 438.66 56.00 24.56 9.30 0.41 0.14 320.00 34.41 4.75 0.03 8.00 0.26
450W UV C 27.94 15.70 438.66 0.06 0.03 9.30 0.41 0.14 320.00 34.41 4.75 0.00 8.00 0.00150W UV A&B 79.30 15.70 1245.01 0.50 0.62 10.00 0.41 0.39 320.00 32.00 12.54 0.00 8.00 0.02
150W UV C 79.30 15.70 1245.01 7.21 8.98 10.00 0.41 0.39 320.00 32.00 12.54 0.03 8.00 0.25
LightArch Length
(cm)Circumference
(cm)Area (cm2)
Measured UV (mW/cm2)
Total Power (W)
test size (L)
Retension Time ( hr)
Percent Expsoure per Retentions
Time
Times recirculated per hour per liter
(1/hr)
Expsoure per Liter (1/L)
Watts per Liter (W/L)
Test (hr)Total Watt
Hours/ Liter (Whr/L)
450W UV A&B 27.94 15.70 438.66 56.00 24.56 8.60 0.03 0.34 24.42 0.27 6.63 8.00 53.08450W UV C 27.94 15.70 438.66 0.06 0.03 8.60 0.03 0.34 24.42 0.27 0.01 8.00 0.06
150W UV A&B 79.30 15.70 1245.01 0.50 0.62 9.10 0.03 0.96 23.08 0.72 0.45 8.00 3.61150W UV C 79.30 15.70 1245.01 7.21 8.98 9.10 0.03 0.96 23.08 0.72 6.50 8.00 52.02
60
The results show that the leachate in the flow through reactor receives 200 times more light energy per liter in an eight hour test when compared to the falling film reactor. However, this did not translate to greater COD removal with 25% increase in the 150-W and a 9% decrease in the 450-W. The results were similar for ammonia removal with a 10% increase in 150-W and 24% increase for the 450-W.
3.10 CATALYST RECOVERY
By visual inspection, the flocculation test took 9 minutes for all of the TiO2 to settle. This is a setting rate of 2.5-mm per minute. Decanting the water from the top caused a small current, and the TiO2 needed additional time to re-settle before further decanting could take place. The test with the 1-micron filter bag resulted in the TiO2 flowing right through it. This was expected because the TiO2 has an average size of 20-nanometers, which is 98% smaller than 1-micron. This test was not successful, but filtration with tighter pore sizes could be used as a finishing step to the treatment subject to inorganic fouling from calcium carbonate scale.

61
4. CONCLUSION
4.1 SUMMARY
If leachate were directly discharged into the environment it could have catastrophic effects on both the water and soil. The water quality parameters of main concern are the COD, ammonia, heavy metals, and TDS in the leachate. The research has shown that to this point the TiO2 advanced oxidation process cannot remove enough of the contaminants in a timely manner to reach the treatment goal of surface water discharge. However, improvements have been shown in the treatment process and with further research, it is likely that combining the photocatalytic oxidation process with the critical orifice technique, the treatment targets for on-site industrial reuse of this water can be achievable. The highest removal rates for the eight-hour tests are as follows: the 450-W lamp had the highest COD removal with both the 5-g/L falling film and 10-g/L flow through reactors removing 32% and 31%. The highest alkalinity removal with the 150-W 5-g/L falling film test at a removal of 34%. The highest alkalinity removal with the 450-W 5-g/L flow through reactor was 45% removal, however this was also the test that had the highest running temperature, which may have artificially inflated the result. The more powerful 450-W lamp does produce better removal in almost all parameters tested, with the exception of alkalinity, where it was only slightly less effective with 2% less removal then the highest removal recorded using the 150-W lamp. Since the light power that the leachate is exposed to for both the 150-W lamp and the 450-W lamp is only 1.8% different, but in different spectrums, a conclusion can be made that TiO2 produces more hydroxyl radicals with UV A and B spectrum exposure compared to UV C. The critical orifice system showed up to 70% COD removal in just 10 minutes of operation; however, the TDS and alkalinity went up simultaneously. Nevertheless, this technique could be combined with TiO2 as a pre-treatment or polishing step for heavy metal removal and further COD removal. This is the focus of the research that will take place in year 2 of the study.
4.2 RECOMMENDATIONS
For the objective of improving removal of constituents from leachate, a complete process will be tested, since removal using only a single process has yet to be successful in the pilot scale. The addition of a 1-micron filter back at the exit of the reactor may filter out any of the crystalized by-products of the reaction not allowing them to be reprocessed and reduce the effectiveness of the removal process. Furthermore, the addition of zinc dust to the filter many change the electric charge of the leachate, helping with hydroxyl radical production.
The data so far indicate that the photocatalytic oxidation process alone may not be able to reach the treatment targets for surface water discharge as specified in the objectives. One option for improving the removal efficiency of COD is to pretreat with ozone. This should increase the oxidation of organic materials in the leachate. Another option that has shown some success in previous work (Meeroff 2010) will be to pretreat with lime. This should remove the hardness and

62
change the alkalinity. With lower alkalinity, it is thought that the reduction of more organic materials will be possible, because this should theoretically reduce the hydroxyl radical scavenging by carbonates and calcium before the radicals can interact with organics or other metals. A third process option will be to pretreat with the critical orifice unit; this should create micro-bubbles that could flow directly into the photocatalytic reaction chamber, increasing the surface area for the reaction with the TiO2. This should also make the focus of the TiO2 reaction the more efficient removal of ammonia and alkalinity. Finally another option is pretreatment with a combined photelectrocatalyic approach, where a current in addition to the TiO2 will reduce the leachate. From (An, et al. 2001) the use of electrodes increased the reduction of methylene blue by 21.8% and COD by 14.1% in thirty minutes. This process is thought to reduce the recombination of the electron for the TiO2. If these same results for the reduction of COD can be expected for the entire 8-hour process, this could cause a remarkable improvement in the treatment process.

63
5. REFERENCES
Abu Amr, S. S., and Aziz, H. A.,. «New treatment of stabilized leachate by ozone/Fenton in the advanced
oxidation process.» Waste Management, 2012.
Adlan, M.N., Palaniandy, P., Aziz, H.A. «Optimization of coagulation and dissolved air flotation (DAF)
treatment of semi-aerobic landfill leachate using response surface methodology (RSM).»
Desalination 277, 2011: 74-82.
Altomare, Marco, Gian Chiarello, Annamaria Costa, Marcella Guarino, y Elena Selli. «Photocatalytic
abatement of ammonia in nitrogen-containg effluents.» Chemical Engineering Journal, 2012:
394-401.
Altomare, Marco, y Elena Selli. «Effects of metal nanoparticles depostion on photocatalytic oxidation of
ammonia in TIO2 aqueous suspension.» Catalysis Today, 2012: 127-133.
Aman, N., Mishra, T., Hait, J., Jana, R.K. «Simultaneous photoreductive removal of copper (II) and
selenium (IV) under visible light over spherical binary oxide photocatalyst.» ournal of Hazardous
Materials 186, 2011: 360-366.
American Society of Civil Engineers. Sanitary Landfill. New York: ASCE, 1959.
Amokrane, A, C Cornel, y J Veron. «Landfill leachaes pretreatment by coagulation-flocculation.» Water
Research, 1997: 2775-2782.
An, Taicheng, Guiying Li Ya Ziong, Xihai Zhu, Hengtai Xing, y Guoguang Liu. «Photeletrochemical
Degradation of Methylen Blue with Nano TiO2 Under High Potential Bias.» Mater Phys Mech,
2001: 101-106.
Anglada, A., Urtiaga, A., Ortiz, I., Mantzavinos, D., Diamadopoulos, E. «Treatment of municipal landfill
leachate by catalytic wet air oxidation: Assessment of the role of operating parameters by
factorial design.» Waste Management 31, 2011: 1833–1840.
Association of Science-Technology Center Incroporated .
http://www.astc.org/exhibitions/rotten/rthome.htm. 1998.
http://www.astc.org/exhibitions/rotten/rthome.htm.

64
Autin, O., Hart, J., Jarvis, P., MacAdam, J, Parsons, S.A., Jefferson, B. «The impact of background
organic matter and alkalinity on the degradation of the pesticide metaldehyde by two advanced
oxidation processes: UV/H2O2 and UV/TiO2.» Water Research 47, 2013: 2041-2049.
Aziz, H.A., Ling, T.J., Haque, A.A.M., Umar, M., Adlan, M.N. «Leachate treatment by swim-bed bio
fringe technology.» Desalination 276, 2011: 278–286.
Baransi, K., Dubowski, Y., Sabbah, I. «Synergetic effect between photocatalytic degradation and
adsorption processes on the removal of phenolic compounds from olive mill wastewater.» Water
Research 46, 2012: 789-798.
Bashir, M.J.K., Aziz, H.A., Yusoff, M.S., Aziz, S.Q., Mohajeri, S. «Stabilized sanitary landfill leachate
treatment using anionic resin: Treatment optimization by response surface methodology.»
Journal of Hazardous Materials 182, 2010: 115–122.
Bekbolet, M. and Araz, C.V. «Inactivation of Escherichia coli by photocatalytic oxidation.»
Chemosphere 32, 1996: 959-965.
Berrueta, Jose, y Leonor Castrillon. «Anerobic treatement of leachates in UASB reactor.» Journal of
Chemical Technology and Biotechnology , 1993: 33-37.
Birchler, D. R., Milke, M. W., Marks, A. L., Luthy, R. G. «Landfill Leachate Treatment by Evaporation.»
Journal of Environmental Engineering 120, 1994: 1109-1131.
Blandford, L.K. St. Lucie's new way of getting rid of leachate costs less, is environmentally friendly. 18
de November de 2011. <http://www.tcpalm.com/news/2011/oct/18/st-lucies-new-way-of-getting-
rid-of-leachate-is> (último acceso: 21 de December de 2014).
Bouhezila, F., Hariti, M., Lounici, H., Mameri, N. «Treatment of the OUED SMAR town landfill leachate
by an electrochemical reactor.» Desalination 280(1), 2011: 347–353.
Brown, L.S., Holme, T.A. Chemistry for Engineering Students. Belmont: Brooks/Cole, 2011.
Carneiro, J.T., Moulijn, J.A., Mul, G. «Photocatalytic oxidation of cyclohexane by titanium dioxide:
Catalyst deactivation and regeneration.» Journal of Catalysis 273, 2010: 199-210.
Chemlal, R., Abdi, N., Drouiche, N., Lounici, H., Pauss, A., Mameri, N. «Rehabilitation of Oued Smar
landfill into a recreation park: Treatment of the contaminated waters.» Ecological Engineering
51, 2013: 244-248.
65
Cho, S.P., Hong, S.C., Hong, S.-I. «Study of the end point of photocatalytic degradation of landfill
leachate containing refractory matter.» Chemical Engineering Journal 98, 2004: 245-253.
Chong, M.N., Jin, B., Chow, C.W.K., Saint, C. «Recent developments in photocatalytic water treatment
technology: A review.» Water Research 44, 2010: 2997-3027.
Chugh, S, W Clarke , P Pullammanappallil, y V Rudolph. «Effects of recirculated leachate volume on
MSW degradation.» Waste Management & Research (Waste Management & Research ), 1998:
564-573.
Deng, Y., and Ezyske, C. M. «Sulfate radical-advanced oxidation process (SR-AOP) for simultaneous
removal of refractory organic contaminants and ammonia in landfill leachate.» Water Research
45, 2011: 6189-6194.
Dincer, A.R., Karakaya, N., Gunes, E., Gunes, Y. «Removal of COD from oil recovery industry
wastewater by the advanced oxidation processes (AOP) based on H2O2.» Global NEST Journal
10(1), 2008: 31-38.
Dutta, P.K., Ray, A.K., Sharma, V.K., Millero, F.J. «Adsorption of arsenate and arsenite on titanium
dioxide suspensions.» Journal of Colloid and Interface Science 278, 2004: 270-275.
Environmental Protection Agency . National Recommended Water Quality Criteria. EPA, 2012.
Environmental Protection Agency. Ambient Water Quality Criteria For Ammonia. USEPA, 1985.
Environmental Protection Agency. Secondary Drinking Water Regulations: Guidance for Nuisance
Chemicals. EPA, 2012.
Evonik Industries. «Safety Data Sheet: Aeroxide® TiO2 P 25 Version 3.8.» 2008.
Faure, B., Lindelov, J.S., Wahlberg, M., Adkins, N., Jackson, P., Bergstrom, L. «Spray drying of TiO2
nanoparticles into redispersible granules.» Powder Technology 203, 2010: 384-388.
Frank, S.N. and Bard, A.J. « Heterogeneous Photocatalytic Oxidation of Cyanide Ion in Aqueous
Solutions at TiO2 Powder.» Journal of the American Chemical Society 99:1, 1977: 303-304.
Gandhi, V.G., Mishra, M.K., Joshi, P.A. «A study on deactivation and regeneration of titanium dioxide
during photocatalytic degradation of phthalic acid.» Journal of Industrial and Engineering
Chemistry 18, 2012: 1902-1907.

66
Gernjak, W., Maldonado, M.I., Malato, S., Caceres, J., Krutzler, T., Glaser, A., Bauer, R. «Pilot-plant
treatment of olive mill wastewater (OMW) by solar TiO2 photocatalysis and solar photo-Fenton.»
2004, Solar Energy 77: 567-572.
Ghaly, M.Y., Jamil, T.S., El-Seesy, I.E., Souaya, E.R., Nasr, R.A. «Treatment of highly polluted paper
mill wastewater by solar photocatalytic oxidation with synthesized nano TiO2.» Chemical
Engineering Journal 168, 2011: 446-454.
Gorska, P., Zaleska, A., Hupka, J. «Photodegradation of phenol by UV/TiO2 and Vis/N,C-TiO2 processes:
Comparative mechanistic and kinetic studies.» Separation and Purification Technology 68, 2009:
90-96.
Grabowska, E., Reszczynska, J., Zaleska, A. «Mechanism of phenol photodegradation in the presence of
pure and modified-TiO2: A review.» Water Research 46, 2012: 5453-5471.
Hapeshi, E. Achilleos, A., Vasquez, M.I., Michael, C., Xekoukoulotakis, N.P., Mantzavinos, D.,
Kassinos, D. «Drugs degrading photocatalytically: Kinetics and mechanisms of ofloxacin and
atenolol removal on titania suspensions.» Water Research 44, 2010: 1737-1746.
Hazime, R., Nguyen, Q.H., Ferronato, C., Huynh, T.K.X., Jaber, F., Chovelon, J.M. «Optimization of
imazalil removal in the system UV/TiO2/K2S2O8 using a response surface methodology (RSM).»
Applied Catalysis B: Environmental 132-133, 2013: 519-526.
Helali, S., Dappozze, F., Horishoki, S., Bui, T.H., Perol, N., Guillard, C. «Kinetics of the photocatalytic
degradation of methylamine: Influence of pH and of UV-A/UV-B radiant fluxes.» Journal of
Photochemistry and Photobiology A, 2013.
Hickman, Lanier. American Alchemy: The History of Solid Waste Managment in the United States.
ForesterPress, 2003.
Holmes, F.R. «The performance of a reactor using photocatalysis to degrade a mixture of organic
contaminants in aqueous solution.» Thesis, Gainesville, FL., 2003.
Hong, X., Wang, Z., Cai, W., Lu, F., Zhang, J., Yang, Y., Ma, N., Liu, Y. «Visible-Light-Activated
Nanoparticle Photocatalyst of Iodine-Doped Titanium Dioxide.» Chemistry of Materials 17,
2005: 1548-1552.
Iaconi, C . D., Pagano, M., Ramadori, R., Lopez, A. «Nitrogen recovery from a stabilized municipal
landfill leachate.» Bioresource Technology 101, 2010: 1732–1736.

67
Jackson, John. «A Histroy of Trash.» Alternatives, 2006.
Jegadeesan, G., Al-Abed, S.R., Sundaram, V., Choi, H., Scheckel, K.G., Dionysiou, D.D. «Arsenic
sorption on TiO2 nanoparticles: Size and crystallinity effects.» Water Research 44, 2010: 965-
973.
Jia, C., Wang, Y., Zhang, C., Qin, Q. «UV-TiO2 Photocatalytic Degradation of Landfill Leachate.» Water
Air Soil Pollution 217, 2011: 375–385.
Jia, C., Zhu, J., Qin, Q. Variation Characteristics of Different Fractions of Dissolved Organic Matter in
Landfill Leachate during UV-TiO2 Photocatalytic Degradation. Third International Conference
on Intelligent System Design and Engineering Applications, 2013.
Kebir, M., Chabani, M., Nasrallah, N., Bensmaili, A., Trari, M. «Coupling adsorption with photocatalysis
process for the Cr(VI) removal.» Desalination 270, 2011: 166-173.
Kima, D., Ryua, H., Kim, M., Kima, J., Lee, S. «Enhancing struvite precipitation potential for ammonia
nitrogen removal in municipal landfill leachate.» Journal of Hazardous Materials 146, 2007: 81–
85.
Kishimoto, N., Yasuda, Y., Mitzutani, H., Ono, Y. «Applicability of Ozonation Combined with
Electrolysis to 1,4-Dioxane Removal from Wastewater Containing Radical Scavengers.» Ozone:
Science and Engineering 29, 2007: 13-22.
Kominami, H., Nishimune, H., Ohta, Y., Arakawa, Y., Inaba, T. «Photocatalytic hydrogen formation
from ammonia and methyl amine in an aqueous suspension of metal-loaded titanium(IV) oxide
particles.» Applied Catalysts B: Environmental 111-112, 2012: 297-302.
Kosmulski, M., Prochniak, P., Rosenholm, J.B. «Electrokinetic study of adsorption of ionic surfactants on
titania from organic solvents.» Colloids and Surfaces A: Physicochemical and Engineering
Aspects 348, 2009: 298-300.
Kurniawan, T.A. and Lo, W. «Removal of refractory compounds from stabilized landfill leachate using
an integrated H2O2 oxidation and granular activated carbon (GAC) adsorption treatment.» Water
Research 43, 2009: 4079–4091.
Kwon, B.G., Ryu, S., Yoon, J. «Determination of hydroxyl radical rate constants in a continuous flow
system using competition kinetics.» Journal of Industrial and Engineering chemistry 15, 2009:
809-812.

68
Li, H., Zhoua, S., Sun, Y., Feng, P., Li, J. «dvanced treatment of landfill leachate by a new combination
process in a full-scale plant.» Journal of Hazardous Materials 172, 2009: 408–415.
Liu, C., Yang, Y., Wang, Q., Kim, M., Zhu, Q., Li, D., Zhang, Z. «Photocatalytic degradation of waste
activated sludge using a circulating bed photocatalytic reactor for improving biohydrogen
production.» Bioresource Technology 125, 2012: 30-36.
Ma, C.M., Lee, Y.W., Hong, G.B., Su, T.L., Shie, J.L., Chang, C.T. «Effect of platinum on the
photocatalytic degradation of chlorinated organic compound.» ournal of Environmental Sciences
23(4), 2011: 687-692.
Mahmud, K., Hossain, Md. D., Shams, S. «Different treatment strategies for highly polluted landfill
leachate in developing countries.» Waste Management, 2011.
Mandal, T., Maity, S., Dasgupta, D., Datta, S. «Advanced oxidation process and biotreatment: Their roles
in combined industrial wastewater treatment.» Desalination 250, 2010: 87 – 94.
Marugan, J., van Grieken, R., Pablos, C., Satuf, M.L., Cassano, A.E., Alfano, O.M. «Modeling of a
bench-scale photocatalytic reactor for water disinfection from laboratory-scale kinetic data.»
Chemical Engineering Journal, s.f.
Meeroff. Energized Processes for Onsite Treatment of Leachate. Gainesville, FL: Hinkley Center for
Solid and Hazardous Waste Management, 2010.
Meeroff, D.E. and McBarnette, A. Energized Processes for Onsite Treatment of Leachate, Year Two.
Gainesville, FL: William W. “Bill” Hinkley Center for Solid and Hazardous Waste Management,
2011.
Meeroff, D.E. and Teegavarapu, R. Interactive Decision Support Tool For Leachate Management.
Gainesville, FL: William W. “Bill” Hinkley Center for Solid and Hazardous Waste Management,
2010.
Meeroff, D.E., Bloetscher, F., Reddy, D.V., Gasnier, F., Jain, S., McBarnette, A., Hamaguchi, H.
«Application of photochemical technologies for treatment of landfill leachate.» Journal of
Hazardous Materials 209-210, 2012: 299-307.
Meeroff, D.E., Gasnier, F., Tsai, C.T. Investigation Of Energized Options For Leachate Management:
Year Two Tests of Advanced Oxidation Processes for Treatment of Landfill Leachate.

69
Gainesville, FL: William W. “Bill” Hinkley Center for Solid and Hazardous Waste Management,
2008.
Mehrjouei, M., Muller, S., Moller, D. «Removal of fuel oxygenates from water using advanced oxidation
technologies by means of falling film reactor.» Chemical Engineering Journal 211-212, 2012:
353-359.
Mohajeri, S., Aziz, H.A., Isa, M.H., Zaheda, M.A., Adlana, M.N. «Statistical optimization of process
parameters for landfill leachate treatment using electro-Fenton technique.» Journal of Hazardous
Materials 176, 2010: 749–758.
Naumczyk, J., Prokurat, I., Marcinowski, P. «Landfill Leachates Treatment by H2O2/UV, O3/H2O2,
Modified Fenton, and Modified Photo-Fenton Methods.» International Journal of Photoenergy
Volume 2012, 2012: Article ID 909157.
Ohtani, B, O Prieto-Mahaney, D Li, y R Abe. «What is Degussa P25? Crystalline composition analysis,
construction from isolated pure particles and photocatalystic activity test.» Photochemistyr and
Photobiology A; Chemistyr , 2010: 179-182.
Pan, L., Zou, J.J., Wang, S., Huang, Z.F., Zhang, X., Wang, L. «Enhancement of visible-light-induced
photodegradation over hierarchical porous TiO2 by nonmetal doping and water-mediated dye
sensitization.» Applied Surface Science 268, 2013: 252-258.
Pelaez, M., Nolan, N.T., Pillai, S.C., Seery, M.K., Falaras, P., Kontos, A.G., Dunlop, P.S.M., Hamilton,
J.W.J., Byrne, J.A., O’Shea, K., Entezari, M.H, Dionysiou, D.D. «A review on the visible light
active titanium dioxide photocatalysts for environmental applications.» Applied Catalysts B:
Environmental 125, 2012: 331-349.
Poblete, R., Prieto-Rodríguez, L., Oller, I., Maldonado, M.I., Malato, S., Otal, E., Vilches, L.F.,
Fernández-Pereira, C. «Solar photocatalytic treatment of landfill leachate using a solid mineral
by-product as a catalyst.» Chemosphere 88(9), 2012: 1090–1096.
Renou, S, J.G. Givaudan, S Poulain, F Dirassouyan, y P Moulin. «Landfill Leachate Treatment: Review
and opportunity.» Hazardous Materialq, 2007.
Renou, S., Givaudan, J.G., Poulain, S., Dirassouyan, F., Moulin, P. «Landfill leachate treatment: Review
and opportunity.» Journal of Hazardous Materials 150, 2008: 468–493.
70
Rocha, Elisangela, Citor Vilar, Amelia Fonseca, Isabel Saraiva, y Rui Boiaventura. «Landfill leachate
treatment by solar-driven AOPs.» Solar Energy, 2011: 46-56.
Salem, Z., Hamouri, K., Djemaa, R., Allia, K. «Evaluation of landfill leachate pollution and treatment.»
Desalination 220, 2008: 108–114.
Sangchay, W., Sikong, L., Kooptarnond, K. «Comparison of photocatalytic reaction of commercial P25
and synthetic TiO2-AgCl nanoparticles.» Procedia Engineering 32, 2012: 590-596.
Sanphoti, N., Towprayoon, S., Chaiprasert, P., Nopharatana, A. «The effects of leachate recirculation
with supplemental water addition on methane production and waste decomposition in a simulated
tropical landfill.» Journal of Environmental Management 81, 2006: 27–35.
Selvam, K., Muruganandham, M., Sobana, N., Swaminathan, M. «Enhancement of UV-assisted photo-
Fenton degradation of reactive orange 4 using TiO2-P25 nanoparticles.» Separation and
Purfication Technology 54, 2001: 241-247.
Shephard, G.S., Stockenstrom, S., de Villiers, D., Engelbrecht, W.J., Wessels, G.F.S. «Degradation of
microcystin toxins in a falling film photocatalytic reactor with immobilized titanium dioxide
catalyst.» Water Research 36, 2002: 140-146.
Statom, R.A, G.D. Thyne, y J.E. McCray. «Temperal Changes in leachate chemistry of municipal solid
waste landfill cell in Floirda, USA.» Environmental Geology , 2004: 982-991.
Tamrat, M., Costa, C., Márquez, M.C. «Biological treatment of leachate from solid wastes: Kinetic study
and simulation.» Biochemical Engineering Journal 66, 2012: 46– 51.
Teh, C.M. and Mohamed, A.R. «Roles of titanium dioxide and ion-doped titanium dioxide on
photocatalytic degradation of organic pollutants (phenolic compounds and dyes) in aqueous
solutions: A review.» Journal of Alloys and Compounds 509, 2011: 1648-1660.
uxton, G.V., Greenstock, C.L, Helman, W. P., Ross, A.B. «Critical Review of Rate Constants for
Reactions of Hydrated Electrons, Hydrogen Atoms and Hydroxyl Radicals (·OH/·O-) in Aqueous
Solution.» ournal of Physical and Chemical Reference Data 17 issue 2, 1988: 513-534.
Valencia, S., Catano, F., Rios, L., Restrepo, G., Marin, J. « A new kinetic model for heterogeneous
photocatalysis with titanium dioxide: Case of non-specific adsorption considering back reaction.»
Applied Catalysis B: Environmental 104, 2011: 300-304.

71
Vedrenne, M., Vasquez-Medrano, R., Prato-Garcia, D., Frontana-Uribe, B., Ibanez, J.G.
«Characterization and detoxification of a mature landfill leachate using a combined coagulation–
flocculation/photo Fenton treatment.» Journal of Hazardous Materials 205-206, 2012: 208-215.
Vilar, V. J.P., Rocha, E. M.R., Mota, F. S., Fonseca, A., Saraiva, I., Boaventura, R. A.R. «Treatment of a
sanitary landfill leachate using combined solar photo-Fenton and biological immobilized biomass
reactor at a pilot scale.» Water Research 45, 2011: 2647-2658.
Wang, J.L. and Xu, L.J. «Advanced Oxidation Processes for Wastewater Treatment: Formation of
Hydroxyl Radical and Application.» Critical Reviews in Environmental Science and Technology
42:3, 2012: 251-325.
Wang, Q., Chen, X., Yu, K., Zhang, Y., Cong, Y. «Synergistic photosensitized removal of Cr(VI) and
Rhodamine B dye on amorphous TiO2 under visible light irradiation.» Journal of Hazardous
Materials 246-247, 2013: 135-144.
Wenjen, L., Di, W., Xin, S., Lixiong, W., Lei, S. «Removal of Organic Matter and Ammonia Nitrogen in
Azodicarbonamide Wastewater by a Combination of Power Ultrasound Radiation and Hydrogen
Peroxide.» Chinese Journal of Chemical Engineering 20(4), 2012: 754-759.
Xing, W., Lu, W., Zhao, Y., Deng, W., Christensen, T. H. «Environmental impact assessment of leachate
recirculation in landfill of municipal solid waste by comparing with evaporation and discharge
(EASEWASTE).» Waste Management, s.f.
Yahiat, S., Fourcade, F., Brosillon, S., Amrane, A. «Photocatalysis as a pre-treatment prior to a biological
degradation of cyproconazole.» Desalination 281, 2011: 61-67.
Zhang, H., Wu, X., Li, X. «Oxidation and coagulation removal of COD from landfill leachate by Fered–
Fenton process.» Chemical Engineering Journal 210, 2012: 188-194.
Zhao, J., Yang, X. «Photocatalytic oxidation for indoor air purification: a literature review.» Building and
Environment 38, 2003: 645-654.
Zhao, R., Huang, T., McGuire, M. «From a Literature Review to an Alternative Treatment System for
Landfill Gas and Leachate.» Challenges 3, 2012: 278-289.
Zhao, X., Qu, J., Liu, H., Wang, C., Xiao, S., Liu, R., Liu, P., Lan, H., Hu, C. «Photoelectrochemical
treatment of landfill leachate in a continuous flow reactor.» Bioresource Technology 101, 2010:
865–869.