rom j morphol embryol 2015, 56(4):1309–1317 r j m … · our study aimed to investigate the...
TRANSCRIPT
Rom J Morphol Embryol 2015, 56(4):1309–1317
ISSN (print) 1220–0522 ISSN (on-line) 2066–8279
OORRIIGGIINNAALL PPAAPPEERR
Morphological changes in membranoproliferative glomerulonephritis – a quantitative approach
LOREDANA-ADRIANA TURICEANU1), ELENA-ROXANA AVĂDĂNEI1), SIMONA ELIZA GIUŞCĂ1), MINELA AIDA MĂRĂNDUCĂ1), CORNELIA AMĂLINEI1), ADRIAN CONSTANTIN COVIC2,3), ANDREI TIMOFTE1), IRINA-DRAGA CĂRUNTU1,4)
1)Department of Morphofunctional Sciences, “Grigore T. Popa” University of Medicine and Pharmacy, Iassy, Romania 2)Department of Internal Medicine, “Grigore T. Popa” University of Medicine and Pharmacy, Iassy, Romania 3)Clinic of Nephrology, Dialysis and Renal Transplant, “Dr. Constantin I. Parhon” University Hospital, Iassy, Romania 4)Department of Pathology, “Dr. Constantin I. Parhon” University Hospital, Iassy, Romania
Abstract Our study aimed to investigate the quantitative profile of the renal corpuscle components in membranoproliferative glomerulinephritis (MPGN). We have analyzed digital color images corresponding to relevant microscopic fields from renal biopsies (10 cases type I MPGN and 10 cases type II MPGN). A computerized morphometric algorithm was designed and applied in both red-green-blue (RGB) and hue-lightness-saturation (HLS) color spaces, allowing the automated measurement of areas for the following morphological characteristics of the renal corpuscles (RCs): glomerulus, Bowman space, cells, mesangial matrix and glomerular basement membranes, and capillaries. Student’s t-test comparatively applied between the numerical data obtained for the measured morphological characteristics, for each individual color space, showed significant differences between type I MPGN and type II MPGN for Bowman space area (p=0.006) and for mesangial matrix and glomerular basement membranes area – exclusively in RGB color space (p=0.013). We have also demonstrated larger RCs and glomerular size in type II MPGN, comparative to those in type I MPGN. Consequently, we assume that the morphometrical characterization of RCs histological components could be used as an additional criterion not only in the diagnosis of MPGNs, but also in the stratification of evolution and prognosis of patients diagnosed with type I and II MNGN, respectively.
Keywords: membranoproliferative glomerulonephritis, renal corpuscle, histological components, digital images, computerized morphometry.
Introduction
In spite of progresses made by biomedical sciences in the last decades, the triggers that initiate the pathogenic mechanism of the most glomerular diseases are still unknown [1]. Strictly related to membranoproliferative glomerulonephritis (MPGN), two new findings contributed to a better understanding of its pathogenicity, specifically that of crucial role of the hepatitis C virus and the com-prehensive view on the biologic influence of complement system dysregulation [1], and underpinned a novel classi-fication of this clinicomorphological glomerular entity [2]. The treatment decision-making is dependent on the knowledge of the glomerular disease pathobiology [1], reflected by the lesions spectrum identified in kidney biopsy as well as of correlated clinical and biological data. Although kidney biopsy is considered the gold standard of renal diseases diagnosis [3], the results are mainly qualitative interpretations with low reproducibility due to sampling, measurement, and interpretation errors. Considering these circumstances, the establishment of therapeutic guidelines is a very difficult and frustrating process for the nephrologists, since it is time and resource consuming.
Morphometry techniques offer the quantitative support for the qualitative interpretation of kidney biopsies, by the introduction of quantifiable features (descriptors) and therefore aim to transform a qualitative (subjective)
investigation into a quantitative (more objective) one [4–6]. Beyond diagnosis accuracy, morphometry has opened new possibilities of important characteristics’ description related to early pathogenic events and disease progression. Although nearly 50 years have passed from the first published data, the method is still not very popular among renal pathologist, and the number of publications addressing this sensitive topic is smaller as compared to other specific nephrology research themes. However, we cannot take into account the contribution of morphome-trical characterization (by classical, manual methods) of normal renal corpuscles (RCs), in light and electron microscopy [7–9]. Moreover, the following studies based on the implementation of the modern methods supported by assisted-image analysis and computerized morphometry [10] created the possibilities for the development of this research direction, with multiple clinicomorphological valences, already initiated by classical, manual morpho-metry techniques.
Consequently, computerized morphometry became a preferential option [11, 12] in demonstration of the direct relationship between morphological substrate of glomerular lesions, evolution, and prognosis. Concrete proofs towards this research direction have been provided by several research papers in mainstream publications which approach by the means of quantitative analysis diagnosis, evolution and/or treatment response in variable types of glomerulo-nephritis, such as: minimal change disease [13–16], mem-
R J M ERomanian Journal of
Morphology & Embryologyhttp://www.rjme.ro/
Loredana-Adriana Turiceanu et al.
1310
branous [17–21], with IgA deposits [22, 23], membrano-proliferative [15, 16, 24, 25], extracapillary [26], and with thin membrane/thin membrane syndrome associated to benign familial hematuria [27–32]. A special attention has been paid to the morphological investigation in focal and segmental glomerulosclerosis, both in children [13–16, 33] and adults [34–37], and also in lupus nephritis [38] and renal transplant pathology [39–43]. Quantitative changes of RCs have been reported in numerous experimental studies [44–46]. Another research category is oriented toward inter-stitial changes associated to glomerulonephritis [47–51].
Within this context, the aim of our study has been a computerized morphometrical evaluation of MPGN specific histological features. We have focused on numerical information that is able to characterize the differences between type I and II MPGN particular lesions, which subsequently might be used as outcome predictors. To increase the possibility for automatic identification of these differences, our morphometrical approach operates in two color spaces [52], namely RGB (red-green-blue) and HLS (hue-lightness-saturation), strategy expecting that at least one of the two spaces could reveal the differences.
Materials and Methods
Specimens and digital images
The study group included 20 renal biopsies diagnosed by microscopy and immunofluorescence as primary type I MPGN (10 cases) and type II MPGN – dense deposit disease (10 cases). The analyzed renal biopsy specimens had a medium count of 18 RCs.
The digital color images corresponding to the relevant microscopic lesions on bioptic fragments stained with light green trichrome staining were acquired by image-analysis system available on Zeiss microscope, in both RGB and HLS color spaces.
Computerized morphometric algorithm – design and utilization
The quantitative analysis methodology consisted in the development of our previous technique proposed in
[53] for computerized morphometry of renal biopsies in Zeiss KS400 environment. This automated technique, based on trichromic specific color differences, allowed a parallel analysis of digital images in RGB and HLS color spaces.
The computerized quantitative analysis has been based on a MPGN dedicated algorithm (detailed in Table 1) applicable in both RGB and HLS color spaces. The algorithm (operating in either RGB or HLS) automatically identifies the regions and measures the areas for the following morphological entities of interest of the RC: glomerulus, Bowman space, cells, mesangial matrix and glomerular basement membranes, and capillaries.
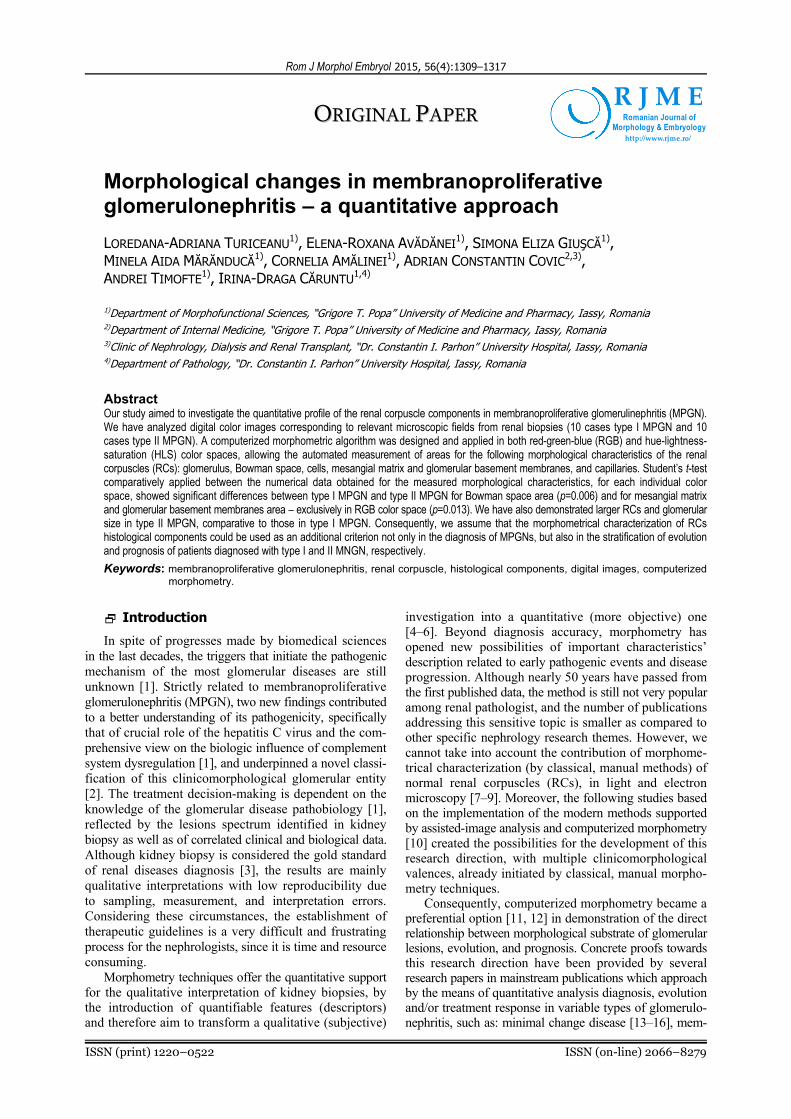
The quantitative analysis performed for an arbitrary RC (e.g., RC in Figure 1), in the RGB and HLS color spaces, resulted in two sets of binary images (illustrated in Figures 2–6) for measurements application and two sets of numerical results. Finally, for all the above-mentioned characteristics, a mean value/case has been calculated in RGB and HLS space, respectively.
The exploitation of the algorithm requires a preparatory stage for defining the working chromatic domains (sepa-rately for RGB and HLS spaces, respectively) for each component of the corpuscle, in accordance with the patho-logist experience and specific color tints of investigated specimens, as follows:
▪ for Bowman space and glomerular capillaries (except intraluminal red blood cells): BS&C_RGB, BS&C_HLS;
▪ for nuclei: N_RGB, N_HLS; ▪ for mesangial matrix and glomerular basement mem-
branes: MBM_RGB, MBM_HLS. The algorithm, operating in RGB and, separately, in
HLS, has been applied to 10 RCs for each specimen (corresponding to a case). The same number of RCs was investigated for each studied case, in order to ensure the uniformity of the approach. The number 10 was decided in accordance with the values considered by practice guide-lines for the renal biopsy as defining a representative sample [54].
Student’s t-test was applied for all statistical compa-risons.
Table 1 – The main steps of the algorithm applied for the computerized analysis, in RGB and HLS color spaces
Sequence Tasks Complementary explanatory note
Step 1 Initialization and delimitation of renal corpuscle contour
▪ images load; ▪ manual drawing of RC contour.
Step 2 Set chromatic domains requested by segmentation procedures
▪ load of the working chromatic domains defined for each component of the corpuscle (see preparatory stage):
– BS&C_RGB = [200,255] × [190,255] × [190,255]; – BS&C_HLS = ([0,43] [200,255]) × [200,255] × [0,255]; – N_RGB = [0,130] × [0,15] × [0,15]; – N_HLS = ([0,7] [249,255]) × [0,128] × ({0} [153,255]); – MBM_RGB = [50,185] × [50, 180] × [50,180]; – MBM_HLS = [17,142] × [0,179] × [0,179].
Step 3 Color segmentation ▪ construction of binary images from identification of appropriately colored regions.
Step 4 Binary images processing ▪ removal of false information (accidentally resulting from segmentation).
Step 5 Measurements
▪ renal corpuscle area (RC_A); ▪ Bowman space area (BS_A); ▪ glomerulus area (G_A); ▪ total nuclei area (N_A); ▪ total mesangial matrix and glomerular basement membranes area (MBM_A); ▪ total capillaries area (C_A); ▪ residual (red blood cells) area (R_A).
Step 6 Calculations ▪ relative areas (percentages) reported to RC_A: G_A/RC_A and BS_A/RC_A; ▪ relative areas (percentages) reported to G_A: N_A/G_A, MBM_A/G_A, C_A/G_A,
R_A/C_A.
Morphological changes in membranoproliferative glomerulonephritis – a quantitative approach
1311
Figure 1 – MPGN type I: color image used as example.
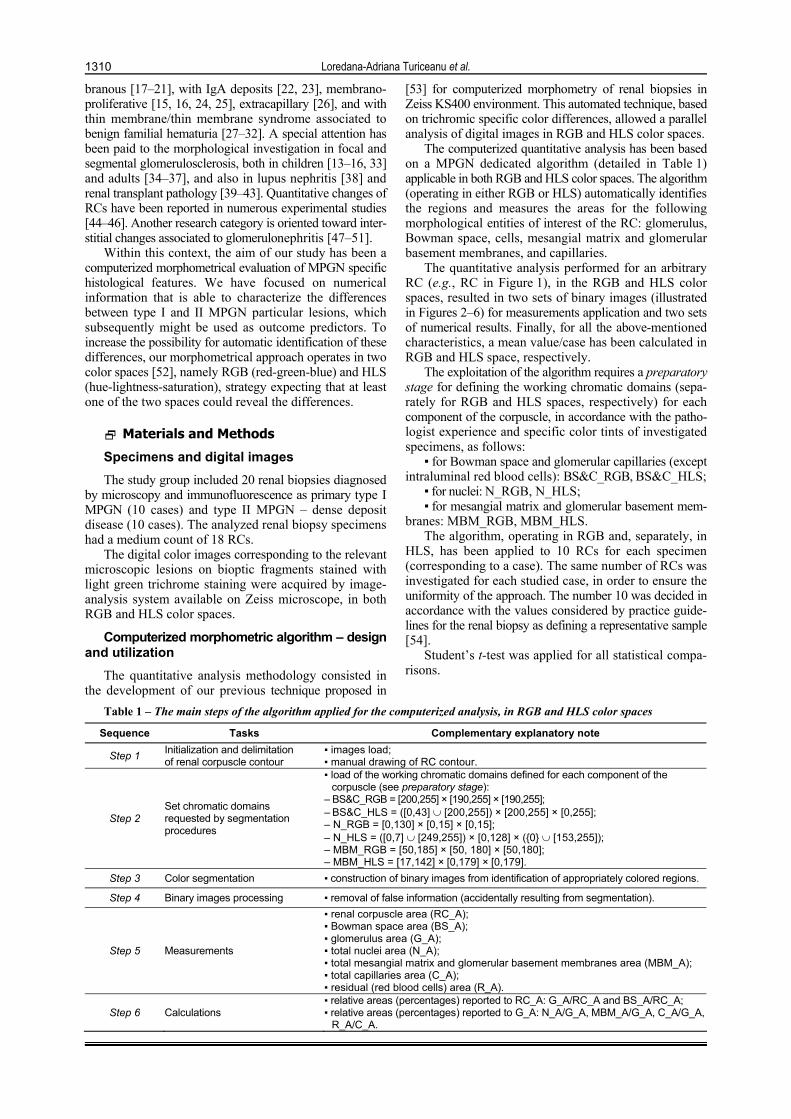
Figure 2 – Binary images corresponding to Bowman space and to glomerular capillaries: (a) RGB; (b) HLS.
Figure 3 – Binary image representing Bowman space.
Figure 4 – Binary images corresponding to nuclei: (a) RGB; (b) HLS.

Loredana-Adriana Turiceanu et al.
1312
Figure 5 – Binary images representing the mesangial matrix and glomerular basement membranes: (a) RGB; (b) HLS.
Figure 6 – Binary images representing glomerular capillaries: (a) RGB; (b) HLS.
Validation of computerized morphometric algorithm
Three types of tests (in accordance with our previous experience reported in [54]) were considered for the accuracy evaluation of the results provided by the algorithm. Each type of test implements a criterion for checking the robustness of the algorithm with respect to the uncertain/uncontrolled actions that may affect the development of the procedure. All the three types of tests were meant to use the same digital image (e.g., Figure 1 in our approach), so that three types of errors can be created (relative to the same morphologic information) and subsequently three different quantification modalities become available for the algorithm robustness. It is worth
noticing that equations (1)–(3) used below for the expla-nation of the tests have a generic form, as being applicable to all concrete entities of a studied RC.
Tests of type (1) – comparisons of the measu-rement results obtained for the interest entities by automated versus manually selection
We have manually drawn the contours of the interest entities inside an RC digital image (e.g., nuclear contours in Figure 7 in our approach), and we have measured the total area. The obtained numerical results have been compared with data obtained by automatic identification of the interest entities via the algorithm. The differences have been evaluated by means of the relative errors calculated by equation (1).
)_(
|)_()_(|)_(
sticcharacterimorphvalue
sticcharacterimorphvaluesticcharacterimorphvaluesticcharacterimorpher
manual
manualautomated (1)
Tests of type (2) – perturbations of the working chromatic domains allocated to the interest entities
We have repeated the algorithm for the interest entities inside an RC digital image (e.g., mesangial matrix and glomerular basement membranes) after having applied changes (with the role of perturbations) to the chromatic
domains considered during the preparatory stage and we have measured the corresponding area. The obtained numerical data have been compared to the information resulting from the algorithm run with the initial chromatic domains. The differences have been evaluated by the relative errors calculated by equation (2).
)_(
|)_()_(|)_(
sticcharacterimorphvalue
sticcharacterimorphvaluesticcharacterimorphvaluesticcharacterimorpher
perturbed
perturbedautomated (2)
Tests of type (3) – comparisons of the measure-ments results obtained by the use of the two different color spaces
By running the algorithm in both RGB and HLS
color spaces, such a test allowed numerical comparisons of the measurement values obtained for each interest entity inside an RC digital image. The differences have been evaluated by relative errors calculated by equation

Morphological changes in membranoproliferative glomerulonephritis – a quantitative approach
1313
(3). The denominator of the above-mentioned formula refers to the minimum feature value, so that the relative error is maximized, and the worst case is considered in
interpreting the differences between the measurements performed in RGB and HLS color spaces, respectively.
)_(),_(min
|)_()_(|)_(
sticcharacterimorphvaluesticcharacterimorphvalue
sticcharacterimorphvaluesticcharacterimorphvaluesticcharacterimorpher
HLSRGB
HLSRGB (3)
Results
Algorithm robustness analysis – tests out-comes
The three types of tests previously defined in “Materials and Methods” section were performed on the RC image in Figure 1. The results reproduced below were selected from a much larger set of experimental tests, as offering relevant illustrations for the intended robustness analysis.
Tests of type (1)
Tests of type (1) were applied for nuclear areas
determined by manual drawing of 96 contours, as shown by Figure 7, resulting in the binary imagine in Figure 8; comparisons were made by using the nuclei automatically identified via the algorithm running in the RGB and HLS color spaces. The obtained area values were the following: 9851 μm2 for manual contours, 9279 μm2 for RGB- and 10225 μm2 for HLS-operating algorithm. The relative errors given by equation (1) were of 5.8% and 3.8%, respectively, demonstrating a high precision of the algo-rithm operating in both RGB and HLS spaces, relative to the manual delineation (once the working chromatic domains are well defined).
Figure 7 – Manual contours draw around the nuclei. Figure 8 – Binary image corresponding to the manual drawn contours.
Tests of type (2)
Tests of type (2) were applied for the total area of mesangial matrix and glomerular basement membranes measured on the digitized image (Figure 1), by the perturbation of the R component of the RGB- and H component of the HLS-working chromatic domain.
In RGB color space, the working value of the R component (i.e., 185, in Table 1) was perturbed by ±5 units, meaning an error of %9.3
256
180190
for the R
coordinate; the resulting areas ranged between 8499 μm2 (for value 180) and 9236 μm2 (for value 190). Conse-quently, the relative error given by equation (2) has been %9.7
9236
84999236
for the total area of mesangial
matrix and glomerular basement membranes. In HLS color space, the working value of H component
(i.e., 17, in Table 1) was perturbed by ±5 units, meaning an error of %0.3
360
1728
for the H coordinate; the resul-
ting areas ranged between 8798 μm2 (for value 17) and 5014 μm2 (for value 28). The relative error given by equation (2) has been %9.7
9236
84999236
for the total area
of mesangial matrix and glomerular basement membranes. Subsequently, the relative error given by equation (2) has
been %438798
50148798
for the total area of mesangial
matrix and glomerular basement membranes. This type of tests recommends the RGB utilization
of the algorithm as more robust than HLS, applied to the peculiar chromaticity of trichrome staining used for the renal biopsy assessment. Nevertheless, we have to mention that the HLS version of algorithm returns trustable area values for a carefully selected chromatic domain, because a 5 unit perturbation of the H coordinate means a inattentive approach to the preliminary stage.
Tests of type (3)
Tests of type (3) were applied for nuclei area (resulting a relative error of 2.1%), mesangial matrix and glomerular basement membranes area (resulting a relative error of 1.4%), and capillaries area (resulting a relative error of 9.6%). Such a test provides accurate numerical information characterizing the comparisons that can be roughly made by the visualization of the binary images (available from Step 4 of algorithm in Table 1), as illustrated by Figures 4a, 5a and 6a (RGB applied algorithm) versus Figures 4b, 5b and 6b (HLS applied algorithm).
Study group analysis – qualitative characte-ristics
Ten cases diagnosed as type I MPGN had RCs
Loredana-Adriana Turiceanu et al.
1314
characterized by high hypercellularity due to an increase of mesangial cells number, increased amount of mesangial matrix and evident lobulation. Glomerular basement membranes had a typical double contour or rail tram appearance. Special staining allowed the identification of subendothelial deposits and immunofluorescence revealed a positive granular anti-C3 reaction and an interrupted linear pattern of anti-IgG and anti-IgM reaction.
Ten cases diagnosed as type II MPGN – dense deposit disease maintained in RCs a hypercellular appearance, mesangial cellular and matrix proliferation having though a moderate intensity. The relevant feature has been repre-sented by a homogenous, diffuse, intensely chromophile thickening of the glomerular basement membranes. Isolated areas, exhibiting less evident double contour glomerular basement membranes, have been noticed. Lobular RCs characteristic have been also present. Special staining confirmed the intramembraneous depositions. Anti-C3
positive immunofluorescence had a scattered pattern along the capillary walls and anti-IgG and anti-IgM exhibited negative reaction.
Study group analysis – quantitative characte-ristics
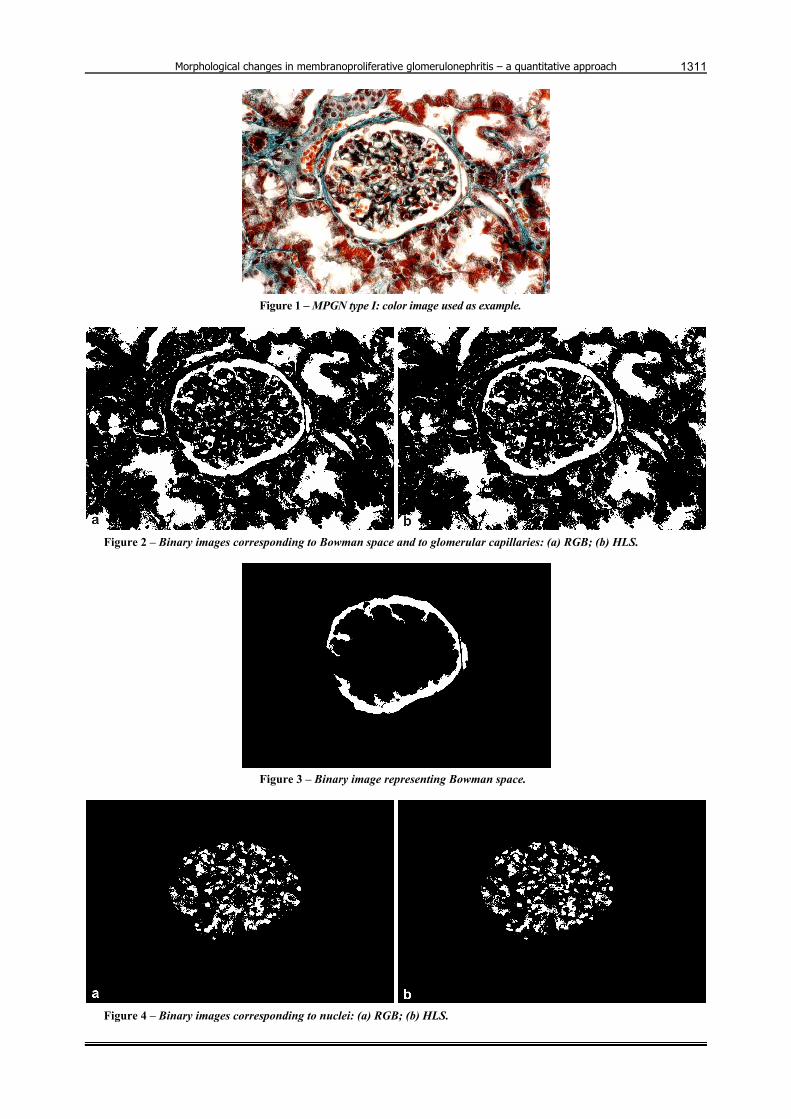
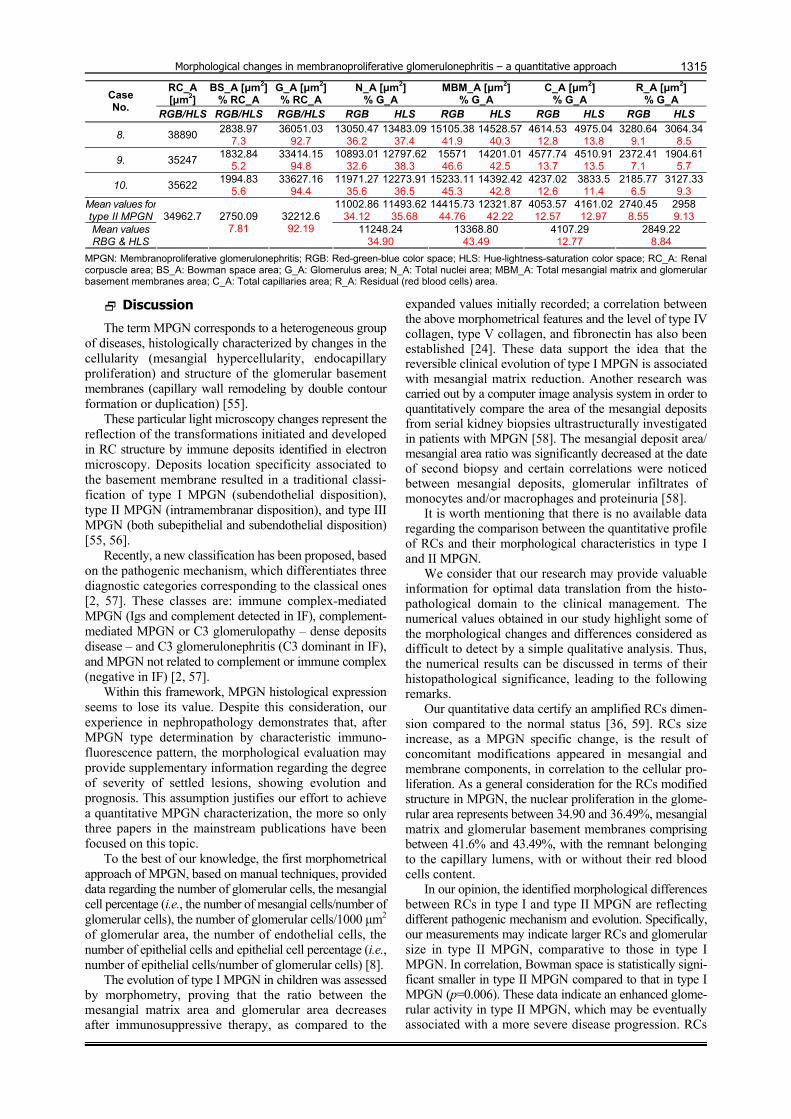
The automated measurements results have been summarized in Table 2 (including 10 cases of type I MPGN) and Table 3 (including 10 cases of type II MPGN – dense deposit disease).
The statistical analysis comparatively applied between the numerical data obtained for the measured morphological characteristics, for each individual color space, showed significant differences between type I MPGN and type II MPGN for Bowman space area (p=0.006) and for mesangial matrix and glomerular basement membranes area – exclusively in RGB color space (p=0.013).
Table 2 – MPGN type I: synopsis of automated measurements performed in RGB and HLS color spaces (mean values/ case, mean values/group)
RC_A [μm2]
BS_A [μm2] % RC_A
G_A [μm2] % RC_A
N_A [μm2] % G_A
MBM_A [μm2] % G_A
C_A [μm2] % G_A
R_A [μm2] % G_A Case
No. RGB/HLS RGB/HLS RGB/HLS RGB HLS RGB HLS RGB HLS RGB HLS
1. 36814 8062.27
21.9 28751.73
78.1 9660.58
33.6 9976.85
34.71 11931.97
41.5 11808.34
41.07 3651.47
12.7 3565.21
12.4 3507.71
12.20 3392.7
11.8
2. 31758 4986 15.7
26772 84.3
9450.5135.3
9691.4636.2
12154.4945.4
11565.5043.2
3721.31 13.9
3962.25 14.8
1445.605.4
1552.785.8
3. 27632 2569.7
9.3 25062.3
90.7 9222.90
36.8 9648.96
38.5 10952.19
43.7 10476.01
41.8 2982.40
11.9 3182.9
12.7 1904.73
7.6 1754.36
7
4. 38544 2890.8
7.5 35653.2
92.5 13619.52
38.2 12977.7
36.4 14403.89
40.4 14047.36
39.4 4421 12.4
4848.84 13,6
3208.799
3779.2410.6
5. 32980 4221.44
12.8 28758.56
87.2 10036.74
34.9 10611.91
36.1 13315.21
46.3 12538.73
43.6 2933.37
10.2 3220.96
11.2 2473.24
8.6 2386.96
8.3
6. 35682 6672.53
18.7 29009.46
81.3 10588.46
36.5 10878.55
37.5 11516.76
39.7 10936.57
37.7 4293.4
14.8 3858.26
13.3 2610.85
9 3336.09
11.5
7. 32468 3181.86
9.8 29286.13
90.2 9605.85
32.8 9576.57
32.7 12798.04
43.7 12534.46
42.8 4744.35
16.2 4158.63
14.2 2137.89
7.3 3016.47
10.3
8. 36512 3870.27
10.6 32641.72
89.4 13121.97
40.2 13774.81
42.2 13056.69
40.0 12240.65
37.5 4178.14
12.8 4504.56
13.8 2184.92
7 2121.71
6.5
9. 38750 6703.75
17.3 32046.25
82.7 10639.36
33.2 11728.93
36.6 14260.58
44.5 12914.64
40.3 3653.27
11.4 4133.97
12.9 3493.04
10.9 3268.72
10.2
10. 35146 5412.48
15.4 29733.51
84.6 11239.27
37.8 11536.6
38.8 12250.21
41.2 11358.2
38.2 3716.69
12.5 4014.02
13.5 2527.35
8.5 2824.68
9.5 Mean values for type I MPGN
10718.5235.93
11040.2437.05
12664 42.64
12042.0540.56
3829.54 12.88
3944.96 13.24
2559.428.55
2743.379.15
Mean values RBG & HLS
34628.6
4857.12 13.9
29771.48 86.1 10879.38
36.49 12353.03
41.6 3887.25
13.06 2651.40
8.85
MPGN: Membranoproliferative glomerulonephritis; RGB: Red-green-blue color space; HLS: Hue-lightness-saturation color space; RC_A: Renal corpuscle area; BS_A: Bowman space area; G_A: Glomerulus area; N_A: Total nuclei area; MBM_A: Total mesangial matrix and glomerular basement membranes area; C_A: Total capillaries area; R_A: Residual (red blood cells) area.
Table 3 – MPGN type II: synopsis of automated measurements performed in RGB and HLS color spaces (mean values/ case, mean values/group)
RC_A [μm2]
BS_A [μm2] % RC_A
G_A [μm2] % RC_A
N_A [μm2] % G_A
MBM_A [μm2] % G_A
C_A [μm2] % G_A
R_A [μm2] % G_A Case
No. RGB/HLS RGB/HLS RGB/HLS RGB HLS RGB HLS RGB HLS RGB HLS
1. 29572 2217.9
7.5 27354.1
92.5 9464.52
34.6 9792.77
35.8 11570.78
4.3 11351.95
41.5 3446.62
12.6 3610.74
13.2 2872.18
10.5 2598.64
9.5
2. 36916 3580.85
9.7 33335.14
90.3 11267.28
33.8 11600.63
34.8 15834.2
47.5 14067.43
42.2 4133.56
12.4 4233.56
12.7 2100.11
6.3 3433.52
10.3
3. 38277 2411.45
6.3 35865.54
93.7 12696.4
35.4 13055.06
36.4 15924.3
44.4 15027.66
41.9 3765.88
10.5 4124.54
11.5 3478.96
9.7 3658.29
10.2
4. 30436 2708.8
8.9 27727.19
91.1 9649.06
34.8 10674.97
38.5 12754.51
46 11589.97
41.8 3410.45
12.3 3770.9
13.6 1913.18
6.9 1691.36
6.1
5. 36284 2830.15
7.8 33453.84
92.2 10805.59
32.3 11307.4
33.8 15355.32
45.9 14418.61
43.1 4181.73
12.5 4315.55
12.9 3111.21
9.3 3412.29
10.2
6. 39445 5088.41
12.9 34356.59
87.1 11475.1
33.4 10925.4
31.8 14738.98
42.9 14945.12
43.5 5016.06
14.6 4328.93
12.6 3126.45
9.1 4157.15
12.1
7. 28938 1996.72
6.9 26941.27
93.1 8755.90
32.5 9025.33
33.5 12069.69
44.8 11476.98
42.6 3152.13
11.7 3906.48
14.5 2963.54
11 2532.48
9.4
Morphological changes in membranoproliferative glomerulonephritis – a quantitative approach
1315
RC_A [μm2]
BS_A [μm2] % RC_A
G_A [μm2] % RC_A
N_A [μm2] % G_A
MBM_A [μm2] % G_A
C_A [μm2] % G_A
R_A [μm2] % G_A Case
No. RGB/HLS RGB/HLS RGB/HLS RGB HLS RGB HLS RGB HLS RGB HLS
8. 38890 2838.97
7.3 36051.03
92.7 13050.47
36.2 13483.09
37.4 15105.38
41.9 14528.57
40.3 4614.53
12.8 4975.04
13.8 3280.64
9.1 3064.34
8.5
9. 35247 1832.84
5.2 33414.15
94.8 10893.01
32.6 12797.62
38.3 15571 46.6
14201.0142.5
4577.74 13.7
4510.91 13.5
2372.417.1
1904.615.7
10. 35622 1994.83
5.6 33627.16
94.4 11971.27
35.6 12273.91
36.5 15233.11
45.3 14392.42
42.8 4237.02
12.6 3833.5
11.4 2185.77
6.5 3127.33
9.3 Mean values for type II MPGN
11002.8634.12
11493.6235.68
14415.7344.76
12321.8742.22
4053.57 12.57
4161.02 12.97
2740.458.55
2958 9.13
Mean values RBG & HLS
34962.7
2750.09 7.81
32212.6 92.19 11248.24
34.90 13368.80
43.49 4107.29
12.77 2849.22
8.84
MPGN: Membranoproliferative glomerulonephritis; RGB: Red-green-blue color space; HLS: Hue-lightness-saturation color space; RC_A: Renal corpuscle area; BS_A: Bowman space area; G_A: Glomerulus area; N_A: Total nuclei area; MBM_A: Total mesangial matrix and glomerular basement membranes area; C_A: Total capillaries area; R_A: Residual (red blood cells) area.
Discussion
The term MPGN corresponds to a heterogeneous group of diseases, histologically characterized by changes in the cellularity (mesangial hypercellularity, endocapillary proliferation) and structure of the glomerular basement membranes (capillary wall remodeling by double contour formation or duplication) [55].
These particular light microscopy changes represent the reflection of the transformations initiated and developed in RC structure by immune deposits identified in electron microscopy. Deposits location specificity associated to the basement membrane resulted in a traditional classi-fication of type I MPGN (subendothelial disposition), type II MPGN (intramembranar disposition), and type III MPGN (both subepithelial and subendothelial disposition) [55, 56].
Recently, a new classification has been proposed, based on the pathogenic mechanism, which differentiates three diagnostic categories corresponding to the classical ones [2, 57]. These classes are: immune complex-mediated MPGN (Igs and complement detected in IF), complement-mediated MPGN or C3 glomerulopathy – dense deposits disease – and C3 glomerulonephritis (C3 dominant in IF), and MPGN not related to complement or immune complex (negative in IF) [2, 57].
Within this framework, MPGN histological expression seems to lose its value. Despite this consideration, our experience in nephropathology demonstrates that, after MPGN type determination by characteristic immuno-fluorescence pattern, the morphological evaluation may provide supplementary information regarding the degree of severity of settled lesions, showing evolution and prognosis. This assumption justifies our effort to achieve a quantitative MPGN characterization, the more so only three papers in the mainstream publications have been focused on this topic.
To the best of our knowledge, the first morphometrical approach of MPGN, based on manual techniques, provided data regarding the number of glomerular cells, the mesangial cell percentage (i.e., the number of mesangial cells/number of glomerular cells), the number of glomerular cells/1000 μm2 of glomerular area, the number of endothelial cells, the number of epithelial cells and epithelial cell percentage (i.e., number of epithelial cells/number of glomerular cells) [8].
The evolution of type I MPGN in children was assessed by morphometry, proving that the ratio between the mesangial matrix area and glomerular area decreases after immunosuppressive therapy, as compared to the
expanded values initially recorded; a correlation between the above morphometrical features and the level of type IV collagen, type V collagen, and fibronectin has also been established [24]. These data support the idea that the reversible clinical evolution of type I MPGN is associated with mesangial matrix reduction. Another research was carried out by a computer image analysis system in order to quantitatively compare the area of the mesangial deposits from serial kidney biopsies ultrastructurally investigated in patients with MPGN [58]. The mesangial deposit area/ mesangial area ratio was significantly decreased at the date of second biopsy and certain correlations were noticed between mesangial deposits, glomerular infiltrates of monocytes and/or macrophages and proteinuria [58].
It is worth mentioning that there is no available data regarding the comparison between the quantitative profile of RCs and their morphological characteristics in type I and II MPGN.
We consider that our research may provide valuable information for optimal data translation from the histo-pathological domain to the clinical management. The numerical values obtained in our study highlight some of the morphological changes and differences considered as difficult to detect by a simple qualitative analysis. Thus, the numerical results can be discussed in terms of their histopathological significance, leading to the following remarks.
Our quantitative data certify an amplified RCs dimen-sion compared to the normal status [36, 59]. RCs size increase, as a MPGN specific change, is the result of concomitant modifications appeared in mesangial and membrane components, in correlation to the cellular pro-liferation. As a general consideration for the RCs modified structure in MPGN, the nuclear proliferation in the glome-rular area represents between 34.90 and 36.49%, mesangial matrix and glomerular basement membranes comprising between 41.6% and 43.49%, with the remnant belonging to the capillary lumens, with or without their red blood cells content.
In our opinion, the identified morphological differences between RCs in type I and type II MPGN are reflecting different pathogenic mechanism and evolution. Specifically, our measurements may indicate larger RCs and glomerular size in type II MPGN, comparative to those in type I MPGN. In correlation, Bowman space is statistically signi-ficant smaller in type II MPGN compared to that in type I MPGN (p=0.006). These data indicate an enhanced glome-rular activity in type II MPGN, which may be eventually associated with a more severe disease progression. RCs

Loredana-Adriana Turiceanu et al.
1316
structural changes highlight the evident differences between the ratio of nuclear area (larger in type I MPGN and smaller in type II)/mesangial matrix and glomerular basement membranes area (smaller in type I MPGN and larger in type II MPGN).
Moreover, the statistically significant differences between the mesangial matrix and glomerular basement membranes areas measured in type I and II MPGN, respectively (in RGB color space, p=0.013), represent a solid argumentation in sustaining the severity of basement membrane lesions specific for dense deposit disease, with strong consequences in RCs histoarchitectony and implied physiology. The better results obtained in the RGB space may be correlated with the type (2) tests for the algorithm robustness analysis, proving a higher accuracy for RGB (versus HLS) running.
We have to underline the value of our computerized morphometrical approach, as a development of our constant interest in the computer-assisted image analysis, dedicated also to nephropathology [53]. The systematic review of references in glomerulonephritis morphometry domain led to the conclusion that there is not enough literature information regarding the high-level automated procedures, in such a manner that they could represent standards in nephropathology quantitative analysis [10–12]. Thus, per-sonal landmarks have been implemented in order to allow the evaluation of proposed algorithm performances. The registered relative errors in algorithm validation (less than 10%), despite chromatic complexity of the images used for measurements, are strong mathematical arguments in favor of similitudes observed during the simple visual inspection of binary images obtained in the parallel RGB and HLS color spaces analysis.
Finally, we consider that the morphometrical results might be further applied as supplementary tools in the stratification of evolution and prognosis of patients diagnosed with type I and II MNGN, respectively. At the current stage, our research does not explore the prognosis role of the morphometric results by interpreting the corre-lations between the clinical picture and the numerically quantified pathological information. An objective of this kind is targeted by our future projects, which obviously requires, as a starting point, the principles and results of the work presented above.
Conclusions
Our study outlines, by the means of quantitative data, the differences between type I and II MPGN. Consequently, we may promote, as a hypothesis, the idea that the morpho-metrical characterization of RCs histological components might represent additional criteria not only for the diagnosis of MPGNs, but also for the assessment of evolution.
Conflict of interests The authors deny any conflict of interests, funding
and other personal relationship with other people or organizations related to this study.
Acknowledgments This work was accomplished within the European
AIDPATH project “Academia and Industry Collaboration for Digital Pathology” (FP7–Marie Curie Action).
References [1] Jhaveri KD, Fishbane S. Glomerular diseases: entering a new
era. Clin J Am Soc Nephrol, 2014, 9(3):598–599. [2] Sethi S, Fervenza FC. Membranoproliferative glomerulo-
nephritis – a new look at an old entity. N Engl J Med, 2012, 366(12):1119–1131.
[3] Brachemi S, Bollée G. Renal biopsy practice: what is the gold standard? World J Nephrol, 2014, 3(4):287–294.
[4] Pirani CL, Pollack VE, Schwartz FD. The reproducibility of semiquantitative analyses of renal histology. Nephron, 1964, 1(4):230–237.
[5] Pirani CL, Salinas-Madriga lL. Evaluation of percutaneous renal biopsy. In: Sommers SC (ed). Pathology Annual. Vol. 3, Appleton–Centuty–Crofts, New York, 1968, 249–296.
[6] Iidaka K, McCoy J, Kimmelstiel P. The glomerular mesangium. A quantitative analysis. Lab Invest, 1968, 19(6):573–579.
[7] Sorensen FH. Quantitative studies of the renal corpuscle. I. Intraglomerular, interglomerular and interfocal variation in the normal kidney. Acta Pathol Microbiol Scand A, 1972, 80(1): 115–124.
[8] Baak JPA, Wehner H. A multivariate morphometric analysis of the glomeruli in the normal and pathologically changed human kidney. Virchows Arch A, 1982, 399(1):105–114.
[9] Steffes MW, Barbosa J, Basgen JM, Sutherland DER, Najarian JS, Mauer SM. Quantitative glomerular morphology of the normal human kidney. Lab Invest, 1983, 49(1):82–86.
[10] Santinelli R, Mazzucchelli P, Colanzi A, Montironi R. Image processing, diagnostic information extraction and quantitative assessment in pathology. J Cell Mol Med, 2002, 6(1):93–106.
[11] Kashgarian M. The contribution of quantitative techniques including morphometry to renal diagnosis. Ultrastruct Pathol, 2006, 30(5):339–343.
[12] Rangan GK, Tesch GH. Quantification of renal pathology by image analysis. Nephrology (Carlton), 2007, 12(6):553–558.
[13] Kim JY, Kim MK, Lee HS. Glomerular growth in childhood focal segmental glomerulosclerosis. Pediatr Nephrol, 1998, 12(2):108–112.
[14] Jeong HJ, Kim JH, Kim PK, Choi IJ. Glomerular growth under cyclosporine treatment in childhood nephrotic syndrome. Clin Nephrol, 2001, 55(4):289–296.
[15] Woźniak A, Salwa-Zurawska W, Kaczmarek E, Bortkiewicz E, Gładysz J, Maciejewski J. The application of electron micro-scopic morphometry as helpful method in the diagnosis of focal segmental glomerulosclerosis (FSGS) early phase. I. Morphometric electron microscopic studies of renal glomeruli in cases of focal segmental glomerulosclerosis (FSGS), minimal change disease (MCD) and mesangioproliferative glomerulo-nephritis (GNMES) in children. Pol J Pathol, 2001, 52(1–2): 27–36.
[16] Woźniak A, Bortkiewicz E, Salwa-Zurawska W, Kaczmarek E, Maciejewski J. The application of electron microscopic morpho-metry as a helpful method in the diagnosis of focal segmental glomerulosclerosis (FSGS) early phase. II. Clinical usefulness of electron microscopic morphometric studies in cases of minimal change disease (MCD) and mesangioproliferative glomerulonephritis (GNMES) with suspicion of progression into focal segmental glomerulosclerosis (FSGS). Pol J Pathol, 2001, 52(1–2):37–46.
[17] Aparicio SR, Woolgar AE, Aparicio SA, Watkins A, Davison AM. An ultrastructural morphometric study of membranous glome-rulonephritis. Nephrol Dial Transplant, 1986, 1(1):22–30.
[18] Ting RH, Kristal B, Myers BD. The biophysical basis of hypo-filtration in nephrotic humans with membranous nephropathy. Kidney Int, 1994, 45(2):390–397.
[19] Danilewicz M, Wagrowska-Danilewicz M. Lupus and nonlupus membranous glomerulopathy. Quantitative comparison of the subepithelial deposits and glomerular basement membrane including clinicomorphologic correlations. Gen Diagn Pathol, 1997, 142(5–6):305–310.
[20] Paraskevakou H, Kavantzas N, Pavlopoulos PM, Voudiklari S, Zerefos N, Papagalanis N, Davaris P. Membranous glomeru-lonephritis: a morphometric study. Pathol Res Pract, 2000, 196(3):141–144.
[21] Horvatic I, Ljubanovic DG, Bulimbasic S, Knotek M, Prkacin I, Tisljar M, Galesic K. Prognostic significance of glomerular and tubulointerstitial morphometry in idiopathic membranous nephropathy. Pathol Res Pract, 2012, 208(11):662–667.
Morphological changes in membranoproliferative glomerulonephritis – a quantitative approach
1317
[22] Biondo A, Grosso E, Fogato E, Giordano F, Matturri L. Glomerular morphometry of twenty-three biopsied patients with IgA nephropathy. Am J Nephrol, 1995, 15(2):99–104.
[23] Danilewicz M, Wagrowska-Danilewicz M. Morphometric com-parison of the density of the mesangial deposits in idiopathic IgA-nephropathy and Schoenlein–Henoch nephritis. An ultrastructural study. Rocz Akad Med Bialymst, 1997, 42(Suppl 2):7–11.
[24] Inaba S, Tanizawa T, Takahashi T, Ishihara S, Arai M, Sakai Y, Kurose KK, Matsukura H, Okada T. Decrease of mesangial matrix after immunosuppressive therapy in children with reversible membranoproliferative glomerulonephritis type I. Clin Nephrol, 1996, 45(4):217–225.
[25] Nieruchalska E, Strzelczyk R, Woźniak A, Zurawski J, Kaczmarek E, Salwa-Zurawska W. A quantitative analysis of the expression of alpha-smooth muscle actin in mesangiopro-liferative (GnMes) glomerulonephritis. Folia Morphol (Warsz), 2003, 62(4):451–453.
[26] Elfenbein IB, Baluarte HJ, Cubillos-Rojas M, Gruskin AB, Coté M, Cornfeld D. Quantitative morphometry of glomerulo-nephritis with crescents. Diagnostic and predictive value. Lab Invest, 1975, 32(1):56–64.
[27] Dische FE, Anderson VE, Keane SJ, Taube D, Bewick M, Parsons V. Incidence of thin membrane nephropathy: morpho-metric investigation of a population sample. J Clin Pathol, 1990, 43(6):457–460.
[28] Dische FE. Measurement of glomerular basement membrane thickness and its application to the diagnosis of thin-mem-brane nephropathy. Arch Pathol Lab Med, 1992, 116(1):43–49.
[29] Akazawa H, Nakajima M, Nishiguchi M, Yamoto Y, Sado Y, Naito I, Yoshioka A. Quantitative immunoelectron-microscopic analysis of the type IV collagen alpha1-6 chains in the glome-rular basement membrane in childhood thin basement mem-brane disease. Clin Nephrol, 2005, 64(5):329–336.
[30] Foster I, Markowitz GS, D’Agati VD. Pathology of thin basement membrane nephropathy. Semin Nephrol, 2005, 25(3):149–158.
[31] Rayat AS, Joshi K, Sakhuja V, Datta U. Glomerular basement membrane thickness in normal adults and its application to the diagnosis of thin basement membrane disease: an Indian study. Indian J Pathol Microbiol, 2005, 48(4):453–458.
[32] Zouvani I, Aristodemou S, Hadjisavvas A, Michael T, Vassiliou M, Patsias C, Pierides A, Ioannou K, Kyriacou K. Incidence of thin basement membrane nephropathy in 990 consecutive renal biopsies examined with electron micro-scopy. Ultrastruct Pathol, 2008, 32(6):221–226.
[33] Iyer VK, Chua C, Milford DV, Ramani P. Focal segmental glomerulosclerosis in childhood: histology, glomerular morpho-metry, electron microscopy and immunofluorescence findings in biopsies performed early in the course of the disease. Indian J Pathol Microbiol, 2002, 45(3):233–239.
[34] Muda AO, Feriozzi S, Cinotti GA, Faraggiana T. Glomerular hypertrophy and chronic renal failure in focal segmental glomerulosclerosis. Am J Kidney Dis, 1994, 23(2):237–241.
[35] Lee HS, Lim SD. The significance of glomerular hipertrophy in focal segmental glomerulosclerosis. Clin Nephrol, 1995, 44(6):349–355.
[36] Nishimoto I, Shiiki H, Nishino T, Uyama H, Iwano M, Dohi K. Reversible glomerular hypertrophy in adult patients with primary focal segmental glomerulosclerosis. J Am Soc Nephrol, 1997, 8(11):1668–1678.
[37] Fuiano G, Comi N, Magri P, Sepe V, Balletta MM, Esposito C, Uccello F, Dal Canton A, Conte G. Serial morphometric analysis of sclerotic lesions in primary “focal” segmental glomerulo-sclerosis. J Am Soc Nephrol, 1996, 7(1):49–55.
[38] Hunter MG, Hurwitz S, Bellamy CO, Duffield JS. Quantitative morphometry of lupus nephritis: the significance of collagen, tubular space, and inflammatory infiltrate. Kidney Int, 2005, 67(1):94–102.
[39] Bhathena AB. Glomerular size and the association of focal glomerulosclerosis in long-surviving human renal allografts. J Am Soc Nephrol, 1993, 4(6):1316–1326.
[40] Ellingsen AR, Nyengaard JR, Østerby R, Jørgensen KA, Petersen SE, Marcussen N. Measurements of cortical inter-stitium in biopsies from human kidney grafts: how represen-tative and how reproducible? Nephrol Dial Transplant, 2002, 17(5):788–792.
[41] Jeong HJ, Kim YS, Kwon KW, Kim MS, Kim S 2nd, Choi KH, Lee HY, Han DS, Park K. Segmental glomerulosclerosis in IgA nephropathy after renal transplantation: relationship with proteinuria and therapeutic response to enalapril. Clin Trans-plant, 2003, 17(2):108–113.
[42] Sund S, Grimm P, Reisaeter AV, Hovig T. Computerized image analysis vs. semiquantitative scoring in evaluation of kidney allograft fibrosis and prognosis. Nephrol Dial Trans-plant, 2004, 19(11):2838–2845.
[43] Servais A, Meas-Yedid V, Noël LH, Martinez F, Panterne C, Kreis H, Zuber J, Timsit MO, Legendre Ch, Olivo-Marin JC, Thervet E. Interstitial fibrosis evolution on early sequential screening renal allograft biopsies using quantitative image analysis. Am J Transplant, 2011, 11(7):1456–1463.
[44] Schwartz MM, Bidani AK. Mesangial structure and function in the remnant kidney. Kidney Int, 1991, 40(2):226–237.
[45] Doublier S, Seurin D, Fouqueray B, Verpont MC, Callard P, Striker LJ, Striker GE, Binoux M, Baud L. Glomerulosclerosis in mice transgenic for human insulin-like growth factor-binding protein-1. Kidney Int, 2000, 57(6):2299–2307.
[46] Kim YH, Goyal M, Kurnit D, Wharram B, Wiggins J, Holzman L, Kershaw D, Wiggins R. Podocyte depletion and glomerulo-sclerosis have a direct relationship in the PAN-treated rat. Kidney Int, 2001, 60(3):957–968.
[47] Ueno M, Kawashima S, Nishi S, Shimada H, Karasawa R, Suzuki Y, Maruyama Y, Arakawa M. Tubulointerstitial lesions in non-insulin dependent diabetes mellitus. Kidney Int Suppl, 1997, 63:S191–S194.
[48] Hruby Z, Smolska D, Filipowski H, Rabczyński J, Cieślar E, Kopeć W, Dulawa J. The importance of tubulointerstitial injury in the early phase of primary glomerular disease. J Intern Med, 1998, 243(3):215–222.
[49] Danilewicz M, Antoszczyk L, Wagrowska-Danilewicz M. Quan-titative analysis of the interstitial myofibroblasts in idiopathic mesangiocapillary glomerulonephritis type I. Pathol Res Pract, 1999, 195(10):663–668.
[50] Danilewicz M, Wagrowska-Danilewicz M. Quantitative analysis of the interstitial mast cells in idiopathic mesangiocapillary glomerulonephritis type I. Nefrologia, 2001, 21(3):253–259.
[51] Danilewicz M, Wagrowska-Danilewicz M. Quantitative analysis of interstitial mast cells in lupus and non-lupus membranous glomerulopathy. Polish J Pathol, 2001, 52(4):211–217.
[52] Shapiro LG, Stockman GC. Computer vision. Prentice Hall, Upper Saddle River, New Jersey, 2001, 187–202.
[53] Caruntu ID, Covic A. Renal corpuscle morphometry with increased reliability and high level of automation. Pathol Res Pract, 2007, 203(1):9–20.
[54] Noel LH. Atlas de pathologie rénale. Médecine Sciences, Flammarion, Paris, 2008.
[55] Masani N, Jhaveri KD, Fishbane S. Update on membrano-proliferative GN. Clin J Am Soc Nephrol, 2014, 9(3):600–608.
[56] Jennette JC, Olson JL, Silva FG, D’Agati VD. Heptinstall’s pathology of the kidney. 7th edition, Wolters Kluwer Health/ Lippincott Williams & Wilkins, Philadelphia, 2015.
[57] Sethi S, Fervenza FC. Membranoproliferative glomerulone-phritis: pathogenetic heterogeneity and proposal for a new classification. Semin Nephrol, 2011, 31(4):341–348.
[58] Danilewicz M, Wagrowska-Danilewicz M. Morphometric com-parison of the quantity of the mesangial deposits in rebiopsied patients with idiopathic mesangial proliferative glomerulone-phritis. Pathol Res Pract, 2001, 197(8):545–550.
[59] Droz D, Lantz B. La biopsie rénale. Éditions INSERM, Paris, 1996.
Corresponding author Elena Roxana Avădănei, Assistant, MD, PhD, Department of Morphofunctional Sciences – Histology, “Grigore T. Popa” University of Medicine and Pharmacy, 16 University Street, 700115 Iassy, Romania; Phone +40771–329 691, e-mail: [email protected] Received: March 26, 2015 Accepted: October 12, 2015