roadblocks to health - transform · anticipated from the proposed summit/alta bates merger in...
TRANSCRIPT

Roadblocks to Health:Transportation Barriers to Healthy Communities
A Report by
Center for Third World Organizing (CTWO)
People United for a Better Oakland (PUEBLO)
Transportation and Land Use Coalition (TALC)


Roadblocks to Health:
Transportation Barriers to Healthy Communities
A Report by the
Transportation for Healthy Communities Collaborative:
Jeff Hobson, Policy DirectorTransportation and Land Use Coalition (TALC)
Julie Quiroz-Martínez, Associate DirectorCenter for Third World Organizing
Cameron Yee, Policy DirectorPeople United for a Better Oakland (PUEBLO)
With research guidance by:
Rachel Morello-Frosch, Ph.D., M.P.H., Assistant Professor, Health Education
Zoe Clayson, Sc.D., Associate Professor, Health Education San Francisco State University
Written by:
Jeff Hobson and Julie Quiroz-Martínez
Major Funding Provided by:
The California Endowment
Additional copies of this report are available free of charge by downloading from TALC’s website at www.transcoalition.org, or for the cost of reprinting by contacting: Transportation and Land UseCoalition, 414 13th Street, 5th Floor, Oakland, CA 94612, phone: 510/740-3150, email:[email protected], www.transcoalition.org<http://www.transcoalition.org/>
Photos by TALC’s Archive, guillermo prado. Design by guillermo prado at 8 point 2 design
Copyright © TALC, 2002


PREFACE
Four years ago, when the Bay Area’s Metropolitan Transportation Commission(MTC) was deciding on their Regional Transportation Plan, they held a key publichearing in Dublin, far from the poverty and hardship of places such as NorthRichmond, West Oakland, or Central San Jose, and comfortably distanced fromthe transit such communities depend upon.
To everyone’s surprise, more than 75 low-income community members fromOakland showed up at the meeting, joining dozens of environmentalists, seniors,and the disabled to demand “100% Funding for Transit.” In a remarkable victoryfor these communities, MTC unanimously approved a policy proposal from theTransportation and Land Use Coalition (TALC) to fully fund the maintenanceneeds of the region’s public transit systems. The decision marked the first timethe Commission had overruled their staff to support a recommendation fromcommunity groups.
MTC’s vote also marked the beginning of a remarkable new collaborationbetween social justice community organizers and transportation advocates, whohad joined together to demand a fair distribution of more than $80 billion intransportation investments.
This report is another milestone in that collaboration. The players in thiscollaboration – TALC, Center for Third World Organizing (CTWO), and People Unitedfor a Better Oakland (PUEBLO) – trace the roots of their relationship to that MTCstruggle.
Like that effort, this report reflects a unified focus on the intersection betweenracial justice organizing and transportation policy. It reflects a two-year projectdedicated to making the health of low-income communities of color a toptransportation priority.
In this report, we have examined the transportation barriers to good health forresidents of 15 low-income communities in Alameda, Contra Costa, and SantaClara Counties. While many factors contribute to good health, we chose tofocus on three key areas: access to health care facilities, supermarkets, andrecreation.
Our report reflects a blend of the collaborators’ skills and perspectives. ThroughTALC (formerly known as BATLUC – Bay Area Transportation and Land UseCoalition), we enjoyed research expertise that included sophisticated GeographicInformation Systems (GIS) mapping analyses to estimate how many people ineach neighborhood have good non-automobile transportation access to healthcare facilities and supermarkets. Through PUEBLO, we developed partnershipswith local organizations to conduct 699 community surveys in four languages.Through CTWO, we built upon a legacy of experience and analysis with racialjustice organizing.
iPreface

This diversity of approaches has produced new insights and revealed long-standing challenges. For example, how do we bring the power of communityorganizing processes into the fast-paced negotiating of effective public policyadvocacy? How do we examine urgent community issues which prior researchhas ignored? How do we sift through the impact of structural racism, the impactof economic oppression, and the relationship between the two? How do wepromote transit-oriented community revitalization without displacing the low-income residents we seek to help? These are among the questions we havegrappled with in the course of this collaboration.
The urgency of the problems facing our communities demands this kind ofcollaboration. As we write this report, the Bay Area and the nation are reelingfrom the dangerous pace of health care “consolidation” that is spawningclosures of health care facilities where they are desperately needed. Twoexamples are the proposed closure of San Jose Medical Center and theproposed cutbacks in services due to the Summit/Alta Bates merger in Oakland.
At the same time, elected officials continue to propose new transportationinvestments that primarily benefit long-distance white-collar commuters, leavingthe needs of low-income communities of color unmet. And all of this takes placein the context of sprawling development patterns that have put large distancesbetween people’s homes, jobs, and services, as well as a legacy of redliningthat continues to deny many services – not just access to healthy activities –to low-income people of color communities.
Taking on enormous issues, such as community health, transit, and theconnection to land use planning, requires us all to stretch: to learn new skills,to try on new ideas, to work with new allies.
We hope that this project can serve as a model for future collaborations amongdiverse organizations and communities. We also hope to continue workingtogether and with others as the Transportation Equity and Community Health(TEACH) program, sponsored by TALC, begins its efforts to increase communityleadership in upcoming transportation issues.
Finally, we hope the analysis and policy solutions outlined in this report willinspire community leaders, advocates, and policy makers to roll up their sleevesand tackle these issues with new energy and vision.
iiPreface

ACKNOWLEDGMENTS
The members of the Transportation for Healthy Communities Collaborative wouldlike to thank the following people for their contribution to this project and thisreport:
For their insightful review of an early report draft: Andrea DuBrow (Contra CostaHealth Services), Marty Lynch (Lifelong Medical Care), Ken Hecht and EdSteinman (California Food Policy Advocates), Martha Matsuoka, Anne Seeley(Physical Activity & Health Initiative, CA Department of Health Services), andZach Wald (BayPeds).
For her pragmatic and visionary thoughts on the recommendations: MakaniThemba-Nixon (The Praxis Project).
For their outstanding work in collecting THC community surveys and providinginvaluable community input: North Richmond Neighborhood House, The PerinatalCouncil in Richmond, Services, Immigrant Rights, and Education Network (SIREN)in San Jose, and the Seventh Street / McClymonds Corridor NeighborhoodImprovement Initiative in Oakland.
For untiring work in developing and implementing the report’s unprecedentedtransit access analysis: Lynn Frederico (GreenInfo Network).
For review of health facility information and insights into the provision of primarycare: Marty Lynch (Lifelong Medical Care), Aimee Chitaya (Community ClinicConsortium of Contra Costa County), and Christine Tyler (Community HealthPartnership of Santa Clara County).
For providing data and assisting with the interpretation of mapping data: Chuck Purvis, Mike Skowronek and Richard Kos (Metropolitan TransportationCommission), Michael Wimer (U.S. Department of Agriculture), Jim Winters(California Office of Statewide Health Planning and Development).
For information and ideas regarding health care industry mergers: Fred Seavey,Local 250, Health Care Workers Union.
For assistance in background research and editing: Swaroopa Iyengar, TomHughes, Irene Lin, and Miles Mercer.
For his guidance and support on all aspects of this project: Jacob Moody (TheCalifornia Endowment).
The members of the collaborative extend a special thanks to the CaliforniaEndowment, whose contribution made this report possible. We also gratefullyacknowledge funding from the San Francisco Foundation.
iiiAcknowledgements


TABLE OF CONTENTS
Executive Summary 1
Chapter 1:Injustices in Transportation and Health 5
Chapter 2:Focusing on Fifteen Communities 13
Chapter 3:Inadequate Transportation Access to Health 19
Chapter 4:Inadequate Transportation Access to Nutritious Food 37
Chapter 5:Inadequate Transportation Limits Physical Activity 47
Chapter 6:Conclusions and Recommendations 57
Appendix I:Mapping Sources and Transit Access 65
Appendix II:Survey Methods and Findings 69
vTable of Contents


EXECUTIVE SUMMARY
For people who own cars, it’s fairly easy to get to a doctor, a grocery store thatoffers fresh fruits and vegetables, or a park where they can exercise. But inmany low-income communities of color, where residents depend on public transitand walking, poorly planned development and inadequate transit funding haveput many of these basic services out of reach.
As residents of these communities know – and research has confirmed –inadequate transportation is one of the primary reasons that low-income familiesmiss, or forego scheduling, medical appointments. The problem is particularlyacute with chronic and preventative care, and when children have to betransported as well.
The myriad health problems of low-income people of color make thesetransportation barriers nothing less than urgent. According to the U.S.Department of Health and Human Services, there is “compelling evidence thatrace and ethnicity correlate with persistent, and often increasing, healthdisparities among U.S. populations.”
The situation is becoming even worse as the frenzied pace of health care“consolidation” continues. Mergers are spawning the closure of facilities inareas that need it most, such as the planned closure of the San Jose MedicalCenter, in downtown in San Jose, or forcing cutbacks in services such as thoseanticipated from the proposed Summit/Alta Bates merger in Oakland.
Ignoring this serious and far-reaching situation, elected leaders are insteadfocusing new transportation investments on “congestion relief” that primarilybenefits long-distance white-collar commuters, leaving the needs of low-incomecommunities of color unmet. Our collective failure to bring critical analysis andnew voices to demand transportation justice is hurting our communities whilepromoting an unhealthy and unsustainable dependence on automobiles.
TRANSPORTATION FOR HEALTHY COMMUNITIES COLLABORATIVE
Roadblocks to Health is the product of a remarkable collaboration between socialjustice community organizers and transportation advocates – a two-year projectdedicated to making the health of low-income communities of color a toptransportation priority. This project has been led by the Transportation and Land Use Coalition (TALC), Center for Third World Organizing (CTWO), and PeopleUnited for a Better Oakland (PUEBLO).
Roadblocks to Health examines the transpor tation barriers to health care, nutritious food, and physical activity for residents of fifteen low-incomecommunities in Alameda, Contra Costa, and Santa Clara Counties. TALCconducted a Geographic Information Systems (GIS) mapping analysis to identifythe number of people in each neighborhood who have transit or pedestrianaccess to health care facilities and supermarkets. This represents the mostdetailed analysis of access to health care in the Bay Area, and the methodology
1Executive Summary

represents an advance in the state-of-the-art for transit accessibility analyses.PUEBLO spearheaded a community survey of 699 residents in four languages,and CTWO provided critical racial justice analysis and overall project coordination.
FINDINGS
The mapping, survey, and research findings presented in this report clearlydemonstrate that the Bay Area’s most disadvantaged communities facesignificant transpor tation barriers to healthy activities. In low-incomecommunities of color, where car-ownership rates are low, inadequate publictransit limits access to hospitals, community clinics, supermarkets, and regionalparks. People of color are disproportionately injured and killed on unsafe streets– a health crisis in itself that in turn contributes to fears of walking and bicycling.
Access in each of these communities varies significantly, but none is adequatelyserved. Some of the key findings include:
Alameda County
■ Only 28% of the residents of Alameda County’s disadvantaged neighborhoodshave transit access to a hospital, leaving over 160,000 residents without tran-sit access.
■ African-American pedestrians in Alameda County are 2.5 times more likely thanwhite pedestrians to be hit by a car and killed or hospitalized.
Contra Costa County
■ Contra Costa County’s disadvantaged neighborhoods have the worst access of the three counties in this study: 20% of residents have transit access to ahospital, 33% have transit access to a community clinic, and 39% have walkingaccess to a supermarket.
■ In four of the county’s six neighborhoods, no residents have transit access toa hospital.
■ In Monument Corridor neighborhood in Concord, residents suffer from 0% transit access to hospitals and only 1% access to clinics, despite the presenceof facilities nearby.
■ North Richmond residents have 0% access to hospitals and supermarkets.
Santa Clara County
■ Of the three counties studied, Santa Clara County’s disadvantaged neighbor-hoods residents have the best transit access to hospitals and supermarkets.
■ Access to hospitals is threatened by the planned closure of the San JoseMedical Center, which would reduce transit access to a hospital from 42% to 0% for residents of downtown San Jose, and from 74% to 48% for residents ofEast San Jose.
2Executive Summary

■ Residents of suburban Gilroy suffer from poor transit access under all the measures in this report, including 0% access to clinics, 7% transit access tohospitals and 33% to supermarkets.
RECOMMENDATIONS
The findings of this report are disturbing, but there are investment and policysolutions that can tear down these barriers. Over the next three years therewill be up to $16 billion in new transportation funding proposals in the BayArea, providing a once-in-a-generation opportunity to fund these solutions. Thisreport offers us a new way of looking at transportation as a vital public healthresource, and opens the doors to new forms of collaboration and coalitionbuilding. Some of the to priority recommendations include:
1. Meet basic transit needs of low-income communities of color.
First and foremost, we must begin by insuring that low-income communities ofcolor have their basic transit needs met. The Metropolitan TransportationCommission recently identified a Lifeline Transit Network that would help meetmany of the basic needs of low-income communities. This should be the toppriority for funding, complemented by free transit passes for low-income families.
2. Make health access a top priority in transportation policy and planning.
Leaders from the transportation and health care communities need innovativecollaborations that elevate health access issues on the transportation agenda.Some policy initiatives include identifying community clinics – not just hospitals– in the Lifeline Transit Network and requiring transit agencies to conduct a“Health Access Impact Analysis” of proposed route cuts and expansions. Topromote healthful activity, funding for pedestrian and bicycle safety projects andfor transit service to regional parks should be significantly increased.
3. Make Medi-Cal transportation assistance available to all recipients.
California should follow the example set in other states by expanding Non-Emergency Medical Transportation (NEMT) eligibility to include all peoplewithout access to a car – not just people with physical disabilities – and allowfunds to be used for public transit.
4. Direct public resources towards disadvantaged neighborhoods, without dis-placing existing residents.
We must reward cities that invest in transit-accessible services and facilitiesand expand programs, such as MTC’s Housing Incentive Program, that supporttransit-oriented affordable housing in these communities.
5. Guard against reductions in transportation access to health care.
Access depends on location. With a growing population, the health care industryshould be opening new facilities, not closing or significantly reducing service atexisting facilities that serve disadvantaged communities. We need to make
3Executive Summary
public transit access a key consideration in any decision to close or significantlyreduce service at a health care facility. Similarly, we must plan for high levelsof transit access when considering the location of new facilities.
6. Support innovative efforts to ensure food security in these neighborhoods.
Increasing access to healthy food must rely on a combination of efforts, includingproviding shopper shuttles to supermarkets, helping corner stores improve theirfood quality and operation, and reinvesting in inner-city supermarkets.
4

CHAPTER 1INJUSTICES IN TRANSPORTATION ANDHEALTH


Forty-seven years ago, African Americans in Montgomery, Alabama organizeda 382-day, citywide bus boycott. With leadership from the Women’s PoliticalCouncil, Montgomery’s Black community united in opposition to “back of
the bus” policies that reflected a powerful system of racial oppression. Sufferinga 75% drop in bus ridership, the city of Montgomery ultimately backed down,marking a major victory in the U.S. Civil Rights Movement.
Like their historical counterparts, low-income communities of color depend ontransit because cars are often beyond their means. For example, 70% of busriders in Santa Clara County are people of color, and 59% make less than$35,000 per year.1 Like their forerunners, people of color still face second classtreatment in transportation – not because of Jim Crow laws, but because theservices they need are eclipsed by the demands of suburban commuters.
Five decades after the Montomery bus boycott, this inequity is striking.
• From 1956 to 1997, the majority of money spent onfederally funded transportation projects (56%) went tohighway expansions, which have benefited suburbancommuters and destroyed urban communities in the way.2
• Governor Davis’ $5 billion “Transportation CongestionRelief Plan” of 2000 focused on serving long-distance,white-collar commuters, greatly shortchanging the urbantransit needs of communities of color.3
• In 2002, the Valley Transportation Authority cut 7 busroutes, reduced service on 56 more, and released abudget that will require an approximately 20% reduction inservice through 2036. These cuts came at the same timethe agency was carving out $2 billion more than hadoriginally been budgeted for the extension of BART to SanJose for trains that won’t run for at least ten years andthat will mostly serve high-income professionalscommuting to Silicon Valley.4
7CHAPTER 1 Injustices in Transportation and Health

Today, a racial divide remains entrenched in the structure of our urban regions,undermining the health and well being of communities of color. Moreover, ourcollective failure to challenge transit injustice promotes a dangerously unhealthyand unsustainable car culture for everyone.
TRANSPORTATION ACCESS TO HEALTH
For people with a car, getting to a doctor is fairly easy. So is getting to agrocery store that offers fruits and vegetables, or a park where they canexercise.
For transit-dependent communities of color, however, poorly planned and poorlyresourced transit can put these basic activities out of reach. In fact, more andmore research indicates that poor public transportation systems act as barriersto health care and healthy activities. For example:
• A study of cancer patients in Texas found that “patients,particularly minorities, may opt to forgo needed care inthe absence of available and affordable means oftransportation.” 5
• Inadequate transportation to pediatric facilities in Bostonwas the largest barrier identified by Latinos when askedwhy they did not bring their children in for treatment orcheckups. 6
• A Contra Costa County study of evening clinics found thatnearly one quarter (24%) of missed appointments weredue to transportation problems, and that MediCal clientswere more likely to miss appointments than were patientswith private insurance. 7
Transportation problems also show up in studies of other healthy activities. Foodstamp recipients cite transportation barriers as a reason for making only onelarge shopping trip per month, a practice that limits their ability to eat freshfruits and vegetables.8 And although the Centers for Disease Control has urgedthe integration of walking into everyday activities to counteract an “epidemic”of obesity, the chances of getting hit by a car – a major concern in urbancommunities of color – makes it difficult to heed this advice.
CONTRIBUTING TO A HEALTH CRISIS
The health problems of low-income people of color make these transportationissues nothing less than urgent. According to the US Department of Healthand Human Services, there is “compelling evidence that race and ethnicitycorrelate with persistent, and often increasing, health disparities among U.S.populations.” According to the HHS report, people of color suffer from higherrates of tuberculosis, infant mortality, heart disease, and traffic deaths than do
8CHAPTER 1 Injustices in Transportation and Health

whites.9 A 1999 study showed that 39% of households below the poverty linecannot achieve "food security" – the availability of nutritionally adequate andsafe foods at an affordable price.10
What’s worse, trends such as transit cutbacks and consolidation of health carefacilities threaten to further reduce transportation access to healthy activities.
WINDOW OF OPPORTUNITY
Low-income communities of color face different transportation situations, butthe underlying problems are the same: a transportation system that was notplanned with their input and public investments that degrade, instead of improve,the health of low-income communities.
Five years ago the push for “welfare reform” unveiled the incredible barriers low-income workers face in getting to jobs on transit, or spending a huge amount of theirincome for a car. A variety of initiatives have been started since then to connectworkers with jobs sites, such as the federal Reverse Commute Access program.
But clearly, focusing on people who use public transit to work is simply notenough. Healthy kids and healthy communities also require transportationaccess to recreational facilities, hospitals and local clinics, and nutritious food.The barriers identified in this report are not insurmountable, but significant newfunding will be needed to develop new services.
Fortunately, there is still significant potential for improvement in the comingyears as the new focus on the “transportation crisis” is creating a once-in-a-generation opportunity. By 2004, six counties in the Bay Area are likely to putforward transportation sales tax proposals worth a combined $11 billion. These20-year sales taxes would not be renewed again until 2024. Also in 2004 theMetropolitan Transportation Commission will have over $5 billion in new fundsto distribute as part of the Regional Transportation Plan update. And in 2003the federal government is reauthorizing their transportation bill, with the potentialto get both earmarks and special competitive programs. Furthermore, ongoinglitigation is increasing the pressure on transportation agencies to improve transitservice for urban communities. The Bay Area has been in and out of compliancewith federal smog rules, and a federal judge recently ruled that MTC mustincrease transit ridership to meet air quality goals it set twenty years ago andstill hasn’t met.11 To seize this opportunity, community leaders, policymakers,and transportation and health care planners must elevate on the policy agendathe impact of transportation barriers on the health of low-income communitiesof color. To do this, we must:
• PRESENT AN ACCURATE PICTURE OF THE BARRIERS. Transportationresearch and policy discourse too often focuses on theneeds of long distance commuters, passing over the needsof low-income people of color. More high-quality researchis needed to shed light on the transportation barriers facedby low-income communities.
9CHAPTER 1 Injustices in Transportation and Health

• BREAK DOWN BARRIERS BETWEEN TRANSPORTATION AND HEALTH
PLANNING. Transportation planners see health care and foodaccess as social welfare problems, not transportationproblems. Health care planners focus on health insuranceand the industry’s services, assuming that people will finda way to get to the health facilities. Planners in both fieldsneed to avoid tunnel vision and start working together.
• INCREASE THE LEADERSHIP BY LOW INCOME COMMUNITIES OF COLOR.Without greater understanding of community needs, as wellas the involvement of these communities, elected officialswill continue to underfund those needs. Transportationaccess to healthcare, nutritious food, recreationalactivities, social services, and jobs will continue todeteriorate. Community groups need to raise theseconcerns, and raise them loudly, to win the investmentstheir neighborhoods need.
The threat to community health is real. Today, low income communities of colormust refuse to have their transportation health access issues pushed to publicpolicy’s “back of the bus.”
FOOTNOTES
1 Valley Transportation Authority, On-Board Survey Final Report, Volume 1 Summary, March 2000. Statisticsreported are based on 14,230 surveys collected from passengers on weekday bus trips.
2 Urban Habitat Program, Crash Course in Bay Area Transportation Investment, 1999, p. 28.3 Transportation Choices Forum, “Widening the Transportation Divide: How Governor Davis’ Transportation Plan
Leaves Transit-Dependent People Stranded,” May 2000.4 Valley Transportation Authority, “Board of Directors Workshop Packet, Attachment 5”, March 1, 2002.5 Guidry, Jeffery, et al. “Transportation as a Barrier to Cancer Treatment,” Cancer Practice, vol. 5, no. 6,
November/December 1997.6 Flores, Glenn, et al. “Access Barriers to Health Care for Latino Children,” Archives of Pediatric and Adolescent
Medicine, vol. 152, p. 1119-1125, November 1998. Similar results were found in Lewis, Ma, et al. “The termi-nation of a randomized clinical trial for poor Hispanic children,” Archives of Pediatric and Adolescent Medicine,vol. 148, p. 364-367, 1994; Wood, PR, et al. “Hispanic children with asthma: morbidity,” Pediatrics, vol. 91, p.62-69, 1993; and Moore, P & Hepworth, JT. “Use of perinatal and infant health services by Mexican-AmericanMedicaid enrollees,” Journal of the American Medical Association, vol. 272, p. 297-304, 1994.
7 Elizabeth Butrick, “Factors in Nonattendance in Extended Evening Clinics in Contra Costa County,” unpublishedpaper for Contra Costa Health Services, 1999. This study examined the reasons patients missed appointmentsat CCHS’s Extended Evening Clinics located in Richmond, Martinez, and Pittsburg.
8 Ohls, James, et al. Food Stamp Participants’ Access to Food Retailers, Food and Nutrition Service, USDepartm Nutrition Service, US Department of Agriculture, July 1999.
10CHAPTER 1 Injustices in Transportation and Health

9 US Department of Health and Human Services. Healthy People 2000: Trends in Racial and Ethnic-SpecificRates for the Health Status Indicators: United States, 1990-98, No. 23, January 2002. Byrd, W. Michael &Clayton, Linda. “The Slave Health Deficit: Racism and Health Outcomes,” Health PAC Bulletin, 1991. NationalCenter for Health Statistics. Health, United States, 1998 With Socioeconomic Status and Health Chartbook,1998. Council of Scientific Affairs. “Hispanic Health in the United States,” Journal of the American MedicalAssociation, vol. 265, no. 2.
10 Andres, Margaret, et al. Household Food Security in the United States, 1999, Economic Research Service, USDepartment of Agriculture, Report No. 8, Fall 2000.
11 “Bay transit officials told to boost ridership”, San Francisco Chronicle, July 23, 2002. Douglas Fischer andSean Holstege, “U.S. judges bar highway plans over Bay Area smog”, Oakland Tribune, July 24, 2002.
11CHAPTER 1 Injustices in Transportation and Health


CHAPTER 2FOCUSING ON 15 COMMUNITIES


THCC focused on 15 Bay Area neighborhoods that are home to largenumbers of low-income people of color. We selected these neighborhoodsfor several reasons: First, we wanted to choose neighborhoods whose
statistical profiles demonstrate a serious level of poverty and disadvantage. Wetherefore focused on areas that had been identified in a 1997 study of the BayArea’s “most impoverished” neighborhoods.1 Second, we chose to examineneighborhoods in Alameda, Contra Costa, and Santa Clara counties where THCClead organizations had strong connections with community groups who wereinterested in participating in the project.
These 15 neighborhoods and their key demographic characteristics are listed inTABLE 1. MAP 1 is a map of the East and South Bay region showing the locationsof the neighborhoods, with shading to represent population density. MAPS 2 AND
3 show that the target neighborhoods are areas with both a large concentrationof low-income residents and with a large percentage of people of color. Mapsare contained in the “Mapping Supplement” enclosed on the inside back cover.
In Alameda County, the target neighborhoods include the flatlands of EastOakland (including the San Antonio, Fruitvale, Central East Oakland, and Elmhurstneighborhoods), plus West Oakland and West Berkeley. In Contra Costa County,target neighborhoods include three in Richmond – Southside, Iron Triangle, andNorth Richmond – and three in Central/eastern County – the MonumentBoulevard Corridor in Concord and poor areas in Bay Point and Pittsburg. InSanta Clara County, target neighborhoods include Downtown San Jose, East SanJose, and a portion of Gilroy.
CHARACTERISTICS OF THE FOCUS NEIGHBORHOODS
People of color account for nearly 90% of the population in these communities.According to the 2000 Census, 89% of the residents of these neighborhoodsidentify themselves as African American, Asian, Hispanic/Latino, NativeAmerican, or multi-racial. This stands in stark contrast to the remainder of thethree counties studied, where exactly half of the population are people of color.Among these neighborhoods, the highest concentration of people of color is inNorth Richmond (99%). Even in the neighborhood with the lowest concentration,West Berkeley, 69% of the population identifies as people of color.
15CHAPTER 2 Focusing on 15 Communities
THESE ARE VERY POOR COMMUNITIES. Recent estimates show that 45% of thehouseholds in these communities have an annual income of less than $25,000,compared with 16% in other communities in these three counties. These ratesranged from 70% in West Oakland to 27% in East San Jose.
THESE COMMUNITIES DO NOT FIT THE CALIFORNIA “CAR CULTURE” STEREOTYPE. Accordingto data provided by the Metropolitan Transit Commission (MTC), 21% ofhouseholds in these communities do not own a car, compared to 8% ofhouseholds in all other communities in the 3 counties. Among theseneighborhoods, West Oakland and San Antonio residents are least likely to owna car (40% and 28%). Residents of East San Jose are most likely (8%).
Not surprisingly, residents of these communities are much more likely to getaround on transit or by foot than other Bay Area residents. Twenty-one percentof residents ride transit, walk, or bicycle for their trips, compared with 12% ofresidents in all other communities in the three counties. Alameda Countyresidents are most likely to use these alternative forms of transportation; ContraCosta residents are least likely. Differences among neighborhoods aresignificant, ranging from 8% of Baypoint residents to 33% of West Oaklandresidents.
MANY FAMILIES WITH CHILDREN LIVE IN THESE COMMUNITIES. Nearly one third (31%) ofthe residents of these communities are children, compared with 24% of residentsin all other communities in the three counties.
THCC SURVEY ADDS ANOTHER DIMENSION
To round out our picture of these communities, THCC worked with communityorganizations in these neighborhoods to conduct a survey of 699 residents.(FOR A DETAILED DESCRIPTION OF THE SURVEY METHODS, SEE APPENDIX II.) These communityorganizations conducted diverse forms of outreach, contacting residents atsenior centers, low income housing facilities, community health fairs, bus stops,churches, and homes.
• Among the people surveyed, buses are the primary waythey get around: 49% of respondents take the bus to work,42% take the bus to do grocery shopping, 59% to go tothe doctor, 37% to parks and recreation, and 31% to taketheir children to school.
• Survey respondents say that long travel times andinfrequent service are the top two transit problems.Transit takes too long, according to 53% of respondents.And it dosen’t come often enough, say 40%.
Other highlights from the THCC survey are featured in this report.
16chapter 2 Focusing on 15 Communities

17CHAPTER 2 Focusing on 15 Communities
TABLE 1: DEMOGRAPHICS OF TARGET NEIGHBORHOODS
Neighborhood Population % People % of Households Trips % Childrenof Color with Income without on Transit,
below a Car Walk,$25,000 or Bicycle
Alameda CountyCentral East Oakland 42,170 93% 43% 17% 22% 31%
Elmhurst (Oakland) 54,128 97% 48% 14% 21% 35%
Fruitvale (Oakland) 38,145 91% 37% 19% 25% 30%
San Antonio (Oakland) 67,016 88% 45% 32% 32% 27%
West Berkeley 6,810 69% 47% 17% 25% 22%
West Oakland 23,041 93% 70% 40% 33% 32%
Contra Costa CountyBaypoint 17,062 70% 44% 12% 8% 34%
Iron Triangle 13,555 94% 51% 28% 18% 36%
Monument Blvd 21,429 70% 39% 16% 13% 29%
North Richmond 4,076 99% 59% 11% 11% 39%
Pittsburg 12,103 84% 42% 10% 10% 34%
Southside Richmond 8,522 97% 58% 17% 15% 36%
Santa Clara CountyDowntown San Jose 39,470 77% 42% 21% 21% 23%
East San Jose 65,568 94% 27% 8% 12% 32%
Gilroy 8,773 87% 49% 9% 16% 36%
Target Neighborhoods in 3 counties 421,868 89% 45% 21% 21% 31%
Other areasin 3 counties 3,653,274 50% 16% 8% 12% 24%
Note: “People of Color” includes anyone who identified as African-American, Asian/Pacific Islander, NativeAmerican, Hispanic, or multi-racial on the 2000 census. Income reported in 1990 dollars.
Sources: BATLUC TALC Analysis based on U.S. Census (2000, for population, people of color, and children), ABAGProjections (2000, for low-income households and car-less households) and MTC Travel Demand Model(1998, for transportation mode share).

18chapter 2 Focusing on 15 Communities
The THCC survey participants are not representative of the entire population ofthese neighborhoods. In fact, the survey intentionally oversamples AfricanAmerican and Latino residents, as well as residents who are frequent bus riders.
The survey therefore provides useful information on groups for which there issparse research. It also offers us a picture of the transportation barriers facedby the constitutencies of the community organizations we worked with, and helpsus compare these experiences with the results of other research.
FOOTNOTES
1 We identified the neighborhoods in this report based on an assessment done in 1997 by the Bay AreaPartnership for Building Healthy and Self-Sufficient Communities for Economic Prosperity, a coalition of govern-ment, business, and community leaders working to improve health, economic, and community development pro-grams. Their guide identified the most impoverished neighborhoods in the Bay Area. The neighborhoods theyidentified by census tract largely overlap with the neighborhoods in our report. However, after consultation withcommunity groups in each neighborhood, we used boundaries that conform to the residents’ definition of theirown neighborhoods. Northern California Council for the Community. A Guide to the Bay Area’s MostImpoverished Neighborhoods – By County, Bay Area Partnership for Building Healthy and Self-SufficientCommunities for Economic Prosperity, February 1997.
CHAPTER 3INADEQUATE TRANSPORTATION ACCESS TO HEALTH CARE


The bus service here is really bad. In ten years, I’ve never seen the bus
service get any better. If you have an 8:30 doctor’s appointment, you’d
need to leave at 7 and you might still be late.
— Lupe Guttierez, Pittsburg resident
Inadequate transportation presents a major barrier to access to health care.1
When getting to health care services is a barrier, patients often end up notseeking care, missing appointments, or delaying care until a condition
deteriorates and requires emergency attention. A recent study of 75 patientswho missed appointments at evening clinics in Contra Costa County found that24% cited lack of transportation as the reason, more than the number citingany other reason. The same study found that Medi-Cal clients were more likelyto miss appointments than were patients with private insurance.2
These conclusions were echoed in the THCC survey: 55% of respondents reportedhaving missed, been late to, or not attempted to go to a medical appointmentdue to transportation problems. Missed appointments are a major problem forpatients and clinics alike: a group of five clinics in Oakland and Berkeley reportsthat no-show rates range from 20% to 40% for their general-population clinics.3
DEFINITION OF ADEQUATE TRANSPORTATION ACCESS TO HEALTH CARE FACILITIES
These access problems persist in the face of federal law that requires stateMedicaid programs to assure transportation to those who need it, to and fromappointments. But federal regulations do not define how to determine who needstransportation or what type of assistance should be provided. This lack ofdefinition raises the question: what would adequate non-automobiletransportation access to health care look like, particularly with respect to low-income people of color communities?
California's Medi-Cal regulations specify that primary health care services offeredthrough Medi-Cal's managed care programs should be no more than 30 minutestravel time or 10 miles travel distance from each member’s home.4 For peoplewithout a car, the 10-mile travel distance criterion is clearly inappropriate, as itcould entail as much as a two- or three-hour ride on a series of buses, or simplybe infeasible, depending on the routes and frequency of transit service. Transit
21CHAPTER 3 Inadequate Transportation Access to Health Care

travel time and walking distance are the most appropriate criteria to use indefining transportation accessibility for this population.
In this report, we define "adequate transportation access to a health care" asthe ability to reach a health care facility within a 30-minute travel time on publictransit or a half-mile walk. As shorthand, we refer to this adequate transportationaccess to health as “transit access.”5 Using this definition, THCC completed adetailed GIS analysis based on the addresses of health care facilities, detailedpublic transit route data, and population data at the census block level. Thisanalysis identifies gaps in transit access and elucidates the barriers manyresidents face in getting to health care facilities. The results of this analysisare described below, and can be viewed on the maps of "Transit AccessibleAreas" in FIGURES 4-10. For details on the mapping methodology, including datasources and analysis techniques, see Appendix I - Mapping Methodology.
INADEQUATE PUBLIC TRANSIT TO HOSPITALS
FINDING: Only one-third of residents in disadvantaged neighborhoods
have adequate transit access to a hospital.
This GIS analysis showed that only one-third of residents of disadvantagedneighborhoods have adequate transit access to a hospital. In other words, two-thirds of the residents of these areas cannot get to a hospital within a half-hour on transit or a half-mile on foot. In five of the fifteen disadvantagedneighborhoods reviewed in this study, no one has adequate transit access toa hospital. For detailed listing by neighborhood, SEE TABLE 2.
FINDING: In 5 of the 15 disadvantaged neighborhoods studied, 0% of
residents have adequate transit access to a hospital.
22CHAPTER 3 Inadequate Transportation Access to Health Care
Each map shows target neighborhoods (in light blueshading). Health care facilities that are accessibleto a target neighborhood are shown with appropriateicons – a blue “H” for hospitals (MAPS 4-7) and a redcross for community clinics (MAPS 6, 8-10). “Transit-Accessible” health care facilities are those whichcan be reached by a 30-minute transit trip or a half-mile walk. Inaccessible facilities are designated bya circle with a line through it.
Areas with transit or walking access to an accessiblehealth care facility are shown in red cross-hatchedareas. For bus lines that provide access to a healthcare facility, the heavy purple line indicates theportion of the line that provides access within the
half-hour travel time. Points along that bus routebeyond the extent of the purple line are too far fromthe facility to provide timely transit access. The greylines in the background are all transit routes,including those which do not provide access to ahealth care facility and the portion of routes.
FOR EXAMPLE: in Alameda County (MAP 4), most of theSan Antonio neighborhood has transit/walkingaccess to Alameda County Medical Center/HighlandHospital, so most of the San Antonio neighborhoodis covered in red cross-hatching. Areas with notransit/walking access are shown in blue only,including for example all of the Central East Oaklandneighborhood.
HOW TO READ THE "TRANSIT-ACCESSIBLE AREAS" MAPS

Alameda County: Transit Access to Hospitals
Only 28% of residents of disadvantaged neighborhoods in Alameda County haveadequate transit access to a hospital (SEE MAP 4). The only neighborhood withgood transit access (San Antonio, at 80%) has a centrally located hospital(Highland Hospital, the county hospital) that can be reached by several bus linesthat traverse the neighborhood. All other neighborhoods in the county have poortransit access, varying from 0 to 26%.
To have good transit access to a hospital, the first requirement is that therebe a hospital in the neighborhood or at least nearby. However, Alameda County’sresults show the importance oflayout and frequency of transitroutes. For example, the edge ofWest Berkeley is nearly a milefrom the nearest hospital(Herrick Campus of Alta Bates),but it is connected by a bus thatruns every 30 minutes directlyfrom the hospital. West Oaklandhas three hospitals (Children's,Summit, and Kaiser Oakland)nearby, including one (Summit)that is less than a half-mile fromthe edge of the neighborhood.Based on mere proximity, onewould expect West Oakland tohave better transit access. Butbecause the transit route to WestBerkeley is more direct, WestBerkeley’s transit accessibilityscore is much better (26%) thanWest Oakland’s (11%). Well-designed transit routes cansignificantly increase access tohospitals.
23CHAPTER 3 Inadequate Transportation Access to Health Care
TABLE 2: PERCENTAGE OF RESIDENTS WITHTRANSIT ACCESS TO A HOSPITAL
Neighborhood % of Residents
Alameda CountyCentral East Oakland 0%Elmhurst 7%Fruitvale 7%West Oakland 11%West Berkeley 26%San Antonio 80%
Contra Costa CountyMonument 0%Bay Point 0%Pittsburg 0%North Richmond 0%Southside Richmond 32%Iron Triangle 96%
Santa Clara CountyGilroy 7%Down Town San Jose 42%East San Jose 74%
Alameda Target Neighborhoods 28%Contra Costa Target Neighborhoods 20%Santa Clara Target Neighborhoods 58%
All Target Neighborhoods 34%
Note: Accessible destinations are within 30 minute transit travel time orhalf-mile walk from place of residence.
Source: TALC Analysis based on transit route data from MTC (2001), popu-lation data from the U.S. Census (2000), and health facility datafrom California Office of State Health Planning Department (2000).

Contra Costa County: Transit Access to Hospitals
The situation is even worse in Contra Costa County, where only 20% of residentsof disadvantaged neighborhoods have transit access to a hospital, and fourentire neighborhoods have no transit access whatsoever. The reasons for thispoor transit access vary. MAP 5 shows that fully 96% of the Iron Triangleneighborhood of Richmond has transit access to a hospital. Kaiser Richmondis in the center of the neighborhood, less than a half-mile from BART, and canbe reached on two dif ferent bus lines that together cover the entireneighborhood. By contrast, nearby North Richmond, whose residents live nomore than 3.2 miles from the hospital, have 0% transit access because theirone bus route only runs every half-hour on weekdays, every hour on weekends,resulting in long waiting times.
Transit access to health care is so bad in central and eastern Contra Costathat MAP 6 can combine the presentation of transit-accessible areas for bothhospitals and community clinics. None of the residents in any of the threeneighborhoods pictured have transit access to a hospital. For the east countyneighborhoods of Pittsburg and Bay Point, the closest hospital is simply too faraway and transit service too infrequent. For the Monument Corridor neighborhoodof Concord, however, Mt. Diablo Medical Center is less than a mile from theedge of the neighborhood. But, residents cannot reach it in a reasonable timebecause the two bus routes that traverse their neighborhood stop at the BARTstation. With just a slight restructuring, the hospital could instead be the endpoint of the route, providing direct bus service for the community.
Santa Clara County: Transit Access to Hospitals
Transit access to hospitals is best in Santa Clara County, where 58% of residentshave adequate transit access to a hospital (SEE MAP 7). This relatively good transitaccess is due to the location of two hospitals within San Jose's disadvantagedneighborhoods, each served by multiple bus lines. But this access is threatenedby the planned 2006 closure of San Jose Medical Center (SJMC), which waspurchased recently by health care conglomerate HCA (SEE SIDEBAR).
If HCA does close down SJMC, over 30,000 people in San Jose’s poorestneighborhoods would lose good transit and walking access to a hospital, leavingonly 48% of East San Jose and none of downtown San Jose with access (SEE
TABLE 3). Even if HCA does retain some services at the current SJMC location,the closure will have a devastating impact on access to health care in SanJose’s poorest neighborhoods.
24CHAPTER 3 Inadequate Transportation Access to Health Care

25CHAPTER 3 Inadequate Transportation Access to Health Care
In 1996, the healthcare conglomerate HCA ((“HCA -The Healthcare Company) bought the San JoseMedical Center (SJMC) in downtown San Jose. Threeyears later, HCA purchased another hospital just 2.5miles away in East San Jose that is now calledRegional Medical of San Jose. Following its practicein other cities, HCA announced in May 2000 it wouldclose SJMC, citing high costs of seismic retrofitting.
The campaign to save the hospital from closure hasbeen spearheaded by a diverse group of community,religious, labor and neighborhood organizations,brought together in the Save SJMC Coalition. Itsbroad-based membership includes 77 member organ-izations, which range from the Black Firefighters Unionand local police union to the Council of Churches ofSanta Clara County and the Older Women’s League.Active lobbying led HCA to briefly change its mind, asthe hospital’s CEO announced in July 2001 that the
hospital would stay open.6 Less than a year later, how-ever, HCA announced plans to close the hospital’sdoors in 2006.7
This planned closure comes amid charges that HCAengages in a practice of medical redlining: shuttingdown community hospitals that serve low-income peo-ple-of-color communities in order to build or expandhospitals in white, middle or upper-class neighbor-hoods.8 With over $1 billion in annual profits, HCA isthe largest for-profit hospital chain in the country.
HCA spokespeople claim that transportation issuesare not a problem because there is another hospitaltwo and a half miles away, but this study’s mappingdata tells a different story: if SJMC closes, over30,000 people in San Jose’s poorest neighborhoodswill lose good transit and walking access to a hospital.
ACCESS DENIED: PLANS TO CLOSE SAN JOSE MEDICAL CENTER
TABLE 3: IMPACT OF PROPOSED CLOSURE OF SJMC
Neighborhood % of Residents with transit Number of residentsaccess to a hospital who would lose access
With SJMC Without SJMC)(current)
Down Town San Jose 42% 0% 15,069
East San Jose 74% 48% 15,835
Santa Clara County
Target Neighborhoods 58% 29% 30,904
Note: Accessible destinations are within 30 minute transit travel time or half-mile walk fromplace of residence
Source: TALC Analysis based on transit route data from MTC (2001), population data from theU.S. Census (2000), and health facility data from California Office of State HealthPlanning Department (2000).

26CHAPTER 3 Inadequate Transportation Access to Health Care
RACIAL DISPARITIES IN HEALTH CARE AND THE IMPORTANCE OF COMMUNITY CLINICS
National studies show have long shown that doctors are much less likely tolocate in communities of color -- and the situation is not improving. During thepast two decades, the number of areas with a shortage of doctors has grownby 35%, even as the number of physicians per capita has grown dramatically.9
In California too, most doctors will not open practices in communities of color.According to the University of California-based California Policy Research Center,the supply of health care providers in California is influenced more by acommunity's racial composition than by its level of income. People living in lowincome, predominately white urban areas had a greater supply of health careproviders than communities with higher incomes and greater percentages ofAfrican American and Latino residents.10 A national study by the Council onGraduate Medical Education reached a similar conclusion: “a community’s racialand ethnic character also exerts a powerful influence on physician locationindependent of income status.”11 The problem is not lack of doctors; the problemis a lack of doctors willing to practice in communities of color.
Access to private health insurance coverage – asopposed to Medicaid or Medi-Cal – can greatlyincrease the range and quantity of health careproviders families can use. For most people, howev-er, the only way to get private health insurance is byfinding a job with benefits.
In low-income communities of color, whose residentsstruggle with high levels of employment discrimina-tion14 and poor educational opportunities,15 the oddsof getting such jobs are low. Unfortunately, poortransportation makes the situation even worse.
LOW-INCOME PEOPLE OF COLOR FACE GREATER TRANSPORTATION
BARRIERS TO WORK. According to MTC, residents fromthese communities often do not have access to thenight and weekend transportation their jobs demand.High costs of transit or private cars can also makegetting to work difficult. For parents, the combinationof getting to work and getting kids to childcare or
school can make holding down a job an even greaterchallenge.16
POOR PUBLIC TRANSPORTATION RESULTS IN ACCESS TO FEWER
JOBS. Because few jobs are located within low-incomecommunities of color, and rates of car ownership arelow in these communities, inadequate public trans-portation reduces access to jobs and job-relatedhealth insurance. According to a 2001 analysis of thenine-county Bay Area, workers with a car had accessto over 9 times as many jobs within 30 minutes asworkers who depended on transit.17
THE PROBLEM IS ONLY GETTING WORSE. According to a1998 study by the Transportation Choices Forum,over 50% of the new jobs expected through 2015 willbe in areas with little or inadequate transit service.18
This barrier will prohibit access to new employmentopportunities for transit dependent communities foryears to come.
DISTANT JOBS DIMINISH HEALTH INSURANCE OPTIONS

27CHAPTER 3 Inadequate Transportation Access to Health Care
Community Clinics Pick up the Slack
With few hospitals and local doctors, these neighborhoods have turned tocommunity clinics to fill the gaps in the health care system. Dispersed incommunities, community clinics provide more cost-effective, and in many casesmore culturally appropriate, primary care than hospitals do. Medi-Cal surveysshow that 40% of its recipients receive primary care at a community clinic,compared to 7% in an emergency room and 49% through private doctors.12
Respondents to the THCC survey were even more likely to use community clinics:54% receive primary care at clinics, compared to 19% at a hospital emergencyroom and 27% at a family doctor.
Not surprisingly, community clinics in these neighborhoods are very busy. The59 primary care community clinics in Alameda, Contra Costa, and Santa Claracounties serve over 220,000 patients a year, 87% of whom live in poverty and77% of whom are people of color.13
In addition, the county health departments in each county also run health carecenters that offer similar primary care services. These county health care centershave been added to the mapping analysis presented below. For ease ofterminology, the remainder of this discussion will use the phrase “communityclinics” to refer both to nonprofit community clinics and county-run communityhealth centers except where the text specifically distinguishes between the two.
INADEQUATE PUBLIC TRANSIT TO COMMUNITY CLINICS
FINDING: Over 109,000 people, or 26% of residents of disadvantaged
neighborhoods, do NOT have adequate transit access to a
community clinic.
THCC's GIS analysis showed wide variation in transit access to communityclinics. Although 74% of residents of target neighborhoods have adequate transitaccess to a community clinic, the remaining 26% with inadequate transit accessrepresent over 109,000 residents. The geographic disparity is striking: transitaccess reaches 70-90% in Alameda and Santa Clara Counties but is a mere33% in Contra Costa County's disadvantaged neighborhoods. For detailed listingsby neighborhood, see TABLE 4.
These figures may actually overstate accessibility, because many of these clinicsspecialize in a specific population (e.g., a specific ethnic group) or a specificservice (e.g., prenatal care). This mapping analysis considered access to allclinics and county health centers that provide primary care services to thegeneral population (e.g., school health clinics are not included).
As cuts in government funding and restrictive reimbursement policies presentcommunity clinics with serious financial challenges, uninsured patients arefinding fewer and fewer community clinics that will accept them. Indeed,

28CHAPTER 3 Inadequate Transportation Access to Health Care
community clinics would have to be much better funded in order to provide fullprimary care access. Therefore, these figures for transit access are “best case”scenarios; actual access is likely to be worse.
Alameda and Santa Clara Counties: Transit Access to Community Clinics
FINDING: Residents of disadvantaged neighborhoods in Alameda and
Santa Clara Counties enjoy good transit access to communi-
ty clinics (88% and 73%, respectively)
In Alameda County and in San Jose, areas with relatively frequent and closelyspaced transit lines, and with a relatively high concentration of community clinics,residents enjoy relatively good transit access to clinics, with transit accessibilityscores of 71-99%. Alameda County's disadvantaged neighborhoods house a totalof eleven clinics, or 1 per 20,000 people (SEE MAP 8). Relatively high-frequencybus service during midday on weekdays, including five lines that run every 10-15 minutes, provide access to an additional twelve nearby clinics. San Jose hasa slightly lower concentration of clinics - three within disadvantagedneighborhoods (or about 1 per 30,000 people), and transit service providesaccess to another five nearby clinics (SEE MAP 10).
Contra Costa County: Transit Access to Community Clinics
FINDING: Only 33% of disadvantaged community residents in Contra
Costa County have transit access to a community clinic, and
residents of two neighborhoods have virtually no transit
access.
Contra Costa County’s mediocre countywide accessibility score – 33% - maskstremendous variation between the western and eastern portions of the county.Access is worst in the suburban eastern part of the county. Residents of twoneighborhoods – Monument Corridor and Pittsburg – have virtually no transitaccess to private community clinics (1% and 5%, respectively). A notch up isBay Point, where 35% of residents have transit access, but that access is solelyon foot because buses run so infrequently that they provide no access withina half-hour travel time (SEE MAP 6).
Eastern and central Contra Costa County suffer from such terrible transit accessto community clinics because there are few clinics and very poor transit servicein most neighborhoods. The three neighborhoods in the central and easternportion of the county – Monument Corridor, Bay Point, and Pittsburg – houseonly one clinic for a combined population of over 50,000 residents with fourmore accessible on foot or by transit. There is at least a half-hour wait betweenbuses on most routes, sometimes as much as an hour, cutting off the vastmajority of residents from transit access to community clinics. As a result, fewerthan 100 people (or 0.2%) in these three neighborhoods have access to a clinicby bus; the remainder only have access on foot.

Transit access to clinics isbetter in the disadvantagedneighborhoods of Richmond,where 61-99% accessibilityscores nearly rival those inOakland, Berkeley and SanJose (SEE MAP 9). The reason isclear: each disadvantagedneighborhood in Richmond hasat least one bus line, runningevery half hour or more,connecting the neighborhood toa clinic within or near the edgeof its borders.
County-run health centers playan especially important role inContra Costa County. Two ofthe county’s health centers arelocated within this study’sdisadvantaged neighborhoods –the Nor th Richmond Center for Health and the FamilyHealth Center in Bay Point –two others are within walkingdistance: the Richmond HealthCenter near the Iron TriangleNeighborhood, and the PittsburgHealth Center just outside thePittsburg neighborhood. In BayPoint and North Richmond, theonly access to primary careservices is through county-runhealth centers.
Public Transit Access to Community Clinics
If anything, this analysis presents a brighter transportation picture than residentsactually experience. An individual clinic's target demographic or specializedservice, along with financial constraints, mean that the transit accessibilityscores must be seen as the upper limit on the number of community residentswho have adequate transit access to community clinics. Overall accessibility,limited by these other factors, may be much lower.
Despite the importance of community clinics to health care provision for low-income communities, they do not show up on the radar screen of transportationplanners. Transit route maps don't show them.19 And even in a planning process
29CHAPTER 3 Inadequate Transportation Access to Health Care
TABLE 4: PERCENTAGE OF RESIDENTS WHO HAVE TRANSITACCESS TO A COMMUNITY CLINIC
Neighborhood % of Residents
Alameda CountyCentral East Oakland 78%West Oakland 82%Elmhurst 83%Fruitvale 91%West Berkeley 94%San Antonio 99%
Contra Costa CountyMonument Corridor 1%Pittsburg 5%Bay Point 35%Southside Richmond 61%Iron Triangle 65%North Richmond 99%
Santa Clara CountyGilroy 0%Down Town San Jose 71%East San Jose 85%
Alameda Target Neighborhoods 88%Contra Costa Target Neighborhoods 33%Santa Clara Target Neighborhoods 73%
All Neighborhoods 74%
Note: Accessible destinations are within 30 minute transit travel time orhalf-mile walk from place of residence.
Source: TALC Analysis based on transit route data from MTC (2001), popula-tion data from the U.S. Census (2000), and health facility data fromCalifornia Office of State Health Planning Department (2000).

deliberately established to review essential destinations for low-incomeresidents, community clinics do not make the list. In developing their “LifelineTransit Network” (LTN), the Metropolitan Transportation Commission included awide range of destinations, but hospitals are the only health care destinationsactually included in their analysis (SEE SIDEBAR, PAGE 32).20 This oversight onlyserves to underscore the divide between transportation and health care planning.
HEALTH CARE PROVIDERS OFFER FEW ALTERNATIVES TO PUBLIC TRANSIT
Despite the limited transit access, health care providers in the Bay Area arenot stepping in to fill the gaps.
FINDING: The three county hospitals provide few or no transportation
services.
In telephone interviews THCC conducted with planners at 12 hospitals21 and 18clinics22 that serve disadvantaged communities in Alameda, Contra Costa, andSanta Clara counties, few facilities reported providing transportation for theirclients.
For example, the three county hospitals, which serve the largest number ofMedi-Cal clients, provide few or no transportation services. Only four hospitals– all in Alameda County – provide regularly scheduled service to their facility,in the form of free shuttle buses from nearby BART stations. Although patientsdo ride them, these shuttles are primarily intended for employees. Where other
30CHAPTER 3 Inadequate Transportation Access to Health Care
Santa Clara County is putting health care where thepatients are with eight school-based health clinics.School health clinics can cut down on transportationdifficulties and increase health access. Since youthare already at school, children and their parents donot have to arrange separate transportation arrange-ments. And students can seek care with a minimumof time lost from school – a routine doctor’s appoint-ment doesn’t have to mean missing a full day ofschool.
To date, there are eight school-based clinics in thecounty. Four operate in elementary schools and areopen to students, their siblings, and children in thesurrounding neighborhood. Four others operate athigh schools and are only open to students of that
high school. Three of the elementary school clinicsare open year-round, while the others are only openduring the school year. All of the clinics treat childrenregardless of their immigration status or ability to pay.
These clinics are helping the county reach its policygoal of providing health insurance for every single childin the county. For example, in suburban Gilroy, whereno adult residents have transit access to a clinic, near-ly half of the neighborhood’s children have transitaccess to the school-based health clinic at EliotElementary School.
The only major downside to these clinics is that therearen’t more of them. These eight clinics saw about8000 patients over the past year, just over 2% of thecounty’s school-age children.
SCHOOL-BASED HEALTH CLINICS

hospitals do offer taxi vouchers or bus tickets, they are typically provided on avery limited basis and only to give patients a ride home, not to bring patientsto the hospital.
FINDING: 10% of the community clinics in the three counties studied
provided any transportation services in 2000.
If hospitals provide few services, community clinics provide almost none: only2 of the 18 clinics surveyed (both in San Jose) provide transportation both toand from the clinic, but in both cases that service is limited to Medicare andMedi-Cal patients and is provided only in outstanding circumstances. Eight otherclinics report occasionally providing taxi vouchers or bus tickets on a very limitedor emergency basis; distribution is usually limited to patients with emergencies,prenatal patients near their due date, and/or disabled patients. They are alsotypically limited to one-way trips, usually from the clinic-to-home, leaving thepatient to figure out transportation in the other direction. Since the trip to theclinic may in some cases be a two-hour trek, providing only one-waytransportation does not guarantee a patient can receive health care. Eight clinicsprovide no transportation services whatsoever.
The patterns displayed in the THCC interviews are confirmed by a review ofutilization data of all the community clinics in these three counties: only 10%of the clinics provide any type of transportation services for their patients during2000, despite the fact that over 80% of their clients lived in poverty.25
MEDI-CAL'S INADEQUATE NON-EMERGENCY MEDICAL TRANSPORTATION SYSTEM
A major reason that Bay Area health care facilities do not provide transportationservices is that they do not have the money to do so. This problem is sharedby facilities throughout California and stems in par t from Medi-Cal'sinterpretation of federal regulations for "Non-Emergency Medical Transportation"(NEMT) programs.
Federal regulations require states' Medicaid programs to ensure "necessarytransportation to and from providers," but leaves the details of these up to thestates. Medi-Cal, California's Medicaid program, defines eligibility for NEMT sotightly that only the physically -disabled qualify.27 This narrow definition completelyignores the plight of transit-dependent individuals seeking health care.
As a result, California provides fewer transportation services, at a higher costper service, than other states. California provides only 169 trips per 100,000recipients, sixteen times fewer than the national average, and spends only$12.60 per recipient annually on NEMT, 3.5 times lower than the nationalaverage. California's average cost per NEMT trip is $75, nearly five times thenational average, because almost all of California's NEMT services are providedusing expensive paratransit wheelchair vans.28
31CHAPTER 3 Inadequate Transportation Access to Health Care

32CHAPTER 3 Inadequate Transportation Access to Health Care
ACTION OPPORTUNITY: LIFELINE TRANSIT NETWORK
• Generate community pressure to identify new sources of revenue – such as ContraCosta County’s transportation sales tax, increases in bridge tolls, or a potentialregional gas tax – that can be earmarked for implementation of the LTN. As Table5 below shows, fully-funding the LTN would provide significant new resources totransit providers in the three counties.
• Provide leadership to ensure that highest priority needs are met first. For example,LTN routes could help Contra Costa County’s poorly served neighborhoods getcritically-needed weekend service and more frequent buses on heavily-used lines.
• Insist on an expansive definition of the LTN. As MTC and local agencies flesh outthe preliminary LTN recommendations into local action plans, community leaderswill have to make sure the development considers new information, such as thisreport’s recommendation that community clinics must be added to the mapping ofessential health care destinations.
Serious transit investment in low-income communi-ties are long overdue. One key new opportunityexists, called the “Lifeline Transit Network” (LTN) –groundbreaking research by the MetropolitanTransportation Commission that identified key tran-sit gaps in disadvantaged communities in the BayArea.23 If funded, the LTN would significantly expandservice hours, increase frequency of existing serv-ice, and add routes in underserved areas.
Unfortunately, despite adopting the LTN as part of
the 2001 Regional Transportation Plan, MTC has notallocated any money towards implementing the LTNroutes. With transit operators around the regionfacing tight and shrinking budgets, LTN improve-ments are unlikely to occur without new funding.
By combining the preliminary recommendations inthe LTN with information from reports such as thisone, community leaders have a great opportunity toadvocate for the transit improvements our communi-ties need. To do so, community leaders will need to:
TABLE 5: LTN FUNDS NEEDED IN EACH COUNTY
Alameda CountyAC Transit (Alameda County routes) $23.0 million
Contra Costa CountyAC Transit (western CCC routes) $10.6 millionCounty Connection (central CCC) $6.3 millionTri-Delta Transit (eastern CCC) $7.1 millionWestCAT (portion of western CCC) $1.7 million
Santa Clara CountyValley Transportation Authority $22.1 million
Total Funds Needed $70.8 million
Source: MTC, 2002.24

California’s current high-cost service should not be seen as an excuse to limitcoverage. If the state were to extend coverage to anyone who has no othertransportation resources, as many other states do, it could spend less moneyper ride to provide service to many more people (SEE SIDEBAR, PAGE 34).
The good news is that solutions lie within our grasp. The bad news is thatCalifornia has so far refused to reach for those solutions.
33CHAPTER 3 Inadequate Transportation Access to Health Care
In a victory for local organizers, AC Transit, the busoperator for western Contra Costa and AlamedaCounties, just launched a pilot project to provide freetransit passes to students who qualify for the free andreduced lunch programs. This new program, begun inSeptember 2002 and funded in part by MTC, is open-ing the door to demands for free or reduced rate tran-sit passes for all low-income families.
Such a policy would not be out of the question. MostBay Area transit agencies already offer discounts (upto 75%) for the disabled, senior citizens, and chil-dren. Some welfare recipients receive bus tickets orpasses from county social service agencies, general-ly limited to work-related travel. And a policy parallelexists in California’s “lifeline service” programs forphone and gas/electric utility users, which offer
steep discounts (50% or more) to households withincomes below 150-200% of the federal poverty line.
Other states have also found ways to provide transit tolow-income families receiving Medicaid. For example, inRhode Island, community organizing and advocacy paidoff in 1994 with a new policy guaranteeing free transit toall Medicaid recipients and their dependents. Four otherstates have implemented such “Medicaid TransitPasses”, resulting in increased transit ridership anddecreased spending on expensive paratransit services.26
Of course, creating free low income transit passeswould require new revenue sources, from policiessuch as the reauthorization of Contra Costa County’stransportation sales tax or increases in fees andtaxes related to automobile use.
ACTION OPPORTUNITY: FREE TRANSIT PASSES

SUMMARY OF INADEQUATE TRANSPORTATION ACCESS TO HEALTH CARE
FINDING: 55% of respondents to the THCC survey report spending 30
minutes or more getting to their health care provider.
The GIS analysis shows that the existing public transit network provides mediocreor poor access to hospitals and wide variations in transit access to communityclinics. Health care facilities offer few to no services themselves. It is notsurprising, therefore, that for a majority of respondents to the THCC survey,their access to health care does not meet the Medi-Cal standard for managedcare programs: 55% of respondents report spending 30 minutes or more gettingto their health care provider.
These problems clearly point to the need to improve the transit access to healthcare. We must improve the frequency, hours, geographic extent, and affordabilityof bus service, revise state rules that limit non-emergency medicaltransportation, and initiate better cooperation between health care planners andtransportation planners. Fortunately, new health care and transportationresearch, including the findings of this report, are starting to lay the foundationfor greater community understanding and involvement, and offering clear andcost-effective solutions.
34CHAPTER 3 Inadequate Transportation Access to Health Care
Failing to provide adequate transportation services topeople on MediCal can have the same impact asdenying people health services. California’s narroweligibility definitions mean that Non-EmergencyMedical Transportation (NEMT) serves fewer people,at a higher cost, than in many other states withbroader definitions of NEMT eligibility.
Many other states with broader NEMT eligibility usetransportation brokerages to coordinate NEMT serv-ices. Depending on the recipients’ needs, these bro-kerages choose the most appropriate and cost-effec-tive service, whether that is transit passes, taxivouchers, or individual trips on paratransit. Indeed, arecent study of Medicaid transit passes determinedthat providing bus passes, instead of just the moreexpensive paratransit services funded by California,
can save money for Medicaid, increase revenues fortransit operators, and provide more useful trans-portation options for Medicaid recipients.29 In areasthat are too sparsely-populated for bus service, tran-sit agencies, health providers, and the relevant Medi-Cal agency could work together to leverage NEMTfunds to provide more substantial shuttle services tocommunity clinics.
Expanding eligibility for NEMT services would expandaccess to health care for people who face trans-portation barriers. Better NEMT could lead to morepreventative care and less costly-emergency servic-es. While MTC has been working with health careproviders and state legislators in an attempt to initi-ate an NEMT demonstration program, the effort hasnot yielded any new programs.30
ACTION OPPORTUNITY: EXPAND MEDI-CAL TRANSPORTATION ACCESS

FOOTNOTES
1 Grumbach, K., Seifer, S., et al. Primary Care Resources and Preventable Hospitalizations in California.California Policy Seminar, May 1995; Bryan, JL, et al. “An evaluation of the transportation needs of disadvan-taged cancer patients. Journal of Psychosoc Oncol, vol. 9, p. 23-35, 1991; Williamson, Deanna & Fast, Janet.“Poverty and Medical Treatment: When Public Policy Compromises Accessibility,” Canadian Journal of PublicHealth, vol. 89, no. 2, March-April 1998.
2 Elizabeth Butrick, “Factors in Nonattendance in Extended Evening Clinics in Contra Costa County,” unpublishedpaper for Contra Costa Health Services, 1999. This study examined the reasons patients missed appointmentsat CCHS’s Extended Evening Clinics located in Richmond, Martinez, and Pittsburg.
3 Conversation with Marty Lynch, CEO of Lifelong Medical Care, June 25, 2002.4 California Code of Regulations, Title 22, Section 53885, "Travel Distance Standards".5 The half-mile walk criterion is added to recognize that even in areas with no transit service, a facility within easy
walking distance is accessible for someone without access to a car. Transportation planners generally recognizea half-mile walk as the maximum distance that the majority of the population will choose to walk.
6 Working Partnerships, “Health Care in Critical Condition: An analysis of Health Care Standards in Silicon ValleyHospitals”, May 2002. “Vital signs” Editorial in the San Jose Mercury News, October 1, 2001 and “Closing ofthe San José Medical Center: A Tragedy in the Making” fact sheet from the Save the San José Medical CenterCoalition.
7 Barbara Feder Ostrov, “S.J. Medical Center to Close in 4 Years: Retrofitting Costs, New Era of Health CareDoom Aging Downtown Hospital”, San Jose Mercury News, June 28, 2002.
8 Save San Jose Medical Center Coalition, “Management of San Jose Medical Center to Announce Deep Cuts inServices or Closure of Hospital”, press release dated June 27, 2002.
9 Council on Graduate Medical Education. Physician Distribution and Health Care Challenges in Rural and Inner-City Areas, Tenth Report, US Department of Health and Human Services, February 1998.
10 Grumbach, K., Seifer, S., et al. Primary Care Resources and Preventable Hospitalizations in California.California Policy Seminar, May 1995.
11 Council on Graduate Medical Education. Physician Distribution and Health Care Challenges in Rural and Inner-City Areas, Tenth Report, US Department of Health and Human Services, February 1998.
12 Medi-Cal Policy Institute. Speaking Out… What Beneficiaries Say About the Medi-Cal Program, March 2000.13 Calculation based on Annual Utilization Reports of Primary Care Clinics, Healthcare Information Division,
California Office of State Health Planning Department, year 2000 reports.14 The recent Multi-City Study of Urban Inequality concluded that “racial disadvantage continues to take the form
of individual discrimination and prejudice. But these analyses also reveal that race operates even more perva-sively at the institutional and structural level -- especially in the form of highly segregated housing and labormarkets, along with the practices that keep them that way…. It is a [racial] hierarchy, that, with striking consis-tency across metropolitan areas of varied demographic composition, puts black at the very bottom of a color-coded scheme that ranks Hispanic and Asian in ascending order toward white at the top.” Alice O’Connor,Chris Tilly, and Lawrence D. Bobo, Urban Inequaliy: Evidence from Four Cities, Russel Sage Foundation, 2001.
15 A 1998 report by the Applied Research Center summarized key research findings on education and race, includ-ing the fact that “40% of public schools in large cities are ‘intensely segregated,’ meaning that more than 90%of the students they serve are children of color”, “African American students are more than twice as likely aswhite students to be suspended from school”, “Native American and African American high school students are2-1/2 times as likely as white students to be placed in vocational rather than academic classes”, and “while35% of public school students are children of color, the teaching corps remains 88% white.” Applied ResearchCenter, Education and Race: A Journalist’s Handbook, 1998.
16 Metropolitan Transportation Commission, Regional Welfare-to-Work Transportation Plan, June 2001, p. 4.
35CHAPTER 3 Inadequate Transportation Access to Health Care

17 Metropolitan Transportation Commission. Environmental Justice Report for the 2001 Regional TransportationPlan for the San Francisco Bay Area, September 2001. Table A-1(1), page A-1, based on jobs within 30 minutes.MTC’s analysis went on to claim that low-income communities and communities of color have access to agreater number of jobs within a 30 minute transit ride than communities with higher incomes or fewer people ofcolor. This claim, however, ignored the differences in car ownership. The Bay Area Transportation and Land UseCoalition completed a revised analysis, considering car ownership levels and comparing the total number ofjobs accessible within a 30-minute ride on transit or a 30-minute drive by car. The result is that the highest-income communities have access to 80,000 more jobs than the lowest-income communities. This calculationweighted estimated accessible jobs by predicted car ownership levels for each income group. Calculation basedon Table 3 (page 3-2), and Tables 8 & 9 (page 4-16).
18 Transportation Choices Forum. Downward Mobility: How location of Bay Area job growth will exacerbate conges-tion and reduce job accessibility, June 1998.
19 Based on review of route maps published by AC Transit, County Connection, Tri-Delta Transit, and ValleyTransportation Authority. One agency (Tri-Delta Transit) includes the locations of a few community clinics, wherethose clinics sell the bus agency's transit passes. Another agency (VTA) lists “Hospitals/Medical Clinics” in thelegend, but the actual map shows only hospitals and HMO medical centers.
20 Metropolitan Transportation Commission, “Lifeline Transportation Network: 2001 Regional Transportation Planfor the San Francisco Bay Area”, December 2001. The list of “medical facilities” includes “hospitals, dialysiscenters, clinics, etc.” and cites the same data source used in this report (page B-2). However, followup commu-nication with MTC staff confirmed that community clinics were left off the final list of destinations reviewed.
21 The 12 hospitals surveyed included the county hospital and the other hospitals that served the largest numberof Medi-Cal clients and those which were closest to the disadvantaged neighborhoods. Hospitals surveyedwere: Alameda County Medical Center/Highland Hospital, Children's Hospital, Summit Medical Center, AltaBates Medical Center/Ashby Campus, Kaiser Oakland, Sutter Delta, Mt Diablo Medical Center, Contra CostaRegional Medical Center, Kaiser Richmond, Good Samaritan Hospital, San Jose Medical Center, Santa ClaraValley Medical Center.
22 THCC interviewed senior staff at the six largest clinics in each county (measured by number of patients served)which were close to disadvantaged neighborhoods. Clinics surveyed were: Asian Health Service, East OaklandHealth Center, La Clinica de la Raza Fruitvale Health , Planned Parenthood Golden Gate, West Berkeley FamilyPractice, West Oakland Health Center, Brookside Community Health Center, Concord Public Health Clinic,Pittsburg Public Health, Planned Parenthood Concord, Planned Parenthood Contra Costa, Richmond PublicHealth Center, Mayfield Community Clinic, Planned Parenthood Gilroy, Planned Parenthood San Jose-Alum,Comprecare Health Center, Gardner Health Center, St. James Health Center.
23 Metropolitan Transportation Commission, “Lifeline Transportation Network: 2001 Regional Transportation Planfor the San Francisco Bay Area”, December 2001.
24 Memo from Connie Soper, MTC to Jeff Hobson, TALC, February 5, 2002. For AC Transit, cost estimate for west-ern Contra Costa County included routes wholly in the county. Cost estimate for Alameda County includes someroutes that extend into Contra Costa County or San Francisco for a portion of the route. Cost estimates devel-oped assuming fixed route transit service, which may not be appropriate to fill all gaps in the Lifeline TransitNetwork. These are preliminary operating cost estimates which do not consider additional overhead or capitalcosts that may also be associated with providing the service.
25 Annual Utilization Reports of Primary Care Clinics (year 2000 data), Healthcare Information Division, CaliforniaOffice of State Health Planning Department.
26 U.S. Department of Health and Human Services and U.S. Department of Transportation, “Medicaid TransitPasses: A Winning Solution for All”, 1999.
27 Community Transportation Association of America. Medicaid Transportation: Assuring Access to Health Care: APrimer for States, Health Plans, Providers and Advocates, January 2001. www.ctaa.org/ntrc/medical/report
28 Community Transportation Association of America. Medicaid Transportation: Assuring Access to Health Care: APrimer for States, Health Plans, Providers and Advocates, January 2001. www.ctaa.org/ntrc/medical/report
29 U.S. Department of Health and Human Services and U.S. Department of Transportation, “Medicaid TransitPasses: A Winning Solution for All”, 1999.
30 Jacob Avidon, "Improving Access to Non-Emergency Medical Transportation for Medi-Cal Recipients", CalAction(newsletter of the California Association for Coordinated Transportation), December 2000. Available onwww.calact.org. Current status of MTC efforts confirmed by email and phone conversations with MTC staff, May2002.
36CHAPTER 3 Inadequate Transportation Access to Health Care

CHAPTER 4 INADEQUATE TRANSPORTATION ACCESS TO NUTRITIOUS FOOD

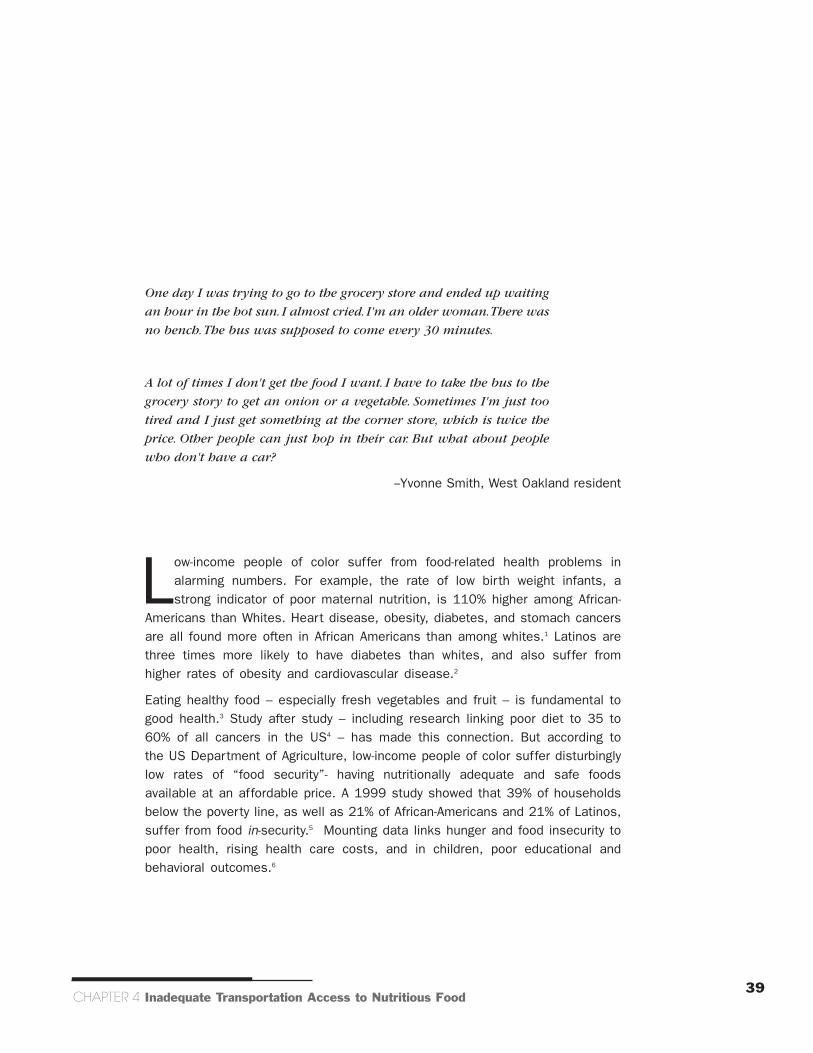
One day I was trying to go to the grocery store and ended up waiting
an hour in the hot sun. I almost cried. I'm an older woman.There was
no bench.The bus was supposed to come every 30 minutes.
A lot of times I don't get the food I want. I have to take the bus to the
grocery story to get an onion or a vegetable. Sometimes I'm just too
tired and I just get something at the corner store, which is twice the
price. Other people can just hop in their car. But what about people
who don't have a car?
--Yvonne Smith, West Oakland resident
Low-income people of color suffer from food-related health problems inalarming numbers. For example, the rate of low birth weight infants, astrong indicator of poor maternal nutrition, is 110% higher among African-
Americans than Whites. Heart disease, obesity, diabetes, and stomach cancersare all found more often in African Americans than among whites.1 Latinos arethree times more likely to have diabetes than whites, and also suffer fromhigher rates of obesity and cardiovascular disease.2
Eating healthy food – especially fresh vegetables and fruit – is fundamental togood health.3 Study after study – including research linking poor diet to 35 to60% of all cancers in the US4 – has made this connection. But according tothe US Department of Agriculture, low-income people of color suffer disturbinglylow rates of “food security”- having nutritionally adequate and safe foodsavailable at an affordable price. A 1999 study showed that 39% of householdsbelow the poverty line, as well as 21% of African-Americans and 21% of Latinos,suffer from food in-security.5 Mounting data links hunger and food insecurity topoor health, rising health care costs, and in children, poor educational andbehavioral outcomes.6
39CHAPTER 4 Inadequate Transportation Access to Nutritious Food

As with transit access to health care, inadequate transportation is an importantfactor in food security problems for low-income people of color communities. Ina survey of urban food stamp participants, 29% reported shopping at grocersoutside their neighborhoods; their biggest complaints were the lack of storesclose by and high prices.7
ANALYZING TRANSPORTATION BARRIERS TO HEALTHY FOOD
THCC's mapping analysis looked at what propor tion of residents ofdisadvantaged communities live within a half-mile walk of a supermarket,including large grocery store chains as well as independent or ethnicsupermarkets. While fresh produce and fruits may also be available at smallerstores, farmer’s markets, or even community gardens, research and anecdotalevidence indicates that supermarkets serve as the primary source of healthyfood for most low-income communities.8
The results are presented in maps shown in MAPS 11-14. TABLE 6 summarizesthe percentage of residents who live within a half-mile walk of a supermarket.The maps show the locations of disadvantaged neighborhoods, supermarketlocations, and transit routes that run on Saturdays at midday.9 Different coloredlines distinguish transit routes by frequency - red for the most frequent lines(running at least every 15 minutes) to blue for the least frequent (at least anhour between buses); transit routes that do not run at all on Saturdays atmidday are shown in grey.
RESULTS OF MAPPING ANALYSIS
This analysis showed that only 52% of residents of disadvantaged communitieshave walking access to a supermarket, leaving 200,000 people beyond walkingdistance of a supermarket (SEE TABLE 6).
FINDING: More than 200,000 people, or 48% of the residents in disad-
vantaged neighborhoods, do not have walking access to a
supermarket.
With bags full of groceries (and perhaps children in tow), taking the bus canbe difficult. Walking to the supermarket is a far better choice for those whocan, but nearly half of the residents of disadvantaged neighborhoods live beyondwalking distance from a supermarket. In the THCC survey, 11% of therespondents reported sharing rides with friends or neighbors, while 42% reportedusing a bus for grocery shopping. This transit mode share is higher than mightbe expected, and survey respondents are not necessarily representative of theentire population in these neighborhoods. By comparison, MTC projects that onaverage, residents of these disadvantaged neighborhoods make only about 21%of their total overall trips on transit. Regardless of the exact mode share, busesplay an important role in food access for the poor people of color in theseneighborhoods.
40CHAPTER 4 Inadequate Transportation Access to Nutritious Food

A close review of the supermarketsand transit line maps shows thatwhile most supermarkets arelocated along a bus line, infrequentbuses and the need to transfer,along with the difficulty of carryingloaded groceries, pose a significantbarrier to shopping by bus. Further,many people need to shop duringevening or weekend hours, preciselythe same times when there arefewer and less frequent buses.
Alameda County: Access toSupermarkets
Just under half of the residents ofAlameda County’s disadvantagedneighborhoods live within walkingdistance of a supermarket. Thispoor access is partially mitigated bythe fact that most of AlamedaCounty’s disadvantagedneighborhoods also have bus linesthat run every half-hour or better onSaturdays (SEE MAP 11). However,there is still only one line thatcomes every 15 minutes onSaturdays. For the 118,000residents beyond walking distance,even the best transit service in thisstudy will entail a long wait.
Contra Costa County: Access toSupermarkets
As with transit access to health care,disadvantaged neighborhoods in Contra Costa County stand out as having theworst transportation access to healthy food among the areas studied in this report.Only 39% of disadvantaged community residents can walk to the store; in five ofthe six neighborhoods, a majority of residents cannot walk to a supermarket. Tomake matters worse, most transit lines run every hour on the weekends, if at all(SEE MAPS 12 AND 13).
FINDING: In Contra Costa County, only 39% of disadvantaged commu-
nity residents can walk to the store, and most transit lines
run every hour on the weekends, if at all.
41CHAPTER 4 Inadequate Transportation Access to Nutritious Food
TABLE 6: PERCENTAGE OF RESIDENTS WHO HAVE WALKINGACCESS TO A SUPERMARKET
Neighborhood % of Residents
Alameda CountyElmhurst 18%West Oakland 46%West Berkeley 50%San Antonio 60%Fruitvale 70%Central East Oakland 73%
Contra Costa CountyNorth Richmond 0%Pittsburg 29%Bay Point 37%Southside Richmond 37%Monument 38%Iron Triangle 68%
Santa Clara CountyGilroy 33%East San Jose 65%Down Town San Jose 82%
Alameda Target Neighborhoods 49%Contra Costa Target Neighborhoods 39%Santa Clara Target Neighborhoods 68%
All Neighborhoods 52%
Note: Accessible destinations are within a half-mile walk from placeof residence.
Source: TALC Analysis based on population data from the U.S. Census(2000), and health facility data from California Office of StateHealth Planning Department (2000).

The combination of these factors can be devastating. For example, the closestsupermarket is 0.8 to 2.4 miles away from homes in the North Richmondneighborhood. Though this does not seem far, the supermarket’s nearest busline only runs hourly on weekends and half-hourly on weekdays. As a result,North Richmond residents often have to plan for at least a two-hour round-tripwaiting for or sitting on a bus, in addition to the time needed to shop in thestore. Grocery shopping becomes an all-day affair.
Santa Clara County: Access to Supermarkets
Walking access to supermarkets is best in Santa Clara County, where 68% oftarget neighborhood residents live within a half-mile walk of a supermarket. Evenso, more than 20,000 people live beyond walking distance. For them, infrequentweekend bus service compounds this problem. Although several routes run everyhalf-hour, many routes - especially in downtown San Jose and Gilroy, require upto an hour-long wait between buses (SEE MAP 14).
FEW GROCERY STORES IN DISADVANTAGED COMMUNITIES
The results of this mapping analysis confirm trends found in national studiesof the distribution of supermarkets. Across the county, low-income urban areascontain fewer supermarkets than urban areas with higher incomes. One analysisof 19 cities found that areas with the lowest incomes had 30% fewer storesper capita than areas with the highest incomes.10 Another study found that urbanareas with the greatest number of residents on public assistance contained 20%fewer supermarkets than those with lower percentages of residents on publicassistance.11
FINDING: Seven of the fifteen neighborhoods studied have only one
supermarket.
Mergers Make a Bad Situation Worse
Decades of consolidation in the supermarket industry have contributed todisparities in the location of grocers. Across the nation, supermarkets closeddown in central city neighborhoods and relocated to suburban markets. Forexample, in the 1970s and 80s, around 35 supermarkets closed in Boston.12
In inner city Los Angeles, the number of chain supermarkets shrunk from 44in 1975 to 31 by 1991.13
Communities have fought these trends. When a chain supermarket closed incentral Oakland, the Oakland Coalition of Congregations helped to replace itwith a Grocery Outlet with prices up to 40% cheaper than competitors. TheCoalition of Congregations also coordinated with a local produce store to providea fresh fruits and vegetables.14
42CHAPTER 4 Inadequate Transportation Access to Nutritious Food

Corner Stores: Low-Quality Food at Higher Prices
Despite such organizing efforts, many neighborhoods have no supermarkets,leaving smaller convenience or specialty stores as a primary alternative.However, at convenience stores the quality of food, in particular produce, canbe deficient. An assessment of grocers and corner markets by the West ContraCosta County Food Security Council found that residents had few choices forfresh, nutritious foods. Of the seven stores in the North Richmond and IronTriangle neighborhoods, the study found that none had satisfactory produce ormeats. Stores were not properly cleaned and were perceived by residents ashubs for drug activity and alcohol consumption.15
Not only is the food in smaller grocers often of poor nutritional quality, it is alsooften more expensive. A study of the food prices faced by households foundthat small grocers – who are most likely to be located in low-income, centralcity neighborhoods -- often have prices an average of 10% higher thansupermarkets.17 A price comparison in Los Angeles found that groceries for aminimally nutritious diet would cost a family of three $285 more per yearpurchased in inner city supermarkets than in comparable suburban stores.18
43CHAPTER 4 Inadequate Transportation Access to Nutritious Food
A key finding of this report is that too many low-income people of color communities lack the basicservices to support a healthy lifestyle, such as super-markets and health care facilities. Without facilitiesclose to people’s homes, transit improvements can-not provide convenient access. To redress this imbal-ance, the region must redirect its resources to sup-port community-led transit-oriented development thatserves neighborhood residents. These developmentsmust ensure that they increase services without dis-placing existing residents.
The Bay Area is starting to see several successfulexamples of this type of development. For example,the Fruitvale Transit Village, currently under construc-tion, will include a supermarket, community clinic,
child-care center, and other neighborhood resources.All these services will be accessible by ten busroutes and three BART lines, representing a signifi-cant increase in transit access to healthy activitiesfor local residents. Created through a planningprocess led by the Spanish-Speaking Unity Council,La Clinica de la Raza, and other community-basedorganizations, the transit village also includes a sig-nificant amount of affordable housing and locallyowned businesses.16
The Fruitvale Transit Village is a good example of thetype of transit-oriented development that can improveaccess to healthy activities without displacing exist-ing residents.
FRUITVALE TRANSIT VILLAGE

LACK OF TRANSPORTATION ACCESS LIMITS HEALTHY FOOD OPTIONS
Difficulty in accessing supermarkets harms the quality of food people eat: Morethan half (53%) of THCC survey respondents report that lack of goodtransportation has put limits on where they shop. A national study of food stampparticipants found that these limitations are one major reason why many foodstamp participants make only one large grocery trip a month, usually at thebeginning of the month.19 Making only one trip per month means recipientspurchase fewer perishables. With any remaining shopping done at conveniencegrocers, households lack fresh fruits and vegetables during the latter half ofthe month.
FINDING: More than half (53%) of THCC survey respondents report
that lack of good transportation has put limits on where they
shop.
Unfor tunately, these transpor tation barriers feed a vicious circle ofdisinvestments in disadvantaged communities. With poor quality food at cornerstores and distant supermarkets, residents spend their money outside their ownneighborhood. A 1995 study by California Food Policy Advocates found thatnearly 80% of the Fruitvale neighborhood’s potential $44.5 million in annualfood sales was lost by the neighborhood to surrounding areas.20
Not surprisingly, long walks to the supermarket and the difficulty of carryinghome heavy loads of groceries can lead residents of disadvantaged communitiesto use shopping carts to transport their groceries home. In fact, according tothe California Grocer’s Association, about 750,000 carts a year are taken inCalifornia, demonstrating a widespread lack of transit access.
44CHAPTER 4 Inadequate Transportation Access to Nutritious Food

SUMMARY OF INADEQUATE TRANSPORTATION ACCESS TO FOOD
The THCC mapping analysis shows that disadvantaged neighborhoods sufferfrom poor transportation access to supermarkets, either on foot or by publictransit. It is not surprising that THCC survey respondents reported that anaverage bus trip to a grocery store took 25 minutes. For a round-trip, that’snearly an hour in transit – not including time spent shopping or waiting forthe bus.
Disinvestment in low-income people of color communities is building an unhealthybarrier to transportation access to food for residents of those communities.Lack of access to supermarkets leads residents to depend on corner stores,which are often poor sources of nutritious food. Tearing down that barrier willrequire both a significant reinvestment in inner-city food stores, significantimprovement in transit access to stores that are beyond walking distance,consideration of special shuttle services to ferry neighborhood residents homefrom the store, and efforts to improve food quality at corner stores.
FOOTNOTES
1 Byrd, W. Michael & Clayton, Linda. “The Slave Health Deficit: Racism and Health Outcomes,” Health PACBulletin, 1991.
2 Council of Scientific Affairs. “Hispanic Health in the United States,” Journal of the American MedicalAssociation, vol. 265, no. 2.
3 US Departments of Health and Human Services and Agriculture. Nutrition and Your Health: Dietary Guidelinesfor Americans, Fifth Edition (2000), www.health.gov/dietaryguidelines
4 Cotugna, N. & Subar, A.F. “Nutrition and Cancer Prevention Knowledge, Beliefs, Attitudes, and Practices: the1987 National Health Interview Survey,” Journal of the American Dietetic Association, vol. 92, no. 9, August1992.
5 Andres, Margaret, et al. Household Food Security in the United States, 1999, Economic Research Service, US Department of Agriculture, Report No. 8, Fall 2000.
6 The Center on Hunger and Poverty has compiled an extensive bibliography of research that shows direct links between food insecurity and health outcomes. The bibiliography is available at www.centeronhunger.org/FSI/ImpactsofHunger.htm
7 Ohls, James, et al. Food Stamp Participants’ Access to Food Retailers, Food and Nutrition Service, US DepartmNutrition Service, US Department of Agriculture, July 1999.
8 California Food Policy Advocates, Investigation of Community Food Security in Three San Francisco Bay AreaNeighborhoods, June 1995.
9 Because of computational difficulties and concerns about data quality, THCC did not conduct an analysis of transit access, instead presenting that information graphically through the proximity of supermarkets toneighborhoods, along with the frequencies of nearby transit routes.
10 Cotterill, Ronald & Franklin, Andrew. The Urban Grocery Store Gap, Food Marketing and Policy Center, Universityof Connecticut, April 1995.
11 Public Voice for Food and Health Policy. No Place to Shop: Challenges and Opportunities Facing theDevelopment of Supermarkets in Urban America, 1996.
12 Turque, Bill, et al. “Where the Food Isn’t”, Newsweek, February 24, 1992.
45CHAPTER 4 Inadequate Transportation Access to Nutritious Food
13 Ashman, Linda, et al. Seeds of Change: Strategies for Food Security for the Inner City, UCLA Department ofUrban Planning, June 1993.
14 Fitelson, Mike. “Shoppers Welcome Broadway Grocery," Montclarion, June 7, 1996.15 West Contra Costa Food Security Council. Food Mapping Project Report, Summer 1999.16 For more information, see http://www.unitycouncil.org/html/ftv.html.17 Kaufman, Phillip, et al. Do the Poor Pay More for Food? Item Selection and Price Differences Affect Low-Income
Household Food Costs, Economic Research Service, US Department of Agriculture, Report No. 759, 1997.18 Ashman, Linda, et al. Seeds of Change: Strategies for Food Security for the Inner City, UCLA Department of
Urban Planning, June 1993. 19 Ohls, James, et al. Food Stamp Participants’ Access to Food Retailers, Food and Nutrition Service, US Departm
Nutrition Service, US Department of Agriculture, July 1999.20 California Food Policy Advocates, Investigation of Community Food Security in Three San Francisco Bay Area
Neighborhoods, June 1995. 21 Gottlieb, Robert, et al. Homeward Bound: Food-Related Transportation Strategies in Low Income and Transit
Dependent Communities, University of California Transportation Center, no.336, 1996.
46CHAPTER 4 Inadequate Transportation Access to Nutritious Food

CHAPTER 5 INADEQUATE TRANSPORTATION LIMITSPHYSICAL ACTIVITY


"I live near a park but it's not very safe and there's lots of trash
around. It's right next to the 680 freeway. There's a chain-link fence,
but it's got lots of holes in it. If a little kid strayed away, they could
end up on the highway."
Yvonne Tran, San Jose resident
Physical activity is a vital ingredient to good health. Like nutrition, physicalactivity contributes to daily wellness and helps prevent chronic diseasesand obesity. The Centers for Disease Control and Prevention (CDC) has
declared obesity a national epidemic.1 Nationwide obesity and physical inactivityare found disproportionately among low-income families and people of color.Among women of color, 69% of African American women and 70% of Latinasare overweight compared to 47% of white women.2 And women, especiallyAfrican American and Latinas, tend to engage in lower levels of physical activitythan men.3
To combat obesity, the CDC has urged the integration of walking and bicyclinginto everyday activities. The Healthy People 2010 initiative has set as a goal amore than 50% increase in walking and a more than doubling in bicycling forshort trips.4 However, concerns about traffic and neighborhood safety can deterwalking and bicycling, and lack of access to recreational spaces can prohibittheir use. Indeed, whereas nearly half of U.S. children walked or biked to schoolin the 1960s, today only 12% do.5
To investigate the barriers to physical activity among low-income people of colorcommunities in the Bay Area, THCC examined transportation access to parksas well as factors that influence whether people make walking and bicycling apart of their everyday activities.
PUBLIC PARKS ARE VITAL TO PHYSICAL ACTIVITY
National research has shown that availability of trails, parks, playgrounds, andother open spaces provide greater oppor tunity for exercise. Recentrecommendations from an independent task force of health care experts listedcreating or improving access to parks and recreation as the top environmental
49CHAPTER 5 Inadequate Transportation Limits Physical Activity
and policy approach to increasing physical activity.6 A review of existing researchfound that this can result in a 25% increase in the percent of people whoexercise regularly.
Deteriorating Neighborhood Parks
Local parks can offer residents much-needed space for exercise and recreation.In the THCC survey, 63% of respondents reported using their neighborhood parkor facility. Unfortunately, local parks in disadvantaged communities are oftenrun-down or lacking desirable facilities and equipment. A 1993 survey by theTrust for Public Land found that parklands were concentrated in affluentneighborhoods, to the detriment of low income, inner city communities. All 23cities surveyed showed disinvestment and deteriorating infrastructure in theirurban park facilities. Neighborhood parks had common problems of inadequatemaintenance, public safety concerns, and poor accessibility.7
Interviews with several local parks officials highlight the varying needs indifferent communities.8 In older areas such as Richmond and Oakland, thegreatest need is for funding to maintain and enhance the parks that alreadyexist. With many 40-50 year-old facilities, deferred maintenance is taking a heavytoll. In more recently developed areas such as Concord, the most pressing needis for new park facilities. The Monument Corridor neighborhood has only 0.7acres of park per 1,000 residents, ten times lower than national guidelines.9
Creative parks directors may look to sharing facilities with neighborhoodelementary schools. But as school overcrowding pushes portable classroomsonto playfields, disinvestment packs a one-two punch: poor school conditionscompounded by diminishing recreation areas.
While safe, easy to access neighborhood parks can be a key to good health,little comparative data is available on the specific facilities of local parks, andit was beyond the scope of the THCC report to conduct the site visits necessaryto create that data. This is an area that is ripe for future mapping and analysis.
Inaccessible Regional Parks
The three counties have a tremendous bounty of regional parks. The East BayRegional Park District, encompassing Alameda and Contra Costa Counties,has been purchasing and maintaining a fabulous assortment of parks that aremeant to be used and accessed by East Bay residents, all of whom have paidfor the parks through property taxes. THCC mapped transit access to theregional parks and the analysis shows that regional parks are located far awayfrom disadvantaged communities of color and are largely inaccessible by publictransit. MAP 15, shows the locations of regional parks and transit routesavailable at mid-day on Sunday.10
MAP 15 clearly shows that regional parks are largely inaccessible to residents ofdisadvantaged neighborhoods. For residents of most neighborhoods, getting toa regional park is either impossible on transit or would require an extremely
50CHAPTER 5 Inadequate Transportation Limits Physical Activity

long ride. Few communities have a transit route that directly connects theirneighborhood with a regional park, and if they do, it is likely to run every houror less frequently. For example, in Contra Costa County, County Connection'sroute 308 connects the Monument Corridor neighborhood in Concord with theMartinez Regional Shoreline, but the bus makes only six trips during its ten-hour span of service on Sundays. Getting to regional parks on transit is sodifficult that several agencies have teamed up to publish a map of how to getto regional parks on transit, and the map shows how difficult access is.
Residents of most neighborhoods would have to use at least two different buses,and in some cases more, to reach any regional park. Since most of the relevantroutes run every hour on Sundays, a trip with a transfer can take two to threehours or longer. Weekends and holidays, the times people most typically wantto use regional parks, are the same times that public transit routes run lessfrequently or stop entirely.
FINDING: 40% of THCC survey respondents report that they never go to
regional parks, but 86% say they would visit them if they
could get there on public transit.
Given this inaccessibility by public transit, it is no surprise that 40% of THCCsurvey respondents report that they never go to regional parks. The demand isclearly there – 86% say they would visit regional parks if they could get thereon public transit – but the transit network does not serve their needs. Accessto these parks seems to be reserved for families with cars.
BARRIERS TO WALKING AND BICYCLING AS EVERYDAY ACTIVITIES
The Centers for Disease Control and Prevention has urged the integration ofwalking and bicycling into everyday activities as a way to combat obesity andpromote better health. With less access to cars, low-income people of coloralready walk and bicycle more than their wealthier, whiter neighbors – MTCestimates that residents of low-income communities make 18% of their trips onfoot or by bicycle, twice the rate of residents of higher-income communities.11
Many of these communities are older, denser neighborhoods that mix houses,jobs, schools, and shopping.
FINDING: Residents of low-income neighborhoods make 18% of their
trips on foot or by bicycle, compared to 9% for residents of
other neighborhoods.
Walking: Dangerous to Your Health?
But too many low-income people of color pay a high price for using the healthiest,most environmentally sustainable modes of transportation. In Alameda, ContraCosta, and Santa Clara counties, African American and Latino pedestrians aremore likely than whites to be hit by a car and killed or hospitalized (SEE FIGURE 1:
51CHAPTER 5 Inadequate Transportation Limits Physical Activity

"RATES OF PEDESTRIAN INCIDENTS BY COUNTY AND BY RACE, 1999"). The most strikingdisparity is in Alameda County, where the rate for African Americans is 2.5 timesthe rate for whites.12
FINDING: African American and Latino pedestrians are more likely than
whites to be hit by a car and killed or hospitalized. In
Alameda County, African Americans are 2.5 times more like-
ly than whites to be hit by a car and killed or hospitalized.
And although California does not collect statistics on socioeconomic status forpedestrian victims, independent research and existing data on health insurancestrongly suggest that pedestrian victims are more likely to be low-income. A studyof 1998 statewide data showed that hospitalized pedestrians were more thanthree times more likely to be covered by Medi-Cal than the population at-large.13
This data mirrors results found nationwide, as survey after survey shows thatLatinos, African-Americans, and low-income residents are more likely to be hitand killed than whites. The CDC reports that Latinos in Atlanta were six timesmore likely to be killed than whites, and the Washington Post found Latinos insuburban Washington DC to be three times more likely to be hit and killed.14
52CHAPTER 5 Inadequate Transportation Limits Physical Activity
0
5
10
15
20
25
30
35
Alameda Contra Costa Santa Clara
White Black AsianHispanic Total
FIGURE 1: RATES OF PEDESTRIAN INCIDENTS BY COUNTY AND BY RACE, 1999
Inci
dent
s pe
r 100,0
00 p
eopl
e
Incidents = Deaths + Nonfatal HospitalizationsSource: CA DHS and CA Dept. of Finance
35
30
25
20
15
10
5
0

A summary of nearly 100 studies on child pedestrian injuries found that“pedestrian injury death rates for non-white children are consistently found tobe higher than the rates for white children.”15
Transportation Planners Plan for More Traffic, Less Walking
Traffic engineering is a major part of the problem. For decades, transportationplanners have made moving more cars more quickly their highest priority. Thishas meant widening streets, increasing speed limits, removing crosswalks, andchanging laws to give vehicles the advantage as often as possible. Since trafficspeed and traffic volume are two factors with the highest correlation topedestrian injury and death, the result is to make the streets less and lesssafe for pedestrians.
This frightening trend hits low-income people of color the hardest because theyare less likely to own a car and more likely to walk, bike and take public transit– resulting in greater exposure to the dangers of the street. In addition, moreaffordable housing is located along the high-speed, high-volume arterial streetsthat are more dangerous for pedestrians. With traffic engineers optimizing vehiclespeed at the cost of people's lives, streets are becoming speedways anddiscouraging many from walking at all. The consequences are deadly: while 96%of pedestrians survive a 15 mph collision, pedestrians hit by a car traveling 44mph have a mere 17% chance of survival.16
The result is that people of all ages, but especially children, are walking less.Although comparative data was not available at the local level, national andregional data shows that people, especially children, are walking less than theyused to. The percentage of Bay Area children walking to school was cut in half,from 52% to 26%, between 1965 and 1990, and the share of trips made onfoot fell for people of all ages during that same period.17 Nationwide, for childrenwho live within one mile of their school, the percentage of children walking toschool dropped plummeted from 87% to 31% during 1969 to 1995.18
Redressing this problem will require making the walking and bicyclingenvironment much safer. But California is falling far short. While the state ranks2nd in share of pedestrian deaths compared to all traffic-related fatalities, itranks 50th in spending on pedestrians. Although about 20% of all traffic fatalitiesare pedestrians, the state spends less than 1% of its federal traffic safetymoney on pedestrian safety (SEE SIDEBAR).19
Fear of Crime as a Deterrent to Walking
In addition to traffic safety, fears surrounding the level of safety and crime inan area may deter walking. A study conducted in five states showed thatresidents who perceived their neighborhoods to be unsafe were significantlymore likely to be physically inactive. This physical inactivity was highest amongwomen, seniors, people of color, people with a high school degree or lower, andpeople with annual incomes below $20,000.20
53CHAPTER 5 Inadequate Transportation Limits Physical Activity

54CHAPTER 5 Inadequate Transportation Limits Physical Activity
ACTION OPPORTUNITY: MAKE IT SAFE(R) TO WALK AND BICYCLE
Upcoming opportunities to secure and expand necessary funding include:
• FEDERAL: national allies have lined up Congressional sponsors to introduce the program whenCongress reauthorizes the federal transportation bill (“TEA-3”) in 2003.
• STATE: increased state funding of “Safe Routes to Schools” – and a commitment to making ita permanent program that includes access to local parks.
• REGIONAL: increased funding for pedestrian and bicycle safety and access from MTC, and initi-ation of a “Safe Routes to Transit” program.
• LOCAL: Significant pedestrian and bicycle safety funding in the reauthorization of Measure C,Contra Costa County’s transportation sales tax, as well as a variety of other education,enforcement, and engineering actions to support SR2S.
Although California ranks 50th among the statesin spending on pedestrians, it is also home to oneof the most innovative new programs in the coun-try for pedestrian safety: “Safe Routes to School”(SR2S). In 1999, the Surface TransportationPolicy Project led a wide-ranging coalition of com-munity groups, pedestrian activists, and publichealth proponents, along with teachers andschool leaders, to secure passage of this innova-tive new statewide program.
The California Department of Health Services andcommunities throughout the state have startedpromoting a SR2S approach that combines edu-cation, engineering, and enforcement. “Walk toSchool Day” events highlight the need for safer,accessible, and more enjoyable walking routes.Engineering approaches include wider sidewalks,more visible pedestrian crossings, clearly markedbike lanes or separate paths and trails, and traffic
calming to slow traffic speeds. And vigorous butfair enforcement of speed laws can do a lot toreduce injuries and fatalities.21
These programs are funded in part by the newstate SR2S program, which dedicates $20 millionin federal transportation safety funds to bicycleand pedestrian safety projects. The program hasproved tremendously popular – applications forthe first round outstripped available funding by sixto one! School districts, public works depart-ments, and transportation agencies need match-ing funds, so regional and local transportationfunding sources need to devote more funding topedestrian and bicycle safety.
Building on the success of SR2S, pedestrian andbicycle advocates are looking to the MetropolitanTransportation Commission to develop a “SafeRoutes to Transit” program to improve pedestrianand bicycle safety and access to transit hubs.

55CHAPTER 5 Inadequate Transportation Limits Physical Activity
SUMMARY OF HOW INADEQUATE TRANSPORTATION LIMITS PHYSICAL ACTIVITY
Deteriorating neighborhood parks and regional parks that are inaccessible bypublic transit make it difficult for low-income people of color to enjoy recreationalactivities. And although low-income people of color in the Bay Area are morelikely to walk or bicycle, speeding traffic on local streets and fear of crimesinhibits the integration of bicycling and walking into everyday activities.
Encouraging and allowing physical activity for low-income people of color in theBay Area will require making the streets safer for pedestrians and bicyclists,improving the quality of neighborhood parks, and expanding the transitaccessibility of regional parks.
FOOTNOTES
1 Centers for Disease Control and Prevention, “Obesity and Overweight: A Public Health Epidemic”, CDC electron-ic fact sheet dated May 13, 2002, available at http://www.cdc.gov/nccdphp/dnpa/obesity/epidemic.htm.
2 Eberhardt MS, Ingram DD, Makuc DM, et al. Urban and rural health chartbook. Health, United States, 2001.National Center for Health Statistics, 2001.
3 US Department of Health and Human Services. Healthy People 2000: Trends in Racial and Ethnic-SpecificRates for the Health Status Indicators: United States, 1990-98, No. 23, January 2002.
4 US Department of Health and Human Services. Healthy People 2010, 2nd edition. 2000. 5 US Department of Transportation, “Transportation Characteristics of School Children, 1969 Nationwide
Personal Transportation Study”, July 1972, available at www.fhwa.dot.gov/ohim/1969/1969page.htm. Currentstatistics from S. Ham, “Calculations from the 1995 Nationwide Personal Transportation Survey”, unpublisheddata, Centers for Disease Control and Prevention, 2000.
6 Centers for Disease Control and Prevention, “Increasing Physical Activity: a Report on Recommendations of theTask Force on Community Preventive Services”, Morbidity and Mortality Weekly Report 2001; 50 (No. RR-18).
7 The Trust for Public Land, Cities Initiative, Opportunities and Strategies, January 1994.8 Phone conversations with Jesse Washington, City of Richmond, and Mark Devin, City of Concord, Thursday, July
11, 2002.9 National Recreation and Parks Association, Recreation, Park, and Open Space Standards and Guidelines, 1983.
These guidelines suggested that a community’s park system, at a minimum, consist of a core system of mini-parks, neighborhood parks, and community parks with at least 6.25-10.5 acres of open space per 1,000 popu-lation. In response to lawsuits from developers, NRPA’s more recent guidelines (1995) do not use a per-capitastandard, opting instead for more detailed guidelines for different types of parks. Conversation with BarryTindall, NRPA Policy Director, July 2002.
10 Because of variations between the three counties surveyed, there is no single definition of a "regional park."Map 15 shows the publicly-accessible areas of open space in the three counties studied. In Contra Costa andAlameda Counties, covered by the East Bay Regional Parks District, Map 15 shows publicly-accessible openspace designated as a Regional Park, Regional Shoreline, Open Space, Regional Preserve, RegionalWilderness, or State Park. In Santa Clara County, with its own county parks district, Map 15 shows countyparks.
11 Metropolitan Transportation Commission, “Environmental Justice Report for the 2001 Regional TransportationPlan for the San Francisco Bay Area,” September 2001. Table 4, page 3-3.

12 California Department of Health Services, Death Records; California Office of Statewide Health Planning andDevelopment, Hospital Discharge Dataset, California Department of Health Services, Epidemiology andPrevention for Injury Control Branch; Department of Finance. Based on original analysis by Latino Issues Forumand Surface Transportation Policy Project. Data available at www.dhs.ca.gov/epicdata.
13 Of hospitalized pedestrians under the age of 65 in 1998, 35% were covered by Medi-Cal. Of that same agegroup in the population at large, only 11% were covered by Medi-Cal. Analysis by Latino Issues Forum, based onCalifornia Office of Statewide Health Planning and Development, Hospital Discharge Dataset, 1998, andCalifornia Department of Health Services, Epidemiology and Prevention for Injury Control Branch, presented inSurface Transportation Policy Project, Dangerous by Design: Pedestrian Safety in California, September 2000.
14 Sylvia Moreno and Alan Sipress. “Fatalities Higher for Latino Pedestrians; Area’s Hispanic Immigrants Apt toWalk but Unaccustomed to Urban Traffic,” Washington Post, August 27, 1999.
15 Agran P, Winn D, Anderson C. “Epidemiology of Pediatric Pedestrian Injuries.” Paper presented at the Panel toPrevent Pedestrian Injuries, convened by Centers for Disease Control and Prevention and U.S. Department ofTransportation.
16 Rudolph Limpert, Motor Vehicle Accident Reconstruction and Cause Analysis, 1994, cited in CaliforniaDepartment of Health Services, brochure on “Safe Routes to Schools”, February 2001.
17 Charles Purvis, Metropolitan Transportation Commission, “Changes in Regional Travel Characteristics and TravelTime Expenditures in the San Francisco Bay Area: 1960-1990”, May 1994. Table 16.
18 Data from 1969 based on Federal Highway Administration, “Transportation Characteristics of School Children,NPTS Survey of 1969, Report No. 4”, 1972. Data from 1995 provided by S. Ham, Centers for Disease Controland Prevention, 2000, based on National Personal Transporation Survey of 1995.
19 Surface Transportation Policy Project, Dangerous by Design: Pedestrian Safety in California, September 2000,p.21.
20 Weinstein, A, et al. “Neighborhood Safety and the Prevalence of Physical Inactivity - Selected States, 1996”,Morbidity and Mortality Weekly Report, Centers for Disease Control and Prevention, vol. 48, no. 7, February1999
21 California Department of Health Services, brochure on “Safe Routes to School”, February 2001. Available atwww.dhs.ca.gov/routes2school.
56CHAPTER 5 Inadequate Transportation Limits Physical Activity

CHAPTER 6 CONCLUSIONS & RECOMMENDATIONS

The mapping, survey, and other data presented in this report clearlydemonstrate that the Bay Area’s most disadvantaged communities facesignificant transportation barriers to healthy activities. In low-income
communities of color, where car-ownership rates are low, inadequate publictransit limits access to hospitals, community clinics, supermarkets and regionalparks. People of color are disproportionately injured and killed on unsafe streets– a health crisis in itself that also contributes to fears of walking and bicycling.
The experience in each of these communities varies, but none is adequatelyserved:
Alameda County
• Only 28% of the residents of Alameda County’sdisadvantaged neighborhoods have transit access to ahospital, leaving over 160,000 residents without transitaccess.
• Alameda County neighborhoods have the best access tocommunity clinics – 88% of residents have transit accessto a clinic.
• Central East Oakland ranks last among the county’sdisadvantaged neighborhoods for transit access to bothhospitals and community clinics: 0% of residents havetransit access to a hospital.
• Despite the presence of several hospitals near theneighborhood, only 11% of West Oakland residents havetransit access to a hospital.
• Less than half of the residents of Alameda County’sdisadvantaged neighborhoods have walking access to asupermarket.
• In Alameda County, African-American pedestrians are 2.5times more likely than white pedestrians to be hit by acar and killed or hospitalized.
59CHAPTER 6 Conclusions and Recommendations

Contra Costa County
• Contra Costa County ranks last, of the three countiesstudied, in every category measured: 20% of residents ofdisadvantaged neighborhoods have transit access to ahospital, 33% have transit access to a community clinic,and 39% have walking access to a supermarket.
• Four of the county’s six neighborhoods have 0% transitaccess to a hospital.
• North Richmond residents have 0% access to hospitalsand supermarkets.
• In the Monument Corridor neighborhood of Concord, nothaving a car means not getting to health care: residentssuffer from 0% transit access to hospitals and only 1% toclinics, despite the presence of facilities nearby.
• Pittsburg and Bay Point, in the eastern county, are theworst off, with 0% access to hospitals and no more than37% access to community clinics or supermarkets. Thispoor access is because the neighborhoods have fewfacilities and extremely poor transit service.
Santa Clara County
• Of the three counties studied, Santa Clara County’sdisadvantaged neighborhoods have the best transportationaccess to hospitals and supermarkets.
• Access to hospitals is threatened by the planned closureof the San Jose Medical Center, which would reduce transitaccess to hospitals from 42% to 0% for residents ofdowntown San Jose, and from 74% to 48% for residentsof East San Jose.
• Residents of suburban Gilroy suffer from poor transitaccess under all the measures in this report, including 0%transit access to clinics, 7% to hospitals and 33% tosupermarkets.
The findings of this report are disturbing. But they point to specific policysolutions that can tear down these barriers. And the information contained inthis report is timely, as billions of dollar in upcoming transportation fundingproposals provide a key window of opportunity to fund these solutions.
This report offers us a new way of looking at transportation as a vital publichealth resource, opening the doors for new forms of collaboration and coalitionbuilding.
60CHAPTER 6 Conclusions and Recommendations

Most importantly, the findings of this report demand leadership and a seriouscommitment to change. Community leaders, organizers, advocates, andpolicymakers can and should play a role in making sure that the needs of low-income communities go to the “front of the bus”.
WHAT CAN WE DO?
1. Meet basic transit needs of low-income communities of color.
First and foremost, we must begin by insuring that low-income communities ofcolor have their basic transit needs met. Health access problems reflect alarger pattern of transit inequities that undermine all aspects of community wellbeing. This report’s findings present compelling new evidence on the need fortransit justice.
Fortunately, the policy solutions are well within our grasp. Specifically, we must:
• Fund the Lifeline Transit Network to improve bus servicein low-income communities of color. Strong communitypressure can help insure that new regional and localrevenues such as proposed bridge tolls and Contra CostaCounty’s Measure C, suppor t the LTN (SEE “ACTION
OPPORTUNITY” ON PAGE 32).
• Provide free transit passes to low-income families toeliminate economic barriers to transit use (SEE “ACTION
OPPORTUNITY” ON PAGE 33).
2. Make health access a top priority in transportation policy and planning.
Inadequate public transit not only underserves our communities, it makes itharder for health care providers to do their job. Leaders from both sectorsmust play a critical role in elevating health issues on the transportation agenda.For example, we can:
• Require transit agencies to analyze the impact of proposedroute cut backs or expansions on access to healthyactivities, basing decisions on an assessment thatincludes a route’s importance in insuring access to healthcare, healthy food, and physical activity. This analysis couldbe done as part of an Environmental Impact Report or asan independent analysis.
• Promote innovative collaborations between transit agenciesand health care providers, such as special shuttle servicesand health facility-based transportation coordinators.
• Include community clinics – not just hospitals – as keydestinations in MTC’s Lifeline Transit Network.
61CHAPTER 6 Conclusions and Recommendations

• Make it safer to walk and bicycle by developing safe routesto schools, parks, and transit. (SEE “ACTION OPPORTUNITY” ON
PAGE 54)
• Expand transit accessibility of regional parks by securingnew funding sources for transit to regional parks anddeveloping innovative new services to provide access.
3. Make Medi-Cal transportation assistance available to all recipients.
Any kind of health insurance is useless if people can’t get to the doctor. Toensure real access to health care, we need California to follow the lead of manyother states around the nation in putting existing Medicaid policies to work forour communities by developing a useful Non-Emergency Medical Transportation(NEMT) system. California must:
• Expand NEMT eligibility to include all people without accessto a car – not just people with physical disabilities (SEE
“ACTION OPPORTUNITY” ON PAGE 34).
• Allow NEMT transportation funds to be used for publictransit, including provision of transit passes.
4. Direct public resources towards disadvantaged neighborhoods without dis-placing existing residents.
Ensuring healthy access means re-envisioning the way we structure ourcommunities. We must invest not only in transit, but also in development oftransit-accessible services and facilities designed for the low-income familiesthat live in these communities, so that people can live close to their jobs andthe services they need. Specifically, we must:
• Reward cities and counties that build transit-accessibleaffordable housing in these communities with additionaltransportation funds, through programs such as MTC’s“Housing Incentives Program.”
• Invest in transportation improvements that promote thelivability of these communities, such as transit villages,pedestrian plazas, bicycle facilities, and streetscapeimprovements, through programs such as MTC’s“Transportation for Livable Communities” and the federaltransportation enhancements program. Planning for theseimprovements must led by community-based organizations(SEE SIDEBAR ON FRUITVALE TRANSIT VILLAGE, PAGE 43).
• Make transit access to health care and healthy activitiesan explicit requirement in local land use planning anddevelopment.
62CHAPTER 6 Conclusions and Recommendations

5. Guard against reductions in transportation access to health care.
Access depends on location. And with a growing population, the health careindustry should be opening new facilities, not closing or significantly reducingservice at existing ones that disadvantaged communities depend upon. Toprevent reductions in transportation access to health care, we must:
• Make transit access a key consideration in any decisionto close or significantly reduce services at a health carefacility. California law currently requires the AttorneyGeneral to prepare a health care impact statement incases where a for-profit entity is taking over a non-profithospital. Transit access should be a major considerationin this health care impact statement.
• Ensure that when closures or relocations of service dooccur, health care facilities implement plans to mitigatelost transit access. For example, health care facilitiescould provide shuttle services or support expansion ofpublic transit to assist residents who formerly enjoyedaccess by transit or foot.
• Ensure that health care facilities plan for transportationaccess for the transit-dependent when considering thelocation of new facilities.
6. Support innovative efforts to ensure food security in these neighborhoods.
Increasing transportation access to healthy food must rely on a combination ofefforts to improve transportation access and frequency, improve food quality atexisting corner stores, and increase the number of full-range markets indisadvantaged neighborhoods. We must:
• Develop shopper shuttles to supermarkets, initiated by thestores or through public-private partnerships, including acombination of grocers, transit providers, paratransitproviders, food security councils, and communitydevelopment corporations (CDCs).
• Help corner stores improve their food quality and operationthrough direct subsidies, cash incentives, anddevelopment tools.
• Reinvest in inner-city supermarkets by directinggovernment and philanthropic funding to communitydevelopment corporations (CDCs) that work with localbusiness people and grocery chains to construct new orrebuilt supermarkets in disadvantaged neighborhoods.
63CHAPTER 6 Conclusions and Recommendations


APPENDIX I- MAPPING SOURCES AND TRANSIT ACCESS METHODOLOGY
The research for this report included conducting sophisticated GraphicalInformation Systems (GIS) mapping analysis to estimate how many people ineach neighborhood have acceptable non-automobile transportation access tohealth care facilities and supermarkets. All mapping analysis was conducted byGreenInfo Network under the direction of the Transportation and Land UseCoalition.
Data sources:
DISADVANTAGED NEIGHBORHOODS: Northern California Council for the Community(NCCC), 1997. The NCCC guide identified fifteen neighborhoods in the threecounties studied as the most impoverished neighborhoods in their county. Afterconsultation with community groups in each neighborhood, THCC usedgeographic boundaries for each neighborhood that conform to the residents’definition of their own neighborhoods, rather than census tract boundaries usedin the NCCC report. Data for relevant census geographies was allocatedaccordingly.
POPULATION, PEOPLE OF COLOR: 2000 Census using dataset provided by Geolytics.
LOW-INCOME HOUSEHOLDS: provided by MTC, based on ABAG Projections 2000, bytraffic analysis zone.
TRANSIT LINES: MTC 2001. Transit route shape files, categorized by frequency atdifferent times of the day and week, were compiled and provided by MTC basedon public-available maps and schedules from individual transit operators.
HOSPITALS: California Office of Statewide Health Planning and Development(OSHPD), 2000. Hospitals used include all hospitals within the OSHPD 2000database holding a “General Acute Care Hospital” license. The location andcontinuing operation of all hospitals identified as accessible through this analysiswere confirmed by phone calls to the hospital.
SUPERMARKETS: U.S. Department of Agriculture (USDA), 1999. Data set includesstores authorized to accept food stamps that USDA lists as having the firm type“supermarket”, which USDA defines as any store with annual gross salesexceeding $2 million.
PUBLICLY ACCESSIBLE OPEN SPACE: Based on “Bay Area Open Space” layers fromGreenInfo Network and Bay Area Open Space Council (BAOSC), 2002. Additions,modifications and updates are made periodically by GreenInfo Network. The datapresented includes open space parcels with full or limited public access,including all parcels larger than 10 acres and selected smaller parcels.
COMMUNITY CLINICS: California Office of Statewide Health Planning andDevelopment (OSHPD 2000) and county health departments (2002). Clinics usedinclude clinics in the OSHPD 2000 database holding a “Community Clinic” or“Free Clinic” license. In addition, mapping analysis covered county-run healthfacilities that provide general medicine services, according to data available from
65APPENDIX I Mapping Sources and Transit Access Methodology

county staff and/or county health department websites. The data in these listswere reviewed by primary informants in each county. Based on this review,clinics were eliminated from consideration if they have ceased operating, areonly open for very limited hours, or do not offer general medicine services;others were added if they have begun operations since the collection of 2000OSHPD data.
Health Care Transit Accessibility Analysis:
This report defined “transit access” to health care as the ability to reach ahealth care facility within a 30-minute travel time on transit or a half-mile walk.The GIS analysis to calculate this transit access was based on the addressesof health care facilities, detailed public transit route data, and population dataat the census block level.
The identification of health care facilities within a 30-minute transit travel timewas calculated based on transit routes running at mid-day on weekdays. Totaltravel time was calculated as the sum of time spent:
• walking to a bus stop or BART/light-rail station;
• waiting for the bus/train to arrive;
• traveling on the bus/train; and
• walking from the bus stop/train station to the health carefacility.
Walk speed is assumed to be 2 miles per hour. Wait time is assumed to behalf the frequency of the bus or rail line. Transit vehicle speeds were assumedat a uniform rate for each operator, based on average speeds reported by eachoperator (varying from 11mph for AC Transit to 14 mph for Tri-Delta Transit).Travel times between BART stations were calculated from the “All About BART”schedules and fares brochure (dated November 2000). Walk distance from busstop/train station to health care facility was calculated directly from maps. Walkdistance from home to bus stops and light rail lines was assumed to be 1/4mile, while allowable walk distances to BART stations was calculated throughthe analysis, up to a maximun of 1/2 mile.
For each potentially accessible health facility, the above assumptions wereentered into ESRI's ArcView 3.2a Network Analyst extension to calculate whichclinics were accessible. The results of Network Analyst were used to calculateand draw transit-accessible areas around each bus or light-rail line that providesaccess to a health facility. Buffers were a standard 1/4-mile for all bus linesand light rail stops. Network Analyst results and buffers for BART stations werecalculated individually for each possible BART-station-to-health-facility pair.
66APPENDIX I Mapping Sources and Transit Access Methodology

The identification of health care facilities within a half-mile walk wasaccomplished by simply drawing a half-mile radius circle around each facility.Buffers were added for all clinics located inside or within a half-mile of a targetneighborhood.
Once the buffers were calculated, the number of residents within a given areawho have transit access to a health facility was calculated by determining whichcensus blocks (from 2000 Census) were within those buffers. For census blocksthat were partially covered by a buffer, the census block was deemed accessibleif the geographic center of the block was within the buffer.
The percentage of people with transit access to a health facility was determinedby dividing the number with access by the total number of residents of a givenneighborhood.
Supermarket Proximity Analysis
Mapping analysis simply calculated how many people in each neighborhood haveaccess to a supermarket within a half-mile walk.
The identification of accessible supermarkets was accomplished by simplydrawing a half-mile radius circle around each supermarket. Buffers were addedto the database for all supermarkets located inside or within a half-mile of atarget neighborhood. Once the buffers were calculated, numbers and percentageof residents with walking access to a supermarket was calculated using thesame method as for health facilities.
67APPENDIX I Mapping Sources and Transit Access Methodology


APPENDIX II: SURVEY METHODS AND FINDINGS
To complement the other research aspects of this project, THC gathereddescriptive data through a survey of 699 residents in the target communities.
Survey Development
The THC survey questions were drafted by staff of the THC collaboratingorganizations – PUEBLO, CTWO, and TALC -- with academic guidance and reviewby faculty from the San Francisco State University (SFSU) Department of HealthEducation. Translation of the survey into Spanish was provided by PUEBLO.
Survey Methods
We have used a convenience sampling technique, working with other community-based organizations in key target locations to help administer the survey andcollect data. The intent of this survey is not to provide a representative samplethat could be compared to travel surveys conducted by transportation agencies.Instead, this form of community-based research allows us to get a descriptivepicture of the transportation issues faced by key constituencies in low incomecommunities of color in the Bay Area.
Organization Neighborhood Survey outreach
7th St McClymonds West Oakland 160 surveys, mostly African Corridor Initiative American, at bus stops,
senior centers, etc.
Building Opportunities Oakland 25 surveys, Latino/African for Self-Sufficiency American/Asian, at SROs(BOSS)
C-Beyond Concord 89 surveys, mostly Latino,at a community health fair
People United for East Oakland 31 surveys, mostly Africana Better Oakland American, at schools and(PUEBLO) churches
Neighborhood House Richmond/ 67 surveys at communityof North Richmond North Richmond career center; mostly
African American
Perinatal Council Pittsburg 50 surveys conducted door-to-door, mostly Latinos
Services, Immigrant San Jose 277 surveys, mostly Latino,Rights, and Education conducted at community(SIREN) meetings
69APPENDIX II Survey Methods and Findings

Data Analysis
The SFSU academic team was responsible for entering the survey data, developingqueries, and generating the analysis, which is included in the final report.
The data analysis presented some challenges. For example, initial piloting of thesurvey instrument revealed that respondents were interpreting certain questionsdifferently, which required us to conduct more interviewer training, and to takeinto account these differences in the data entry to allow for this variability ininterpretation. Furthermore, the piloting of translations revealed someinconsistencies in how questions were understood by respondents in Englishversus other languages. We addressed this issue both by working with interviewersand by allowing for more variability in interpretation in the data entry.
Survey Questions and Findings
Findings are reported as a percentage of respondents answering each question.Percentages may not add up to 100% due to rounding error. Percentages arenot reported for questions that allow multiple answers (indicated with “CHECKALL THAT APPLY” below).
70APPENDIX II Survey Methods and Findings
a. Drive Self 142 – 31%b. Get a Ride 39 – 8%c. Bus 225 – 49%d. BART 8 – 2%e. Light Rail 7 – 2%f. Walk 35 – 8%g. Bike 4 – 1%h. Other 0 – 0%
a. Drive Self 167 – 30%b. Get a Ride 59 – 11%c. Bus 232 – 42%d. BART 4 – 1%e. Light Rail 0 – 0%f. Walk 79 – 14%g. Bike 4 – 1%h. Other 3 – 1%
a. Drive Self 151 – 27%b. Get a Ride 43 – 8%c. Bus 333 – 59%d. BART 7 – 1%e. Light Rail 2 – 0%f. Walk 18 – 3%g. Bike 0 – 0%h. Other 7 – 1%
1. Going to work? N=460
2. Grocery shopping? N= 548
3. Going to the doctor? N=564

71APPENDIX II Survey Methods and Findings
a. Drive Self 130 – 26%b. Get a Ride 68 – 13%c. Bus 188 – 37%d. BART 8 – 2%e. Light Rail 1 – 0%f. Walk 106 – 21%g. Bike 6 – 1%h. Other 1 – 0%
a. Drive Self 89 – 22%b. Get a Ride 13 – 3%c. Bus 123 – 31%d. BART 0 – 0 %e. Light Rail 0 – 0%f. Walk 172 – 43%g. Bike 0 – 0 %h. Other 3 – 1%
0 254 – 38%1 231 – 35%2 115 – 17%3 37 – 6%4 15 – 2%5 7 – 1%6 3 – 0%7 2 – 0%
a. ❑ Yes 591 – 85%
a. Inconvenient 153b. Doesn’t run at night 139c. Doesn’t run on weekends 109d. Takes too long 368e. Doesn’t go where I need to 157f. Doesn’t come often enough 281
a. Yes 529 – 76%
a. Yes 452 – 65%
a. family doctor 143 – 27%b. clinic 283 – 54%c. the emergency room 98 – 19%
4. Going to the park or otherrecreational activities?N=508
5. Getting your children toschool? N=400
6. How many cars does yourhousehold own? N= 664
7. Do you use public transit?N= 699
8. What are some of the prob-lems you have experiencedwith public transit?(check all that apply)
9. Do you have weekend transitservice in your neighborhood?N= 699
10. Does your family havehealth insurance? N= 699
11. When your household needsmedical care where do yougo? N= 524
Part II: Health Access Questions

72APPENDIX II Survey Methods and Findings
<15 minutes 116 – 17%15-29 minutes 182 – 27%30-44 minutes 184 – 27%45-59 minutes 68 – 10%60-90 minutes 88 – 13%> 90 minutes 37 – 5%
7.7 Miles Average
a. Yes - 344 - 49%
a. Drive Self 136 – 28%b. Get a Ride 172 – 35%c. Bus 124 – 25%d. BART 5 – 1%e. Light Rail 0 – 0%f. Walk 10 – 2%g. Bike 1 – 0%h. Other 43 – 9%
<15 minutes 114 – 18%15-29 minutes 242 – 39%30-44 minutes 170 – 27%45-59 minutes 39 – 6%60-90 minutes 54 – 9%> 90 minutes 7 – 1%
Name:Location:
a. Supermarket 490 – 74%b. Farmers Market 34 – 5%c. Corner Store 30 – 5%d. Specialty Food Store 77 – 12%e. Ethnic Food Store 13 – 2%f. Other 20 – 3%
12. How long does it take youto get there from home? N=675
13. How far away is it fromhome? N=581
14. Have your ever missed amedical appointment, beenlate for an appointment, ornot gone to seek medicalcare due to transportationproblems?N=699
Why/what’s your story?
15. How would you get to theemergency room?N = 491
(Large number with multi-ple responses where secondresponse was “taxi”)
16. How long would it take foryou to get there?N = 626
17. What is the name of thegrocery store where you doMOST of your grocery shop-ping?
18. What type of store is it? N = 664(CHECK ONLY ONE)
Part III: Grocery and Food Access

73APPENDIX II Survey Methods and Findings
a. Yes 661 – 95%
<15 minutes 246 – 36%15-29 minutes 246 – 36%30-44 minutes 127 - 19%45-59 minutes 13 – 2%60-90 minutes 35 – 5%> 90 minutes 7 – 1%
5.0 miles Average
a. Yes 372 – 53%
a. Supermarket 219b. Farmers Market 118c. Corner Store 284d. Specialty Food Store 124 e. Ethnic Food Store 65f. Other 79
a. Yes 514 – 74%
a. Yes 561 – 80%
a. Yes 437 – 63%
19. Do they have fresh fruitsand vegetables? N=699
20. How long does it take youto get there from home?N=674
21. How far away is it from yourhome? N = 554
22. Do you believe that yourfood shopping options arelimited in any way due to alack of good transporta-tion?N=699
Why/what’s your story?
23. What other types of storedo you buy food at?(check all that apply)
24. Do you have a park orrecreation facility withinwalking distance of yourhome?N=699
25. Can you get to a park orrecreation facility usingpublic transit?N=699
26. Does your family use yourlocal park or recreationcenter regularly?N=699
Part IV: Recreation Access

74APPENDIX II Survey Methods and Findings
a. Inconvenient 78 b. Too far away 161c. Not safe to walk to 195d. Takes too long 174e. Other 25
0 251 – 40%1-5 282 – 45%6-11 60 – 10%12-23 21 – 3%>23 16 – 3%
a. Lake Chabot 88b. Marin Headlands 25c. Tilden Park 85d. Mount Diablo Regional Park 59e. Coyote Hills Regional Park 14f. Others (most are not “regional” parks)555 k. Do not go to Regional parks 191
a. Drive Self 134 – 30%b. Get a Ride 115 - 26%c. Bus 150 – 34%d. BART 6 – 1%e. Light Rail 1- 0%f. Walk 40 – 9%g. Bike 1 – 0%h. Other 0 – 0%
a. Yes – 604 – 86%
13.9 miles average
<1 19 – 4%1-3 78 – 18%4-5 37 – 9%6-10 102 – 24%11-25 116 – 27%26-50 71 – 17%>50 5 – 1%
27. What are the biggest trans-portation problems you facein getting to your local parkand recreation center?
28. How many times a year doyou go to a regional parksuch as such as LakeChabot and Tilden Park?N=630
29. Which regional parks do youuse?
(CHECK ALL THAT APPLY)
30. How do you get there fromhome? N=590
31. Would you go to theseareas with better trans-portation?N=699
32. What is the distancebetween where you workand where you live? N=428
(many of the respondents do notwork)
33. At what time of day do yougo to work?
34. At what time of day do youcome home from work?
Section V: Work

75APPENDIX II Survey Methods and Findings
Alameda County 176 – 25%Contra Costa County 190 – 27%San Francisco County 1 – 0%Santa Clara County 254 – 36%
<20 20 – 3%20-29 161 – 25%30-39 184 – 29%40-49 146 – 23%50-59 71 – 11%60+ - 52 – 8%
a. Male 248 – 36%b. Female 447 – 64%
a. Yes 232 – 34%b. No 421 – 63%c. Don’t Know 20 – 3%
a. Yes 158 – 71%b. No 62 – 28%c. Don’t Know 4 – 2%
a. Less than $19,999 347 – 55%b. $20,000 to $34,999 115 – 18%c. $35,000 to $49,999 30 – 5%d. $50,000 to $74,999 18 – 3%e. Greater than $75,000 6 – 1%f. Don’t know 112 – 18%
a. African-American 206 – 29%b. Asian/Pacific Islander 13 – 2%c. South East Asian 2 – 0%d. Latino 428 – 61%e. Filipino 3 – 0%f. White 29 – 4%g. Native American 4 – 1%h. Other 14 – 2%
35. What’s your address?N=699
36. What’s your age? N=634
37. What’s your Gender?N=695
38. Are you a registered Voter?N=673
39. IF YES to 38. Did you votein the last election?N=224
40. How many people live yourhousehold?
41. How many children and howmany adults?
42. What is your annual house-hold income?N=628
43. How would you define yourethnicity or race?N= 699
44. If we have further questionscan we call you?
45. What’s your phone number?
Section VI: Confidential Questions


