ridership updation on kochi metro and impact on … · ridership updation on kochi metro and impact...
TRANSCRIPT


Ridership Updation on Kochi Metro and Impact on Pollutants Final Report
CDM Smith i Kochi Metro Rail Ltd.
DISCLAIMER
“The present study cannot be construed and be substituted as an
investment grade study to secure project financing. Professional
practices and available procedures were used in the development of
the study findings. However, there is considerable uncertainty inherent
in future traffic prediction and reduction in carbon emission forecasts
for any Mass transport facility due its dependence on future planning
assumptions and master plan predictions. These differences could be
material. It should be recognized that traffic and revenue forecasts in
this document are intended to reflect the overall estimated long-term
trend and not for year on year comparison as for any given year, it may
vary due to economic conditions and other factors.
The report and its contents are confidential and intended solely for use
for the study project. Any use by third parties for use or for
publication without the express written consent of CDM Smith is
prohibited.

Ridership Updation on Kochi Metro and Impact on Pollutants Final Report
CDM Smith ii Kochi Metro Rail Ltd.
LIST OF ACRONYMS
LNG: Liquefied Natural Gas
GDP: Gross Domestic Product
KMRL: Kochi Metro Rail Limited
GCDA: Greater Cochin Development Authority
IT: Information technology
VOC: Vehicle Operation Cost
VOT: Value of Time
FACT: Fertilisers and Chemicals Travancore Limited
TELK: Transformers and Electricals Kerala Limited
NH: National Highway
KSRTC: Karnataka State Road Transport Corporation
JNNURM: Jawaharlal Nehru National Urban Renewal Mission
IPT: Intermediate Public Transport
CAGR: Compound Annual Growth Rate
LPG: Liquefied Petroleum Gas
ICTA: Institute for counselling and Transactional Analysis
JLN: Jawahar Lal Nehru
KSEB: Kerala State Electricity Board
CUSAT: Cochin University of Science and Technology
MG: Mahatma Gandhi Road
ICT: International Container Terminal
SA: Sahodaran Ayyappan Road
RBI: Reserve bank of India
HMT: Hindustan Machine Tools
LIC: Life Insurance Corporation of India
DPR: Detailed Project Report
LCV: Light Commercial Vehicles
PCU: Passenger car unit
IRC: Indian Roads Congress
KMPH: Kilometers Per Hour
PIA: Project Influence Area

Ridership Updation on Kochi Metro and Impact on Pollutants Final Report
CDM Smith iii Kochi Metro Rail Ltd.
CONTENTS
1. CHAPTER ................................................................................................................................................. 1
INTRODUCTION ..................................................................................................................................................... 1
1.1 BACKGROUND ............................................................................................................................................ 1
1.2 OBJECTIVE & SCOPE OF WORK ...................................................................................................................... 2
1.3 PURPOSE OF THE REPORT ............................................................................................................................. 4
1.4 ORGANISATION OF REPORT .......................................................................................................................... 4
2. CHAPTER ................................................................................................................................................. 5
APPROACH AND METHODOLOGY ........................................................................................................................ 5
2.1 GENERAL APPROACH ................................................................................................................................... 5
2.2 STUDY METHODOLOGY ................................................................................................................................ 5
3. CHAPTER ................................................................................................................................................ 8
CITY-PROFILE ........................................................................................................................................................ 8
3.1 SOCIO-ECONOMIC CHARACTERISTICS .............................................................................................................. 8
3.1.1 CITY STRUCTURE AND DEMOGRAPHY .............................................................................................................. 8
3.1.2 NO OF SCHOOLS IN ERNAKULUM DISTRICT ..................................................................................................... 13
3.1.3 LAND USE ............................................................................................................................................... 14
3.1.4 ECONOMIC ACTIVITIES IN ERNAKULUM ......................................................................................................... 16
3.2 SPECIAL ECONOMIC ZONES ......................................................................................................................... 17
3.3 TRANSPORT INFRASTRUCTURE ..................................................................................................................... 18
3.3.1 ROAD NETWORK ...................................................................................................................................... 19
3.3.2 PUBLIC TRANSPORT ................................................................................................................................... 20
3.3.3 AIRPORT ................................................................................................................................................. 21
3.3.4 FERRY TERMINAL ...................................................................................................................................... 21
3.3.5 RAILWAY ................................................................................................................................................. 21
3.3.6 INTERMEDIATE PUBLIC TRANSPORT .............................................................................................................. 22
3.4 PARKING DEMAND .................................................................................................................................... 23
3.4.1 VEHICLE REGISTRATION .............................................................................................................................. 23
3.5 ACCIDENTS .............................................................................................................................................. 25
3.6 FUEL EFFICIENCY DETAILS ........................................................................................................................... 26
3.7 AIR POLLUTION ........................................................................................................................................ 27
4. CHAPTER .............................................................................................................................................. 30
DATA COLLECTION AND ANALYSIS .................................................................................................................... 30
4.1 INTRODUCTION ........................................................................................................................................ 30
4.2 PRIMARY TRAFFIC SURVEYS & RESULTS ......................................................................................................... 30
4.2.1 ROAD INVENTORY SURVEY .......................................................................................................................... 33
4.2.2 SPEED AND DELAY..................................................................................................................................... 41
4.3 TRAFFIC AND TRAVEL CHARACTERISTICS ........................................................................................................ 47
4.3.1 MIDBLOCK FLOWS .................................................................................................................................... 47
4.3.2 SCREEN LINE FLOWS .................................................................................................................................. 53
4.3.3 CORDON COUNT AND ROADSIDE INTERVIEW SURVEYS ..................................................................................... 54
4.3.4 TRIP CHARACTERISTICS .............................................................................................................................. 56
4.3.4.1 ZONING SYSTEM ADOPTED ......................................................................................................................... 56
4.3.4.2 SAMPLE SIZE ............................................................................................................................................ 58

Ridership Updation on Kochi Metro and Impact on Pollutants Final Report
CDM Smith iv Kochi Metro Rail Ltd.
4.3.4.3 TRIP FREQUENCY ...................................................................................................................................... 58
4.3.4.4 PURPOSE OF JOURNEY ............................................................................................................................... 59
4.3.4.5 OCCUPANCY ............................................................................................................................................ 59
4.3.5 ORIGIN DESTINATION SURVEY AT MAJOR PUBLIC TRANSPORT TERMINALS ........................................................... 68
4.3.6 PUBLIC TRANSPORT-BOARDING AND ALIGHTING SURVEY .................................................................................. 71
4.4 PUBLIC TRANSPORT - OCCUPANCY ............................................................................................................... 73
4.5 OPINION SURVEY ...................................................................................................................................... 74
5. CHAPTER .............................................................................................................................................. 80
METRO RAIL CORRIDOR CHARACTERISTICS ..................................................................................................... 80
5.1 CORRIDOR CHARACTERISTICS ...................................................................................................................... 80
5.2 STATION LOCATIONS AND THE INTER STATION DISTANCE .................................................................................. 84
5.3 LAND USE ............................................................................................................................................... 84
5.4 MULTIMODAL INTEGRATION ....................................................................................................................... 86
5.5 OPERATIONAL CHARACTERISTICS OF METRO RAIL SYSTEM ................................................................................ 88
6. CHAPTER .............................................................................................................................................. 89
RIDERSHIP ESTIMATION ...................................................................................................................................... 89
6.1 TRAVEL DEMAND FORECAST ....................................................................................................................... 89
6.2 POPULATION AND EMPLOYMENT PROJECTIONS .............................................................................................. 91
6.3 PEAK HOUR RIDERSHIP .............................................................................................................................. 96
6.4 TRIP LENGTH FREQUENCY DISTRIBUTION ....................................................................................................... 98
6.5 MODEL OUTPUTS ..................................................................................................................................... 98
6.6 DAILY RIDERSHIP WITH TRANSIT ORIENTED DEVELOPMENT ............................................................................. 103
7. CHAPTER ............................................................................................................................................ 104
CARBON EMISSIONS .......................................................................................................................................... 104
7.1 INTRODUCTION ...................................................................................................................................... 104
7.2 KOCHI METRO – A LOW CARBON EMISSION OPTION ..................................................................................... 104
7.3 CARBON EMISSION ESTIMATE ................................................................................................................... 107
8. CHAPTER ............................................................................................................................................ 109
CONCLUSIONS ................................................................................................................................................... 109

Ridership Updation on Kochi Metro and Impact on Pollutants Final Report
CDM Smith v Kochi Metro Rail Ltd.
LIST OF TABLES
Table 3.1 District-Wise Population and Density ..................................................................................... 9
Table 3.2 Kochi Urban Agglomeration Population................................................................................ 10
Table 3.3 Kochi Population-Ward level (2011) ..................................................................................... 10
Table 3.4 List of Schools in Kochi (2012) ............................................................................................... 13
Table 3.5 Summary of Schools in Ernakulum District ........................................................................... 13
Table 3.6 Educational Facilities in Kochi City (2010) ............................................................................. 14
Table 3.7 Existing Land Use of Kochi City Region, in 2009 .................................................................... 14
Table 3.8 Sector Wise Gross Domestic Product – Ernakulum (in Rs.)................................................... 16
Table 3.9 District-Wise Per Capita Income ........................................................................................... 16
Table 3.10 List of Operational SEZs in Kerala ........................................................................................ 17
Table 3.11 Fare for Bus Services ........................................................................................................... 20
Table 3.12 Train Fare from Ernakulam.................................................................................................. 22
Table 3.13 Growth of Intermediate Public Transport Modes ............................................................... 22
Table 3.14 Motor Vehicles Registration in Ernakulam.......................................................................... 24
Table 3.15 Motor Vehicles Registration in Kochi City ........................................................................... 25
Table 3.16 Motor Vehicles involved in Accidents during 2010 ............................................................. 26
Table 3.17 Fuel Efficiency...................................................................................................................... 26
Table 3.18 Total Consumption of Fuel .................................................................................................. 27
Table 3.19 Fuel Price as per June 2013 (in Rs./Litre) ............................................................................ 27
Table 3.20 Annual Average - Ernakulum District 2008 ......................................................................... 27
Table 3.21 Annual Average - Ernakulum District 2009 ......................................................................... 28
Table 3.22 Annual Average - Ernakulum District 2010 ......................................................................... 28
Table 3.23 Annual Average - Ernakulum District 2011 ......................................................................... 28
Table 4.1 Traffic Survey Schedule ......................................................................................................... 31
Table 4.2 Lane Characteristics – Project Corridor ................................................................................. 35
Table 4.3 Lane Characteristics of Roads – Project Influence Area ........................................................ 35
Table 4.4 Type of Carriageway – Project Corridor ................................................................................ 37
Table 4.5 Type of Carriageway – Project Influence Area ...................................................................... 37
Table 4.6 Major Roads – Project Corridor............................................................................................. 38
Table 4.7 Observed Journey Speeds and Running Speeds – Project Corridor ...................................... 45
Table 4.8 Observed Journey Speeds – Project Influence Area ............................................................. 46
Table 4.9 Equivalency Factors by Type of Vehicles ............................................................................... 48
Table 4.10 Traffic Volume (18 Hours) at Midblock Locations ............................................................... 48
Table 4.11 Peak Hour Traffic at Midblock Locations ............................................................................ 49
Table 4.12 Vehicle Composition (9.00:10.00) ....................................................................................... 52
Table 4.13 Traffic Volume (8 Hours) at Screen Line Locations ............................................................. 53
Table 4.14 Peak Hour Traffic at Screen Line Locations ......................................................................... 54
Table 4.15 Traffic Volume (18 Hours) at Cordon Locations .................................................................. 55
Table 4.16 Peak Hour Traffic at Cordon Locations ................................................................................ 55
Table 4.17 Sample Size Distribution ..................................................................................................... 58
Table 4.18 Trip Frequency - Project Corridor ........................................................................................ 58
Table 4.19 Trip Frequency - Cordon ...................................................................................................... 58

Ridership Updation on Kochi Metro and Impact on Pollutants Final Report
CDM Smith vi Kochi Metro Rail Ltd.
Table 4.20 Purpose of Journey – Project Corridor ................................................................................ 59
Table 4.21 Purpose of Journey – Cordon .............................................................................................. 59
Table 4.22 Average Occupancy - Project Corridor ................................................................................ 59
Table 4.23 Average Occupancy - Cordon .............................................................................................. 60
Table 4.24 Travel Desire Pattern ........................................................................................................... 60
Table 4.25 Average Trip Length in Km .................................................................................................. 67
Table 4.26 Recommended Fare for Metro ........................................................................................... 74
Table 4.27 Purpose of Trip – Bus Terminals/Stands ............................................................................. 75
Table 4.28 Purpose of Trip – Railway Stations ...................................................................................... 75
Table 4.29 Trip Frequency – Bus Terminals/Stands .............................................................................. 76
Table 4.30 Trip Frequency – Railway Station ........................................................................................ 76
Table 4.31 Willingness to Shift – Bus Passenger ................................................................................... 76
Table 4.32 Willing to Shift Metro System – Rail Passenger .................................................................. 76
Table 5.1 Major Attractions along the Metro Corridor ........................................................................ 82
Table 5.2 Inter Station Distance – Metro Corridor ............................................................................... 84
Table 5.3 Predominant Land Use at Metro Stations ............................................................................. 85
Table 5.4 Multimodal Integration along Project Corridor .................................................................... 87
Table 5.5 Operational Characteristics of Metro Rail ............................................................................. 88
Table 6.1 Estimated Migration Components as % to Total Population ................................................ 92
Table 6.2 Assumptions Considered in Development Plan for Kochi City Region (2031) ...................... 92
Table 6.3 Summary of Population and Employment Projections ......................................................... 93
Table 6.4 Daily Trips Assigned and PCTR for Different Horizon Years .................................................. 96
Table 6.5 Hourly Boarding and Alighting (Morning Peak) .................................................................... 96
Table 6.6 Summary of Daily Ridership .................................................................................................. 97
Table 6.7 Daily Station Loading for Corridor ......................................................................................... 97
Table 6.8 Trip Length Distribution – Metrorail (2016) .......................................................................... 98
Table 6.9 Summary of Daily Ridership ................................................................................................ 103
Table 7.1 Traffic Share in Passenger Trips .......................................................................................... 105
Table 7.2 Percentage Traffic Share in Passenger Trips ....................................................................... 105
Table 7.3 Traffic Share in Passenger km ............................................................................................. 105
Table 7.4 Percentage Traffic Share in Passengers .............................................................................. 106
Table 7.5 Fuel Consumption (in kilo liters) ......................................................................................... 106
Table 7.6 Carbon Emission Estimates ................................................................................................. 108

Ridership Updation on Kochi Metro and Impact on Pollutants Final Report
CDM Smith vii Kochi Metro Rail Ltd.
LIST OF FIGURES
Figure 1.1 Urban Growths Trend in Ernakulum ...................................................................................... 1
Figure 1.2 Study Area (GCDA) ................................................................................................................. 3
Figure 2.3 Study Methodology ................................................................................................................ 7
Figure 3.1 District-Wise Population and Density (in Million) .................................................................. 9
Figure 3.2 Zone-Wise Population and Density of GCDA 2011 (Persons/Sq.Km) .................................. 12
Figure 3.3 Land Use Map ...................................................................................................................... 15
Figure 3.4 Distribution of District-wise Income of Kerala State............................................................ 17
Figure 3.5 Kochi SEZ .............................................................................................................................. 18
Figure 3.6 Transport Network - Study Area .......................................................................................... 19
Figure 3.7 Registered Vehicles in Kerala State ...................................................................................... 23
Figure 3.8 Vehicles Composition in Kerala State (2000-2012) .............................................................. 24
Figure 3.9 Trend of Motor Vehicles Accidents in Kerala ....................................................................... 25
Figure 4.1 Traffic Survey Locations ....................................................................................................... 32
Figure 4.2 Road Network (GCDA) .......................................................................................................... 34
Figure 4.3 Type of Carriageway – Project Corridor ............................................................................... 37
Figure 4.4 Type of Carriageway – Project Influence Area ..................................................................... 38
Figure 4.5 Network Characteristics ....................................................................................................... 40
Figure 4.6 Journey Speeds - Project Corridor ....................................................................................... 42
Figure 4.7 Running Speeds - Project Corridor ....................................................................................... 43
Figure 4.8 Journey Speeds - Project Influence Area ............................................................................. 44
Figure 4.9 Hourly Traffic Distribution ................................................................................................... 50
Figure 4.10 Traffic Composition - Peak Hour ........................................................................................ 50
Figure 4.11 Zoning System .................................................................................................................... 57
Figure 4.12 Desire-2-Wheelers – Project Corridor ................................................................................ 61
Figure 4.13 Desire-Cars – Project Corridor ........................................................................................... 62
Figure 4.14 Desire-3-Wheelers – Project Corridor ................................................................................ 63
Figure 4.15 Desire-2-Wheelers – Outer Cordon ................................................................................... 64
Figure 4.16 Desire-3-Wheelers – Outer Cordon ................................................................................... 65
Figure 4.17 Desire-Cars – Outer Cordon ............................................................................................... 66
Figure 4.18 Trip Length Distribution - Project Corridor ........................................................................ 67
Figure 4.19 Trip Length Distribution – Cordon ..................................................................................... 68
Figure 4.20 Desire-3-Wheelers at Ernakulam Junction ........................................................................ 69
Figure 4.21 Desire-3-Wheelers at Ernakulam Town ............................................................................. 70
Figure 4.22 Desire-3-Wheelers at Vytilla Hub ....................................................................................... 71
Figure 4.23 Bus Passenger Survey at Petta - Towards Vyttilla .............................................................. 72
Figure 4.24 Bus Passenger Survey at Petta - Towards Thirupunithra ................................................... 72
Figure 4.25 Bus Passenger Survey at Edapally - Towards Ernakulam ................................................... 73
Figure 4.26 Bus Passenger Survey at Edapally - Towards Aluva ........................................................... 73
Figure 4.27 Average Occupancy - Bus ................................................................................................... 74
Figure 4.28 Willingness to Shift – Car/2-Wheeler ................................................................................. 77
Figure 4.29 Willingness to Shift – 3-Wheeler ........................................................................................ 77
Figure 4.30 Project Influence Area........................................................................................................ 78

Ridership Updation on Kochi Metro and Impact on Pollutants Final Report
CDM Smith viii Kochi Metro Rail Ltd.
Figure 4.31 Travel Pattern for Potential Passengers............................................................................. 79
Figure 5.1 Metro Rail Alignment ........................................................................................................... 81
Figure 5.2 Land Use along the Project Corridor .................................................................................... 86
Figure 5.3 Multimodal Integration along Project Corridor ................................................................... 87
Figure 6.1 Travel Demand Forecast ...................................................................................................... 89
Figure 6.2 Highway Network-2013 ....................................................................................................... 90
Figure 6.3 Public Transport Network-2013 ........................................................................................... 91
Figure 6.4 Population and Density Distribution of Study Area - 2011 (Persons/Sq.Km) ...................... 94
Figure 6.5 Population and Density Distribution of Study Area - 2033 (Persons/Sq.Km) ..................... 95
Figure 6.6 Passenger flow on the Metro Corridor ................................................................................ 99
Figure 6.7 Passenger Flow - Public Transport Network ...................................................................... 100
Figure 6.8 Traffic Flow - Highway Network (in PCUs) ......................................................................... 101
Figure 6.9 Boarding and Alighting - Metro Passengers (Petta to Aluva) - 2018 ................................. 102
Figure 6.10 Boarding and Alighting - Metro Passengers (Aluva to Petta) – 2018............................... 102
LIST OF ANNEXURES
ANNEXURE – I SURVEY FORMATS
ANNEXURE – II VOULME COUNT SURVEY
ANNEXURE – III ZONE LIST & OD MATRIX
ANNEXURE – IV BUS ROUTE DETAILS

Ridership Updation on Kochi Metro and Impact on Pollutants Final Report
CDM Smith 1 Kochi Metro Rail Ltd.
1. CHAPTER
INTRODUCTION
1.1 Background
Kochi, the commercial hub of Kerala, is already experiencing signs of urban growth
pressures. As per World Bank, Kochi is recognized as one of the seventeen major industrial
cities of India and an easy city to start business in India. This decade is witnessing huge
investments in the region like International Container Transshipment Terminal at
Vallarpadam, Info park at Kakkanad, Special Economic Zone by NEST, LNG terminal,
Electronic hardware park. Among the districts, Ernakulum district contributes the highest
portion (14.47%) of Kerala’s GDP. Being a centre of excellence of education and a
destination for major industries and establishments like High court, Stock exchange, Kochi
shipyard, Spice board etc. attract significant floating population form the neighboring
districts for their livelihood. In addition to this, Kochi has been emerged as a major tourist
destination to domestic as wells as international tourists. Recently opened mall by Lulu
group has multifolded the number of visitors in the city.
Urbanization has been observed as a new phenomenon with a quickening pace in the last
15 to 20 years. Kochi Corporation with a population of 602046 in 2011 (Census 2011) will
grow at an annual growth rate of 1.0% during 2011-2031 (Development Plan for Kochi city
region-Draft (2031)). Kochi city region comprising two municipalities and surrounding local
bodies with an area of 369.72sq.km will carry a population of 22.73 lakhs by 2031
(Development Plan for Kochi city region–Draft (2031)). Roughly 68% of the population,
compared to about only 48% in 2001, lives in urban areas in the Ernakulum district which is
far beyond the state average. The urban population in Ernakulam is presently estimated to
increase 4.2% annually.
Figure 1.1 Urban Growths Trend in Ernakulum
(Source: Census of India)

Ridership Updation on Kochi Metro and Impact on Pollutants Final Report
CDM Smith 2 Kochi Metro Rail Ltd.
The vehicle growth in the Ernakulum district is significant with 9.85 lakhs registered
vehicles as of July 2011 (Economic Review 2012) with an average household vehicle
ownership of 1.35. Seventy percent (83%) of all vehicles are privately owned, namely cars
and two wheelers.
The buses run by private operators and Kerala State Road Transport Corporation (KSRTC)
accesses most of the developed areas within the city. However, there is a need to improve
the operation by introducing eco-friendly buses, passenger information system and
improve facilities at the bus stops and access to the bus stops.
Traffic problems in both the cities have been created by the growth of motor vehicles and
also the absence of a quality public transport system to cater to large intra city demand.
Residents thus opt for personalized mode of transport to sustain the growing economic
activities.
In this context, Kerala Govt. has assigned Delhi Metro to carry out a detailed project
report for Kochi metro project for the corridor between Aluva-Petta (25.6 kms) during
2006. The study has carried out the ridership projections for a period of twenty years. In
order to update the projections, KMRL has mandated CDM Smith to carry out a traffic
study and support the client in estimating the impact of pollutants during the construction
and operation period.
1.2 Objective & Scope of Work
KMRL has hired CDM Smith to carry out a traffic updation study for the corridor between
Aluva-Petta (25.6 kms) and the impact of pollutants in the city with the introduction of
metro in Kochi. The study area include Kochi Corporation, six Municipalities, thirty five
census towns and villages (12nos) in the peripheral area of the corporation which
constitute to the Greater Cochin Area administered by Greater Cochin Development
Authority (GCDA). The delineation is based on the observed travel pattern in the project
corridor and the expected urban sprawl in the future. Figure 1.2 presents the Kochi urban
area limits.
Scope of services:
The scope of study includes:
Present traffic (mode wise) along the metro alignment
o Public transport (i.e. buses operated by private or public operators, rick-
shaws, taxis etc.)
o All other modes (Lorries, private cars, private motorcycles, etc.)
o Primary traffic surveys
Road Network Inventory
Screen Line and Cordon Traffic Counts
Passenger Count Survey at Rail Terminals
O-D Survey at cordon locations
Midblock Traffic Counts + OD

Ridership Updation on Kochi Metro and Impact on Pollutants Final Report
CDM Smith 3 Kochi Metro Rail Ltd.
Opinion Survey at Bus/Rail Terminals
o Secondary data collection and past study reports
Ridership estimation for the metro service for the section, Aluva-Petta for the
Horizon years 2018, 2033, 2048
Future traffic (mode wise) along the metro alignment for the Horizon years 2018,
2033, 2048
Forecast of reduction of carbon emissions along the metro alignment from 2018 to
2048
Information about multimodal integrated approach with buses, boats and rick-
shaws and about integrated ticketing linked with metro development.
Figure 1.2 gives study area of Greater Cochin Development Authority (GCDA)
Figure 1.2 Study Area (GCDA)

Ridership Updation on Kochi Metro and Impact on Pollutants Final Report
CDM Smith 4 Kochi Metro Rail Ltd.
1.3 Purpose of the Report
The present submission is a Final report. The purpose of this report is to outline
the approach, methodology and techniques used in the data collection and analysis
and the interpretation of the present traffic scenario for the Kochi city. The intent
is to provide a clear understanding of the full range of activities that have been
undertaken in the data collection stage for the updation of transport model for
Kochi.
1.4 Organisation of Report
The report is set out as follows:
Chapter 1 provides the background of the study, purpose of the report, the
objective and scope of the study and the organization of the report.
Chapter 2 details the approach and methodology in updating the transport
model for the study area through huge dataset and development of
database.
Chapter 3 presents the Kochi City profile and describes the
existing transport infrastructure in the city.
Chapter 4 presents the primary data collection and analysis.
Chapter 5 portrays the traffic characteristics, the land use along the
proposed metro rail corridor and the operational characteristics of the
metro system.
Chapter 6 presents the ridership estimation
Chapter 7 details the carbon emissions during metro construction
Chapter 8 presents the conclusion of the study

Ridership Updation on Kochi Metro and Impact on Pollutants Final Report
CDM Smith 5 Kochi Metro Rail Ltd.
2. CHAPTER
APPROACH AND METHODOLOGY
2.1 General Approach
A systematic approach has been adopted in developing a firm methodology for the
ridership estimation of proposed metro rail project in Kochi. Prior to firming up the
methodology, the team reviewed various past studies carried out in the
transportation sector in Kochi. In addition, relevant suggestions given by the client
has been incorporated in the methodology.
The general approach to carrying out the study is along the following lines:
Close liaison with the client
Application of the most advanced, appropriate and well established
methodologies during the study
Use of the latest version of CUBE, a widely used transport demand
modeling software, for the updation of the model
Adherence to codes and guidelines, Development Plan provisions, planning
regulations and the latest development guidelines
Close adherence to study time period by scheduling and monitoring during
the study
The following software applications have been employed for this study:
CUBE : For urban transport modeling
CAD : For production of drawings
CDM Smith has used software programmes developed and tested in-house for the
purpose of data analysis of various traffic surveys such as traffic volume counts,
road side interviews, and opinion surveys.
2.2 Study Methodology
For the fulfillment of the study objectives, the study is divided into the following
tasks taking into consideration the time and budgetary constraints. These tasks are
the major activities which are interlinked with each other. The activities are
detailed out in the subsequent chapters.
Task 1: Mobilization and Reconnaissance and collect information from
secondary sources
The task included the mobilization of both human and material resources, involving
the establishment of the project facility and allocation of staff and material
resources to the site. The kick-off meeting with the client served the following
purposes:
Introduction of CDM Smith team
Established general communication and project progress reporting
procedures
Established co-ordination mechanism between different agencies involved
Ridership Updation on Kochi Metro and Impact on Pollutants Final Report
CDM Smith 6 Kochi Metro Rail Ltd.
Reviewed and assessed project needs and CDM Smith’s approach and
methodology
CDM Smith staff went on a site visit to appreciate the overall transportation
scenario, the issues, and bottlenecks in the transport system in the study area
focusing key on the project corridor. Based on the site reconnaissance and review
of past reports, consultants designed a gap assessment to choose the methodology
and final data collection plan for the entire study.
Task 2: Data Collection and Analysis
This includes the delineation of study area, the development of the zoning system
and network, the collation of socioeconomic indicators for the study area, the
establishment of present travel patterns by means of traffic surveys, and finally
the processing of the data.
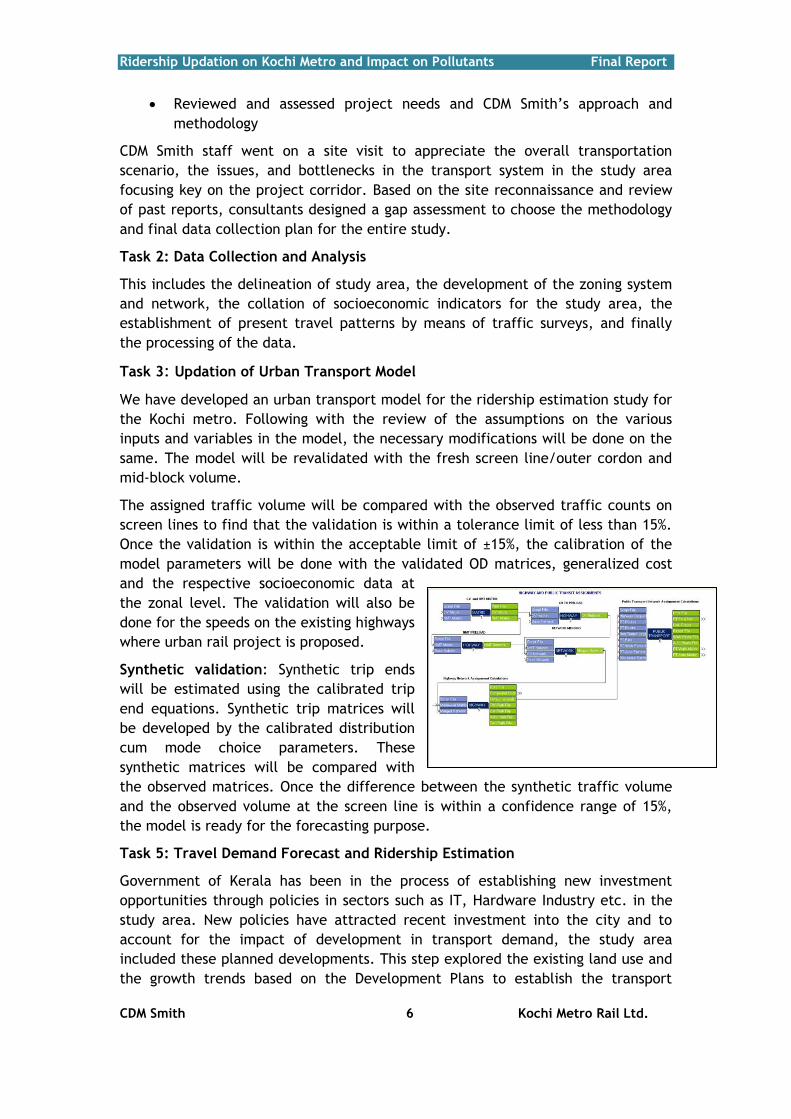
Task 3: Updation of Urban Transport Model
We have developed an urban transport model for the ridership estimation study for
the Kochi metro. Following with the review of the assumptions on the various
inputs and variables in the model, the necessary modifications will be done on the
same. The model will be revalidated with the fresh screen line/outer cordon and
mid-block volume.
The assigned traffic volume will be compared with the observed traffic counts on
screen lines to find that the validation is within a tolerance limit of less than 15%.
Once the validation is within the acceptable limit of ±15%, the calibration of the
model parameters will be done with the validated OD matrices, generalized cost
and the respective socioeconomic data at
the zonal level. The validation will also be
done for the speeds on the existing highways
where urban rail project is proposed.
Synthetic validation: Synthetic trip ends
will be estimated using the calibrated trip
end equations. Synthetic trip matrices will
be developed by the calibrated distribution
cum mode choice parameters. These
synthetic matrices will be compared with
the observed matrices. Once the difference between the synthetic traffic volume
and the observed volume at the screen line is within a confidence range of 15%,
the model is ready for the forecasting purpose.
Task 5: Travel Demand Forecast and Ridership Estimation
Government of Kerala has been in the process of establishing new investment
opportunities through policies in sectors such as IT, Hardware Industry etc. in the
study area. New policies have attracted recent investment into the city and to
account for the impact of development in transport demand, the study area
included these planned developments. This step explored the existing land use and
the growth trends based on the Development Plans to establish the transport

Ridership Updation on Kochi Metro and Impact on Pollutants Final Report
CDM Smith 7 Kochi Metro Rail Ltd.
demand due to the same. This step establishes the socioeconomic projections along
the corridor and at proposed transit access points.
With the transport proposals and the forecasted socioeconomic indicators in place,
the mode-wise travel demand will be predicted with the help of calibrated trip
end, trip distribution and mode choice models for the given horizon years. The
assumptions used in the horizon years include the network, the cost parameters
like VOC, VOT, speed of the systems and fare.
The calibrated model will be used to test the “Do-Nothing “and “With Project”
scenarios to establish the ridership and comparative modal splits. Finally, for each
of the scenarios, the following outputs will be extracted.
Desire line estimates
Passengers per hour per direction
Daily ridership
Station-wise boarding and alighting
Passenger kms/Passenger hours
Vehicle kms/hours
Fuel consumption
Occupancy Trend
Reduction in carbon emissions
The study methodology is shown in the Flow chart below.
Figure 2.3 Study Methodology

Ridership Updation on Kochi Metro and Impact on Pollutants Final Report
CDM Smith 8 Kochi Metro Rail Ltd.
3. CHAPTER
CITY-PROFILE
3.1 Socio-Economic Characteristics
3.1.1 City Structure and Demography
Kochi, the most vibrant city in the southern part of Kerala is part of Ernakulum
District. The city of Kochi with a population of 6.02 lakhs is the most densely
populated city. The extended metropolitan region, “Greater Cochin” has a
population of 2.1 million comprising of six municipalities and villages. Kochi is
home to the High Court of Kerala and Lakshadweep, Southern Naval Command of
the Indian Navy and the state headquarters of the Indian Coast Guard, Port of
Kochi, International Container Transshipment Terminal, Kochi Shipyard, Kochi
Refineries, Kochi Stock Exchange, International Pepper Exchange, major industries
like FACT, TELK. The industrial parks like the Kochi Special Economic Zone and Info
park provided enormous employment opportunities in the city. Cochin University of
Science and Technology attracts considerable domestic and international students.
As a favorable tourist destination of south India, Kochi ranks first in the total
number of international and domestic tourist arrivals in Kerala.
According to census 2011, urban proportion has gone up from 17.3 per cent in 1951
to 31.2 per cent in 2011. Kerala is one of the top five states contributed towards
the higher urban population in the nation. The
state has witnessed a steady growth in the
urbanization during last three decades. The
urban content of the state’s population which
was only 15.11 % in 1961 has risen to 47.70% in
2011 which is almost double of the nation
average of 27.82%.
The huge growth in urban population during the
past decade 2001-2011 (92.72 %) could be
attributed due to the manifold increase in
number of towns in the state between 2001 &
2011 from 159 to 520. Among the districts,
Ernakulam is the most urbanised district with
68.07%.
The district wise distribution of the population is presented in Table 3.1 and Figure
3.1. The percentage decadal growth rate of population between 2001 and 2011 for
Kerala state is 4.86%. Among the southern districts, Ernakulum has reported highest
growth with a decadal growth of 5.6%.

Ridership Updation on Kochi Metro and Impact on Pollutants Final Report
CDM Smith 9 Kochi Metro Rail Ltd.
Table 3.1 District-Wise Population and Density
Sl. No District Population 2011
Percentage decadal growth rate of population
Population density per sq.km
2001-11 2011
1 Kasargod 13,02,600 8.18% 654
2 Kannur 25,25,637 4.84% 852
3 Wayanad 8,16,558 4.60% 383
4 Kozhikode 30,89,543 7.31% 1318
5 Malappuram 41,10,956 13.39% 1158
6 Palakkad 28,10,892 7.39% 627
7 Thrissur 31,10,327 4.58% 1026
8 Ernakulum 32,79,860 5.60% 1069
9 Idukki 11,07,453 -1.93% 254
10 Kottayam 19,79,384 1.32% 896
11 Alappuzha 21,21,943 0.61% 1501
12 Pathanamthitta 11,95,537 -3.12% 453
13 Kollam 26,29,703 1.72% 1056
14 Thiruvananthapuram 33,07,284 2.25% 1509
Kerala 3,33,87,677 4.86% 859
(Source: Census of India 2011)
Figure 3.1 District-Wise Population and Density (in Million)
(Source: Census of India 2011)
Kochi City Population
As per census statistics, population of Kochi in 2011 is 601, 574 of which male and
female are 296, 668 and 304, 906 respectively. Table 3.2 presents the growth of
urban population of Kochi City in the past three decades. Ward wise population is
presented in Table 3.3. Kochi Corporation as per 2011 is divided in to seventy four

Ridership Updation on Kochi Metro and Impact on Pollutants Final Report
CDM Smith 10 Kochi Metro Rail Ltd.
wards. The growth in urban population is almost steady during 1981-2011 with an
average decadal growth of 37.9%.
Table 3.2 Kochi Urban Agglomeration Population
Census Population Growth
in %
1981 824,900 -
1991 1,140,600 38.3%
2001 1,536,400 34.7%
2011 2,117,990 37.9%
(Source: Census of India 2011)
Table 3.3 Kochi Population-Ward level (2011)
SI. No. Ward name Total population
1 Fort Kochi 10279
2 Kalvathy 7814
3 Eeraveli 6425
4 Karippalam 8882
5 Mattancherry 10144
6 Kochangadi 7108
7 Cheralaayi 7741
8 Panayappilly 11429
9 Chakkaamaadam 5046
10 Karuvelippady 7673
11 Thoppumpady 9266
12 Tharebhagam 8925
13 Kadebhagam 10203
14 Thazhuppu 10699
15 Idakochi north 9574
16 Idakochi south 7808
17 Perumbadappu 9442
18 Konam 9863
19 Palluruthy Kacheripady
11100
20 Nambyapuram 8747
21 Pullaardesham 11046
22 Mundamveli 14723
23 Manassery 8403
24 Moolamkuzhi 8121
25 Chullikkal 6623
26 Nasrath 7277
27 Fort Kochi veli 7456
28 Amaraavathy 9439
29 Island north 4666
Ridership Updation on Kochi Metro and Impact on Pollutants Final Report
CDM Smith 11 Kochi Metro Rail Ltd.
SI. No. Ward name Total population
30 Island south 10076
31 Vaduthala west 9025
32 Vaduthala east 7795
33 Elamakkara town 8547
34 Puthukkala vattom 9034
35 Ponekkara 8757
36 Kunnumpuram 7589
37 Idappally 9183
38 Devankulangara 8634
39 Karukappilly 7638
40 Maamangalam 5770
41 Paadivattom 11745
42 Vennala 9708
43 Palarivattom 9354
44 Karanakkodam 8582
45 Thammanam 9938
46 Chakkaraparambu 6557
47 Chalikkavattom 4952
48 Ponnurunni east 9126
49 Vytila 7524
50 Chambakkara 8024
51 Thripunithura 8935
52 Vytila janatha 10726
53 Ponnurunni east 5119
54 Elamkulam 6279
55 Girinagar 11267
56 Panamppilly nagar 7933
57 Kadavanthra 5522
58 Konthuruthy 9973
59 Thevara 4569
60 Perumaanoor 5941
61 Ravipuram 8721
62 Ernakulam Jn. 10047
63 Gandhinagar 7887
64 Kathrukkadavu 8734
65 Kaloor south 4414
66 Ernakulam central 5970
67 Ernakulam town 9018
68 Ayyappankaavu 10174
69 Thrikkanaarvattom 10488
70 Kaloor north 8968
71 Elamakkara junction. 7881
(Source: Census of India 2011)
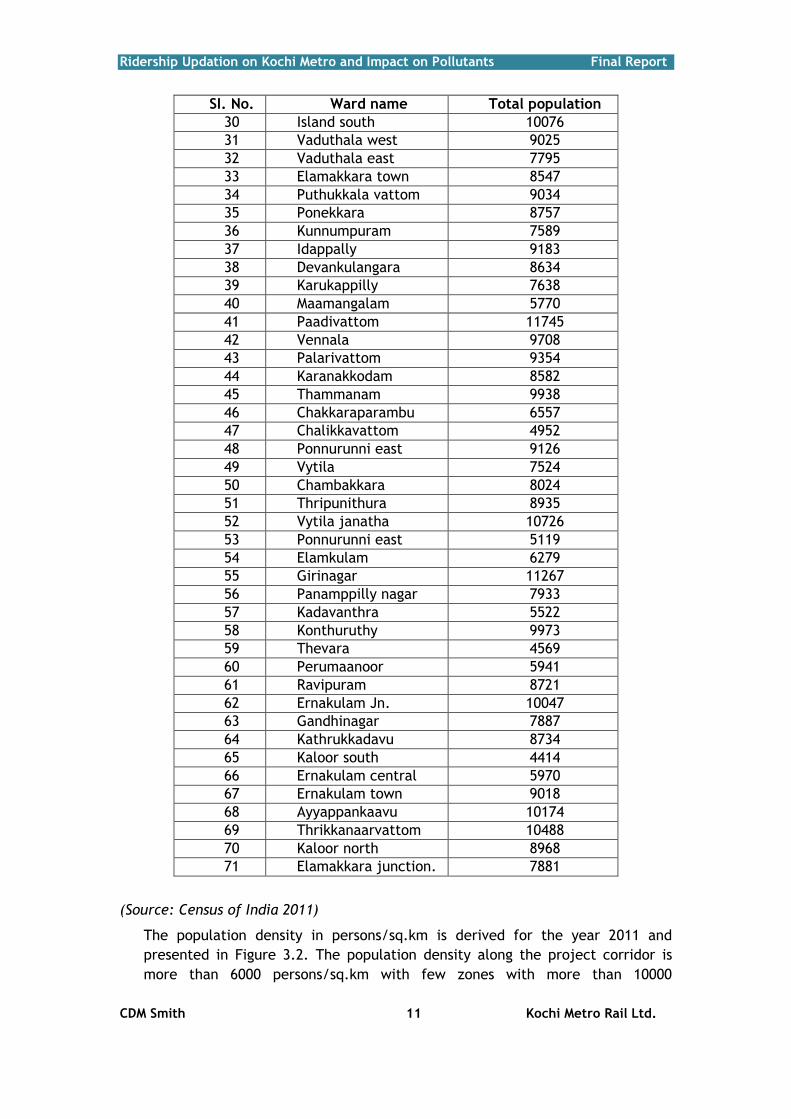
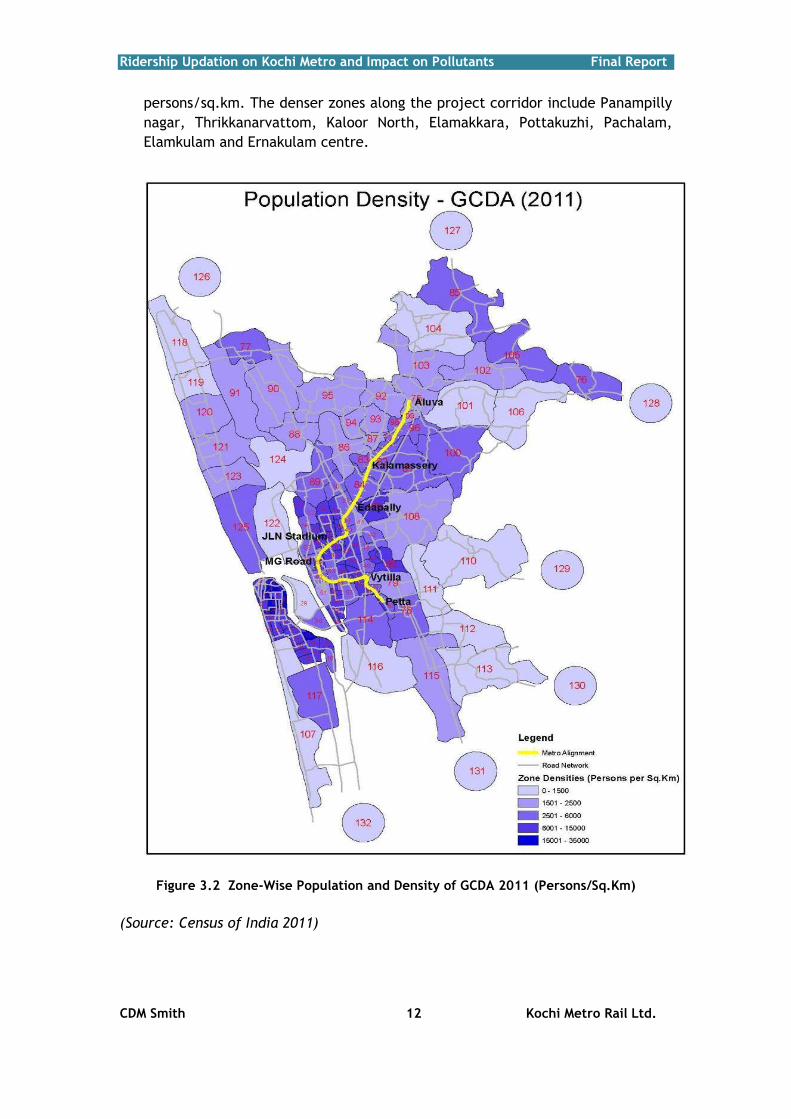
The population density in persons/sq.km is derived for the year 2011 and
presented in Figure 3.2. The population density along the project corridor is
more than 6000 persons/sq.km with few zones with more than 10000
Ridership Updation on Kochi Metro and Impact on Pollutants Final Report
CDM Smith 12 Kochi Metro Rail Ltd.
persons/sq.km. The denser zones along the project corridor include Panampilly
nagar, Thrikkanarvattom, Kaloor North, Elamakkara, Pottakuzhi, Pachalam,
Elamkulam and Ernakulam centre.
Figure 3.2 Zone-Wise Population and Density of GCDA 2011 (Persons/Sq.Km)
(Source: Census of India 2011)

Ridership Updation on Kochi Metro and Impact on Pollutants Final Report
CDM Smith 13 Kochi Metro Rail Ltd.
3.1.2 No of Schools in Ernakulum District
Education trips play a dominant role next to work trip in the overall travel demand
during the peak hours. To assess the extent of education centers in the city centre,
the data on the schools is collected from Kochi Corporation. There are 1014 schools
present in the district. The list of school numbers for the district and city is given
in Table 3.4 and Table 3.5 respectively. The Table 3.6 gives the detailed
educational facilities available in Kochi city.
Table 3.4 List of Schools in Kochi (2012)
Sl. No.
Assistant Educational
Office
UP Schools LP Schools
Govt. Aided Unaided Total Govt. Aided Unaided Total
1 Ernakulam 3 16 1 20 8 30 3 41
2 Mattanchery 4 8 1 13 5 27 - 32
3 Thripunithura 5 12 - 17 13 21 2 36
4 Vypeen 4 10 - 14 5 25 - 30
5 Koothattukulam 4 4 - 8 8 6 1 15
6 Muvattupuzha 7 3 - 10 7 9 2 18
7 Kalloorkkad - 5 - 5 5 11 - 16
8 Piravom 8 3 2 13 10 11 - 21
9 Kolenchery 11 4 3 18 20 9 2 31
10 Aluva 7 8 6 21 16 26 5 47
11 Angamaly 7 8 2 17 21 27 3 51
12 North Paravoor 5 5 2 12 24 20 3 47
13 Perumbavoor 11 5 2 18 18 16 5 39
14 Kothamangalam 15 11 1 27 22 29
51
Total 91 102 20 213 182 267 26 475
(Source: Kochi Corporation)
Table 3.5 Summary of Schools in Ernakulum District
Higher Secondary School + Special Schools 316
TTI Schools 4
Upper Primary Schools 215
Lower Primary Schools 479
TOTAL 1014
(Source: Kochi Corporation)

Ridership Updation on Kochi Metro and Impact on Pollutants Final Report
CDM Smith 14 Kochi Metro Rail Ltd.
Table 3.6 Educational Facilities in Kochi City (2010)
SI.
No.
Are
as
LP(L
.P+U
.P+H
.S)
U.P
(U.P
+H
.P)
H.S
.S+H
.S
Colleges
Oth
ers
Stu
dent
Popula
tion p
er
L.P
Stu
dent
Popula
tion p
er
U.P
Stu
dent
Popula
tion p
er
H.S
+ H
.S.S
Stu
dent
Popula
tion
Exis
ting
1 Kochi Corporation 219 146 114 7 18 2720 4079 5224 595575
2 Thirupunithura 26 18 12 2 3 2303 3327 499 59884
3 Kalamassery 15 11 10 4 8 4208 5738 6312 63116
4 Chellanam 7 4 3 0 1 5173 9052 12069 36209
5 Cheranallur 9 5 2 0 0 2924 5263 13158 263126
6 Elamkunnappuzha 19 9 3 0 0 2661 5618 16854 50563
7 Eloor 11 10 5 0 1 3234 3557 7115 35573
8 Kadmakudy 5 3 2 0 0 3365 5275 7912 15824
9 Kumbalam 15 8 4 2 1 1837 3444 6887 27549
10 Kumbalangy 10 4 2 0 0 2666 6665 13330 26661
11 Maradu 9 5 3 0 0 4557 8202 13671 41012
12 Mulavukadu 10 4 2 0 0 2284 5711 11421 22842
13 Njarakkal 10 5 3 0 1 2417 4833 8055 24166
14 Thiruvankulam 8 2 2 0 1 2715 10,859 10859 21717
15 Thrikkakkara 20 13 11 3 3 3299 5076 5999 65984
16 Vadavukodu 15 11 9 0 0 1781 2428 2968 26710
17 Varapuzha 8 4 3 0 0 3061 6131 8175 24524
(Source: Development Plan for Kochi City Region 2031)
3.1.3 Land Use
Land use distribution in the Kochi city region as per Kochi City Region Development
Plan is presented in Figure 3.3 and Table 3.7. The predominant land use along the
project corridor is residential except along the MG road where commercial, public
and semipublic present.
Table 3.7 Existing Land Use of Kochi City Region, in 2009
SI. No. Land use Area (Ha) % to gross
area % to net area
1 Residential 16057.9 43.43 69.39
2 Commercial 367.1 0.99 1.59
3 Public & Semi public 1538.37 4.16 6.65
4 Industrial 2123.18 5.74 9.17
5 Transportation 1486.35 4.02 6.42
6 Park & Open spaces 113.79 0.31 0.49
7 Hazardous 23.66 0.06 0.1
8 Other (SEZ and Unclassified area) 397.3 1.07 1.72

Ridership Updation on Kochi Metro and Impact on Pollutants Final Report
CDM Smith 15 Kochi Metro Rail Ltd.
SI. No. Land use Area (Ha) % to gross
area % to net area
9 Paddy land/ Marshy land 6817.55 18.44
10 Dry Cultivation/ Agriculture 754.06 2.04 3.26
11 Water bodies 7011.43 18.96
12 Port Land (Puthuvype) 281.12 0.76 1.21
13 Total 36971.81 100
(Source: Development Plan for Kochi City Region 2031)
Figure 3.3 Land Use Map
(Source: Development Plan for Kochi City Region 2031)

Ridership Updation on Kochi Metro and Impact on Pollutants Final Report
CDM Smith 16 Kochi Metro Rail Ltd.
3.1.4 Economic Activities in Ernakulum
The sector wise distribution of gross domestic product income of the district is
given in Table 3.8. The major striving sector contributing to income is tertiary with
57% in year 2009-10.The share of tertiary sector has increased over the years
(2001-10) resulting in drop in the primary sector. Ernakulum district stands first
with Rs 89,131 at constant (2004-2005) prices in 2011-12 as against 81,768 in 2010-
11 in the per capita income among other districts of Kerala.
Table 3.8 Sector Wise Gross Domestic Product – Ernakulum (in Rs.)
Year Primary Sector
Secondary Sector
Tertiary sector
NDDP Per Capita
Income
2000-2001 109625 306589 462020 878234 28376
2001-2002 115053 309291 494806 919150 29469
2002-2003 139015 428623 658256 1225894 38893
2003-2004 151216 485573 738719 1375508 43228
2004-2005 147353 586281 822223 1555857 48454
2005-2006 180269 667690 923045 1771004 54661
2006-2007 227406 788686 1066225 2082317 63699
2007-2008 243902 919937 1229144 2392983 72581
2008-2009 133444 658663 972563 1764670 53073
2009-2010 205015 946751 1513249 2665015 79553
(Source: Department of Economics and Statistics)
Per capita Income: One of the major indicators of the regional development is per
capita income (PCI). Per capita income for the duration of 2010-11 is presented in
Table 3.9. Ernakulum has the highest per capita income than the state average.
Table 3.9 District-Wise Per Capita Income
SI. No. District 2010-11(P) Rank
2011-12(Q)
Rank Growth Rate (%) 2010-11
Percent with respect to
State Average
1 Thiruvananthapuram 59885 4 65419 4 9.24 108%
2 Kollam 51741 10 56132 10 8.49 93%
3 Pathanamthitta 61325 3 66940 3 9.16 111%
4 Alappuzha 56014 7 60989 6 8.88 101%
5 Kottayam 63708 2 69259 2 8.71 114%
6 Idukki 56406 6 60127 7 6.6 99%
7 Eranakulam 81768 1 89131 1 9 147%
8 Thrissur 59080 5 64629 5 9.39 107%
9 Palakkad 51182 11 55365 11 8.17 91%
10 Malappuram 36068 14 39005 14 8.15 64%
11 Kozhikode 53670 9 58498 9 8.99 97%
12 Wayanad 40997 13 44123 13 7.62 73%
13 Kannur 54492 8 59354 8 8.92 98%
14 Kasaragod 46161 12 50122 12 8.58 83%
STATE 55667 60536 8.75

Ridership Updation on Kochi Metro and Impact on Pollutants Final Report
CDM Smith 17 Kochi Metro Rail Ltd.
(Source: Department of Economics, State of Kerala- 2011-12, P: Provisional Q:
Quick, at constant (1999-2000) Prices)
Figure 3.4 Distribution of District-wise Income of Kerala State
3.2 Special Economic Zones
Kerala was the first State in India to set up a Special Economic Zone. According to
the Ministry of Commerce & Industry, Govt. of India, there are 7 operational SEZs
in Kerala. After the SEZ Rules 2006 came into force; formal approvals were granted
to 28 more SEZs in the state. Table 3.10 listed out the number of operational SEZs
in Kerala. Of the SEZs, Kochi, Info park and Kochi port trust fall in the project
study area.
Table 3.10 List of Operational SEZs in Kerala
Sl. No. Name of the Developer Location Type of SEZ
1 Kochi SEZ Kochi Multi product
2 Info park SEZ Kochi IT/ITES
3 Electronic Technology Park-SEZ-I Trivandrum IT/ITES
4 Electronic Technology Park-SEZ-II Trivandrum IT/ITES
5 Kochi Port Trust Vallarpadam Port based
6 KINFRA Film & Video Park Trivandrum Animation & Gaming
7 Kochi Port Trust Puthuvypeen Port based

Ridership Updation on Kochi Metro and Impact on Pollutants Final Report
CDM Smith 18 Kochi Metro Rail Ltd.
(Source: http://www.emergingkerala2012.org/sez.php)
Kochi SEZ
Kochi Special Economic Zone accommodates a Multiproduct SEZ in Kerala.
Figure 3.5 Kochi SEZ
(Source: http://www.csez.com)
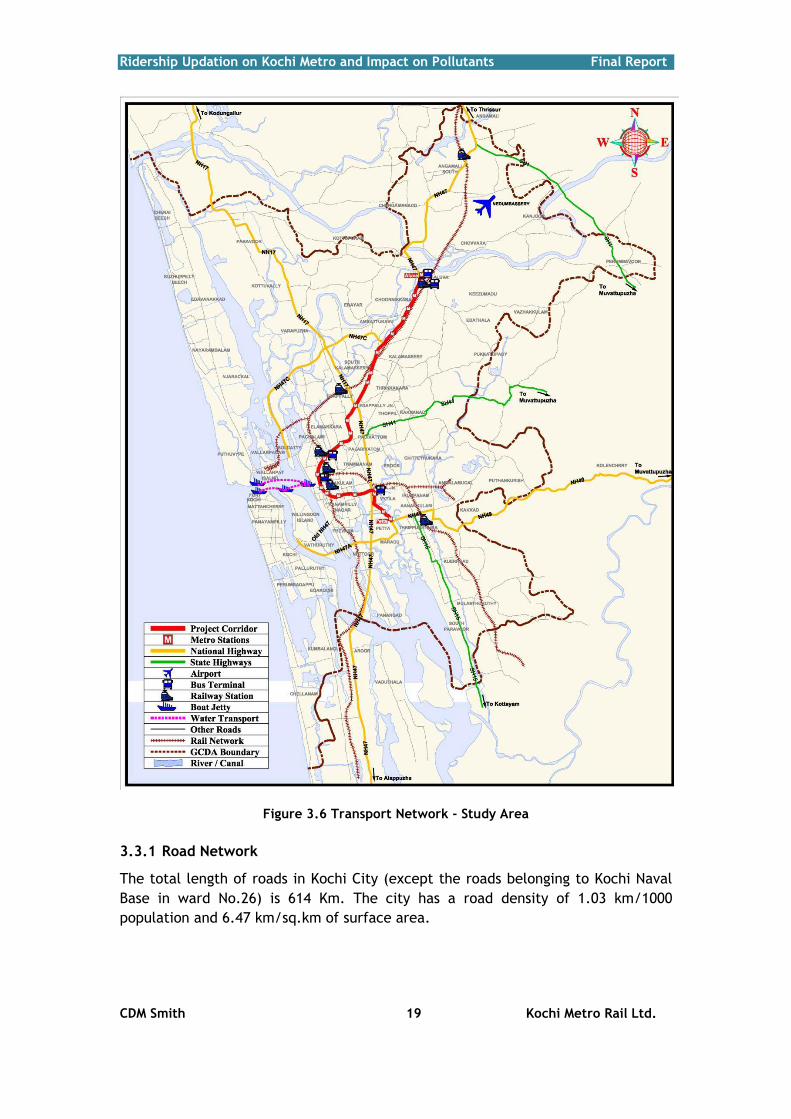
3.3 Transport Infrastructure
Kochi is one of the few two-tier cites of India blessed with good transport
connectivity through all major modes of transport like road, rail, air and water.
National Highways NH 17, NH 47 stretched out in the North-south and NH 49 in the
east-west connects the city with the neigbouring districts and surrounding states.
The population from the neighbouing villages and districts commute to the city by
rail with three major stations including Ernakulum junction, Ernakulum north and
Aluva railway station. International Airport at Nedumbassery connects Kochi with
nearly 30 destinations nationally and internationally. The water transport is limited
to passenger and ferry services between Marine drive, Fort Kochi and Vypeen.
Proposals exist to connect Edapally with Vytilla with water transport mainly for
tourism. The transport network in the study area is shown in the Figure 3.2.
Ridership Updation on Kochi Metro and Impact on Pollutants Final Report
CDM Smith 19 Kochi Metro Rail Ltd.
Figure 3.6 Transport Network - Study Area
3.3.1 Road Network
The total length of roads in Kochi City (except the roads belonging to Kochi Naval
Base in ward No.26) is 614 Km. The city has a road density of 1.03 km/1000
population and 6.47 km/sq.km of surface area.

Ridership Updation on Kochi Metro and Impact on Pollutants Final Report
CDM Smith 20 Kochi Metro Rail Ltd.
3.3.2 Public Transport
The city has a very efficient bus transport system operated by public and private
operators, known as Red-Buses. The operation was mainly by Red buses till 2010. In
2010, the state public transport company, KSRTC started city services due to
frequent complaints against red-buses. KSRTC operates two classes of service
including low floor buses funded by JNNURM . KSRTC operate about 46 buses per
day in the city and expecting 150 more AC and non-AC low floor buses under the
Jawaharlal Nehru National Urban Renewal Mission (JNNURM) scheme.
The JNNURM transport services operated by KSRTC offer premium air-conditioned
low-floor bus services known as Orange Buses and non-air conditioned semi low
floor buses known as Yellow Buses. Both the buses connect the central business
district areas of Kochi with the nearby suburbs. At present, 630 intra-buses are
authorized to operate inside the city. The city also caters to nearly 2100 long-
distance private buses, which include 466 inter-city state buses.
There are 160 official authorized routes to operate connecting 60 destinations in
the city and nearby suburbs. Most of the buses run primarily on four major routes
i.e. Aluva-Fort Kochi, Aluva-Kakanad, Ernakulam-Fort-Kochi and Aluva-MG road.
There is no numbering system for the routes; rather all buses carry destination
boards with important bus stops marked below. The details of operational routes
by KSRTC and private are given in Annexure 3.1.
The city has primarily four major bus stations:
Kaloor Bus station (Punching station)
KSRTC Central Bus Station - South,
Vytilla hub
Rajiv Gandhi Municipal bus terminal at Aluva (mainly for Private)
The KSRTC bus fares were revised on 11 November 2012. The fare for different
services is listed in Table 3.11.
Table 3.11 Fare for Bus Services
Type of Bus Minimum Fare
in Rs. Fare for every next
Km in Rs.
City Fast 6 0.57
City/Ordinary 6 0.58
Super Express 17 0.70
Super-Fast Passenger 12 0.65
Volvo 35 1.20
(Source: CDM Smith Secondary Survey 2013)
To ease congestion within the city limits, a large integrated public transport
terminus is planned to be constructed at Vytilla Junction, known as Integrated

Ridership Updation on Kochi Metro and Impact on Pollutants Final Report
CDM Smith 21 Kochi Metro Rail Ltd.
Mobility Hub, which provides commuters multi-modal transport options. The first
phase is completed and the intercity buses operate from this hub. Mobility hub
plans to provide space for 170 buses, 2000 car bays, 50 inter-state buses parking
bays, 5,000 two wheeler and three wheeler parking bays and a boat jetty with 3
piers for providing water ferry transport. A shopping mall and commercial towers
are planned in the second phase to sustain with additional revenues. The proposed
expansion will be completed by 2014.
3.3.3 Airport
Kochi has an international airport, known as the Kochi International Airport, which
is about 25 km north of the city. This is the first airport which has been
implemented under PPP. It currently is the fourth busiest International airport in
India. Currently in expansion mode, the airport has been made ready to
accommodate the super jumbo Airbus 380. The Airport is connected with most of
the cities in the Middle-East and South East Asia with nearly sixteen international
flight carriers operating to the city. Apart from this, the city is well connected to
all major metros and cities of India with seven domestic carriers operating
nationwide air services.
3.3.4 Ferry Terminal
Ferries are operated between Fort Kochi and the mainland. The stops include
Embarkation on the eastern side of Willingdon Island, Terminus on the west one
opposite to Mattancherry and Customs at Fort Kochi and at Mattancherry Jetty. The
minimum fare is Rs.5.00.
Ernakulam: The ferry operates between 4.40am to 9.30pm and operate every
40mins to Fort Kochi from the main jetty. There are six ferries directly to/from the
Mattancherry Jetty (5.55am to 6.45pm). Ferries run every 20mins to Willingdon and
Vypeen Islands (6am to 10pm).
Fort Kochi: Ferries run between 6.20am to 9.50pm from Customs Jetty to
Ernakulam and Willington Island. Car and passenger ferries cross to Vypeen Island
from Fort Kochi between 6am to 10pm.
3.3.5 Railway
At present, there is no intra-city rail transport system in Kochi. The inter-city
rail transport system in the city is administered by the Southern Railway Zone of
Indian railways. Ernakulam junction and the Ernakulam town locally known as the
'South' and 'North' railway stations respectively serve as the major entry to or exit
from the city. Both these stations fall in the project corridor and will act as major
transfer stations for passengers commute from outside the city. The major stations
at Aluva and Thripunithura and the halting station at Kalamassery serves the
outskirts of the city and the surrounding metropolitan area. The train fare from
Ernakulam station to major destinations surrounding the study area as is given in
Table 3.12. Southern Railway is planning to start MEMU services for connecting
nearby towns and cities by in the city.
Ridership Updation on Kochi Metro and Impact on Pollutants Final Report
CDM Smith 22 Kochi Metro Rail Ltd.
Table 3.12 Train Fare from Ernakulam
SI. No. Station Name Ordinary Fare from Ernakulam
1 Thripunithura 5
2 Piravam Rd 8
3 Ettumanoor 12
4 Kottayam 14
5 Kochi Harbour 6
6 Ernakulam Town 5
7 Edapalli 5
8 Aluva 7
9 Angamali 8
10 Chalakudi 11
11 Iringalakkuda 13
12 Thrissur 16
(Source: CDM Smith Secondary Survey 2013)
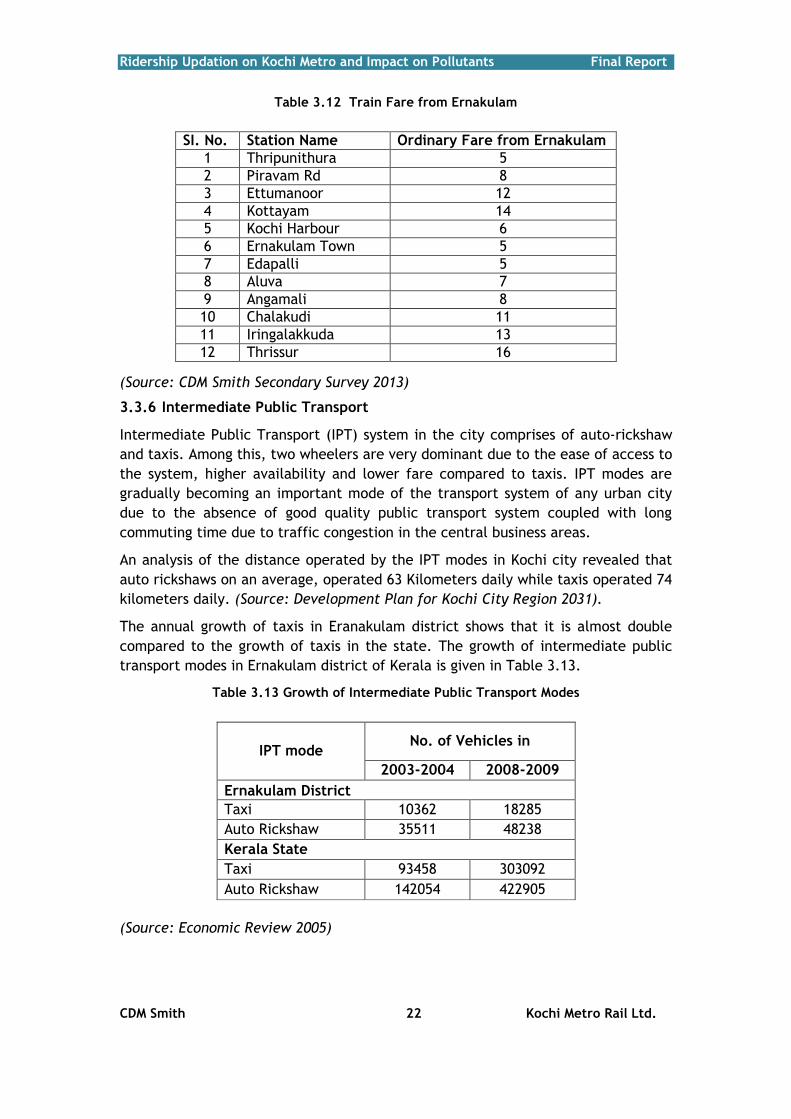
3.3.6 Intermediate Public Transport
Intermediate Public Transport (IPT) system in the city comprises of auto-rickshaw
and taxis. Among this, two wheelers are very dominant due to the ease of access to
the system, higher availability and lower fare compared to taxis. IPT modes are
gradually becoming an important mode of the transport system of any urban city
due to the absence of good quality public transport system coupled with long
commuting time due to traffic congestion in the central business areas.
An analysis of the distance operated by the IPT modes in Kochi city revealed that
auto rickshaws on an average, operated 63 Kilometers daily while taxis operated 74
kilometers daily. (Source: Development Plan for Kochi City Region 2031).
The annual growth of taxis in Eranakulam district shows that it is almost double
compared to the growth of taxis in the state. The growth of intermediate public
transport modes in Ernakulam district of Kerala is given in Table 3.13.
Table 3.13 Growth of Intermediate Public Transport Modes
IPT mode No. of Vehicles in
2003-2004 2008-2009
Ernakulam District
Taxi 10362 18285
Auto Rickshaw 35511 48238
Kerala State
Taxi 93458 303092
Auto Rickshaw 142054 422905
(Source: Economic Review 2005)

Ridership Updation on Kochi Metro and Impact on Pollutants Final Report
CDM Smith 23 Kochi Metro Rail Ltd.
Major Auto Stands
Major auto stands include Ernakulam Junction, Ernakulam town, South KSRTC bus
terminal, Rajiv Gandhi bus terminal, Aluva, Vyttilla bus hub, Kaloor bus stand and
Petta bus stop. The pre-paid auto stands are available at Vyttila bus hub,
Ernakulam junction and Ernakulam town. There are 50 autos in vyttila bus hub
which carry 450 trips per day to various destinations like Ernakulam Junction,
Janatha bus stop, Kadavanthra, Kaiyapuzha, mathoor etc. Minimum charge is Rs.
15/- and 7.5/- for every next Km. There are 240 autos in South railway station
which carry 4000 trips per day. Auto charges are uniform at every pre-paid stands.
Major Taxi Stands
Major taxi stands include Ernakulam juntion, Ernakulam town, Kaloor and Aluva.
Taxi fares are based on hourly basis or per Kilometre which amounts to Rs 11/Km
or Rs 175/hour.
3.4 Parking Demand
Significant parking is observed on the project corridor on MG road and Banerji
road. Other major locations include SA road, Shanmughom road, Broadway and
Market road. As per Development Plan for Kochi City Region 2031 the highest on-
street accumulation takes place on MG road followed by Bannerji road and
Sahodaran Ayyappan road where off-street parking facilities are provided.
3.4.1 Vehicle Registration
Kerala has 6.8 million registered motor vehicles at the end of 2011-2012. The total
registered vehicles grew at a Compound Annual Growth Rate (CAGR) of 11.39%
between 2000 and 2012. Personalized modes i.e. two wheelers and passenger cars
dominated with 60.07% and 21.48% respectively. Goods vehicles constituted around
6.56%. Figure 3.6 represents the registered vehicles in Kerala state. Vehicle
composition is presented in Figure 3.7.
Figure 3.7 Registered Vehicles in Kerala State
(Source: Regional Transport Office Kerala)
Ridership Updation on Kochi Metro and Impact on Pollutants Final Report
CDM Smith 24 Kochi Metro Rail Ltd.
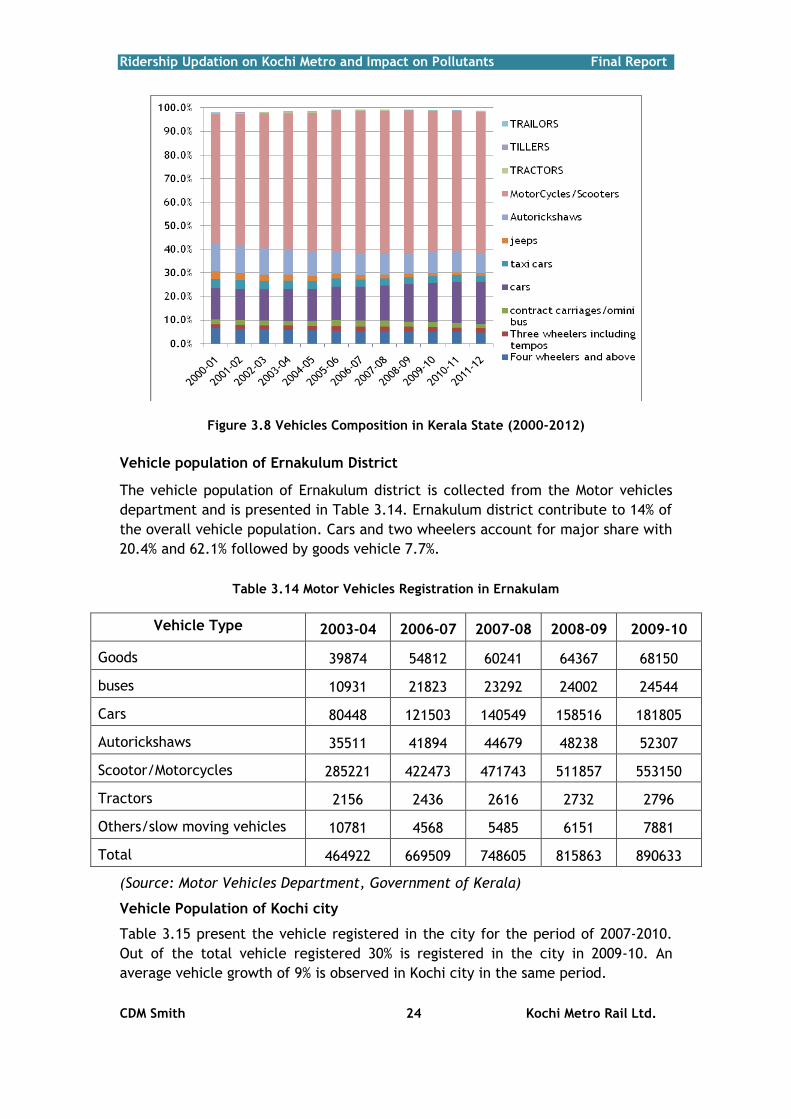
Figure 3.8 Vehicles Composition in Kerala State (2000-2012)
Vehicle population of Ernakulum District
The vehicle population of Ernakulum district is collected from the Motor vehicles
department and is presented in Table 3.14. Ernakulum district contribute to 14% of
the overall vehicle population. Cars and two wheelers account for major share with
20.4% and 62.1% followed by goods vehicle 7.7%.
Table 3.14 Motor Vehicles Registration in Ernakulam
(Source: Motor Vehicles Department, Government of Kerala)
Vehicle Population of Kochi city
Table 3.15 present the vehicle registered in the city for the period of 2007-2010.
Out of the total vehicle registered 30% is registered in the city in 2009-10. An
average vehicle growth of 9% is observed in Kochi city in the same period.
Vehicle Type 2003-04 2006-07 2007-08 2008-09 2009-10
Goods 39874 54812 60241 64367 68150
buses 10931 21823 23292 24002 24544
Cars 80448 121503 140549 158516 181805
Autorickshaws 35511 41894 44679 48238 52307
Scootor/Motorcycles 285221 422473 471743 511857 553150
Tractors 2156 2436 2616 2732 2796
Others/slow moving vehicles 10781 4568 5485 6151 7881
Total 464922 669509 748605 815863 890633
Ridership Updation on Kochi Metro and Impact on Pollutants Final Report
CDM Smith 25 Kochi Metro Rail Ltd.
Table 3.15 Motor Vehicles Registration in Kochi City
Vehicle Type 2007-8 2008-9 2009-10
Two wheeler 119486 128823 137942
Car 92226 69056 75601
Jeep 5832 5832 5832
Omni Bus 4726 4899 5089
Buses 4848 5224 5470
Taxis 5026 5762 6295
Three wheeler 9239 10206 11402
Goods 13982 15358 54415
Others 1305 1350 1390
Total 256670 246510 303436
(Source: Road Transport Year Book (2007-09), Volume-1)
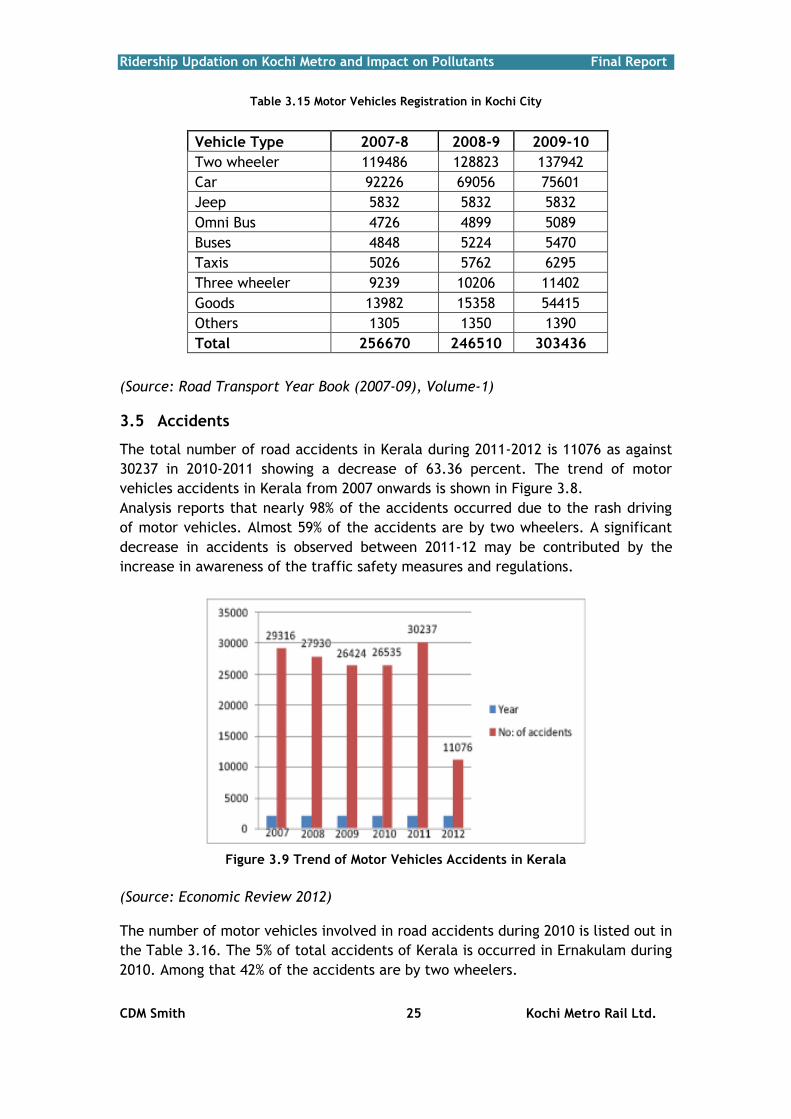
3.5 Accidents
The total number of road accidents in Kerala during 2011-2012 is 11076 as against
30237 in 2010-2011 showing a decrease of 63.36 percent. The trend of motor
vehicles accidents in Kerala from 2007 onwards is shown in Figure 3.8.
Analysis reports that nearly 98% of the accidents occurred due to the rash driving
of motor vehicles. Almost 59% of the accidents are by two wheelers. A significant
decrease in accidents is observed between 2011-12 may be contributed by the
increase in awareness of the traffic safety measures and regulations.
Figure 3.9 Trend of Motor Vehicles Accidents in Kerala
(Source: Economic Review 2012) The number of motor vehicles involved in road accidents during 2010 is listed out in
the Table 3.16. The 5% of total accidents of Kerala is occurred in Ernakulam during
2010. Among that 42% of the accidents are by two wheelers.

Ridership Updation on Kochi Metro and Impact on Pollutants Final Report
CDM Smith 26 Kochi Metro Rail Ltd.
Table 3.16 Motor Vehicles involved in Accidents during 2010
Mode Type Ernakulam
City Ernakulam
Rural
KSRTC Buses 49 61
Other Buses 175 246
Goods Vehicles 116 179
Motor Cars 458 688
Jeeps 10 52
Auto 165 411
Two wheelers 869 1976
Miscellaneous vehicles 116 180
Class not known 81 24
Total 2039 3817
(Source: Economic Review 2012)
3.6 Fuel Efficiency Details
The fuel efficiency is related to measure the performance of a vehicle based on the
fuel consumed per specified distance i.e. litre per kilometer. Fuel efficiency is
dependent on many parameters like vehicle characteristics including its engine
parameters, aerodynamic drag, weight, and rolling resistance, driver
characteristics like number of breaks, speed, maintenance of vehicle, road
characteristics etc. Recent innovation in vehicle design, engine design etc is
claiming considerable energy savings.
Fuel efficiency directly affects emissions causing pollution based on the amount of
fuel used. This also depends on the type of fuel used. Hence the fuel efficiency
data is collected for Kochi by type vehicle and fuel. The fuel type included LPG,
petrol, and diesel. The type of vehicle included cars (by model), bus, minibus, two
wheeler and three wheeler.
The mileage of various cars inside the city were collected during secondary data
collection in 2013 is presented as follows:
Table 3.17 Fuel Efficiency
Mode Car-Petrol Car-Diesel Bus Two
wheeler Three
wheeler Small Big Small Big Mini bus bus
Mileage 14 8 15 10 7 3.5 35 16
Daily Trip Length 30 30 50 50 100 250 35 80
Consumption/km (liters) 0.07 0.13 0.07 0.10 0.14 0.29 0.03 0.06
Consumption/km (INR) 4.70 8.23 3.41 5.12 7.31 14.61 1.88 4.11
(Source: CDM Smith Secondary Survey 2013)
Ridership Updation on Kochi Metro and Impact on Pollutants Final Report
CDM Smith 27 Kochi Metro Rail Ltd.
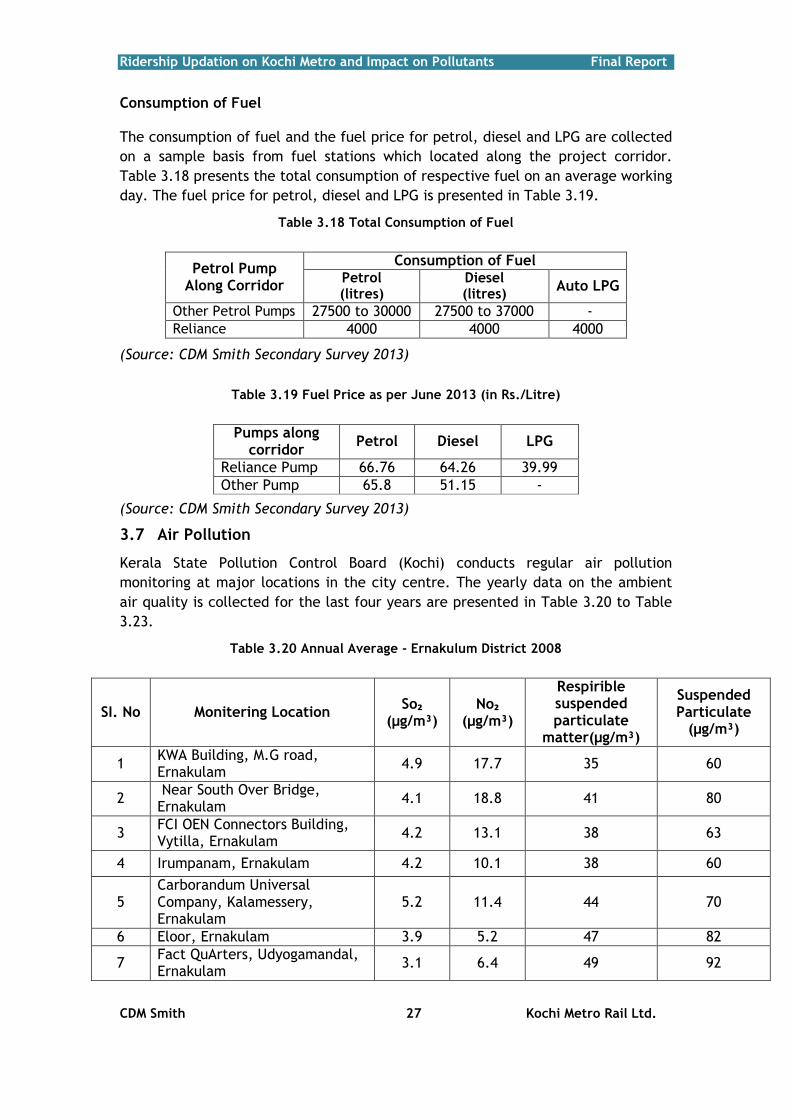
Consumption of Fuel The consumption of fuel and the fuel price for petrol, diesel and LPG are collected
on a sample basis from fuel stations which located along the project corridor.
Table 3.18 presents the total consumption of respective fuel on an average working
day. The fuel price for petrol, diesel and LPG is presented in Table 3.19.
Table 3.18 Total Consumption of Fuel
Petrol Pump Along Corridor
Consumption of Fuel Petrol (litres)
Diesel (litres)
Auto LPG
Other Petrol Pumps 27500 to 30000 27500 to 37000 -
Reliance 4000 4000 4000
(Source: CDM Smith Secondary Survey 2013)
Table 3.19 Fuel Price as per June 2013 (in Rs./Litre)
Pumps along corridor
Petrol Diesel LPG
Reliance Pump 66.76 64.26 39.99
Other Pump 65.8 51.15 -
(Source: CDM Smith Secondary Survey 2013)
3.7 Air Pollution
Kerala State Pollution Control Board (Kochi) conducts regular air pollution
monitoring at major locations in the city centre. The yearly data on the ambient
air quality is collected for the last four years are presented in Table 3.20 to Table
3.23.
Table 3.20 Annual Average - Ernakulum District 2008
SI. No Monitering Location So₂
(µg/m³) No₂
(µg/m³)
Respirible suspended particulate
matter(µg/m³)
Suspended Particulate
(µg/m³)
1 KWA Building, M.G road, Ernakulam
4.9 17.7 35 60
2 Near South Over Bridge, Ernakulam
4.1 18.8 41 80
3 FCI OEN Connectors Building, Vytilla, Ernakulam
4.2 13.1 38 63
4 Irumpanam, Ernakulam 4.2 10.1 38 60
5 Carborandum Universal Company, Kalamessery, Ernakulam
5.2 11.4 44 70
6 Eloor, Ernakulam 3.9 5.2 47 82
7 Fact QuArters, Udyogamandal, Ernakulam
3.1 6.4 49 92

Ridership Updation on Kochi Metro and Impact on Pollutants Final Report
CDM Smith 28 Kochi Metro Rail Ltd.
(Source: Kerala State Pollution control Board)
Table 3.21 Annual Average - Ernakulum District 2009
SI.No Monitering Location So₂
(µg/m³) No₂
(µg/m³)
Respirible suspended particulate
matter(µg/m³)
Suspended Particulate
(µg/m³)
1 KWA Building,M.G road, Ernakulam
3.8 15.7 - 63
2 Near South Over Bridge,Ernakulam
4.1 18.5 41 78
3 FCI OEN Connectors Building, Vytilla,Ernakulam
4.3 14.3 41 61
4 Irumpanam, Ernakulam 3.5 10.6 37 55
5 Carborandum Universal Company,Kalamessery,Ernakulam
4.5 12.5 40 61
6 Eloor,Ernakulam 2 6.5 51 104
7 Fact QuArters, Udyogamandal,Ernakulam
2 6.4 49 118
(Source: Kerala State Pollution control Board)
Table 3.22 Annual Average - Ernakulum District 2010
SI. No Monitering Location So₂
(µg/m³) No₂
(µg/m³)
Respirible suspended particulate
matter(µg/m³)
Suspended Particulate
(µg/m³)
1 KWA Building,M.G road,Ernakulam
17.6 18.1 78 88
2 Near South Over Bridge,Ernakulam
17.6 18.1 78 88
3 FCI OEN Connectors Building, Vytilla,Ernakulam
17.6 18.1 78 88
4 Irumpanam, Ernakulam 17.6 18.1 78 88
5 Carborandum Universal Company,Kalamessery,Ernakulam
17.6 18.1 78 88
6 Ethanam 17.6 18.1 78 88
7 Industrial 17.6 18.1 78 88
(Source: Kerala State Pollution control Board)
Table 3.23 Annual Average - Ernakulum District 2011
SI.No Monitering Location So₂
(µg/m³) No₂
(µg/m³)
Respirible suspended particulate
matter(µg/m³)
Suspended Particulate
(µg/m³)
1 Eloor-Methanam 2.24 5.04 16.73 -

Ridership Updation on Kochi Metro and Impact on Pollutants Final Report
CDM Smith 29 Kochi Metro Rail Ltd.
2 Eloor-TCC 2.55 5.18 18.3 -
3 South Over Bridge,Ernakulam 3.59 17.2 52.5 -
4 FCI OEN Connectors Building, Vytilla,Ernakulam
3.9 15.31 46.5 -
5 Irumpanam,Industrial 3.16 12.04 37.4 -
6 Kalamassery,Industrial 3.8 15.2 58.6 -
7 Kalamassery, Residential, others
4.27 19.3 39.9 -
(Source: Kerala State Pollution Control Board)
As per the data the air pollution is mainly caused by some of the industries at
Kalamessery and Ernakulam.

Ridership Updation on Kochi Metro and Impact on Pollutants Final Report
CDM Smith 30 Kochi Metro Rail Ltd.
4. CHAPTER
DATA COLLECTION AND ANALYSIS
4.1 Introduction
An assessment of the prevailing conditions in the study area was made to provide a
basis for:
Preparing the detailed program for the subsequent field investigations and
surveys; and
Establishing the database of socioeconomic indicators of the study area at
a micro level along the proposed corridors.
Based on this assessment, data has been collected through various secondary and
primary sources to establish the existing traffic and travel characteristics of the
project corridor and study area.
4.2 Primary Traffic Surveys & Results
The primary surveys are planned in such a way as to appreciate the present
transport infrastructure in the study area and along the proposed metro corridor.
The following primary surveys are conducted to update the transportation model
for the study area which will simulate existing traffic condition and forecast
transport demand for different horizon years.
Road Inventory Survey
Speed and Delay Surveys
Screen Line Volume Counts
Mid-Block Volume Count
Volume Count at the Cordons
Origin Destination Surveys
Bus Occupancy Surveys
City Bus Passenger Boarding and Alighting
Opinion Survey i.e. Willingness to Pay and Shift Survey
The surveys are conducted between 30-05-2013 to 21-05-2013 as illustrated in
Table 4.1.
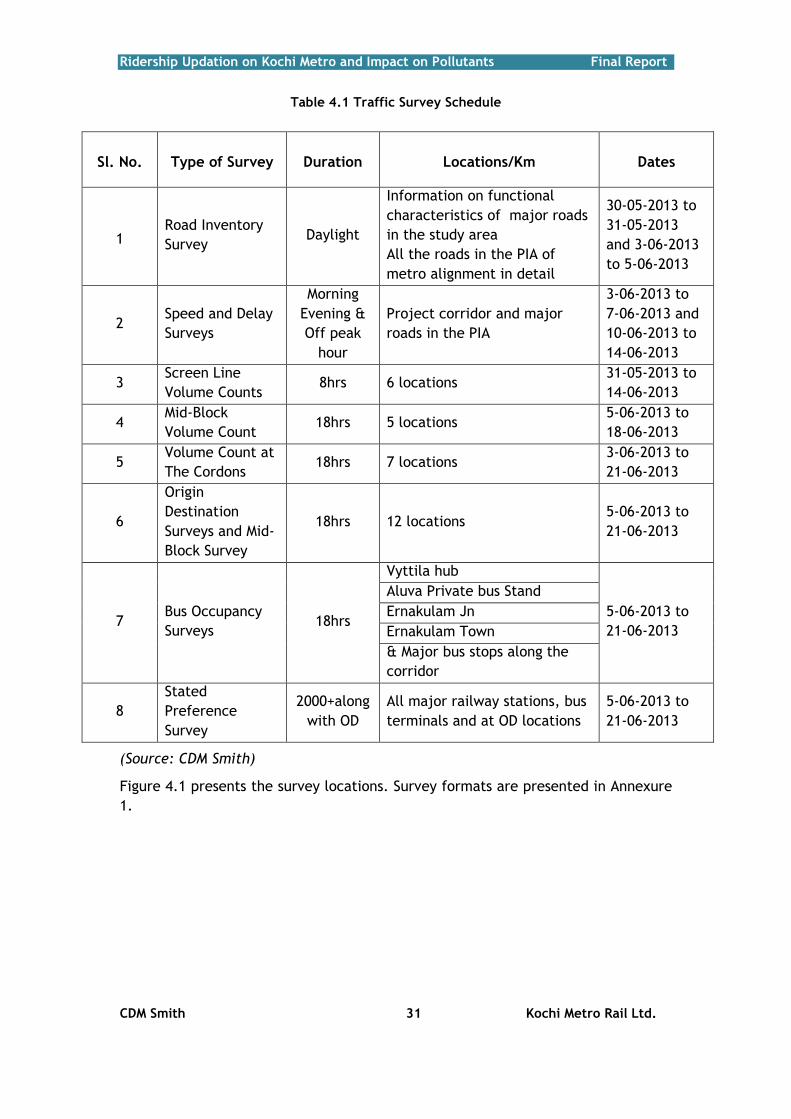
Ridership Updation on Kochi Metro and Impact on Pollutants Final Report
CDM Smith 31 Kochi Metro Rail Ltd.
Table 4.1 Traffic Survey Schedule
Sl. No. Type of Survey Duration Locations/Km Dates
1 Road Inventory
Survey Daylight
Information on functional
characteristics of major roads
in the study area
All the roads in the PIA of
metro alignment in detail
30-05-2013 to
31-05-2013
and 3-06-2013
to 5-06-2013
2 Speed and Delay
Surveys
Morning
Evening &
Off peak
hour
Project corridor and major
roads in the PIA
3-06-2013 to
7-06-2013 and
10-06-2013 to
14-06-2013
3 Screen Line
Volume Counts 8hrs 6 locations
31-05-2013 to
14-06-2013
4 Mid-Block
Volume Count 18hrs 5 locations
5-06-2013 to
18-06-2013
5 Volume Count at
The Cordons 18hrs 7 locations
3-06-2013 to
21-06-2013
6
Origin
Destination
Surveys and Mid-
Block Survey
18hrs 12 locations 5-06-2013 to
21-06-2013
7 Bus Occupancy
Surveys 18hrs
Vyttila hub
5-06-2013 to
21-06-2013
Aluva Private bus Stand
Ernakulam Jn
Ernakulam Town
& Major bus stops along the
corridor
8
Stated
Preference
Survey
2000+along
with OD
All major railway stations, bus
terminals and at OD locations
5-06-2013 to
21-06-2013
(Source: CDM Smith)
Figure 4.1 presents the survey locations. Survey formats are presented in Annexure
1.

Ridership Updation on Kochi Metro and Impact on Pollutants Final Report
CDM Smith 32 Kochi Metro Rail Ltd.
Figure 4.1 Traffic Survey Locations
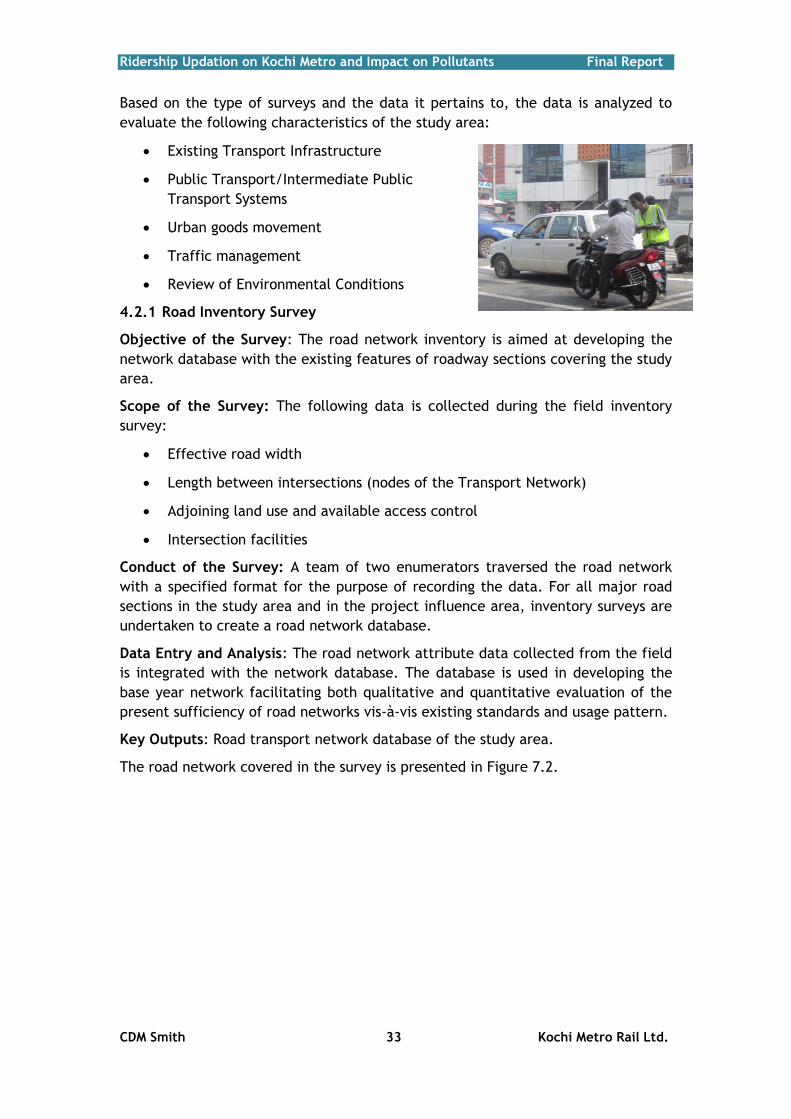
Ridership Updation on Kochi Metro and Impact on Pollutants Final Report
CDM Smith 33 Kochi Metro Rail Ltd.
Based on the type of surveys and the data it pertains to, the data is analyzed to
evaluate the following characteristics of the study area:
Existing Transport Infrastructure
Public Transport/Intermediate Public
Transport Systems
Urban goods movement
Traffic management
Review of Environmental Conditions
4.2.1 Road Inventory Survey
Objective of the Survey: The road network inventory is aimed at developing the
network database with the existing features of roadway sections covering the study
area.
Scope of the Survey: The following data is collected during the field inventory
survey:
Effective road width
Length between intersections (nodes of the Transport Network)
Adjoining land use and available access control
Intersection facilities
Conduct of the Survey: A team of two enumerators traversed the road network
with a specified format for the purpose of recording the data. For all major road
sections in the study area and in the project influence area, inventory surveys are
undertaken to create a road network database.
Data Entry and Analysis: The road network attribute data collected from the field
is integrated with the network database. The database is used in developing the
base year network facilitating both qualitative and quantitative evaluation of the
present sufficiency of road networks vis-à-vis existing standards and usage pattern.
Key Outputs: Road transport network database of the study area.
The road network covered in the survey is presented in Figure 7.2.

Ridership Updation on Kochi Metro and Impact on Pollutants Final Report
CDM Smith 34 Kochi Metro Rail Ltd.
Figure 4.2 Road Network (GCDA)
Salient features of the road network in the study area and in the project influence
area are presented below.

Ridership Updation on Kochi Metro and Impact on Pollutants Final Report
CDM Smith 35 Kochi Metro Rail Ltd.
Road Length: The survey covered the project corridor of about 25 km, 36 Km in
the project influence area. Details of major arterials and sub arterials in the study
area are collected to develop the model network for the project corridor.
Lane characteristics: The characteristics of the project corridor and the roads in
the project Influence area are presented in Table 4.2 and Table 4.3.
Table 4.2 Lane Characteristics – Project Corridor
SI.
No. From Node Via Route Road name
Lane
Type
Traffic
Management
1 Petta to Vyttila Jn. Chambakkara,
Thykoodam
Ettumanoor-
Ernakulam 2/UD Two-way
2 Vyttila Jn to
Pallimukku Jn.
Janatha bus stop,
Kadavanthra,
Ernakulam Jn.
Sahodaran
ayyappan 4/D Two-way
3 Pallimukku Jn to
Kacheripady Jn.
Jose Jn, Ground Jn,
PNVM hospital Mahatma Gandhi 4/D Two-way
4 Kacheripady Jn. Ernakulam town. Banerji 2/UD Two-way
5 Ernakulam town to
Palarivattom
Lissie Jn, Kaloor Jn,
Deshaabhimani Jn. Banerji 4/D Two-way
6 Palarivattom to
Edapally Jn.
Mamangalam,
Changampuzha park
Edapally-
Palarivattom 4/D Two-way
7 Edapally Jn to North
Kalamassery Jn.
Edapally Toll Jn,
Pathadipalam,
CUSAT
Salem-Ernakulam
Hwy 4/D Two-way
8 North Kalamassery
Jn. to Aluva
Muttom,
Ambattukavu,
Companypady Jn.
Salem-Ernakulam
Hwy 4/D Two-way
*D- Divided; UD-Undivided; Jn-Junction
(Source: Primary traffic survey 2013)
Observations
Majority of the roads are 4-lane divided with two-way traffic except
between Petta to Vytilla junction and Kacheripady junction to Ernakulam
town which is 2-lane divided.
Ettumanoor to Ernakulam road and Banerji road which starts from
Kacheripady to Ernakulam town consists of 2-lane undivided category with
two-way traffic.
The quality of the road is good along the project corridor and most of the
major junctions are signalized.
Table 4.3 Lane Characteristics of Roads – Project Influence Area
SI. No
From Node To Node Road name Lane Type
Traffic Management
1 PNVM hospital High court Jn. Banerji 4/D Two-way
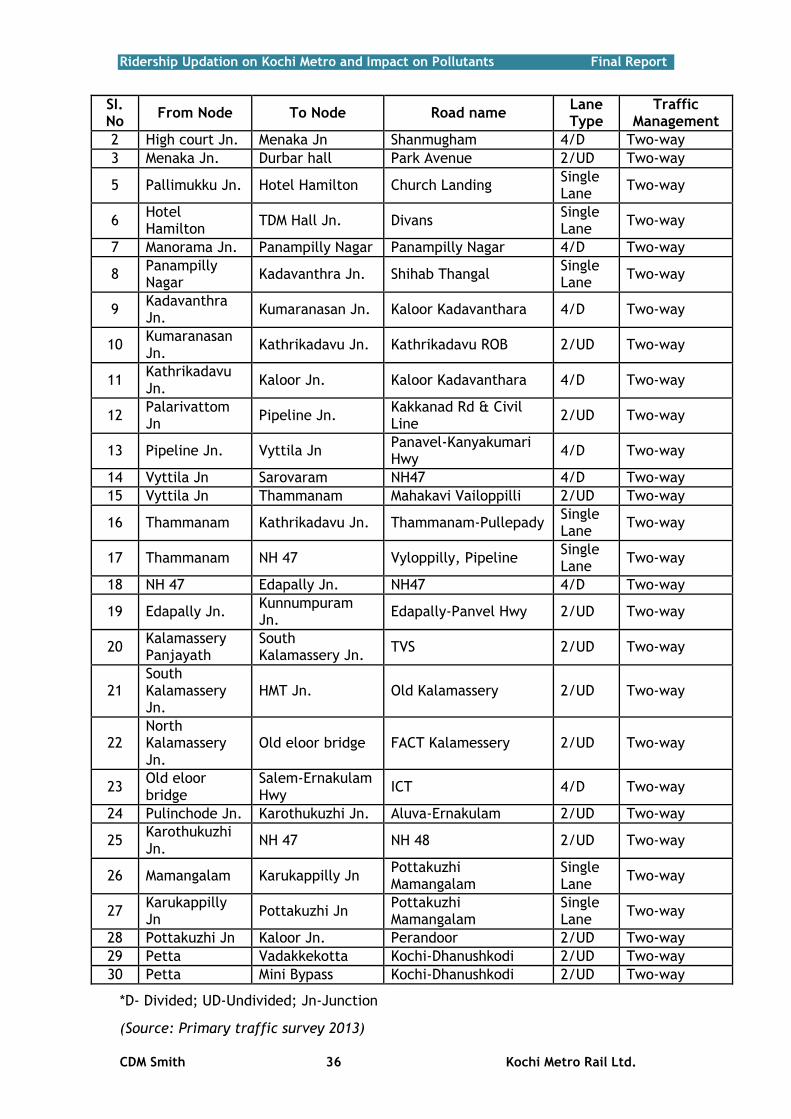
Ridership Updation on Kochi Metro and Impact on Pollutants Final Report
CDM Smith 36 Kochi Metro Rail Ltd.
SI. No
From Node To Node Road name Lane Type
Traffic Management
2 High court Jn. Menaka Jn Shanmugham 4/D Two-way
3 Menaka Jn. Durbar hall Park Avenue 2/UD Two-way
5 Pallimukku Jn. Hotel Hamilton Church Landing Single Lane
Two-way
6 Hotel Hamilton
TDM Hall Jn. Divans Single Lane
Two-way
7 Manorama Jn. Panampilly Nagar Panampilly Nagar 4/D Two-way
8 Panampilly Nagar
Kadavanthra Jn. Shihab Thangal Single Lane
Two-way
9 Kadavanthra Jn.
Kumaranasan Jn. Kaloor Kadavanthara 4/D Two-way
10 Kumaranasan Jn.
Kathrikadavu Jn. Kathrikadavu ROB 2/UD Two-way
11 Kathrikadavu Jn.
Kaloor Jn. Kaloor Kadavanthara 4/D Two-way
12 Palarivattom Jn
Pipeline Jn. Kakkanad Rd & Civil Line
2/UD Two-way
13 Pipeline Jn. Vyttila Jn Panavel-Kanyakumari Hwy
4/D Two-way
14 Vyttila Jn Sarovaram NH47 4/D Two-way
15 Vyttila Jn Thammanam Mahakavi Vailoppilli 2/UD Two-way
16 Thammanam Kathrikadavu Jn. Thammanam-Pullepady Single Lane
Two-way
17 Thammanam NH 47 Vyloppilly, Pipeline Single Lane
Two-way
18 NH 47 Edapally Jn. NH47 4/D Two-way
19 Edapally Jn. Kunnumpuram Jn.
Edapally-Panvel Hwy 2/UD Two-way
20 Kalamassery Panjayath
South Kalamassery Jn.
TVS 2/UD Two-way
21 South Kalamassery Jn.
HMT Jn. Old Kalamassery 2/UD Two-way
22 North Kalamassery Jn.
Old eloor bridge FACT Kalamessery 2/UD Two-way
23 Old eloor bridge
Salem-Ernakulam Hwy
ICT 4/D Two-way
24 Pulinchode Jn. Karothukuzhi Jn. Aluva-Ernakulam 2/UD Two-way
25 Karothukuzhi Jn.
NH 47 NH 48 2/UD Two-way
26 Mamangalam Karukappilly Jn Pottakuzhi Mamangalam
Single Lane
Two-way
27 Karukappilly Jn
Pottakuzhi Jn Pottakuzhi Mamangalam
Single Lane
Two-way
28 Pottakuzhi Jn Kaloor Jn. Perandoor 2/UD Two-way
29 Petta Vadakkekotta Kochi-Dhanushkodi 2/UD Two-way
30 Petta Mini Bypass Kochi-Dhanushkodi 2/UD Two-way
*D- Divided; UD-Undivided; Jn-Junction
(Source: Primary traffic survey 2013)

Ridership Updation on Kochi Metro and Impact on Pollutants Final Report
CDM Smith 37 Kochi Metro Rail Ltd.
Observations
Around 41% of roads are 2-lane undivided characteristics and about 36% of
roads are 4-lane divided with two-way.
Twenty three percent of roads are single lane with two-way.
Among the major roads in the project influence area, 95% of the roads are
of good quality.
Type of Carriageway
The share of various types of road carriageways on the project corridor and in the
project influence area is presented in Table 4.4 and Table 4.5. The largest share of
roads in the project corridor is of 4-lane divided carriage ways (87%) and in the
project influence area is of 2-lane undivided carriage ways (41%).
Table 4.4 Type of Carriageway – Project Corridor
Sl. No Carriage way type Total Length (Km) % of length
1 2-lane undivided 3.3 13%
2 4-lane divided 21.7 87%
Total 25.0 100%
(Source: Primary traffic survey 2013)
Figure 4.3 Type of Carriageway – Project Corridor
Table 4.5 Type of Carriageway – Project Influence Area
Sl. No Carriage way type Total Length (Km) % of length
1 Single lane 8.20 23%
2 2-lane undivided 14.65 41%
3 4-lane divided 12.80 36%
Total 35.65 100%
(Source: Primary traffic survey 2013)

Ridership Updation on Kochi Metro and Impact on Pollutants Final Report
CDM Smith 38 Kochi Metro Rail Ltd.
Figure 4.4 Type of Carriageway – Project Influence Area
Table 4.6 presents the major intersections and the connecting roads to the project
corridor.
Table 4.6 Major Roads – Project Corridor
Major Junction
Name
Type of
Intersection/
Junction
Major Crossing Road Road Name
Petta 3-arm Kochi-Dhanushkodi road Ettumanoor-
Ernakulam road
Thykoodam 3-arm Church road Ettumanoor-
Ernakulam road
Vyttila Jn 4-arm NH 47 and Kaniampuzha road Sahodaran
Ayyappan road
Janatha Jn. 3-arm Vytilla Janatha road Sahodaran
Ayyappan road
Elamkulam Jn. 3-arm Chilavannur road Sahodaran
Ayyappan road
Kadavanthara 4-arm Kaloor Kadavanthra road and KP
Vallon road
Sahodaran
Ayyappan road
Manorama Jn. 3-arm Panampilly nagar Avenue Sahodaran
Ayyappan road
Valanjambalam
Jn. 4-arm Chittoor road and Ravipuram road
Sahodaran
Ayyappan road
Pallimukku Jn. 4-arm Church landing road and SA road Mahatma Gandhi
road
Jose Jn. 4-arm Durbar Hall road Mahatma Gandhi
road
PNVM hospital
Jn. 3-arm Mahatma Gandhi road Banerji road.
Kacheripady Jn. 4-arm Chittoor road Banerji road.
Ernakulam town 3-arm Paramara road Banerji road.
Lissie Jn. 4-arm Golden Jubilee road and Judges
Avenue Banerji road.

Ridership Updation on Kochi Metro and Impact on Pollutants Final Report
CDM Smith 39 Kochi Metro Rail Ltd.
Major Junction
Name
Type of
Intersection Major Crossing Road Road Name
Mathrubhumi
Jn.
4-arm
Junction Azad road and Asoka road Banerji road.
Deshabhimani
Jn.
4-arm
Junction Desabhimani road and Ponoth road Banerji road.
Stadium Rd Jn. 3-arm
Junction Stadium road Banerji road.
Changampuzha
Park
3-arm
Junction Edapally Raghavan pillai road
Palarivattom
Edapally road
Edapally Jn. 4-arm
Junction Edapally Panavel Hwy and NH48
Palarivattom
Edapally road
CUSAT
University Jn
4-arm
Junction University road and TOG road
Salem-Ernakulam
Hwy
North
Kalamassery Jn
3-arm
Junction FACT Kalamassery road
Salem-Ernakulam
Hwy
Companypady
Jn.
3-arm
Junction SWTS road
Salem-Ernakulam
Hwy
*Jn: Junction
(Source: Primary traffic survey 2013)
Figure 4.5 presents the distribution of road network by number of lanes in the
GCDA.
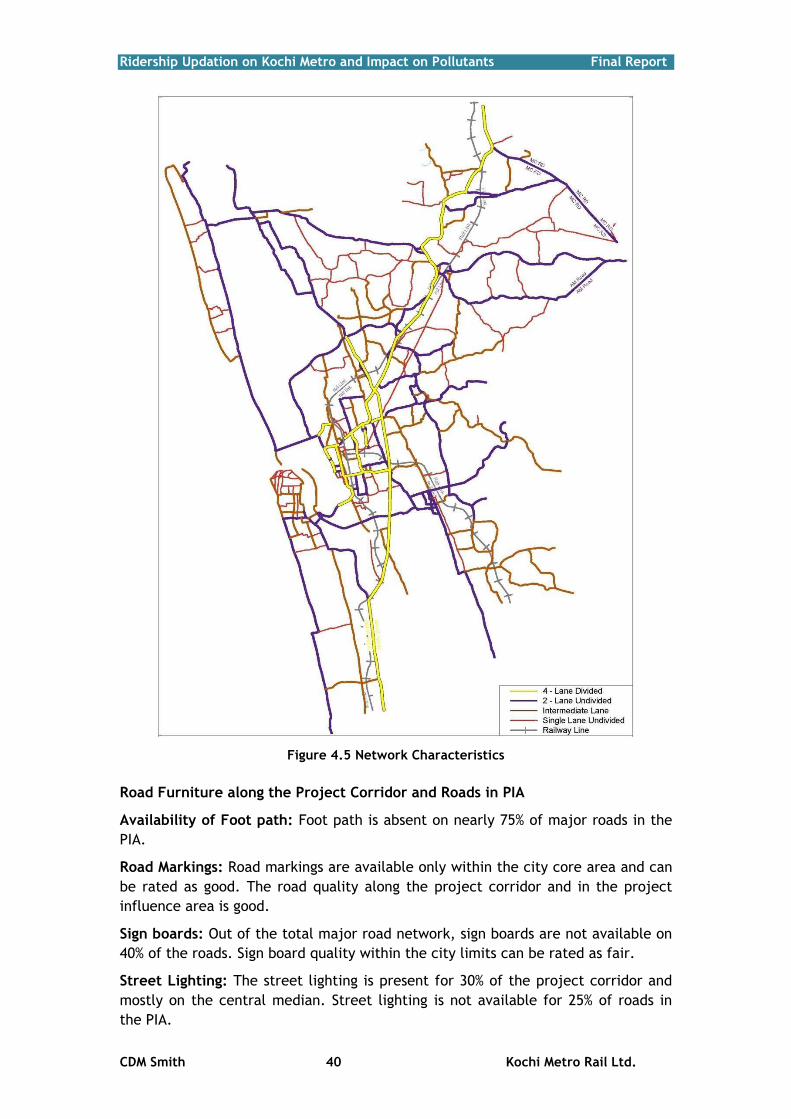
Ridership Updation on Kochi Metro and Impact on Pollutants Final Report
CDM Smith 40 Kochi Metro Rail Ltd.
Figure 4.5 Network Characteristics
Road Furniture along the Project Corridor and Roads in PIA
Availability of Foot path: Foot path is absent on nearly 75% of major roads in the
PIA.
Road Markings: Road markings are available only within the city core area and can
be rated as good. The road quality along the project corridor and in the project
influence area is good.
Sign boards: Out of the total major road network, sign boards are not available on
40% of the roads. Sign board quality within the city limits can be rated as fair.
Street Lighting: The street lighting is present for 30% of the project corridor and
mostly on the central median. Street lighting is not available for 25% of roads in
the PIA.

Ridership Updation on Kochi Metro and Impact on Pollutants Final Report
CDM Smith 41 Kochi Metro Rail Ltd.
4.2.2 Speed and Delay
Objective of the Survey: To find out the journey speed, running speed and types
of delay such as stopped delay and operational delay, and to evaluate the level of
service or quality of traffic flow of a road or entire road network system. This will
be used to develop the speed flow equations and to validate the transport model.
Scope of the Survey: To conduct the speed study on all major corridors during
peak and off-peak hours on any normal day. The overall travel speed generally
referred to as journey speed is the effective speed between two points, and is
computed by the distance divided by the total time taken by the vehicle to
complete the journey including delays incurred en-route.
Conduct of the Survey: The survey is conducted during peak and off-peak hours on
a normal day using moving observer method. The survey vehicle is moved in the
stream of traffic during different times of the day in both peak and off peak
periods. The delays and corresponding causative factors at intersections/major
activity centers is collected to identify major bottlenecks on the road.
Data Entry and Analysis: Speed and delay data collected on identified travel
corridors of road network in the study area and along the project influence area.
The observed journey speed and running speed along the project corridor are
presented in Figure 4.6 and Figure 4.7 respectively. The direction wise journey
speed and running speed observed on the project corridor and in the project
influence area are presented in Table 4.7 and Table 4.8 respectively.
The observed journey speed in project influence area is presented in Figure 4.8.
Key Outputs: Journey speeds and Running speeds (kmph) & Speed Flow
equations

Ridership Updation on Kochi Metro and Impact on Pollutants Final Report
CDM Smith 42 Kochi Metro Rail Ltd.
Figure 4.6 Journey Speeds - Project Corridor
The journey speed is less than 20 kmph between Vytilla and Palarivattam on the
project corridor. Being the main spine of the core city area, this road
accommodates the major establishments, private and Govt. offices, attracting the
daily commuters in the peak hour. Delay at junctions is the main cause of the delay
leading to lower speeds on the corridor between Vytilla and Palarivattam.

Ridership Updation on Kochi Metro and Impact on Pollutants Final Report
CDM Smith 43 Kochi Metro Rail Ltd.
Figure 4.7 Running Speeds - Project Corridor

Ridership Updation on Kochi Metro and Impact on Pollutants Final Report
CDM Smith 44 Kochi Metro Rail Ltd.
Figure 4.8 Journey Speeds - Project Influence Area

Ridership Updation on Kochi Metro and Impact on Pollutants Final Report
CDM Smith 45 Kochi Metro Rail Ltd.
Table 4.7 Observed Journey Speeds and Running Speeds – Project Corridor
SI.
No From To
Distance
in Km Peak
Journey
time
taken
in mins
Average
JS
(Kmph)
Delay
in
mins
Average
RS
(Kmph)
1 Aluva Companypady
Jn. 2.1
EP 4.49 28.06 1.29 39.38
MP 4.59 27.45 1.20 37.17
O 4.48 28.13 28.13
2 Companypady
Jn. Muttom 1.9
EP 4.6 24.78 24.78
MP 5.09 22.40 24.31
O 4.58 24.89 24.89
3 Muttom North
Kalamassery Jn 1.8
EP 5.37 20.11 0.16 20.73
MP 4.37 24.71 24.71
O 3.39 31.86 31.86
4 North
Kalamassery Jn Pathadipalam 2.6
EP 6.16 25.32 27.08
MP 6.05 25.79 1.03 33.77
O 5.4 28.89 28.89
5 Pathadipalam Edapally Jn. 1.7
EP 5.08 20.08 2.35 37.36
MP 4.37 23.34 23.34
O 5.33 19.14 2.18 32.38
6 Edapally Jn. Mamangalam 1.9
EP 6.17 18.48 1.39 23.29
MP 5.54 20.58 1.48 25.12
O 5.22 21.84 21.84
7 Mamangalam Deshabhimani
Jn. 1.7
EP 5.45 18.72 3.28 47.00
MP 5.32 19.17 1.25 27.79
O 5.07 20.12 1.32 30.45
8 Deshabhimani
Jn. Lissie Jn. 1.2
EP 3.54 20.34 2.00 46.75
MP 4.09 17.60 2.12 45.86
O 3.54 20.34 2.04 48.00
9 Lissie Jn. Kacheripady 1.2
EP 3.01 23.92 1.10 37.70
MP 3.56 20.22 2.07 48.32
O 3.54 20.34 20.34
10 Kacheripady Shenoys 1.4
EP 4.29 19.58 2.20 40.19
MP 4.53 18.54 0.14 19.13
O 4.09 20.54 1.08 32.18
11 Shenoys Valanjambalam 1.6
EP 5.05 19.01 2.10 32.49
MP 5.15 18.64 2.43 35.29
O 4.15 23.13 1.01 30.57
12 Valanjambalam Kadavanthra 1.1
EP 3.37 19.58 2.00 48.18
MP 3.57 18.49 2.04 43.14
O 2.82 23.40 1.39 46.15
13 Kadavanthra Janatha stop 1.5
EP 4.31 20.88 2.41 47.37
MP 4.59 19.61 19.61
O 4.01 22.44 1.15 36.59

Ridership Updation on Kochi Metro and Impact on Pollutants Final Report
CDM Smith 46 Kochi Metro Rail Ltd.
SI.
No From To
Distance
in Km Peak
Journey
time
taken
in mins
Average
JS
(Kmph)
Delay
in
mins
Average
RS
(Kmph)
14 Janatha stop Vyttila bus
stop 0.8
EP 2.01 23.88 1.04 49.48
MP 2.46 19.51 0.21 21.33
O 2.38 20.17 1.32 45.28
15 Vyttila bus
stop Thykoodam 1.2
EP 3.02 23.84 0.50 33.96
MP 3.59 20.06 1.00 27.80
O 3.06 23.53 0.30 26.09
16 Thykoodam Petta 1.3
EP 3.55 21.97 21.97
MP 3.41 22.87 1.36 38.05
O 2.2 35.45 35.45
*EP: Evening Peak; MP: Morning Peak O: Off-peak; JS: Journey speed; RS: Running Speed; Jn: Junction
(Source: Primary traffic survey 2013)
Table 4.8 Observed Journey Speeds – Project Influence Area
SI.
No From Node To Node Road Name
Distance
in Km
Average
JS in
Kmph
1 PNVM hospital High court Jn. Banerji road 0.50 19.74
2 High court Jn. Menaka Jn. Shanmugham road 1.00 34.29
3 Menaka Jn. Durbar hall Park Avenue 1.80 12.04
4 Durbar hall Jose Jn. Durbar hall road 0.50 25.21
5 Pallimukku Jn. Hotel Hamilton Church Landing road 0.80 20.87
6 Hotel Hamilton TDM Hall Jn. Divans road 0.70 16.22
7 Manorama Jn. Panampilly Nagar Panampilly Nagar
Avenue 0.90 18.00
8 Panampilly Nagar Kadavanthra Jn. Shihab Thangal road 1.60 13.06
9 Kadavanthra Jn. Kumaranasan Jn. Kaloor Kadavanthara
road 0.60 15.00
10 Kumaranasan Jn. Kathrikadavu Jn. Kathrikadavu ROB 0.60 13.95
11 Kathrikadavu Jn. Kaloor Jn. Kaloor Kadavanthara
road 0.50 19.74
12 Palarivattom Jn Pipeline Jn. Kakkanad road & Civil
Line road. 0.70 13.55
13 Pipeline Jn. Vyttila Jn Panavel-Kanyakumari
Highway 4.00 34.09
14 Vyttila Jn. Sarovaram NH47 2.20 33.76
15 Vyttila Jn Thammanam Mahakavi Vailoppilli road 1.10 20.56
16 Thammanam Kathrikadavu Jn. Thammanam-Pullepady 2.50 16.22

Ridership Updation on Kochi Metro and Impact on Pollutants Final Report
CDM Smith 47 Kochi Metro Rail Ltd.
*JS: Journey speed; Jn: Junction
(Source: Primary traffic survey 2013)
4.3 Traffic and Travel Characteristics
4.3.1 Midblock Flows
Objective of the survey: To assess the total mode wise traffic along the project
corridor for the peak hour and during the operation period of the proposed metro.
Scope of the survey: This includes identification of the homogenous sections and
the midblock traffic count stations and count of vehicles classified by the type of
vehicle crossing the midblock during the peak and off-peak periods.
Conduct of the survey: Manual traffic counts are carried out on a typical working
day between 5.00:23.00 at the identified locations. At each identified station,
directional counts are carried out by vehicle type. i.e. cars, taxis, buses, trucks, 2-
wheelers, 3-wheelers and slow moving vehicles.
Data entry and analysis: The traffic data collected at identified locations is
scrutinized and processed.
Key Outputs
SI.
No From Node To Node Road Name
Distance
in Km
Average
JS in
Kmph
17 Thammanam NH 47 Vyloppilly road, Pipeline
road 0.90 15.88
18 NH 47 Edapally Jn. NH47 2.40 23.84
19 Edapally Jn. Kunnumpuram Jn. Edapally-Panvel Highway 2.30 21.33
20 Kalamassery
Panjayath
South Kalamassery
Jn. TVS road 0.90 19.29
21 South
Kalamassery Jn. HMT Jn. Old Kalamassery road 0.70 34.43
22 North
Kalamassery Jn. Old eloor bridge FACT Kalamessery road 2.75 20.12
23 Old eloor bridge Salem-Ernakulam
Hwy ICT road 0.70 35.00
24 Pulinchode Jn. Karothukuzhi Jn. Aluva-Ernakulam road 0.80 34.78
25 Mamangalam Karukappilly Jn. Pottakuzhi Mamangalam
road 1.40 16.80
26 Karukappilly Jn. Pottakuzhi Jn. Pottakuzhi Mamangalam
road 0.30 18.00
27 Pottakuzhi Jn. Kaloor Jn. Perandoor road 1.30 15.60
28 Petta Mini Bypass road Kochi-Dhanushkodi road 3.20 27.43

Ridership Updation on Kochi Metro and Impact on Pollutants Final Report
CDM Smith 48 Kochi Metro Rail Ltd.
Peak hour volume at the survey stations (Vehicles/Hr and PCU/Hr)
Share of traffic in the peak hour
Traffic composition
Observed traffic at all the survey locations along the project corridors is presented
in Table 4.10. The PCUs corresponding to urban roads as per IRC: 106-1990 is used
for converting vehicles to equivalent passenger car units. PCU values adopted is
given in Table 4.9. The volume count summary is given in Annexure 2.
Table 4.9 Equivalency Factors by Type of Vehicles
Vehicle Type
PCU Value
Urban
UP TO 5 % > 5%
City buses Public/Private 2.2 3.7
Long Distance Bus Public/Private 2.2 3.7
Institutional/ Company Buses 2.2 3.7
Mini Bus 1.5 1.5
Car 1 1
Taxi 1 1
2-Wheeler 0.5 0.75
3-Wheeler 1.2 2
Share Auto 1.2 2
Trucks 2.2 3.7
MAV & above 4 5
LCV 1.4 2
Cycles 0.4 0.5
Others 2 3
(Source: IRC 106-1990)
Traffic Volume: The traffic volume (18 Hours) at midblock locations is presented in
Table 4.10.
Table 4.10 Traffic Volume (18 Hours) at Midblock Locations
Sl.
No Location
Name of the
Road
Direction 1 Direction 2 Total
Towards Petta Towards Aluva
Vehicles PCUs Vehicles PCUs Vehicles PCUs
1 Chumbakkara Ettumanoor-
Ernakulam 11576 14126 11602 15094 23178 29,220

Ridership Updation on Kochi Metro and Impact on Pollutants Final Report
CDM Smith 49 Kochi Metro Rail Ltd.
2 Edapally
Salem-
Ernakulam
Highway 29,586 33,380 28,888 33,659 58,474 67,040
3 Kalamessery
Salem-
Ernakulam
Highway
25,945 36,202 31,343 50,504 57,288 86,706
4 MG road MG road 19,208 21,848 25,347 30,929 44,555 52,777
5 Vytilla SA road 24,876 27,664 37,554 37,664 62,430 65,328
(Source: Primary traffic survey 2013)
Peak Hour Traffic: The peak hour traffic volume is presented in Table 4.11. The
share of traffic during the peak hour ranges between 6.2% and 12%.
Table 4.11 Peak Hour Traffic at Midblock Locations
Sl.
No. Location
Name of the
Road Peak Hour
Peak
Traffic
Traffic
(18hrs) Share of
Peak Traffic
(%) in PCU in PCU
1 Chumbakkara Ettumanoor-
Ernakulam 08.30-09.30 3,438 29,220 12%
2 Edapally Salem-
Ernakulam
Highway
08.45-09.45 5,186 67,040 7.7%
3 Kalamessery Salem-
Ernakulam
Highway
11.00-12.00 5,386 86,706 6.2%
4 MG road MG road 11.00-12.00 4,314 52,777 8.2%
5 Vytilla SA road 09.00-10.00 6,666 65,328 10.2%
(Source: Primary traffic survey 2013)
The analysis on the share of traffic in the peak hours demonstrates that the peak
period for the project corridor in the morning is between 08:00 to 11:00 hrs.
Hourly Distribution: The hourly distribution of traffic along the project corridor is
presented in Figure 4.9.

Ridership Updation on Kochi Metro and Impact on Pollutants Final Report
CDM Smith 50 Kochi Metro Rail Ltd.
Figure 4.9 Hourly Traffic Distribution
Traffic Composition: Composition of traffic during peak hour is presented in Figure
4.10. Private modes dominated with 73% followed by 21% of public transport and
intermediate public transport (IPT). IPT include 3-wheelers and taxis (4-wheelers).
Table 4.12 presents an average vehicle composition for the surveyed locations on
the project corridor during 9.00:10.00.
Figure 4.10 Traffic Composition - Peak Hour
Obervations
Highest volume - 86706 PCU at Kalamassery location, Salem Ernakulam
Highway road in between 18 Hours.
Share of peak traffic is only 6.2% at Kalamassery illustrating a uniform
flow over the day
Traffic at Edapally and Vytilla is in the range of 65000 PCUs

Ridership Updation on Kochi Metro and Impact on Pollutants Final Report
CDM Smith 51 Kochi Metro Rail Ltd.
Seventy three percent accounts to private modes with almost fifty
percent contributed by 2-wheelers illustrating that significant share of
commuters choose 2-wheelers as their mode to work.
Goods traffic is maximum at Kalamassery with 6% i.e. on NH47 Salem
Ernakulam Highway road for 18 hours.

Ridership Updation on Kochi Metro and Impact on Pollutants Final Report
CDM Smith 52 Kochi Metro Rail Ltd.
Table 4.12 Vehicle Composition (9.00:10.00)
odes
Chumbakkara Edapally Kalamessery MG road Vytilla
Vytilla to
Petta
Petta to
Vytilla
Aluva to
Palarivattom
Palarivattom
to Aluva
Aluva to
Ernakulam
Ernakulam
to Aluva
Vytilla to
Ernakulam
Ernakulam
to Vytilla
Kadavanthra
to Vytilla
Vytilla to
Kadavanthra
City bus Public 9 27 46 19 27 37 3 6 31 32
Private 49 60 69 49 30 30 26 24 68 87
Institutional/
Company Bus 6 4 2 11 3 9 0 0 8 1
Mini Bus 8 4 5 9 6 15 2 3 14 4
Long
Distance Bus
Public 19 5 4 11 38 20 21 1 5 14
Private 15 0 5 3 10 10 18 1 0 8
Car 287 506 353 607 700 446 335 348 506 787
Taxi 78 159 194 104 277 102 70 48 73 211
2-Wheelers 525 572 2137 756 491 397 665 610 1080 3432
3-Wheelers 133 164 169 233 77 189 377 291 141 331
LCV 44 45 77 42 85 227 32 28 22 66
Trucks 19 30 34 23 120 170 8 0 10 6
MAV and Above 9 22 1 0 60 44 0 0 1 0
Cycles 4 0 5 4 0 2 0 11 2 0
Others 3 0 0 1 0 2 0 1 0 0
Total Vehicles 1208 1598 3101 1872 1924 1700 1557 1372 1961 4979
Total PCUs 1422 1946 2969 2080 2564 2515 1900 1558 1996 4670
(Source: Primary traffic survey 2013)
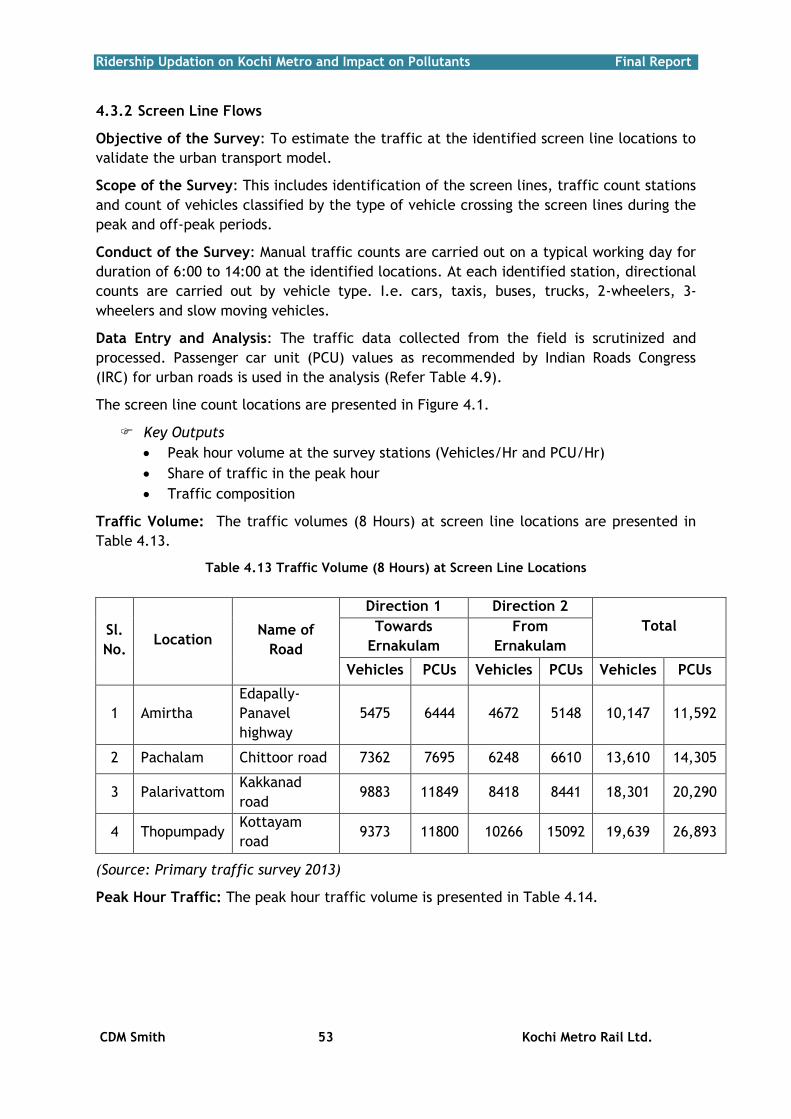
Ridership Updation on Kochi Metro and Impact on Pollutants Final Report
CDM Smith 53 Kochi Metro Rail Ltd.
4.3.2 Screen Line Flows
Objective of the Survey: To estimate the traffic at the identified screen line locations to
validate the urban transport model.
Scope of the Survey: This includes identification of the screen lines, traffic count stations
and count of vehicles classified by the type of vehicle crossing the screen lines during the
peak and off-peak periods.
Conduct of the Survey: Manual traffic counts are carried out on a typical working day for
duration of 6:00 to 14:00 at the identified locations. At each identified station, directional
counts are carried out by vehicle type. I.e. cars, taxis, buses, trucks, 2-wheelers, 3-
wheelers and slow moving vehicles.
Data Entry and Analysis: The traffic data collected from the field is scrutinized and
processed. Passenger car unit (PCU) values as recommended by Indian Roads Congress
(IRC) for urban roads is used in the analysis (Refer Table 4.9).
The screen line count locations are presented in Figure 4.1.
Key Outputs
Peak hour volume at the survey stations (Vehicles/Hr and PCU/Hr)
Share of traffic in the peak hour
Traffic composition
Traffic Volume: The traffic volumes (8 Hours) at screen line locations are presented in
Table 4.13.
Table 4.13 Traffic Volume (8 Hours) at Screen Line Locations
Sl.
No. Location
Name of
Road
Direction 1 Direction 2
Total Towards
Ernakulam
From
Ernakulam
Vehicles PCUs Vehicles PCUs Vehicles PCUs
1 Amirtha
Edapally-
Panavel
highway
5475 6444 4672 5148 10,147 11,592
2 Pachalam Chittoor road 7362 7695 6248 6610 13,610 14,305
3 Palarivattom Kakkanad
road 9883 11849 8418 8441 18,301 20,290
4 Thopumpady Kottayam
road 9373 11800 10266 15092 19,639 26,893
(Source: Primary traffic survey 2013)
Peak Hour Traffic: The peak hour traffic volume is presented in Table 4.14.
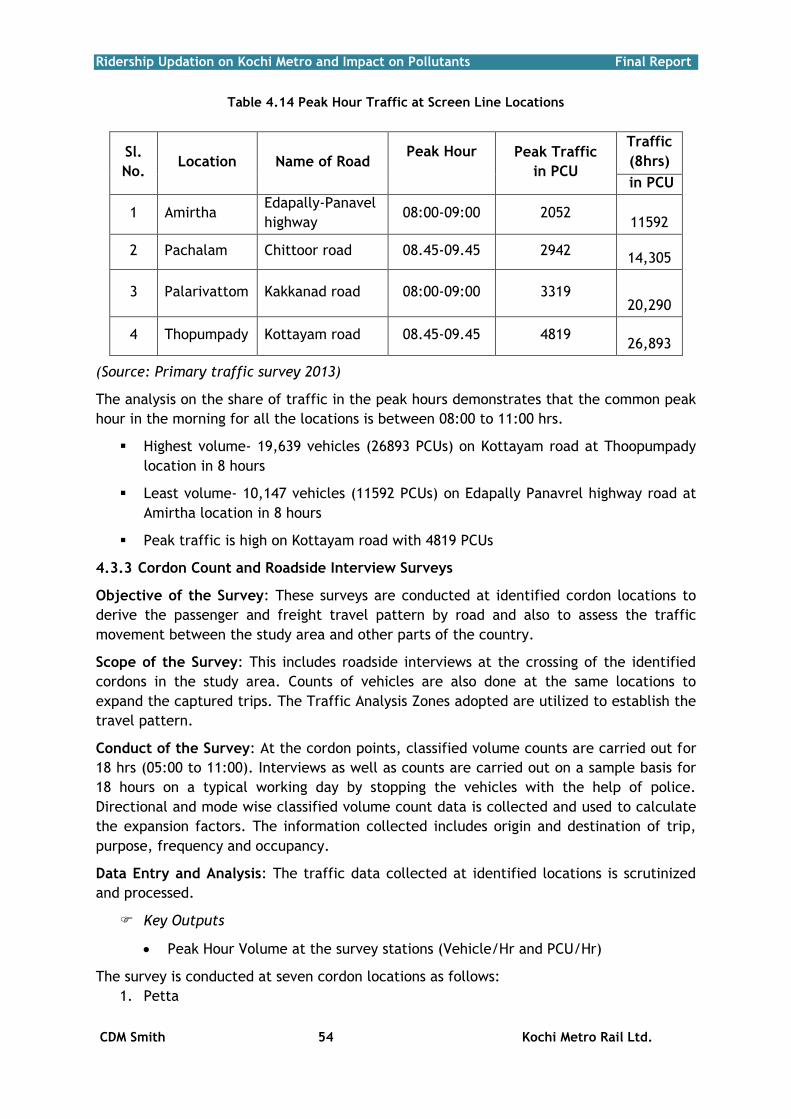
Ridership Updation on Kochi Metro and Impact on Pollutants Final Report
CDM Smith 54 Kochi Metro Rail Ltd.
Table 4.14 Peak Hour Traffic at Screen Line Locations
Sl.
No. Location Name of Road
Peak Hour Peak Traffic
in PCU
Traffic
(8hrs)
in PCU
1 Amirtha Edapally-Panavel
highway 08:00-09:00 2052
11592
2 Pachalam Chittoor road 08.45-09.45 2942 14,305
3 Palarivattom Kakkanad road 08:00-09:00 3319 20,290
4 Thopumpady Kottayam road 08.45-09.45 4819 26,893
(Source: Primary traffic survey 2013)
The analysis on the share of traffic in the peak hours demonstrates that the common peak
hour in the morning for all the locations is between 08:00 to 11:00 hrs.
Highest volume- 19,639 vehicles (26893 PCUs) on Kottayam road at Thoopumpady
location in 8 hours
Least volume- 10,147 vehicles (11592 PCUs) on Edapally Panavrel highway road at
Amirtha location in 8 hours
Peak traffic is high on Kottayam road with 4819 PCUs
4.3.3 Cordon Count and Roadside Interview Surveys
Objective of the Survey: These surveys are conducted at identified cordon locations to
derive the passenger and freight travel pattern by road and also to assess the traffic
movement between the study area and other parts of the country.
Scope of the Survey: This includes roadside interviews at the crossing of the identified
cordons in the study area. Counts of vehicles are also done at the same locations to
expand the captured trips. The Traffic Analysis Zones adopted are utilized to establish the
travel pattern.
Conduct of the Survey: At the cordon points, classified volume counts are carried out for
18 hrs (05:00 to 11:00). Interviews as well as counts are carried out on a sample basis for
18 hours on a typical working day by stopping the vehicles with the help of police.
Directional and mode wise classified volume count data is collected and used to calculate
the expansion factors. The information collected includes origin and destination of trip,
purpose, frequency and occupancy.
Data Entry and Analysis: The traffic data collected at identified locations is scrutinized
and processed.
Key Outputs
Peak Hour Volume at the survey stations (Vehicle/Hr and PCU/Hr)
The survey is conducted at seven cordon locations as follows:
1. Petta

Ridership Updation on Kochi Metro and Impact on Pollutants Final Report
CDM Smith 55 Kochi Metro Rail Ltd.
2. Kadavanthra
3. MG road
4. CUSAT
5. Angamally
6. NH Vyttila
7. Aroor
Traffic Volume: The traffic volume (18 Hours) at cordon locations is presented in Table
4.15.
Table 4.15 Traffic Volume (18 Hours) at Cordon Locations
Sl.
No. Location Name of Road
Direction 1 Direction 2 Total
Towards Ernakulam From Ernakulam
Vehicles PCUs Vehicles PCUs Vehicles PCUs
1 Angamally
NH 47
(Kaniyakumari
highway)
20261 31115 23135 32966 43,396 64,081
2 Aroor
NH 47
(Kanyakumari
highway)
29770 35482 26654 35090 56,424 70,572
3 Paravoor
NH 17
(Vazhikulangara
-Anachaal road)
9881 14727 7873 11342 17,754 26,069
4 Perumbavoor Aluva-Munnar
road 19777 24520 16859 23821 36,636 48,341
5 Puthiyakavu Kottayam road 12775 14790 13115 15730 25,890 30,520
6 Thiruvakulam Madurai road 8689 10550 9586 11620 18,275 22,171
7 Wonderla Kakkanad-
Pallikara road 5124 7483 4579 6782 9,703 14,265
(Source: Primary traffic survey 2013)
Peak Hour Traffic: The peak hour traffic volume is presented in Table 4.16.
Table 4.16 Peak Hour Traffic at Cordon Locations
Sl. No. Location Name of Road Peak
Hour
Peak
Traffic
in PCU
Traffic
(18hrs)
in PCU
1 Angamally NH 47 (Kaniyakumari
highway) 08:00-09:00 4339 64081
2 Aroor NH 47 (Kanyakumari
highway) 08.45-09.45 6191 70572

Ridership Updation on Kochi Metro and Impact on Pollutants Final Report
CDM Smith 56 Kochi Metro Rail Ltd.
Sl. No. Location Name of Road Peak
Hour
Peak
Traffic
in PCU
Traffic
(18hrs)
in PCU
4 Perumbavoor Aluva-Munnar road 09.45-10.45 3508 48341
5 Puthiyakavu Kottayam road 08.30-09.30 3178 30520
6 Thiruvakulam Madurai road 09.00-10.00 1713 22171
7 Wonderla Kakkanad-Pallikara
road 10.00-11.00 1152 14265
(Source: Primary traffic survey 2013)
The analysis on the share of traffic in the peak hours demonstrates that the peak period
for the project corridor in the morning is between 08:00 to 11:00.
Highest volume- 56, 424 vehicles (70572 PCUs) at Aroor on NH47 Kaniyakumari
highway road in 18 hours
Least volume- 9,703 vehicles at Wonderla on Kakkanad-Pallikara road in 18 hours.
Peak traffic ranges between 1100 to 6220 PCUs with the highest observed at Aroor
on NH 47 Kaniyakumari highway road.
4.3.4 Trip Characteristics
4.3.4.1 Zoning System Adopted
The study area is broadly classified into two regions: Kochi City Corporation limit and the
area outside the city limits including six municipalities and villages. The entire study area
is divided into a total of 132 zones, out of which 1 to 74 zones are within the corporation
and 51 zones outside the city limit. Seven external zones outside the study area are
considered from which significant floating population move towards the city. Figure 4.11
presents the zone system adopted for the study analysis. List of zones is presented in
Annexure 3.

Ridership Updation on Kochi Metro and Impact on Pollutants Final Report
CDM Smith 57 Kochi Metro Rail Ltd.
Figure 4.11 Zoning System
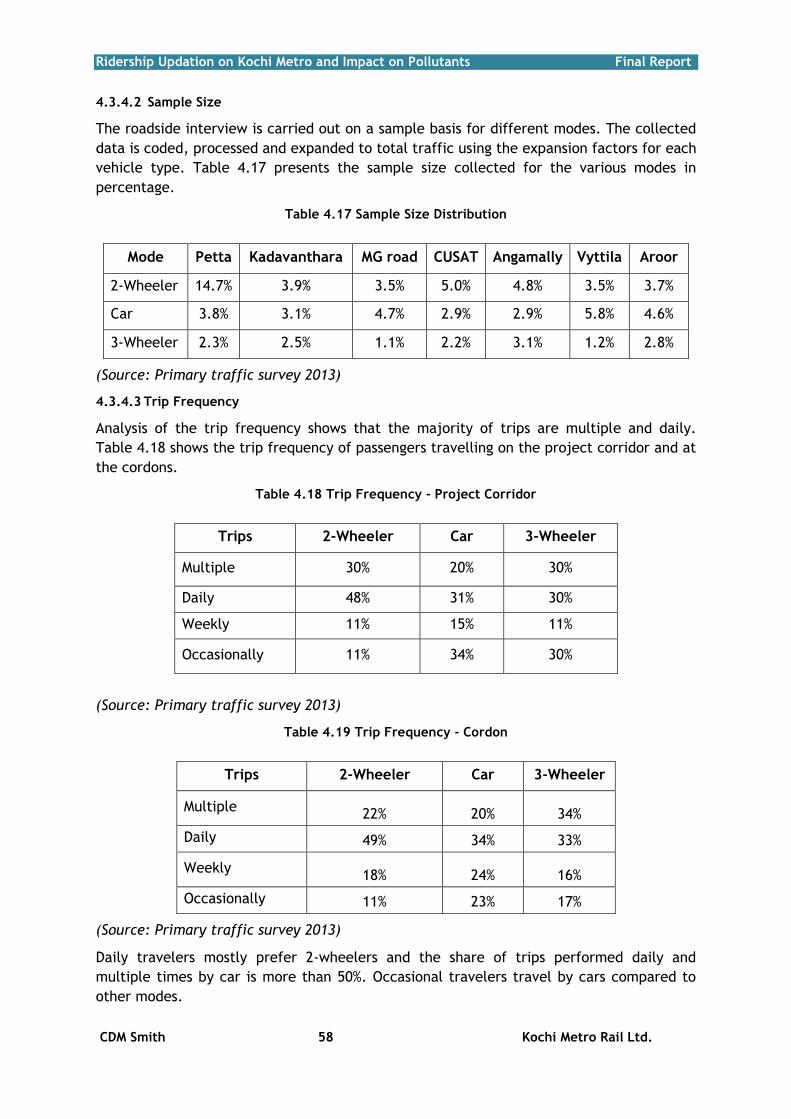
Ridership Updation on Kochi Metro and Impact on Pollutants Final Report
CDM Smith 58 Kochi Metro Rail Ltd.
4.3.4.2 Sample Size
The roadside interview is carried out on a sample basis for different modes. The collected
data is coded, processed and expanded to total traffic using the expansion factors for each
vehicle type. Table 4.17 presents the sample size collected for the various modes in
percentage.
Table 4.17 Sample Size Distribution
Mode Petta Kadavanthara MG road CUSAT Angamally Vyttila Aroor
2-Wheeler 14.7% 3.9% 3.5% 5.0% 4.8% 3.5% 3.7%
Car 3.8% 3.1% 4.7% 2.9% 2.9% 5.8% 4.6%
3-Wheeler 2.3% 2.5% 1.1% 2.2% 3.1% 1.2% 2.8%
(Source: Primary traffic survey 2013)
4.3.4.3 Trip Frequency
Analysis of the trip frequency shows that the majority of trips are multiple and daily.
Table 4.18 shows the trip frequency of passengers travelling on the project corridor and at
the cordons.
Table 4.18 Trip Frequency - Project Corridor
Trips 2-Wheeler Car 3-Wheeler
Multiple 30% 20% 30%
Daily 48% 31% 30%
Weekly 11% 15% 11%
Occasionally 11% 34% 30%
(Source: Primary traffic survey 2013)
Table 4.19 Trip Frequency - Cordon
Trips 2-Wheeler Car 3-Wheeler
Multiple 22% 20% 34%
Daily 49% 34% 33%
Weekly 18% 24% 16%
Occasionally 11% 23% 17%
(Source: Primary traffic survey 2013)
Daily travelers mostly prefer 2-wheelers and the share of trips performed daily and
multiple times by car is more than 50%. Occasional travelers travel by cars compared to
other modes.

Ridership Updation on Kochi Metro and Impact on Pollutants Final Report
CDM Smith 59 Kochi Metro Rail Ltd.
4.3.4.4 Purpose of Journey
Table 4.20 and Table 4.21 presents the trip purpose at all the locations across the project
corridor and cordon locations. Analysis of ‘purpose of journey’ revealed that work trips
made by 2-wheelers and 3-wheelers are in the range of 53-57%. Business trips are more
often made by 4-wheelers i.e. cars.
Table 4.20 Purpose of Journey – Project Corridor
Trips 2-Wheeler Car 3-Wheeler
Work 57% 37% 53%
Business 19% 25% 12%
Education 8% 5% 8%
Social & Recreation 5% 8% 6%
Medical 4% 5% 7%
Tourism 1% 8% 5%
Others 6% 12% 9%
(Source: Primary traffic survey 2013)
Table 4.21 Purpose of Journey – Cordon
Trips 2-Wheeler Car 3-Wheeler
Work 46% 40% 41%
Business 26% 28% 21%
Education 7% 8% 5%
Social & Recreation 4% 7% 11%
Medical 7% 3% 8%
Tourism 0% 5% 0%
Others 10% 9% 14%
(Source: Primary traffic survey 2013)
The work trips are predominant on the project corridor and cordon locations, which is the
typical travel characteristic of urban areas. Education trips ranges between 5-10%.
4.3.4.5 Occupancy
Table 4.22 presents the average occupancy of all the modes on the project corridor and at
the cordon points. Analysis on occupancy of the vehicles excluding driver revealed that
the average occupancy of the passenger modes in the city core is high compared to the
outer areas.
Table 4.22 Average Occupancy - Project Corridor
Vehicle Type Average Occupancy
2-Wheeler 1.4
Car 3.0
Taxi 2.7
3-Wheeler 2.4

Ridership Updation on Kochi Metro and Impact on Pollutants Final Report
CDM Smith 60 Kochi Metro Rail Ltd.
(Source: Primary traffic survey 2013)
Table 4.23 Average Occupancy - Cordon
Vehicle Type Average Occupancy
2-Wheeler 1.3
Car 2.9
Taxi 2.3
3-Wheeler 2.1
(Source: Primary traffic survey 2013)
Trip Characteristics: The traffic analysis zones are broadly classified into two major
sectors for analyzing the trip characteristics. They are;
Zones within the study area (Internal zones) – Zones 1 to 125
Outside study area (External zones) – Zones 125-132
Table 4.24 shows the percentage of trips between the sectors for passenger vehicles. It is
seen that external to internal trips is significant on the project corridor demonstrating
considerable floating population in the study area. The external to external trips are
found to be around 5.6% at the outer cordon points and about 0.6% on the project corridor
which is insignificant.
Table 4.24 Travel Desire Pattern
Description I-I E-I I-E E-E
Project Corridor 82.0% 9.7% 7.7% 0.6%
Cordon 0% 49.2% 45.2% 5.6%
(E-E = Trips between External Zone to External Zone and I-E = Trips between Internal
Zone & External Zone, I-I=Trips between Internal to Internal zones).
(Source: Primary traffic survey 2013)
Figure 4.12 to 4.14 presents the travel desire for private modes and IPT for the project
corridor. Figure 4.15 to 4.17 presents the travel desire observed at the cordons.

Ridership Updation on Kochi Metro and Impact on Pollutants Final Report
CDM Smith 61 Kochi Metro Rail Ltd.
Figure 4.12 Desire-2-Wheelers – Project Corridor

Ridership Updation on Kochi Metro and Impact on Pollutants Final Report
CDM Smith 62 Kochi Metro Rail Ltd.
Figure 4.13 Desire-Cars – Project Corridor

Ridership Updation on Kochi Metro and Impact on Pollutants Final Report
CDM Smith 63 Kochi Metro Rail Ltd.
Figure 4.14 Desire-3-Wheelers – Project Corridor

Ridership Updation on Kochi Metro and Impact on Pollutants Final Report
CDM Smith 64 Kochi Metro Rail Ltd.
Figure 4.15 Desire-2-Wheelers – Outer Cordon
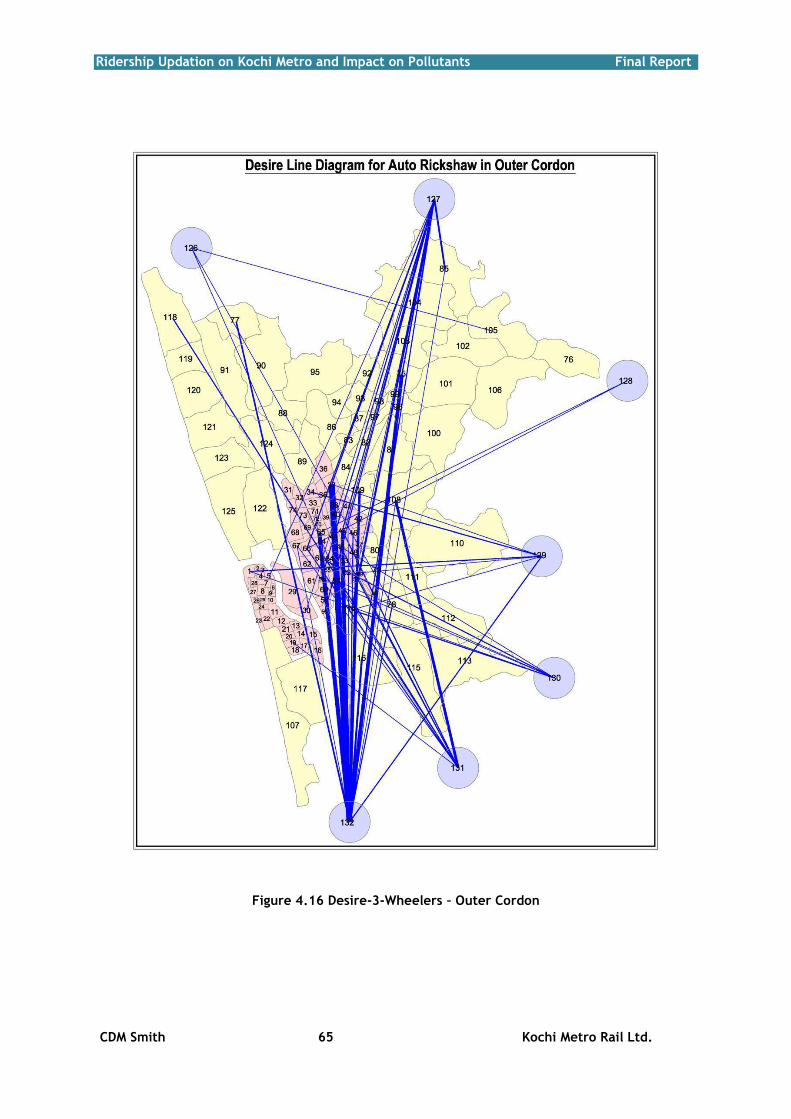
Ridership Updation on Kochi Metro and Impact on Pollutants Final Report
CDM Smith 65 Kochi Metro Rail Ltd.
Figure 4.16 Desire-3-Wheelers – Outer Cordon

Ridership Updation on Kochi Metro and Impact on Pollutants Final Report
CDM Smith 66 Kochi Metro Rail Ltd.
Figure 4.17 Desire-Cars – Outer Cordon
Trip Length Distribution: The average trip length is estimated based on the origin-
destination and zone to zone distance matrix. The average trip length is presented in
Table 4.25.

Ridership Updation on Kochi Metro and Impact on Pollutants Final Report
CDM Smith 67 Kochi Metro Rail Ltd.
Table 4.25 Average Trip Length in Km
Mode Project Corridor Cordon
2-Wheeler 9.9 20.5
Car 10.4 29.9
3-Wheeler 8.1 15.6
Public transport (Bus) 9.8 -
(Source: Primary traffic survey 2013)
Average trip length for the 2-wheeler and cars is in the range of 9.9-10.4 km on the
project corridor. At the cordons it ranges between 20.5-29.9 km. The average trip length
for 3-wheelers is 8.1 km on the project corridor. Figure 4.18 and Figure 4.19 presents the
trip length distribution for the project corridor and cordons.
Figure 4.18 Trip Length Distribution - Project Corridor

Ridership Updation on Kochi Metro and Impact on Pollutants Final Report
CDM Smith 68 Kochi Metro Rail Ltd.
Figure 4.19 Trip Length Distribution – Cordon
4.3.5 Origin Destination Survey at Major Public Transport Terminals
The distribution of passengers from the major bus and rail terminals are gathered. The
data on origin, destination and the mode to final destination is collected. The survey is
carried out at the following terminals/stations:
1. Bus terminal
a. Aluva
b. KSRTC stand at Ernakulam
c. Kaloor
d. Vytilla hub
2. Rail Terminal
a. North railway station
b. South railway station
c. Aluva
The passenger data is collected from the pre-paid auto stands from the following major
terminals.
a. Vytilla hub
b. North railway station
c. South railway station
The data is analyzed to estimate the potential passenger traffic to the proposed metro
system. Figure 4.20 to Figure 4.22 presents the travel desire from the Vytilla hub, North
railway station and South railway station respectively. It can be observed that major share
of traffic is destining in the city centre i.e. in and around MG road/Marine drive. Other
destinations include Thammanam Jn, Eloor (Fact), Kumbalam, Fort Kochi, Palluruty,

Ridership Updation on Kochi Metro and Impact on Pollutants Final Report
CDM Smith 69 Kochi Metro Rail Ltd.
Vaduthala, Edapally, Devankulangara, Palarivattom, Vytilla, Ravipuram, Kaloor and
Ayyppankavu, Kadavanthra, Ernakulam centre, Ernakulam town and Ernakulam junction.
Figure 4.20 Desire-3-Wheelers at Ernakulam Junction

Ridership Updation on Kochi Metro and Impact on Pollutants Final Report
CDM Smith 70 Kochi Metro Rail Ltd.
Figure 4.21 Desire-3-Wheelers at Ernakulam Town
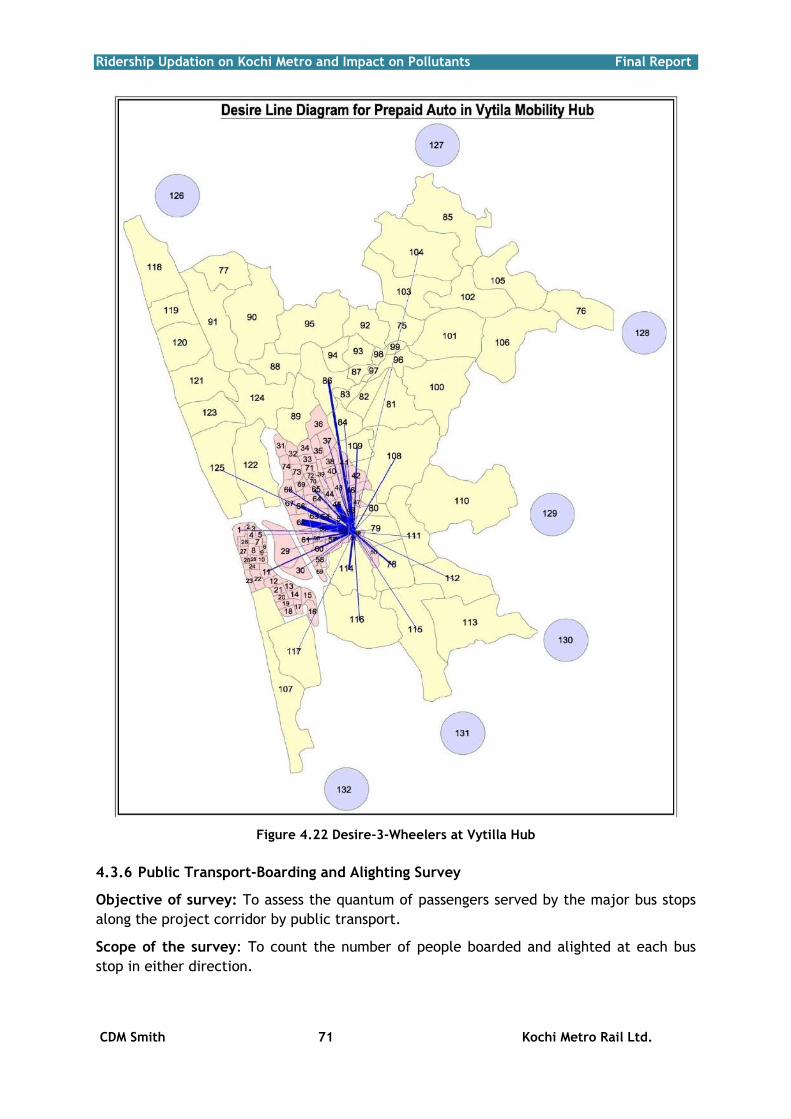
Ridership Updation on Kochi Metro and Impact on Pollutants Final Report
CDM Smith 71 Kochi Metro Rail Ltd.
Figure 4.22 Desire-3-Wheelers at Vytilla Hub
4.3.6 Public Transport-Boarding and Alighting Survey
Objective of survey: To assess the quantum of passengers served by the major bus stops
along the project corridor by public transport.
Scope of the survey: To count the number of people boarded and alighted at each bus
stop in either direction.

Ridership Updation on Kochi Metro and Impact on Pollutants Final Report
CDM Smith 72 Kochi Metro Rail Ltd.
Conduct of the Survey: The survey is conducted at the major bus stop locations along the
corridor during public transport operation period during a normal day using manual
counting method.
Data Entry and Analysis: The hourly distribution of passengers boarded and alighted at
major bus stops along the corridor is presented in Figure 4.23 to Figure 4.26.
Figure 4.23 Bus Passenger Survey at Petta - Towards Vyttilla
Figure 4.24 Bus Passenger Survey at Petta - Towards Thirupunithra

Ridership Updation on Kochi Metro and Impact on Pollutants Final Report
CDM Smith 73 Kochi Metro Rail Ltd.
Figure 4.25 Bus Passenger Survey at Edapally - Towards Ernakulam
Figure 4.26 Bus Passenger Survey at Edapally - Towards Aluva
4.4 Public Transport - Occupancy
Objective of survey: To assess the quantum of passengers served by public transport at
the identified homogenous sections along the corridor and hence establish the average
occupancy and crush capacity
Scope of the survey: To assess the number of people inside the system at various sections
in either direction.
Conduct of the Survey: The survey is conducted at the midblock locations along the
project corridor during public transport operation period during a normal day using manual
counting method.
Data Entry and Analysis: The section wise daily and peak capacity of public transport at
various sections on the project corridor.

Ridership Updation on Kochi Metro and Impact on Pollutants Final Report
CDM Smith 74 Kochi Metro Rail Ltd.
Figure 4.27 Average Occupancy - Bus
4.5 Opinion Survey
Stated Preference Survey
Objective of survey: To estimate the user’s willingness to use and pay for the proposed
Metro rail system.
Scope of the survey: The respondents are presented with hypothetical mode choice
situations with recommended metro fare and savings in travel time. The assumed fare for
the metro rail is given in Table 4.26. The savings in travel time is estimated based on the
difference between travel time taken between the proposed mode and by other modes.
The travel time by other modes is estimated from the speed and delay surveys. The travel
time by the proposed mode is estimated by assuming a speed as 33Kmph. In the process of
estimating the future ridership for a system, the probability of shift from different modes
can be estimated from user’s opinion on.
Table 4.26 Recommended Fare for Metro
Sl. No Distance in Km Basic Fare in Rs.
1 0-2 10
2 2-4 13
3 4-6 15
4 6-9 19
5 9-12 21
6 12-15 23
7 15-18 24
8 18-21 27
9 21-24 28
10 24-27 30
(Source: Kochi DPR Study by DMRC)

Ridership Updation on Kochi Metro and Impact on Pollutants Final Report
CDM Smith 75 Kochi Metro Rail Ltd.
Conduct of the Survey: Two thousand users are interviewed at the following
terminals/stations:
1. Bus terminal
a. Aluva
b. KSRTC stand at Ernakulam
c. Kaloor
d. Vytilla hub
2. Rail Terminal
a. North railway station
b. South railway station
c. Aluva
The opinion is also gathered along with the road side interview at all the origin-destination
survey locations. The collected data is coded, processed and analyzed.
The respondent’s trip purpose and trip frequency at the surveyed bus and rail terminals
are presented in Table 4.27 to Table 4.30 respectively.
Table 4.27 Purpose of Trip – Bus Terminals/Stands
Trip Vyttila KSRTC Kaloor Aluva KSRTC
Work 31% 37% 52% 50%
Business 11% 19% 18% 21%
Education 19% 12% 12% 6%
Social & Recreation 14% 6% 2% 12%
Medical 12% 7% 5% 2%
Tourism 7% 5% 2% 4%
Others 7% 14% 10% 5%
(Source: Primary traffic survey 2013)
Table 4.28 Purpose of Trip – Railway Stations
Trips Ernakulam
Junction
Ernakulam
Town Aluva
Work 57% 61% 52%
Business 18% 15% 10%
Education 10% 6% 15%
Social & Recreation 2% 3% 18%
Medical 2% 2% 2%
Tourism 2% 5% 0%
Others 9% 8% 4%
(Source: Primary traffic survey 2013)

Ridership Updation on Kochi Metro and Impact on Pollutants Final Report
CDM Smith 76 Kochi Metro Rail Ltd.
Table 4.29 Trip Frequency – Bus Terminals/Stands
Trip Vyttila KSRTC Kaloor Aluva KSRTC
Multiple 10% 0% 3% 6%
Daily 36% 28% 68% 68%
Weekly 35% 35% 16% 13%
Occasionally 19% 37% 13% 13%
(Source: Primary traffic survey 2013)
Table 4.30 Trip Frequency – Railway Station
Trips Ernakulam
Junction
Ernakulam
Town Aluva
Multiple 10% 11% 0%
Daily 11% 56% 29%
Weekly 17% 18% 26%
Occasionally 62% 16% 45%
(Source: Primary traffic survey 2013)
Willingness to Shift to Metro
The user’s opinion on the willingness to shift to the proposed metro system is presented in
Table 4.31 to Table 4.32 for the bus and rail passengers respectively. Figure 4.28 to Figure
4.29 presents the willingness to shift for the private modes (cars/2-wheelers) and 3-
wheelers respectively.
Table 4.31 Willingness to Shift – Bus Passenger
Trip Vyttila KSRTC Kaloor Aluva
KSRTC
Very Unlikely 1% 1% 0% 1%
Unlikely 1% 2% 1% 0%
Neutral 6% 4% 5% 20%
Likely 22% 23% 16% 20%
Very Likely 70% 71% 79% 58%
(Source: Primary traffic survey 2013)
Table 4.32 Willing to Shift Metro System – Rail Passenger
Trips Ernakulam
Junction
Ernakulam
Town Aluva
Very Unlikely 0% 0% 3%
Unlikely 0% 1% 2%
Neutral 6% 0% 10%
Likely 5% 1% 44%
Very Likely 89% 98% 40%
(Source: Primary traffic survey 2013)
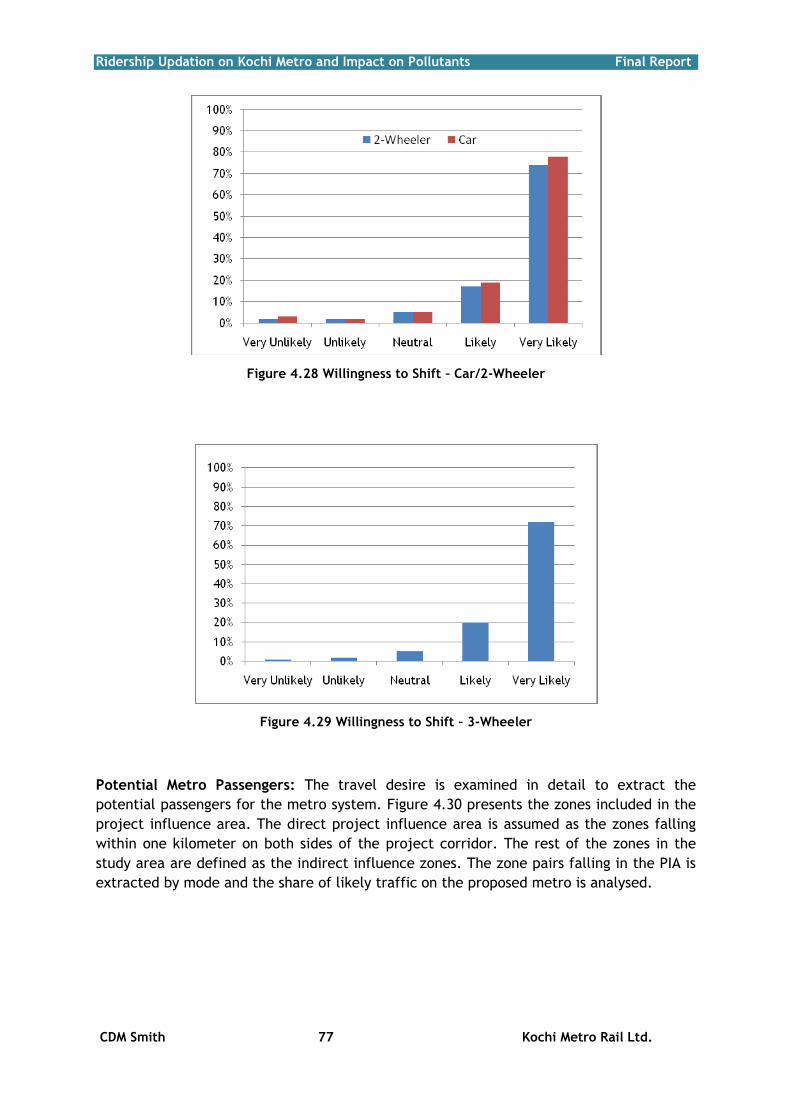
Ridership Updation on Kochi Metro and Impact on Pollutants Final Report
CDM Smith 77 Kochi Metro Rail Ltd.
Figure 4.28 Willingness to Shift – Car/2-Wheeler
Figure 4.29 Willingness to Shift – 3-Wheeler
Potential Metro Passengers: The travel desire is examined in detail to extract the
potential passengers for the metro system. Figure 4.30 presents the zones included in the
project influence area. The direct project influence area is assumed as the zones falling
within one kilometer on both sides of the project corridor. The rest of the zones in the
study area are defined as the indirect influence zones. The zone pairs falling in the PIA is
extracted by mode and the share of likely traffic on the proposed metro is analysed.
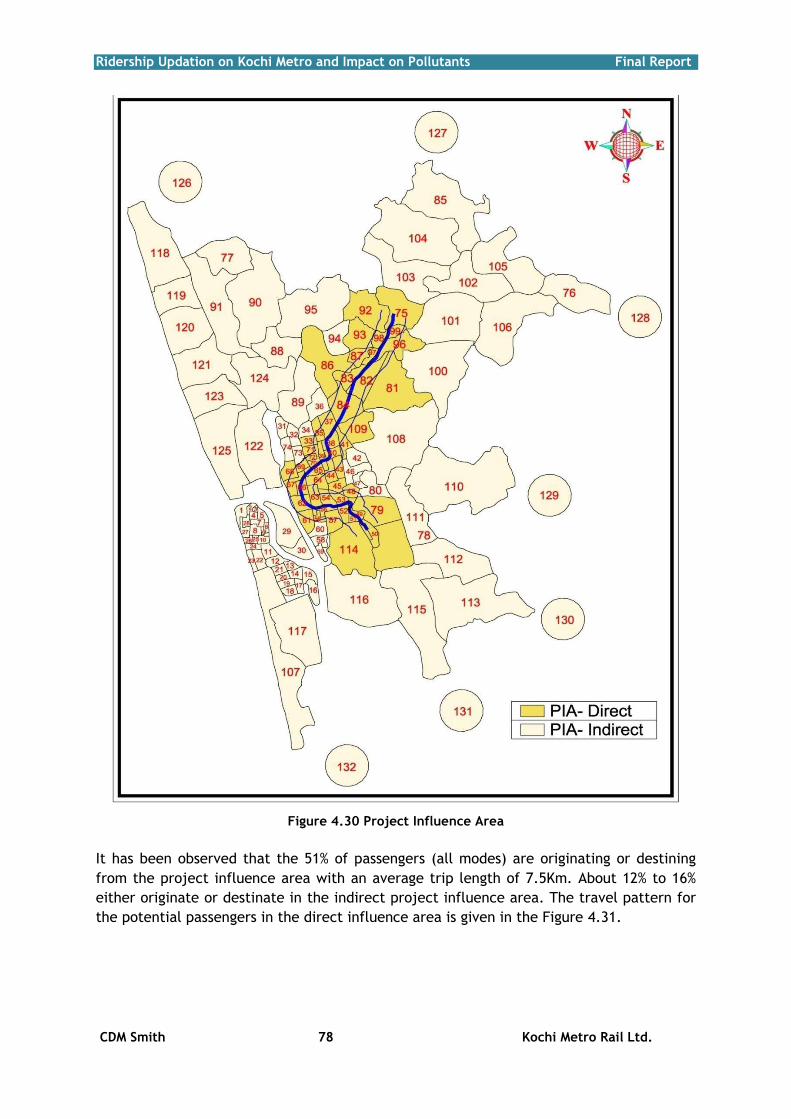
Ridership Updation on Kochi Metro and Impact on Pollutants Final Report
CDM Smith 78 Kochi Metro Rail Ltd.
Figure 4.30 Project Influence Area
It has been observed that the 51% of passengers (all modes) are originating or destining
from the project influence area with an average trip length of 7.5Km. About 12% to 16%
either originate or destinate in the indirect project influence area. The travel pattern for
the potential passengers in the direct influence area is given in the Figure 4.31.

Ridership Updation on Kochi Metro and Impact on Pollutants Final Report
CDM Smith 79 Kochi Metro Rail Ltd.
Figure 4.31 Travel Pattern for Potential Passengers
Conclusion
Traffic studies are carried out to assess the present traffic and travel characteristics in the
study area and on the project corridor. The data collection included secondary and
primary traffic surveys like classified volume count, roadside interview, public transport
surveys, road network inventory and speed and delay studies. The analyzed data will be
used to update the transport model to establish the ridership for the next thirty five
years.

Ridership Updation on Kochi Metro and Impact on Pollutants Final Report
CDM Smith 80 Kochi Metro Rail Ltd.
5. CHAPTER
METRO RAIL CORRIDOR CHARACTERISTICS
A detailed corridor inventory is carried out along the proposed metro rail alignment
between Aluva and Petta for a length of 25.6 km. The data is gathered on the geometric
characteristics, land use along the corridor and around 500 meters around the proposed
metro stations, major intersecting roads, traffic generators, bus stops, parking stands for
intermediate public transport including 3-wheeler and taxis, potential multimodal
integration locations. The corridor characteristics is discussed in the following sections.
5.1 Corridor Characteristics
Corridor: Aluva – Petta
The corridor with a length of 25.6km will be
served by 22 stations (Figure 6.1). The corridor
starts at Aluva in the North and continue on NH-
47 till Edapally. The metro passes through major
establishments like KPKM Hospital, Aluva market,
CPK hospital, Government housing colony, KSRTC
Garage road, Panchayat office, Metco House,
Honda Showroom, SCMS college, CUSAT
university, Mega Mart, ICTA (Institute for
counselling and Transactional Analysis), KIMS
hospital, Hyundai Showroom, AZAT homes
apartments. The shopping mall opened by Lulu
group is located very close to Edapally station.
The mall attracts substantial visitors and tourists to the city, mostly by private driven
vehicles and taxis resulting in heavy traffic chaos on the
corridor. Further, the alignment crosses the NH47/NH17 at
Edapally Junction, and proceeds on Palarivattom-Edapally
Road. The alignment passes through major destinations like
Changampuzha park, JL Nehru. Stadium, Kaloor, and
reaches North Station.
North station will act as a major transfer point to the
passengers from the neighbouring cities and villages who
commute regularly for their work or education trip. The alignment proceeds towards Peta
via Maharaja’s College in MG road, South Station, Kadavanthra, Vyttila and Tykoodam.
Vytilla station will be developed as the multimodal hub for the intercity, ferry and the
metro along with provision for park and ride facility. Figure 6.1 represents the proposed
metro alignment with the stations marked.
The major network connectivity and attractions along the metro alignment is represented
in Table 6.1.
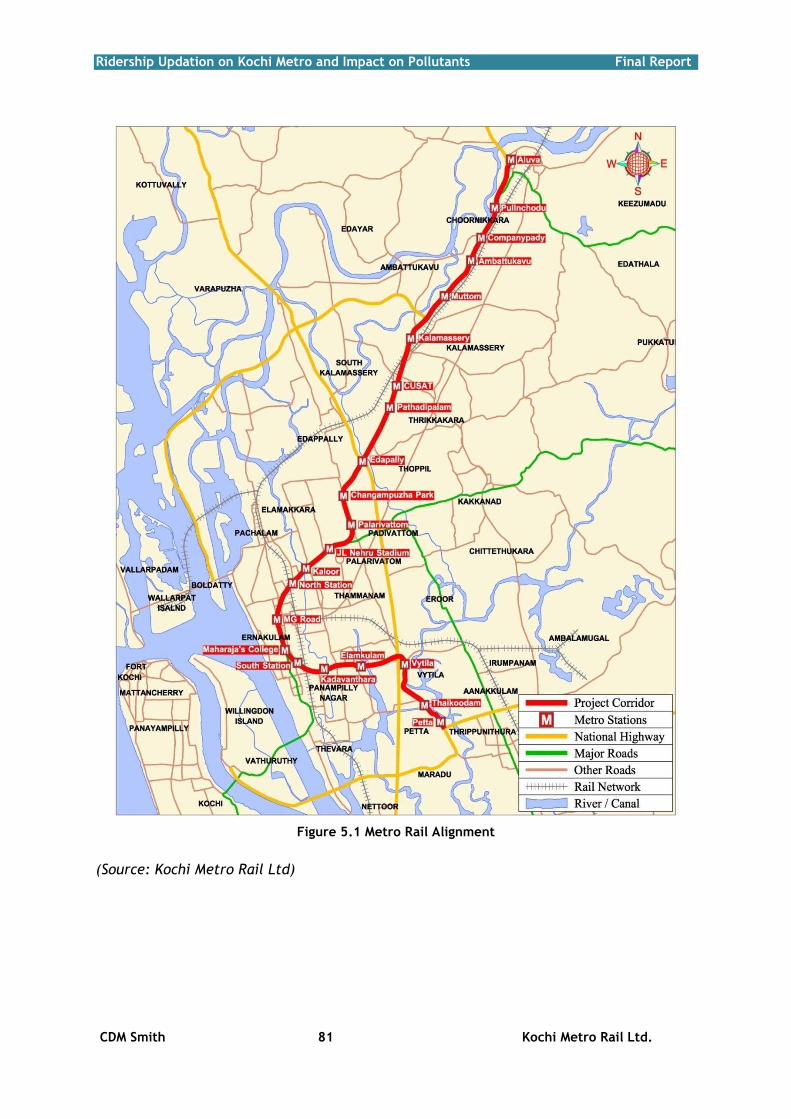
Ridership Updation on Kochi Metro and Impact on Pollutants Final Report
CDM Smith 81 Kochi Metro Rail Ltd.
Figure 5.1 Metro Rail Alignment
(Source: Kochi Metro Rail Ltd)
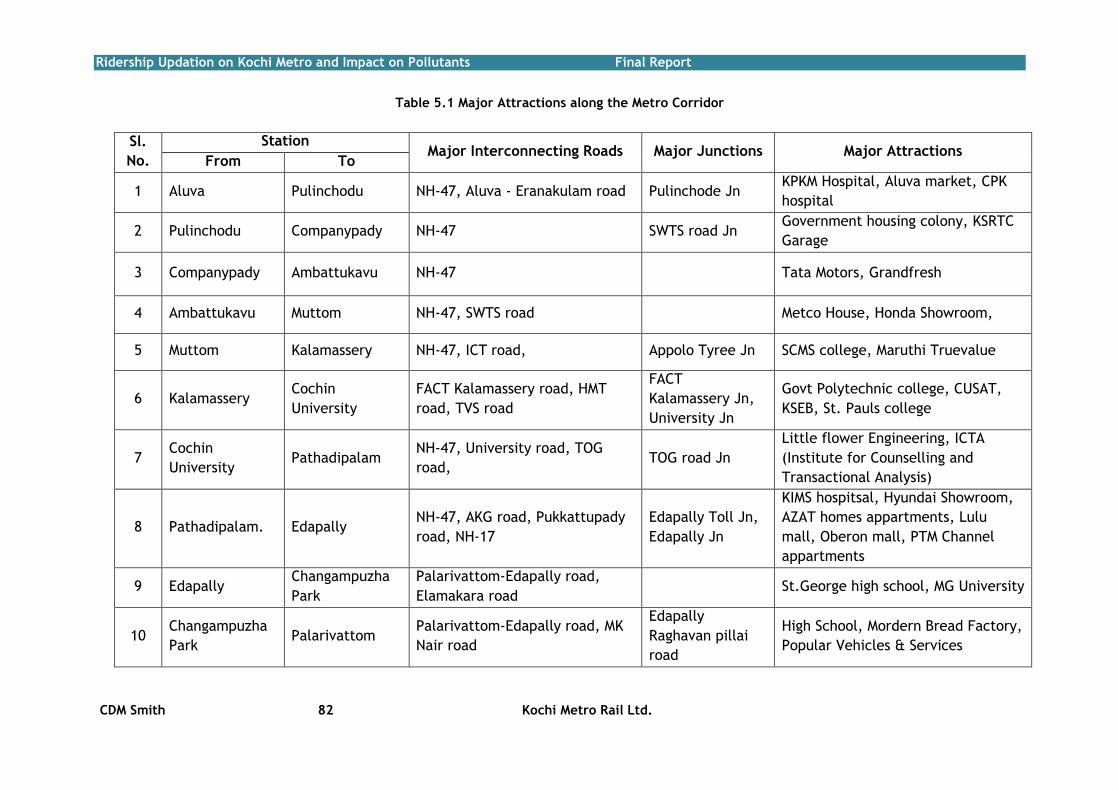
Ridership Updation on Kochi Metro and Impact on Pollutants Final Report
CDM Smith 82 Kochi Metro Rail Ltd.
Table 5.1 Major Attractions along the Metro Corridor
Sl.
No.
Station Major Interconnecting Roads Major Junctions Major Attractions
From To
1 Aluva Pulinchodu NH-47, Aluva - Eranakulam road Pulinchode Jn KPKM Hospital, Aluva market, CPK
hospital
2 Pulinchodu Companypady NH-47 SWTS road Jn Government housing colony, KSRTC
Garage
3 Companypady Ambattukavu NH-47
Tata Motors, Grandfresh
4 Ambattukavu Muttom NH-47, SWTS road
Metco House, Honda Showroom,
5 Muttom Kalamassery NH-47, ICT road, Appolo Tyree Jn SCMS college, Maruthi Truevalue
6 Kalamassery Cochin
University
FACT Kalamassery road, HMT
road, TVS road
FACT
Kalamassery Jn,
University Jn
Govt Polytechnic college, CUSAT,
KSEB, St. Pauls college
7 Cochin
University Pathadipalam
NH-47, University road, TOG
road, TOG road Jn
Little flower Engineering, ICTA
(Institute for Counselling and
Transactional Analysis)
8 Pathadipalam. Edapally NH-47, AKG road, Pukkattupady
road, NH-17
Edapally Toll Jn,
Edapally Jn
KIMS hospitsal, Hyundai Showroom,
AZAT homes appartments, Lulu
mall, Oberon mall, PTM Channel
appartments
9 Edapally Changampuzha
Park
Palarivattom-Edapally road,
Elamakara road St.George high school, MG University
10 Changampuzha
Park Palarivattom
Palarivattom-Edapally road, MK
Nair road
Edapally
Raghavan pillai
road
High School, Mordern Bread Factory,
Popular Vehicles & Services

Ridership Updation on Kochi Metro and Impact on Pollutants Final Report
CDM Smith 83 Kochi Metro Rail Ltd.
11 Palarivattom J.L.Nehru
Stadium Banarji road, Stadium road, Stadium road Jn.
Palarivattom acts as a Major Transit
Point e.g (Kakannad, Aluva, Vyttila,
Fortkochi), J.L Nehru Stadium
12 J.L.Nehru
Stadium Kaloor
Banarji road, Desabhimani road,
Azad road, Kaloor Kadavanthara
road
Deshabhimani Jn.
Mathrubhumi Jn.
Kaloor Jn.
St. Albert’s College Tennis court,
Mathurbhumi, Vijaya Institute of
Medical Sciences
13 Kaloor Lissie SRM road, Lissie Hospital road Lissie Jn.
Kaloor Market, PVS memorial
Hospital, Penta Towers, Muthoot
Towers
14 Lissie M.G road Chitoor road
Ernakulam North
Jn, Kacheripady
Jn.
RBI, Lissie Hospital, North Railway
station, PNVM Hospital, Seematti
15 M.G road Maharaja's
College Jew street, Convent road
PNVM hospital Jn,
Jose Jn
Chennai silks, Kavitha theatre, ABAD
plaza, Centre square mall, Shenoys
theatre
16 Maharaja's
College
Ernakulam
junction Hospital road, Durbar Hall road, Pallimukku Jn
Maharaja's College, LIC Divisional
Office, Pallimukku
17 Ernakulam
junction Kadavanthra
Church Landing road, SA road,
Chittor road, Panampilly Nagar
road, Kaloor Kadavanthara road
Valanjambalam
Jn, Manorama Jn,
Kadavanthara
Medical trust hospital, GCDA office,
Regional town planning office
18 Kadavanthra Elamkulam Chillavannur road Elamkulam Jn Kochi Shipyard Quarters
19 Elamkulam Vytila Vyttila Janatha road, NH-47 Janatha Jn GEO Motors Mobility hub,
20 Vytila Thaikoodam Ettumanoor - Eranakulam road Vyttila Jn,
Thykoodam
EYE hospital, Power House , KSEB
Substation
21 Thaikoodam Petta Ettumanoor - Eranakulam road,
Kochi Dhanushkodi road Petta Jn
Chambakara Fish Market,
Thrippunthura
*Jn-Junction (Source: Primary Traffic Survey 2013)

Ridership Updation on Kochi Metro and Impact on Pollutants Final Report
CDM Smith 84 Kochi Metro Rail Ltd.
5.2 Station Locations and the Inter Station Distance
The inter station distance between Aluva and Petta is given in Table 6.2. The station
spacing along the alignment varies from 0.49km to 3.42km with an avergae sapcing of
1.30km.
Table 5.2 Inter Station Distance – Metro Corridor
Sl. No. Station Name Inter station
distance (Km)
1 Aluva -
2 Pulinchodu 1.904
3 Companypady 0.942
4 Ambattukavu 1.008
5 Muttom 0.959
6 Kalamassery 3.421
7 Cochin University 2.400
8 Pathadipalam 1.000
9 Edapally 1.453
10 Changampuzha Park 1.424
11 Palarivattom 1.048
12 J.L.Nehru Stadium 1.055
13 Kaloor 1.095
14 Lissie 0.490
15 M.G Road 1.188
16 Maharaja's College 1.204
17 Ernakulam junction 1.229
18 Kadavanthra 0.853
19 Elamkulam 1.156
20 Vytila 1.106
21 Thaikoodam 1.256
22 Petta 1.119
(Source: Kochi Metro Rail Ltd)
5.3 Land Use
The detailed inventory is carried out on the existing land use along the corridor and about
500m approximately around the metro stations. The land use is described in terms of

Ridership Updation on Kochi Metro and Impact on Pollutants Final Report
CDM Smith 85 Kochi Metro Rail Ltd.
residential, commercial, industrial, institutional and others. Table 5.3 presents the land
use around the metro stations.
Table 5.3 Predominant Land Use at Metro Stations
Sl. No Station name
Land Use (%) around the metro stations (with in 500m radius)
Commercial Residential Industrial Institutional &
Others
1 Aluva 55 45 - -
2 Pulinchodu 20 80 - -
3 Companypady 30 45 5 20
4 Ambattukavu 5 90 5 -
5 Muttom 20 80 - -
6 Kalamassery 20 40 20 20
7 Cochin University 10 50 - 40
8 Pathadipalam 30 35 10 25
9 Edapally 70 25 - 5
10 Changampuzha Park 10 50 - 40
11 Palarivattom 30 50 - 20
12 J.L.Nehru Stadium 10 50 - 40
13 Kaloor 50 20 - 30
14 Lissie 40 20 - 40
15 M.G road 90 - - 10
16 Maharaja's College 80 - - 20
17 Ernakulam junction 70 - - 30
18 Kadavanthra 20 40 - 40
19 Elamkulam 30 60 - 10
20 Vytila 10 60 - 30
21 Thaikoodam - 90 - 10
22 Petta 5 90 - 5
(Source: Primary Traffic Survey 2013)
Figure 5.2 presents the land use along the proposed metro corridor.

Ridership Updation on Kochi Metro and Impact on Pollutants Final Report
CDM Smith 86 Kochi Metro Rail Ltd.
Figure 5.2 Land Use along the Project Corridor
5.4 Multimodal Integration
Seamless connectivity to mass transit corridor will be given by providing intermodal
interchange stations at major stations along the corridor. Figure 5.3 presents the proposed
multimodal stations along the corridor. The metro rail will be integrated with the existing
conventional rail, and bus system at various stations along the metro rail corridor. Park
and ride facility is proposed at major stations. Details regarding the integration with other
modes is presented in Table 5.4.

Ridership Updation on Kochi Metro and Impact on Pollutants Final Report
CDM Smith 87 Kochi Metro Rail Ltd.
Figure 5.3 Multimodal Integration along Project Corridor
(Source: Kochi Metro Rail Ltd)
Table 5.4 Multimodal Integration along Project Corridor
Sl. No. Station Name Bus Railway
Station
Park &
Ride
Water
Transport
1 Aluva √
√

Ridership Updation on Kochi Metro and Impact on Pollutants Final Report
CDM Smith 88 Kochi Metro Rail Ltd.
Sl. No. Station Name Bus Railway
Station
Park &
Ride
Water
Transport
2 Pulinchodu
3 Companypady
4 Ambattukavu
5 Muttom
6 Kalamassery √
7 Cochin University
8 Pathadipalam
9 Edapally √ √
10 Changampuzha Park
11 Palarivattom
12 J.L.Nehru Stadium
13 Kaloor √ √
14 Lissie √
15 MG road
16 Maharaja's College
17 Ernakulam junction √
18 Kadavanthra
19 Elamkulam
20 Vytila √ √
21 Thaikoodam
22 Petta √
(Source: Kochi Metro Rail Ltd)
5.5 Operational Characteristics of Metro Rail System
The operational characteristics (as recommended by DPR Kochi Metro) assumed for the
estimation of ridership is presented in Table 5.5.
Table 5.5 Operational Characteristics of Metro Rail
Year Heady Way in Minutes Speed in Kmph
2015 5 33
2020 4 33
2025 3 33
2048* 1.5 33
*CDM Smith Estimate (Source: Kochi Metro DPR Report)

Ridership Updation on Kochi Metro and Impact on Pollutants Final Report
CDM Smith 89 Kochi Metro Rail Ltd.
6. CHAPTER
RIDERSHIP ESTIMATION
6.1 Travel Demand Forecast
The calibrated urban transport model developed for the Kochi Metro Ridership study-2005
is updated to the base year i.e. 2013 using fresh traffic surveys carried out during the
months of May and June, 2013. The updated urban transport demand model has been used
to predict the travel characteristics for the horizon years. The methodology for travel
demand forecast is shown in Figure 6.1.
Horizon Year
Highway Network
Horizon Year
Planning Variables
Horizon Year
Transit Network
Trip end model
Highway Skims
Synthetic peak
hour trips endsPT Skims
Generalized Cost
CAR, TW, AUTOCombined trip
distribution and
mode choice model
Generalized Cost
Transit
External Passenger TripsSynthetic Mode wise
OD Matrices
PCU (Mode-wise)
OD Mtrices
Highway
Assignment
Transit
Assignment
PT Passenger
OD Matrix
Skims Convergence
CriteriaSkims
Traffic Flow Transit Flow
No
Yes
No
Preload Commercial
Vehicle
Figure 6.1 Travel Demand Forecast
The horizon years include 2018, 2033 and 2048. The transport proposals already in the
implementation stage or been committed has been included in the forecast years. The
highway (road) network considered all the key arterials, sub arterials and collectors. The
base year highway network is presented in Figure 6.2 and the committed bus transit
network is shown in Figure 6.3. Detail of bus routes are presented in Annexure 3. The

Ridership Updation on Kochi Metro and Impact on Pollutants Final Report
CDM Smith 90 Kochi Metro Rail Ltd.
study area is divided into 125 zones in the GCDA including six municipalities and many
villages and 7 external zones. (Refer Figure 4.11 for zone map)
Figure 6.2 Highway Network-2013

Ridership Updation on Kochi Metro and Impact on Pollutants Final Report
CDM Smith 91 Kochi Metro Rail Ltd.
Figure 6.3 Public Transport Network-2013
6.2 Population and Employment Projections
Population Projections
The development of a particular city, town or a region depends upon natural, physical and
socio-economic factors. Among these factors, the population assumes significance in
determining the future pattern of progress and development.
The project area encompasses an area under Greater Kochi Development Authority
(GCDA), which is spread upto 632 sq. km. There are around 52 towns and villages including
Kochi Municipal Corporation within GCDA’s jurisdiction. As the growth factors vary from
town to town, it is essential to understand the present and future town/village specific
physical and socio-economic activities while projecting the town population, which would

Ridership Updation on Kochi Metro and Impact on Pollutants Final Report
CDM Smith 92 Kochi Metro Rail Ltd.
ultimately influence the growth of the town. Hence, while, estimating the population
projections, town wise/village wise population projections are carried out by employing
both mathematical and graphical methods. The projection methods include Arithmetic
Method, Incremental Increase Method, Geometric Method, and Polynomial Method. In
addition, the projections were also compared with the projections carried out by other
agencies for other different studies like City Development Plan (CDP) under JNNURM, City
Sanitation Plan (CSP), and Development Plan for Kochi City Region – 2031, etc.
Assumptions
1. City Development Plan (CDP) for Kochi prepared under JNNURM encompasses
about 330.02 sq. km of area covering Kochi Municipal Corporation, 2 municipal
areas and 13 panchayats with a population of about 11.38 lakhs. As most of the
CDP area falls under GCDA, hence, the assumptions considered for projecting
populations for municipalities and panchayats in CDP forms one of the important
basis to adopt the same/similar applicable assumptions to project other the
town/villages under GCDA. Table 6.1 presents the assumptions in CDP related to
migration.
Table 6.1 Estimated Migration Components as % to Total Population
Year 2011 2021 2026
KMC 11.46% 18.98% 24.74%
2 Municipal Areas 26.04% 38.61% 46.27%
13 Panchayats 14.16% 20.83% 28.28%
CDP Area 13.77% 22.61% 29.60%
(Source: City Development Plan for Kochi)
2. The assumptions considered for Development Plan for Kochi City Region (2031)
(refer Table 6.2) for population projections is also considered while projecting
the population for GCDA.
Table 6.2 Assumptions Considered in Development Plan for Kochi City Region (2031)
SI. No Name of Local Body Assumed % of Migration Assumed % of Floating
Population
1 Corporation of Kochi 10% 20%
2 Thripunithura (M) 10% 20%
3 Kalamasserry (M) 30% 20%
4 Maradu (P) 30% 10%
5 Thiruvankulam (P) 10% 20%
6 Thrikkakara (P) 30% 20%
7 Cheraneloor (P) Nil 20%
8 Eloor (P) Nil 30%
9 Varapuzha (P) 30% Nil
10 Kadamakudy (P) Nil 20%
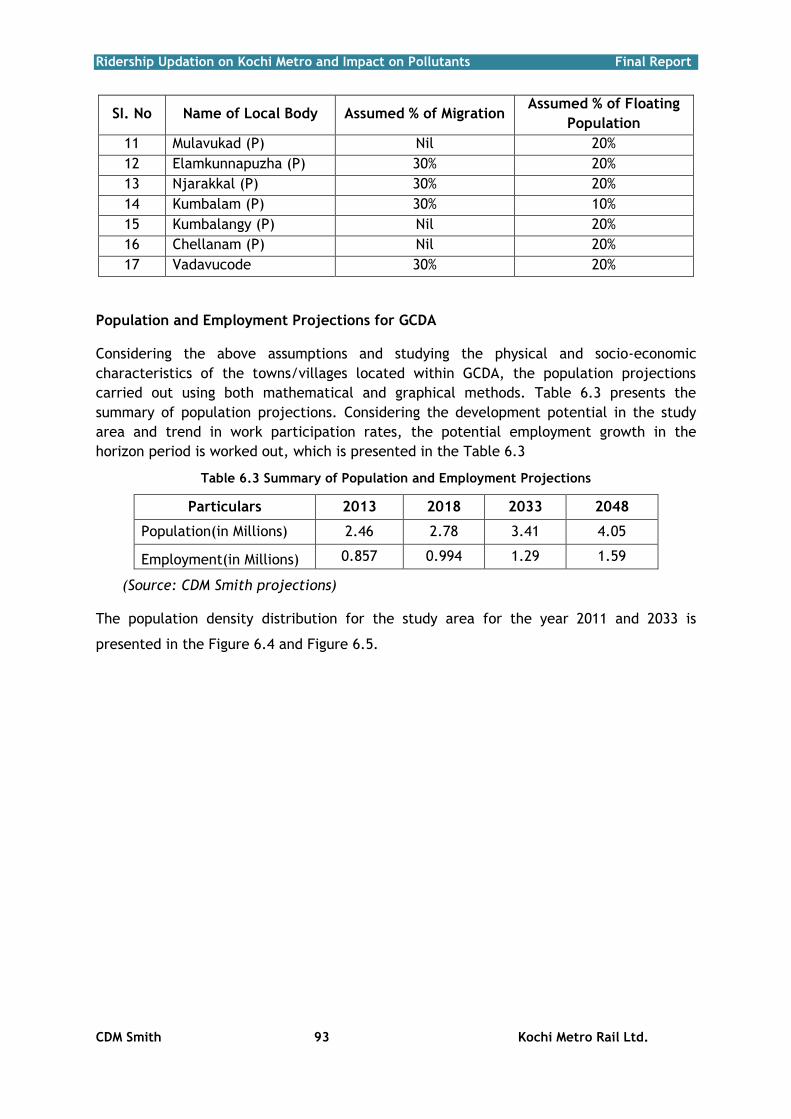
Ridership Updation on Kochi Metro and Impact on Pollutants Final Report
CDM Smith 93 Kochi Metro Rail Ltd.
SI. No Name of Local Body Assumed % of Migration Assumed % of Floating
Population
11 Mulavukad (P) Nil 20%
12 Elamkunnapuzha (P) 30% 20%
13 Njarakkal (P) 30% 20%
14 Kumbalam (P) 30% 10%
15 Kumbalangy (P) Nil 20%
16 Chellanam (P) Nil 20%
17 Vadavucode 30% 20%
Population and Employment Projections for GCDA
Considering the above assumptions and studying the physical and socio-economic
characteristics of the towns/villages located within GCDA, the population projections
carried out using both mathematical and graphical methods. Table 6.3 presents the
summary of population projections. Considering the development potential in the study
area and trend in work participation rates, the potential employment growth in the
horizon period is worked out, which is presented in the Table 6.3
Table 6.3 Summary of Population and Employment Projections
Particulars 2013 2018 2033 2048
Population(in Millions) 2.46 2.78 3.41 4.05
Employment(in Millions) 0.857 0.994 1.29 1.59
(Source: CDM Smith projections)
The population density distribution for the study area for the year 2011 and 2033 is
presented in the Figure 6.4 and Figure 6.5.

Ridership Updation on Kochi Metro and Impact on Pollutants Final Report
CDM Smith 94 Kochi Metro Rail Ltd.
Figure 6.4 Population and Density Distribution of Study Area - 2011 (Persons/Sq.Km)

Ridership Updation on Kochi Metro and Impact on Pollutants Final Report
CDM Smith 95 Kochi Metro Rail Ltd.
Figure 6.5 Population and Density Distribution of Study Area - 2033 (Persons/Sq.Km)
Trips assigned and Per Capita Trip Rate (PCTR)
The PCTR adopted and daily trips for different horizon years are presented in Table 6.4.

Ridership Updation on Kochi Metro and Impact on Pollutants Final Report
CDM Smith 96 Kochi Metro Rail Ltd.
Table 6.4 Daily Trips Assigned and PCTR for Different Horizon Years
Year PCTR Daily trips (Millions)
2013 0.80 1.97
2018 0.88 2.46
2033 1.03 3.50
2048 1.11 4.48
(Source: CDM Smith Estimate)
By adopting the forecast assumptions, the travel demand has been forecasted for the
given horizon years. The Metrorail alignment is coded in the forecast model with access
and egress links updated with the cost parameters. Headway is adopted for the Metrorail
as recommended by KMRL. Metro fare is adopted as per the Kochi DPR Study by DMRC
(Refer Table 4.26). The model outputs have been extracted to estimate the ridership on
the proposed Metrorail and the travel characteristics such as trip length and passenger-
kilometers.
6.3 Peak Hour Ridership
The morning peak hour boarding and alighting is presented in Table 6.5.
Table 6.5 Hourly Boarding and Alighting (Morning Peak)
Sl. No.
Station Name
2018 2033 2048
Peak Hour
Boarding
Peak Hour
Alighting
Peak Hour
Boarding
Peak Hour
Alighting
Peak Hour
Boarding
Peak Hour
Alighting
1 Aluva 2902 1504 4824 3172 6024 4640
2 Pulinchodu 2184 954 2520 1537 3199 1951
3 Companypady 1576 820 1959 1367 2238 2042
4 Ambattukavu 1204 858 1932 1168 2623 1472
5 Muttom 1144 934 1925 1339 2354 1824
6 Kalamassery 1922 890 2656 1333 3679 1715
7 Cochin University 2417 630 2743 1081 3188 1557
8 Pathadipalam 1533 610 2461 935 3199 1320
9 Edapally 1857 1699 3852 3016 5124 3751
10 Changampuzha Park 1431 1630 2095 2331 2399 2898
11 Palarivatom 1267 2871 2373 4095 3349 4904
12 J.L.N Stadium 1208 2457 1947 3610 2403 4449
13 Kaloor 1137 2527 1959 4209 2864 4993
14 Lissie 1729 2787 2373 3466 3214 4797
15 M.G Road 1059 2828 1437 4728 1817 5478
16 Maharaja's College 1377 1787 1796 2452 2479 2974
17 Ernakulam south 1955 2309 3036 3550 3303 4149
18 Kadavanthra 1650 1623 2633 2640 3018 3452
19 Elamkulam 1185 1380 2007 1988 2627 2853
20 Vytila 3025 3346 5327 5491 7107 7020
21 Thaikoodam 723 409 1196 660 1702 914
22 Petta 1032 664 2288 1172 3435 2193
Total 35517 35517 55339 55339 71345 71345

Ridership Updation on Kochi Metro and Impact on Pollutants Final Report
CDM Smith 97 Kochi Metro Rail Ltd.
(Source: CDM Smith Estimate)
Daily Ridership
Daily ridership figures are estimated by applying the peak hour factors (peak hour
trips/daily trips) derived from the primary traffic surveys. The estimated daily ridership on
the proposed Metrorail corridor is presented in Table 6.6.
Table 6.6 Summary of Daily Ridership
(Source: CDM Smith Estimate)
Table 6.7 Daily Station Loading for Corridor
(Source: CDM Smith Estimate)
Year Daily Ridership (in
Millions)
2016 0.36
2033 0.55
2048 0.71
Sl. No.
Station Name
2018 2033 2048
Daily Boarding
Daily Alighting
Daily Boarding
Daily Alighting
Daily Boarding
Daily Alighting
1 Aluva 8535 8432 17463 17143 28320 27970
2 Pulinchodu 5703 5618 9361 9213 13188 12967
3 Companypady 31810 31852 54064 54036 70645 70515
4 Ambattukavu 12798 12853 19979 19975 27364 27424
5 Muttom 16366 16362 26368 26369 32285 32413
6 Kalamassery 21276 21373 32858 33007 37142 37380
7 Cochin University 15707 15872 21071 21334 27084 27336
8 Pathadipalam 19186 19684 30362 31287 35965 36995
9 Edapally 22434 22730 29045 29354 39832 40273
10 Changampuzha Park 18121 18518 30522 31159 38987 39585
11 Palarivatom 18149 18500 27544 28018 33968 34546
12 J.L.N Stadium 20464 20913 32092 32578 41044 41483
13 Kaloor 15277 15332 22094 22157 26412 26558
14 Lissie 17804 17762 34460 34221 44568 44184
15 M.G Road 10847 10586 17193 16763 22863 22328
16 Maharaja's College 15488 14981 19361 18887 23956 23497
17 Ernakulam south 14205 13914 20129 19757 27249 26691
18 Kadavanthra 10415 10360 16405 16239 20963 20810
19 Elamkulam 10363 10261 15606 15391 20632 20309
20 Vytila 12087 11877 16711 16543 21420 21371
21 Thaikoodam 15861 15511 20424 20147 25928 25571
22 Petta 22226 21831 40214 39748 53509 53118
Total 355122 355122 553326 553326 713324 713324
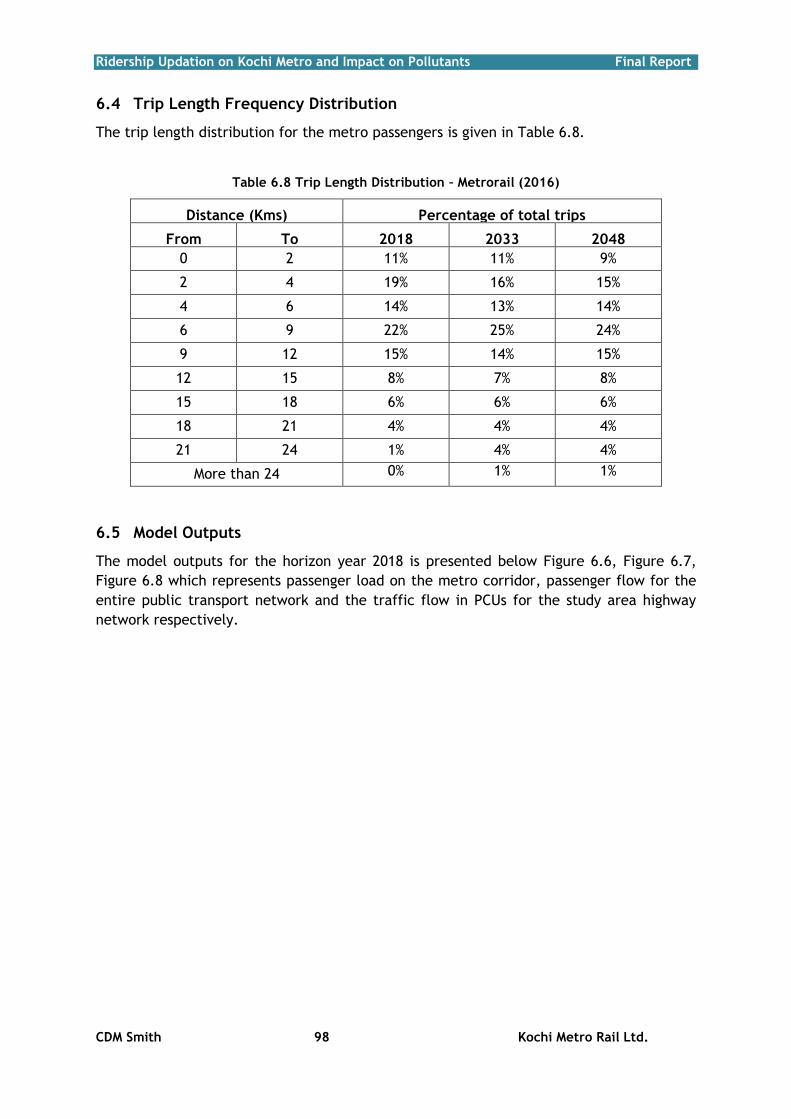
Ridership Updation on Kochi Metro and Impact on Pollutants Final Report
CDM Smith 98 Kochi Metro Rail Ltd.
6.4 Trip Length Frequency Distribution
The trip length distribution for the metro passengers is given in Table 6.8.
Table 6.8 Trip Length Distribution – Metrorail (2016)
Distance (Kms) Percentage of total trips
From To 2018 2033 2048
0 2 11% 11% 9%
2 4 19% 16% 15%
4 6 14% 13% 14%
6 9 22% 25% 24%
9 12 15% 14% 15%
12 15 8% 7% 8%
15 18 6% 6% 6%
18 21 4% 4% 4%
21 24 1% 4% 4%
More than 24 0%
1%
1%
6.5 Model Outputs
The model outputs for the horizon year 2018 is presented below Figure 6.6, Figure 6.7,
Figure 6.8 which represents passenger load on the metro corridor, passenger flow for the
entire public transport network and the traffic flow in PCUs for the study area highway
network respectively.

Ridership Updation on Kochi Metro and Impact on Pollutants Final Report
CDM Smith 99 Kochi Metro Rail Ltd.
Figure 6.6 Passenger flow on the Metro Corridor

Ridership Updation on Kochi Metro and Impact on Pollutants Final Report
CDM Smith 100 Kochi Metro Rail Ltd.
Figure 6.7 Passenger Flow - Public Transport Network

Ridership Updation on Kochi Metro and Impact on Pollutants Final Report
CDM Smith 101 Kochi Metro Rail Ltd.
Figure 6.8 Traffic Flow - Highway Network (in PCUs)

Ridership Updation on Kochi Metro and Impact on Pollutants Final Report
CDM Smith 102 Kochi Metro Rail Ltd.
Peak hour Boarding and alighting at the proposed stations for the horizon year 2018 is
presented in Figure 6.9 and Figure 6.10 respectively.
Figure 6.9 Boarding and Alighting - Metro Passengers (Petta to Aluva) - 2018
Figure 6.10 Boarding and Alighting - Metro Passengers (Aluva to Petta) – 2018

Ridership Updation on Kochi Metro and Impact on Pollutants Final Report
CDM Smith 103 Kochi Metro Rail Ltd.
6.6 Daily Ridership with Transit Oriented Development
A transit-oriented development (TOD) is planned along the metro corridor including
Increase in FSI, land use reclassification and station development focusing on
commercialization. The idea would be to maximize access to public transport, and hence
encourage transit ridership. TODs generally are located within a radius of 400 to 800 m
from a transit stop thus solving the last mile connectivity problem. Based on the past
experience in similar studies and discussion with KMRL, daily ridership figures are derived
for the TOD scenario. The daily ridership thus arrived based on the above assumptions on
the proposed Metrorail corridor is presented in Table 6.6. The increase in ridership will
vary based on the kind of developments which will realize in the horizon period.
Table 6.9 Summary of Daily Ridership
Year Daily Ridership
(in Millions)
2016 0.43
2033 0.69
2048 0.89
Ridership Updation on Kochi Metro and Impact on Pollutants Final Report
CDM Smith 104 Kochi Metro Rail Ltd.
7. CHAPTER
CARBON EMISSIONS
7.1 Introduction
Transport sector contributes to about 40 % of the total greenhouse gas emissions, across
the cities world over. Particularly in urban areas, transport is one of the main factors for
GHGs and also affecting the local air quality. Urban air quality management is thus closely
linked to improvement in urban transport – increasing the share of public transport
system, promoting non-motorized modes such as walking and cycling, with compatible
land use planning of the city. Further, as transport is the main consumer of fossil fuels,
which are mostly imported by the developing countries, improvements to urban transport
will also enhance the energy efficiency.
Situated in central part of Kerala State between 9º 52' and 10º 10' North Latitude and
between 76º 14' and 76º 21' East Longitude, Kochi is the second most important port city
on the western coast of India. City is situated along the Arabian Sea and Vembanad
Estuary. The city is well connected to other parts of the country. The National Highway
NH-47 passes through the city while NH-49 and NH-17 originate and radiate outwards from
the city. Kochi is 220 km north of Thiruvananthapuram, the State Capital. The Cochin
International Airport is 32 km from the city center. The Greater Cochin Development
Authority (GCDA) area, which encompasses the majority of the urbanized area, covers 732
square kilometres (km²) and has a population of 2.02 million (2011 census). Kochi is also
known as ‘economic capital’ of Kerala. In recent years, the city has witnessed heavy
investments, thus making it one of the fastest growing second-tier metro cities in India.
Considering fast growth urban transport need a metro rail system is being development in
Kochi. Being implemented by Kochi Metro Rail Corporation Limited, the project funded
through various sources. French Development Agency (AFD) is the main agency that is
likely to provide financial assistance to the project. AFD requires assessment of carbon
foot print of its funded projects to fulfill its comment towards sustainable development.
AFD’s commitment to act in favour of sustainable and equitable development is the
cornerstone of its Social and Environmental Responsibility (SER) policy. It applies to all
AFD activities.
7.2 Kochi Metro – A Low Carbon Emission Option
Based on the traffic studies, metro rail has considered an appropriate option. Metro is a
rail-based mass transit system that delivers fast, comfortable, and cost effective high
volume urban mobility. As seen in the above sections, the metro has ability to attract
commuters from low efficient and high fuel intensive transport modes, which ultimately
reduces the overall greenhouse gas emissions.
The Metro rail system also has potential to reduce the greenhouse gas emissions through:
Improved fuel-use efficiency of public transport;
Increase share of public transport - mode switching due to the availability of
a more efficient and attractive public transport system;

Ridership Updation on Kochi Metro and Impact on Pollutants Final Report
CDM Smith 105 Kochi Metro Rail Ltd.
Load increase by having a centrally managed organisation dispatching metro
cars with varied demand-based frequency;
Potentially a fuel switch to low carbon fuels
Reduction in road congestion and improvement in speed of vehicular road
traffic
1. Mode Share Shift from Inefficient and High Energy Intensive Modes to Metro
As presented in the Table 8.1 to Table 8.4, it is projected that Kochi will generate 1.41
million road transport based passenger trips (~ 14.14 million passenger-km) in 2018, which
is likely to increase to 2.87 million passenger trips (~ 31 million passenger-km) in 2048.
With the introduction of metro, the mode switch from the road based transport to metro
is likely to be in an extent of 30%.
Table 7.1 Traffic Share in Passenger Trips
Modes Without Metro With Metro
2018 2033 2048 2018 2033 2048
City Bus 5,82,449 8,36,308 9,31,662 4,24,752 6,35,703 7,08,707
Mini bus 27,463 38,675 48,579 18,939 24,840 30,742
Other Bus 1,37,614 1,92,666 2,39,386 94,993 1,37,327 1,76,959
Car 1,89,840 2,96,224 5,72,442 1,30,171 1,71,711 3,94,078
Taxi 58,221 86,034 1,31,817 41,173 58,364 87,226
TW 2,72,663 3,77,086 4,72,035 2,00,207 2,31,820 2,75,835
Auto 1,44,900 2,65,002 4,78,295 76,707 1,40,488 3,08,849
Metro - - - 4,26,208 6,91,743 8,91,819
Sum 14,13,150 20,91,995 28,74,216 14,13,150 20,91,996 28,74,215
Table 7.2 Percentage Traffic Share in Passenger Trips
Modes Without Metro With Metro Contribution to Metro
2018 2033 2048 2018 2033 2048 2018 2033 2048
City Bus 41% 40% 32% 30% 30% 25% 37% 29% 25%
Mini bus 2% 2% 2% 1% 1% 1% 2% 2% 2%
Other Bus 10% 9% 8% 7% 7% 6% 10% 8% 7%
Car 13% 14% 20% 9% 8% 14% 14% 18% 20%
Taxi 4% 4% 5% 3% 3% 3% 4% 4% 5%
TW 19% 18% 16% 14% 11% 10% 17% 21% 22%
Metro - - - 30% 33% 31% - - -
Sum 100% 100% 100% 100% 100% 100% 100% 100% 100%
Table 7.3 Traffic Share in Passenger km
Modes Passenger Km - Without Metro Passenger Km - With Metro
2018 2033 2048 2018 2033 2048
City Bus 5822160 8911900 10325129 4033531 6435492 7461525
Mini bus 246507 366481 478744 161494 223613 287818
Other Bus 1788266 2643116 3415405 1209730 1846257 2474238

Ridership Updation on Kochi Metro and Impact on Pollutants Final Report
CDM Smith 106 Kochi Metro Rail Ltd.
Modes Passenger Km - Without Metro Passenger Km - With Metro
2018 2033 2048 2018 2033 2048
Taxi 721537 1147678 1828753 469437 716283 1113314
TW 2725536 4018320 5231318 1801146 2297409 2812378
Auto 825930 1616510 3013256 406546 786733 1791325
Metro - - - 36,39,813 66,96,067 93,01,670
Sum 1,41,43,755 2,20,53,905 3,10,25,096 1,29,78,270 2,07,68,910 2,94,59,894
Table 7.4 Percentage Traffic Share in Passengers
Modes Without Metro With Metro Contribution to Metro
2018 2033 2048 2018 2033 2048 2018 2033 2048
City Bus 41% 40% 33% 31% 31% 25% 36% 29% 25%
Mini bus 2% 2% 2% 1% 1% 1% 2% 2% 2%
Other Bus 13% 12% 11% 9% 9% 8% 12% 10% 8%
Car 14% 15% 22% 10% 9% 14% 16% 21% 23%
Taxi 5% 5% 6% 4% 3% 4% 5% 5% 7%
TW 19% 18% 17% 14% 11% 10% 19% 22% 23%
Auto 6% 7% 10% 3% 4% 6% 10% 11% 12%
Metro - - - 28% 32% 32% - - -
Sum 100% 100% 100% 100% 100% 100% - - -
2. Improvement in Fuel Efficiency
Since the metro has potential to attract commuters that are using less efficient road
transport vehicle to the metro as seen in the earlier section, it is likely to lead to reduced
fossil fuel consumption. At present, Petrol (Gasoline) and Diesel are the two principle
fossil fuels moving the vehicular transport in Kochi, while the use of gaseous fuels
(CNG/LPG) is negligible. In terms of fuel mix of vehicles: all type of buses – 100% diesel;
taxi – 40% diesel & 60% petrol; personal cars – 5% diesel & 95% petrol; two & three
wheelers – 100% petrol; and metro rail – electricity.
The Table 8.5 presents the fuel consumption ‘without Metro’ and ‘with Metro’ scenarios,
and the estimated fuel savings. The fuel usage is estimated to reduce by 19,510 KL in 2018
to 47,546 KL in 2048. This accounts to about 30% reduction in total fuel demand.
Table 7.5 Fuel Consumption (in kilo liters)
Modes Without Metro With Metro
2018 2033 2048 2018 2033 2048
City Bus 18.39 24.15 26.71 14.25 18.58 19.87
Mini bus 0.90 1.22 1.51 0.62 0.79 0.94
Other Bus 7.31 9.81 12.12 5.20 7.24 9.08
Car 60.62 99.83 200.63 41.20 59.00 140.83
Taxi 17.81 27.08 42.30 12.08 17.31 26.09

Ridership Updation on Kochi Metro and Impact on Pollutants Final Report
CDM Smith 107 Kochi Metro Rail Ltd.
Modes Without Metro With Metro
2018 2033 2048 2018 2033 2048
Auto 19.56 36.42 67.89 10.97 21.37 48.66
Metro 0.00 0.00 0.00 0.00 0.00 0.00
Total (KL/day) 175 269 443 121 177 312
Total (KL/year) 63,742 98,092 1,61,547 44,232 64,750 1,14,001
Savings(KL/year)
19,510 33,342 47,546
7.3 Carbon Emission Estimate
i. The Table 8.6 presents the carbon emissions estimates for various scenarios and
projected years. Taking into consideration the carbon emissions from Metro
operations (electricity consumption), the net emission reduction is estimated at
31,719 tCO2e in 2018 and increasing to 79,060 tCO2e in 2048.
ii. Carbon emissions from use of construction material. It may be noted that in
general as a practice Emissions from Construction are neglected in estimating the
carbon emission reductions as per the CDM (Clean Development Mechanism)
methodology for carbon credits. As per the CDM methodology for metro rail
projects indicates that, “these (i.e. construction emissions) have not been included
as other methodologies in the energy or industrial sector do not include them also,
based on the argument that material demand resulting from the project is non-
significant in relation to national production. A clear case is e.g. ACM 0002 where
dams can be built for hydropower projects without requiring the inclusion
of construction related emissions (cement basically) although these might be very
large quantities. ACM 0002 chapter leakage: “The main emissions potentially giving
rise to leakage in the context of electric sector projects are emissions arising due
to activities such as power plant construction, fuel handling (extraction processing,
and transport), and land inundation (for hydroelectric projects – see applicability
conditions above). Project participants do not need to consider these emission
sources as leakage in applying this methodology.” In the context of consistency of
methodologies and equal approach to projects independent of the sector in which
they are realized the construction related emissions for MRTs are not included in
this methodology.” There is also another reason that, without metro,
improvements to the road infrastructure (such as widening, new roads, flyovers,
grade separators etc.) will be required, which also require significant quantities of
construction material.
iii. However, based on the AFD request, emissions from the usage of construction
material are estimated. The metro construction requires large quantities of
materials like cement, steel and bitumen. Besides, dust (particulate matter)
emissions from the construction phase are also estimated. The construction is
implemented though four packages and all works running parallel the construction
period is 24 month.

Ridership Updation on Kochi Metro and Impact on Pollutants Final Report
CDM Smith 108 Kochi Metro Rail Ltd.
iv. It is estimated that the embedded carbon emissions in construction material is
359,247 tCO2e. During the construction, about 58 tons of total suspended
particulate matter is likely to be emitted. However this will vary depending on the
dust control mechanisms in place; a good control mechanism will ensure reduce
this amount to a great extent. The Table 7.6 presents the carbon emission
estimates with metro and without metro.
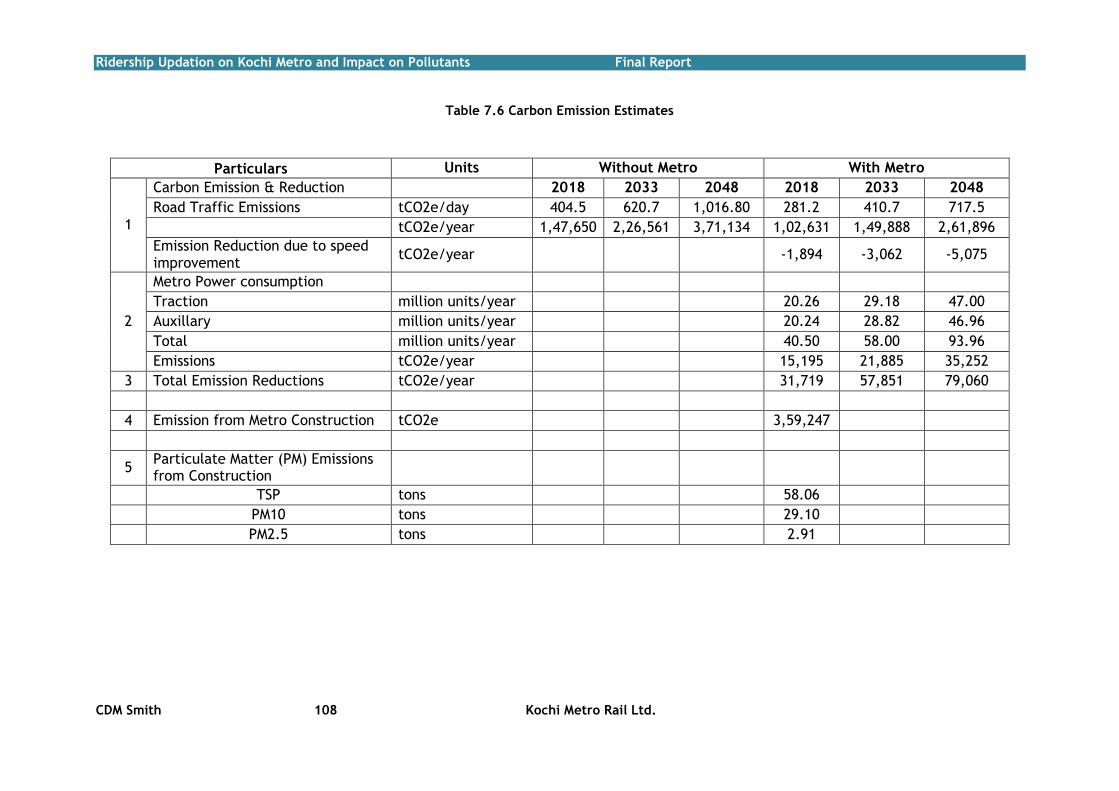
Ridership Updation on Kochi Metro and Impact on Pollutants Final Report
CDM Smith 108 Kochi Metro Rail Ltd.
Table 7.6 Carbon Emission Estimates
Particulars Units Without Metro With Metro
1
Carbon Emission & Reduction 2018 2033 2048 2018 2033 2048
Road Traffic Emissions tCO2e/day 404.5 620.7 1,016.80 281.2 410.7 717.5
tCO2e/year 1,47,650 2,26,561 3,71,134 1,02,631 1,49,888 2,61,896
Emission Reduction due to speed improvement
tCO2e/year -1,894 -3,062 -5,075
2
Metro Power consumption
Traction million units/year 20.26 29.18 47.00
Auxillary million units/year 20.24 28.82 46.96
Total million units/year 40.50 58.00 93.96
Emissions tCO2e/year 15,195 21,885 35,252
3 Total Emission Reductions tCO2e/year 31,719 57,851 79,060
4 Emission from Metro Construction tCO2e 3,59,247
5 Particulate Matter (PM) Emissions from Construction
TSP tons 58.06
PM10 tons 29.10
PM2.5 tons 2.91

Ridership Updation on Kochi Metro and Impact on Pollutants Final Report
CDM Smith 109 Kochi Metro Rail Ltd.
8. CHAPTER
CONCLUSIONS
The present report focused on establishing the overall socioeconomic and traffic and
travel characteristics of the project corridor by conducting fresh traffic and travel surveys
on the project corridor and in the project influence area. Additional surveys are carried
out to update the urban transport model developed during 2005 for the metro ridership
study. Analysis has brought the following broad observations on the study area
characteristics.
1. Majority of the roads are 4-lane divided with two-way traffic except between Petta to Vytilla junction and Kacheripady junction to Ernakulam town which is 2-lane divided. The quality of the road is good along the project corridor and most of the major junctions are signalized.
2. Around 41% of roads in the PIA are 2-lane undivided characteristics and about 36%
of roads are 4-lane divided with two-way. Twenty three percent of roads are single lane with two-way.
3. The journey speed is less than 20kmph between Vytilla and Palarivattam and along
MG road on the project corridor. 4. Traffic on the project corridor varies between 20000 PCUs to 86000 PCUs (18 hours)
and highest observed between Vytilla to Edapally. The share of traffic during the peak hour ranges between 6.2% and 12%.
5. Seventy three percent accounts to private modes with almost fifty percent
contributed by 2-wheelers illustrating that significant share of commuters choose 2-wheelers as their mode to work. Goods traffic is maximum at Kalamassery i.e. on NH47 Salem-Ernakulam highway road.
6. At the outer cordon (entry to the study area), maximum traffic volume is observed
at Aroor on NH47 Kaniyakumari highway road with 56, 424 vehicles (70572 PCUs) in 18 hours.
7. The entire study area is divided into a total of 132 zones, out of which 1 to 74
zones are within the corporation and 51 zones outside the city limit. Seven external zones outside the study area are considered from which significant floating population move towards the city.
8. Analysis of the trip frequency shows that the majority of trips are multiple and
daily. Daily travelers mostly prefer 2-wheelers and the share of trips performed daily and multiple times by car is more than 50%. Occasional travelers travel by cars compared to other modes.
9. The work trips are predominant on the project corridor and cordon locations, which
is the typical travel characteristic of urban areas.

Ridership Updation on Kochi Metro and Impact on Pollutants Final Report
CDM Smith 110 Kochi Metro Rail Ltd.
10. Analysis on travel desire shows that external to internal trips is significant on the project corridor demonstrating considerable floating population in the study area.
11. Average trip length for the 2-wheeler and cars is in the range of 9.9-10.4km on the
project corridor. The average trip length for 3-wheelers is 8.1km on the project corridor.
12. Data on travel desire from the Vytilla hub, North railway station and South railway
station shows that the major share of traffic is destining in the city centre i.e. in and around MG road/Marine drive. Other destinations include Thammanam Junction, Eloor (Fact), Kumbalam, Fort Kochi, Palluruty, Vaduthala, Edapally, Devankulangara, Palarivattom, Vytilla, Ravipuram, Kaloor and Ayyppankavu.
13. Around 70% of the private mode and IPT passengers are very likely to shift to the
proposed metro system. The share of passengers willing to shift is comparatively less at Aluva KSRTC and Aluva Railway station.
14. The population forecasts in the horizon years ie 2018, 2033 and 2048 is estimated as 2.78, 3.41 and 4.05 million respectively. Accordingly the expected employment in the horizon years ie 2018, 2033 and 2048 would be 0.99, 1.29 and 1.59 million respectively.
15. The estimated daily ridership on the proposed Metrorail corridor for the year 2018,
2033 and 2048 are 0.36 million, 0.55 million and 0.71 million respectively.
16. Almost 35% of total metro passenger trips are anticipated to use the project corridor for more than 9 km in the year 2018.
17. The carbon emissions estimates for various scenarios and projected years are worked out, while considering the carbon emissions from Metro operations (electricity consumption), the net emission reduction is estimated at 31,719 tCO2e in 2018 and increasing to 79,060 tCO2e in 2048. It is estimated that the embedded carbon emissions in construction material is 359,247 tCO2e. During the construction, about 58 tons of total suspended particulate matter is likely to be emitted. However this will vary depending on the dust control mechanisms in place; a good control mechanism will ensure reduce this amount to a great extent.

ANNEXURE – 1
SURVEY FORMATS

Road Name
Public Private Public Private
Slow Moving Vehicles
City bus institutional/company Bus
Mini BusLong Distance Bus
Car TaxiTwo
Wheelers
Auto Rickshaw
sLCV Trucks
MAV and Above
Cycles others
Date
Direction
Time
Bus Private Vehicle & IPT
Shared Autos
Goods Vehicles
Kochi Metro Rail LimitedLocation
Classified Traffic Volume Count Survey

Name of the Road : Interviewer :
Date :Location:
Day :
Direction: Time ( 24:00 Hours Format) :
TimeVehicle Type
Occupancy Trip Frequency Origin of the Trip Destination of the TripPurpose of
Journey
Approximate Distance between
O-D (Km)
Do you prefer to travel by metro
once it is operational?
If parking facility is provided at
stations, do you prefer to park
your vehicleand travel by metro?
Vehicle type Trip frequency Purpose of journey1. Two wheeler 1. Multiple trips a day 1. Work 1. Very Unlikely 1.Yes2. Car-Big 2. Daily 2. Business 2. Unlikely 2.No
3. Car-Small 3. Weekly 3. Education 3. Neutral
4. Taxi-Big 4. Occasionally 4. Social & Recreation 4. Likely5. Taxi-Small 5. Medical 5. Very Likely6. Auto 6. Tourism
7. Shared Auto 7. Others
Traffic Study for Kochi MetroRoad Side Interview
Kochi Metro Rail Limited
CDM Smith KMRL

CDM Smith KMRL
Bus Passenger Boarding/Alighting Survey
Traffic Study for Kochi Metro
Kochi Metro Rail Limited Date of Survey: Enumerator Name:
Location/Bus stop: Direction:
Type of Bus Time
Number of Alighting
Passengers
Number of Boarding
Passengers
Sitting Capacity
(%)
Standing Capacity
(%)
Crush Capacity
(Put Mark)
1. Public City Bus(KSRTC) 2. Public Long Distance Bus(KSRTC) 3. Private City Bus 4. Private Long Distance Bus 5. Institutional/Company bus

Origin and Destination at Terminals/Major Transfer Points/Railway Stations
Traffic Study for Kochi Metro
Kochi Metro Rail Limited
CDM Smith KMRL
Date of Survey: Location: Direction:
Passenger Origin Destination Purpose of Journey Frequency
What mode you will use to reach destination/ to reach here from Origin
Will you use metro system to reach your destination from this location once it is operational
1
2
3
4
5
6
7
8
Will you use Metro Purpose of Journey Frequency
1. Very Unlikely 1. Work 1.Multiple Trips a day 2. Unlikely 2.Business 2.Daily 3. Neutral 3.Education 3.Weekly 4. Likely 4.Social & Recreation 4.Occasionally 5. Very Likely 5.Medical
6. Tourism 7.Others

CDM Smith KMRL
Train /Ferry Passenger In/Out Entry/Exit
Traffic Study for Kochi Metro
Kochi Metro Rail Limited Date of Survey: Enumerator Name:
Location: Direction:
Time Passengers In Passengers Out

Road Name: Sheet No: Date:
Direction: Weather: Trip No:
Town: Name of Surveyor:
Time Km Reading Time Km Reading
Delay Causes(i) Traffic Signal/Police control (viii) Pedestrian interference(ii) Stop sign (ix) Level crossing(iii) Market Pedestrian Crossing (x) Road repair(iv) Right turn / U-Turn (Uncontrolled junction) (xi) Breakdown(v) General congestion (xii) Passenger Boarding/Alighting(vi) Accident (xiii) Ticket issuing(Fare stage)(vii) Parked vehicles (xiv) Other delays(mention)
Traffic Study for Kochi MetroSpeed and Delay Survey
Sl.No. Time From Node To NodeBEGIN END Delay
(sec.)Delay CauseLane Type
Kochi Metro Rail Limited
CDM Smith KMRL

Riding Quality
Type of intersection
Type of control
LHS RHS
One way Yes/No Fly Over/Width from where to
where
Road Inventory Survey (Project Coridor)
Good/Fair/Poor
Kochi Metro Rail Limited
From
Distance in Km
From ToTo
Number of Lanes / Road Width Details
Shoulder
P- Paved UP-Unpaved W-Working NW-Non Working
Onstreet/Offstreet parking
Traffic Study for Kochi Metro
Location
Land Use
No of Bus StopsIntersection
CDM Smith
KMRL

ANNEXURE – 2
Volume Count Summary
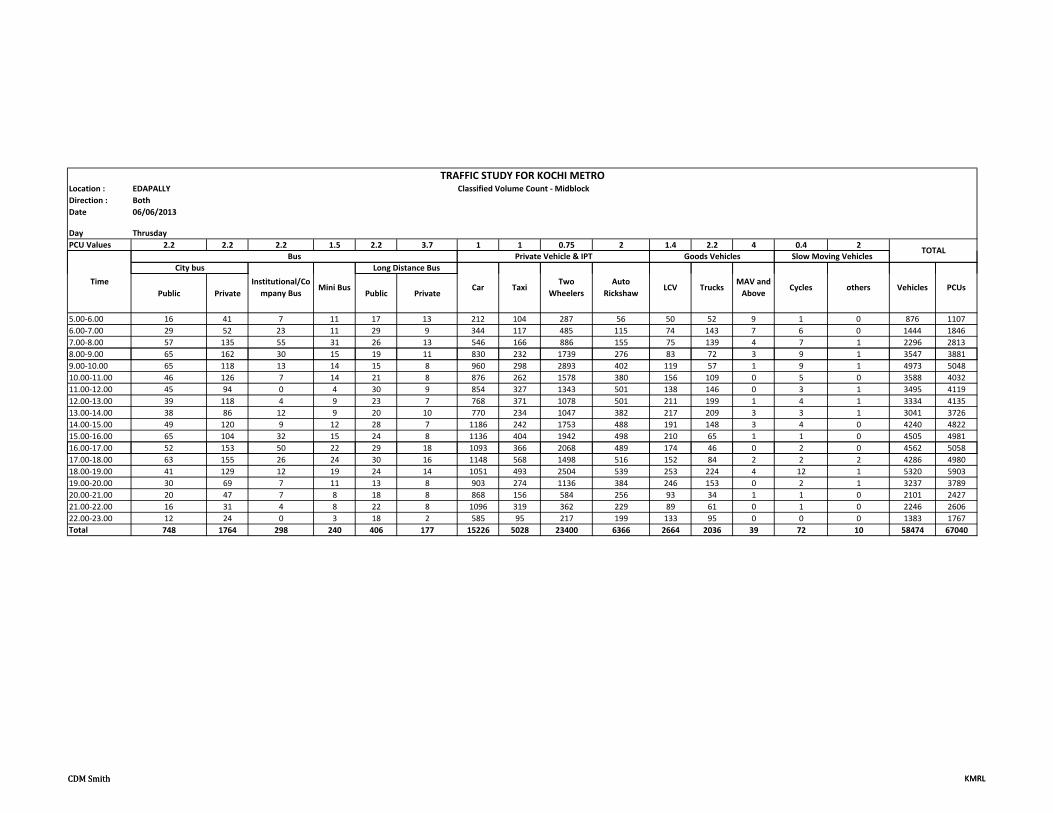
Location : EDAPALLYDirection : BothDate 06/06/2013
Day ThrusdayPCU Values 2.2 2.2 2.2 1.5 2.2 3.7 1 1 0.75 2 1.4 2.2 4 0.4 2
Classified Volume Count ‐ MidblockTRAFFIC STUDY FOR KOCHI METRO
TOTALBus Private Vehicle & IPT Goods Vehicles Slow Moving Vehicles
CDM Smith KMRL
Public Private Public Private
5.00‐6.00 16 41 7 11 17 13 212 104 287 56 50 52 9 1 0 876 11076.00‐7.00 29 52 23 11 29 9 344 117 485 115 74 143 7 6 0 1444 18467.00‐8.00 57 135 55 31 26 13 546 166 886 155 75 139 4 7 1 2296 28138.00‐9.00 65 162 30 15 19 11 830 232 1739 276 83 72 3 9 1 3547 3881
LCV
City bus
Institutional/Company Bus
Mini Bus
Long Distance Bus
CarTime
Vehicles PCUsTrucksMAV and Above
Cycles othersTaxiTwo
WheelersAuto
Rickshaw
8.00 9.00 65 162 30 15 19 11 830 232 1739 276 83 72 3 9 1 3547 38819.00‐10.00 65 118 13 14 15 8 960 298 2893 402 119 57 1 9 1 4973 504810.00‐11.00 46 126 7 14 21 8 876 262 1578 380 156 109 0 5 0 3588 403211.00‐12.00 45 94 0 4 30 9 854 327 1343 501 138 146 0 3 1 3495 411912.00‐13.00 39 118 4 9 23 7 768 371 1078 501 211 199 1 4 1 3334 413513.00‐14.00 38 86 12 9 20 10 770 234 1047 382 217 209 3 3 1 3041 372614.00‐15.00 49 120 9 12 28 7 1186 242 1753 488 191 148 3 4 0 4240 482215.00‐16.00 65 104 32 15 24 8 1136 404 1942 498 210 65 1 1 0 4505 498116.00‐17.00 52 153 50 22 29 18 1093 366 2068 489 174 46 0 2 0 4562 505817.00‐18.00 63 155 26 24 30 16 1148 568 1498 516 152 84 2 2 2 4286 498018.00‐19.00 41 129 12 19 24 14 1051 493 2504 539 253 224 4 12 1 5320 590319.00‐20.00 30 69 7 11 13 8 903 274 1136 384 246 153 0 2 1 3237 378920.00‐21.00 20 47 7 8 18 8 868 156 584 256 93 34 1 1 0 2101 242721.00‐22.00 16 31 4 8 22 8 1096 319 362 229 89 61 0 1 0 2246 260622.00‐23.00 12 24 0 3 18 2 585 95 217 199 133 95 0 0 0 1383 1767Total 748 1764 298 240 406 177 15226 5028 23400 6366 2664 2036 39 72 10 58474 67040
CDM Smith KMRL
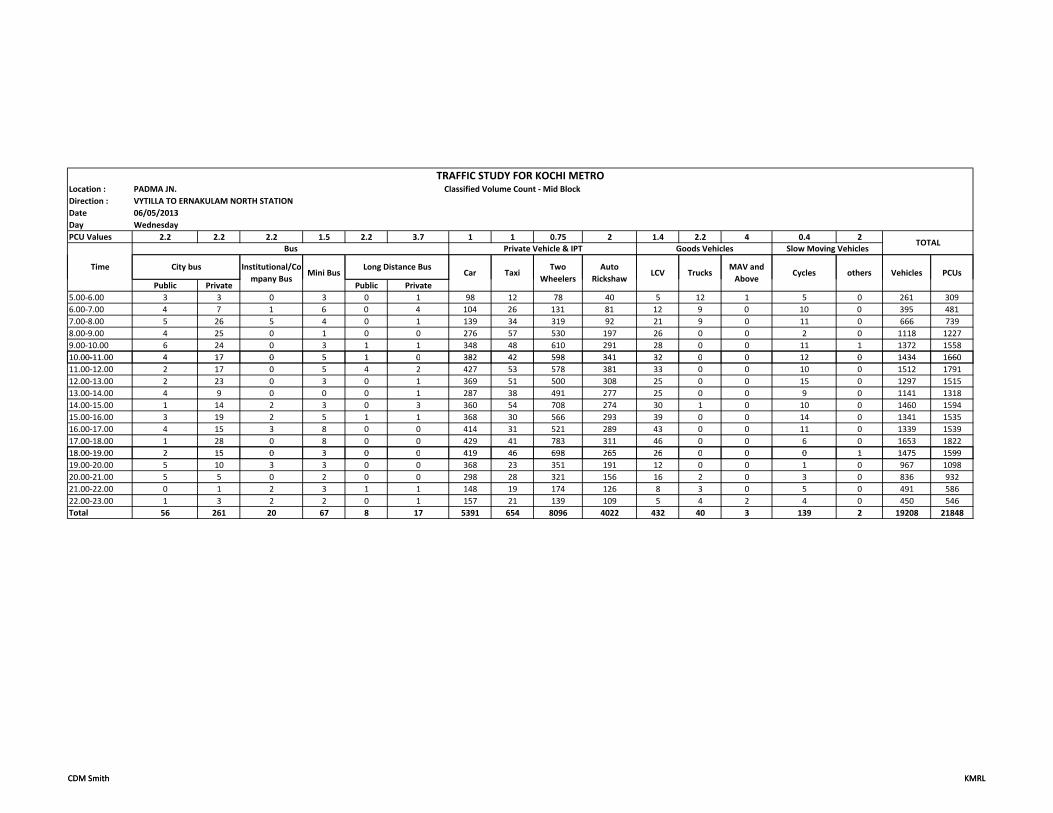
Location : PADMA JN.Direction : VYTILLA TO ERNAKULAM NORTH STATIONDate 06/05/2013Day WednesdayPCU Values 2.2 2.2 2.2 1.5 2.2 3.7 1 1 0.75 2 1.4 2.2 4 0.4 2
Classified Volume Count ‐ Mid BlockTRAFFIC STUDY FOR KOCHI METRO
TOTALBus Private Vehicle & IPT Goods Vehicles Slow Moving Vehicles
/
CDM Smith KMRL
Public Private Public Private5.00‐6.00 3 3 0 3 0 1 98 12 78 40 5 12 1 5 0 261 3096.00‐7.00 4 7 1 6 0 4 104 26 131 81 12 9 0 10 0 395 4817.00‐8.00 5 26 5 4 0 1 139 34 319 92 21 9 0 11 0 666 7398.00‐9.00 4 25 0 1 0 0 276 57 530 197 26 0 0 2 0 1118 12279.00‐10.00 6 24 0 3 1 1 348 48 610 291 28 0 0 11 1 1372 155810 00‐11 00 4 17 0 5 1 0 382 42 598 341 32 0 0 12 0 1434 1660
TimeVehicles PCUsTrucks
MAV and Above
Cycles othersTaxiTwo
WheelersAuto
RickshawLCV
City bus Institutional/Company Bus
Mini BusLong Distance Bus
Car
10.00‐11.00 4 17 0 5 1 0 382 42 598 341 32 0 0 12 0 1434 166011.00‐12.00 2 17 0 5 4 2 427 53 578 381 33 0 0 10 0 1512 179112.00‐13.00 2 23 0 3 0 1 369 51 500 308 25 0 0 15 0 1297 151513.00‐14.00 4 9 0 0 0 1 287 38 491 277 25 0 0 9 0 1141 131814.00‐15.00 1 14 2 3 0 3 360 54 708 274 30 1 0 10 0 1460 159415.00‐16.00 3 19 2 5 1 1 368 30 566 293 39 0 0 14 0 1341 153516.00‐17.00 4 15 3 8 0 0 414 31 521 289 43 0 0 11 0 1339 153917.00‐18.00 1 28 0 8 0 0 429 41 783 311 46 0 0 6 0 1653 182218 00‐19 00 2 15 0 3 0 0 419 46 698 265 26 0 0 0 1 1475 159918.00‐19.00 2 15 0 3 0 0 419 46 698 265 26 0 0 0 1 1475 159919.00‐20.00 5 10 3 3 0 0 368 23 351 191 12 0 0 1 0 967 109820.00‐21.00 5 5 0 2 0 0 298 28 321 156 16 2 0 3 0 836 93221.00‐22.00 0 1 2 3 1 1 148 19 174 126 8 3 0 5 0 491 58622.00‐23.00 1 3 2 2 0 1 157 21 139 109 5 4 2 4 0 450 546Total 56 261 20 67 8 17 5391 654 8096 4022 432 40 3 139 2 19208 21848
CDM Smith KMRL

Location : AMBATUKAVUDirection : BothDate 06/18/2013Day TuesdayPCU Values 2.2 2.2 2.2 1.5 2.2 3.7 1 1 0.75 1.2 2 3.7 4 0.4 2
Classified Volume Count ‐ Mid Block
LCVCity bus Institutional/Co
Mi i BLong Distance Bus
C
TRAFFIC STUDY FOR KOCHI METRO
TOTALBus Private Vehicle & IPT Goods Vehicles Slow Moving Vehicles
TimeV hi l PCUT k
MAV andC l hT i
Two Auto
CDM Smith KMRL
Public Private Public Private5.00‐6.00 10 4 1 8 9 6 288 51 118 33 122 135 73 0 0 858 15906.00‐7.00 14 18 9 16 33 6 574 172 226 119 297 451 251 8 0 2194 45377.00‐8.00 41 34 33 19 28 23 725 280 482 172 238 345 144 7 0 2571 43178.00‐9.00 54 50 31 18 43 15 810 211 972 188 207 292 107 2 0 3000 43739.00‐10.00 64 60 12 21 58 20 1146 379 888 266 312 290 104 2 2 3624 516010.00‐11.00 78 52 7 18 43 8 1368 367 834 142 245 381 80 1 1 3625 520611.00‐12.00 66 56 3 22 53 13 1476 336 609 179 336 401 118 0 2 3670 5588
LCVCity bus Institutional/Co
mpany BusMini Bus
Long Distance BusCar
TimeVehicles PCUsTrucks
MAV and Above
Cycles othersTaxiTwo
WheelersAuto
Rickshaw
11.00‐12.00 66 56 3 22 53 13 1476 336 609 179 336 401 118 0 2 3670 558812.00‐13.00 64 61 4 31 46 15 1389 342 635 133 462 529 194 3 3 3911 651813.00‐14.00 63 67 3 19 40 12 1269 251 546 120 330 337 160 5 1 3223 507814.00‐15.00 60 52 9 13 33 9 1223 240 596 131 342 328 137 2 2 3177 490915.00‐16.00 64 64 24 16 19 13 1159 293 729 131 383 313 133 0 1 3342 506216.00‐17.00 52 38 24 14 22 14 1625 262 812 182 420 327 167 4 1 3964 580817.00‐18.00 53 48 10 17 40 20 2103 458 1121 283 372 346 151 2 2 5026 680618.00‐19.00 48 57 0 13 38 14 1639 277 1129 174 349 322 158 1 0 4219 587919 00‐20 00 59 52 0 18 31 26 1887 334 809 246 414 334 189 0 0 4399 637819.00‐20.00 59 52 0 18 31 26 1887 334 809 246 414 334 189 0 0 4399 637820.00‐21.00 40 46 2 13 27 28 1554 239 619 137 181 228 130 0 0 3244 452321.00‐22.00 16 22 0 6 19 36 970 153 345 63 119 170 130 0 0 2049 311222.00‐23.00 19 13 0 5 15 17 467 90 179 20 58 173 135 1 0 1192 2186Total 865 794 172 287 597 295 21672 4735 11649 2719 5187 5702 2561 38 15 57288 87031
CDM Smith KMRL

Location : VYTILLADirection : BothDate 01/00/1900Day 01/00/1900PCU Values 2.2 2.2 2.2 1.5 2.2 3.7 1 1 0.75 2 1.4 2.2 4 0.4 2
Classified Volume Count ‐ Mid BlockTRAFFIC STUDY FOR KOCHI METRO
TOTALBus Private Vehicle & IPT Goods Vehicles Slow Moving Vehicles
/
CDM Smith KMRL
Public Private Public Private5.00‐6.00 8 24 0 2 3 4 86 17 100 31 11 6 0 0 0 292 3636.00‐7.00 19 55 35 15 3 7 230 64 301 130 24 11 2 14 0 910 11467.00‐8.00 14 102 24 15 7 5 457 100 748 274 41 33 9 6 0 1835 21998.00‐9.00 15 135 18 14 17 9 792 131 1548 273 50 30 3 9 0 3044 32439.00‐10.00 32 87 1 4 14 8 787 211 3432 331 66 6 0 0 0 4979 467010 00‐11 00 15 82 0 13 12 8 577 91 2220 232 73 19 4 2 0 3348 3247
TimeVehicles PCUsTrucks
MAV and Above
Cycles othersTaxiTwo
WheelersAuto
RickshawLCV
City bus Institutional/Company Bus
Mini BusLong Distance Bus
Car
10.00‐11.00 15 82 0 13 12 8 577 91 2220 232 73 19 4 2 0 3348 324711.00‐12.00 14 76 0 5 7 6 398 87 1716 111 59 11 5 0 0 2495 236412.00‐13.00 5 62 7 8 16 8 485 79 1932 135 61 29 2 3 0 2832 268113.00‐14.00 8 62 8 5 7 6 448 103 1692 127 48 19 5 0 0 2538 242014.00‐15.00 18 61 21 11 11 9 309 132 876 144 62 12 4 4 1 1675 181315.00‐16.00 23 65 22 9 12 11 419 118 1272 210 43 11 1 17 0 2233 232916.00‐17.00 11 97 30 9 13 12 470 162 1080 177 36 10 4 9 0 2120 227817.00‐18.00 6 71 14 6 13 18 321 123 1032 160 38 8 3 14 0 1827 193118 00‐19 00 14 59 1 12 16 13 342 82 1332 149 18 11 3 13 0 2065 205218.00‐19.00 14 59 1 12 16 13 342 82 1332 149 18 11 3 13 0 2065 205219.00‐20.00 7 44 2 6 18 12 230 42 1416 78 18 5 1 4 0 1883 174120.00‐21.00 6 18 0 4 12 17 379 54 1464 48 10 3 1 4 0 2020 180121.00‐22.00 5 0 0 1 6 4 234 48 660 56 15 3 8 2 0 1042 99022.00‐23.00 0 0 0 5 2 1 107 12 252 28 5 1 2 1 0 416 397Total 220 1100 183 144 189 158 7071 1656 23073 2694 678 228 57 102 1 37554 37664
CDM Smith KMRL
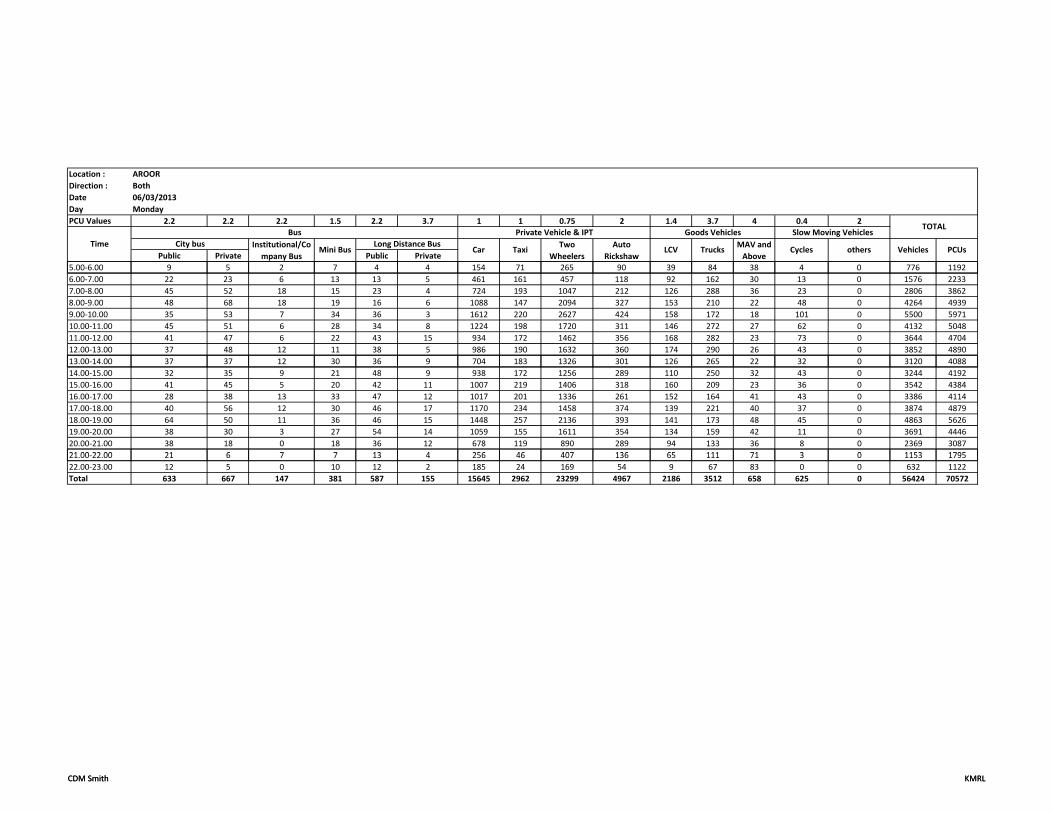
Location : AROORDirection : BothDate 06/03/2013Day MondayPCU Values 2.2 2.2 2.2 1.5 2.2 3.7 1 1 0.75 2 1.4 3.7 4 0.4 2
Public Private Public Private
TOTALBus Private Vehicle & IPT Goods Vehicles Slow Moving Vehicles
TimeVehicles PCUsTrucks
MAV and Above
Cycles othersTaxiTwo
WheelersAuto
RickshawLCV
City bus Institutional/Company Bus
Mini BusLong Distance Bus
Car
CDM Smith KMRL
5.00‐6.00 9 5 2 7 4 4 154 71 265 90 39 84 38 4 0 776 11926.00‐7.00 22 23 6 13 13 5 461 161 457 118 92 162 30 13 0 1576 22337.00‐8.00 45 52 18 15 23 4 724 193 1047 212 126 288 36 23 0 2806 38628.00‐9.00 48 68 18 19 16 6 1088 147 2094 327 153 210 22 48 0 4264 49399.00‐10.00 35 53 7 34 36 3 1612 220 2627 424 158 172 18 101 0 5500 597110.00‐11.00 45 51 6 28 34 8 1224 198 1720 311 146 272 27 62 0 4132 504811.00‐12.00 41 47 6 22 43 15 934 172 1462 356 168 282 23 73 0 3644 470412.00‐13.00 37 48 12 11 38 5 986 190 1632 360 174 290 26 43 0 3852 489013 00 14 00 3 3 12 30 36 9 04 183 1326 301 126 26 22 32 0 3120 408813.00‐14.00 37 37 12 30 36 9 704 183 1326 301 126 265 22 32 0 3120 408814.00‐15.00 32 35 9 21 48 9 938 172 1256 289 110 250 32 43 0 3244 419215.00‐16.00 41 45 5 20 42 11 1007 219 1406 318 160 209 23 36 0 3542 438416.00‐17.00 28 38 13 33 47 12 1017 201 1336 261 152 164 41 43 0 3386 411417.00‐18.00 40 56 12 30 46 17 1170 234 1458 374 139 221 40 37 0 3874 487918.00‐19.00 64 50 11 36 46 15 1448 257 2136 393 141 173 48 45 0 4863 562619.00‐20.00 38 30 3 27 54 14 1059 155 1611 354 134 159 42 11 0 3691 444620.00‐21.00 38 18 0 18 36 12 678 119 890 289 94 133 36 8 0 2369 308721 00 22 00 21 6 7 7 13 4 256 46 407 136 65 111 71 3 0 1153 179521.00‐22.00 21 6 7 7 13 4 256 46 407 136 65 111 71 3 0 1153 179522.00‐23.00 12 5 0 10 12 2 185 24 169 54 9 67 83 0 0 632 1122Total 633 667 147 381 587 155 15645 2962 23299 4967 2186 3512 658 625 0 56424 70572
CDM Smith KMRL

Location : ANGAMALLYDirection : BothDate 06/21/2013Day FridayPCU Values 2.2 2.2 2.2 1.5 2.2 3.7 1 1 0.75 1.2 2 3.7 5 0.4 2
Public Private Public Private
TOTALBus Private Vehicle & IPT Goods Vehicles Slow Moving Vehicles
TimeVehicles PCUsTrucks
MAV and Above
Cycles othersTaxiTwo
WheelersAuto
RickshawLCV
City bus Institutional/Company Bus
Mini BusLong Distance Bus
Car
CDM Smith KMRL
5.00‐6.00 0 0 2 4 9 6 148 68 78 15 24 70 26 0 0 450 7826.00‐7.00 0 0 12 6 30 17 523 260 227 62 65 206 104 0 0 1512 26047.00‐8.00 0 0 21 13 49 29 716 267 353 53 136 244 104 0 0 1985 32878.00‐9.00 0 0 27 15 44 32 884 248 841 76 147 233 224 0 0 2771 44279.00‐10.00 0 0 13 19 51 40 820 278 845 121 156 220 203 0 0 2766 433510.00‐11.00 0 0 9 19 65 40 866 352 578 103 155 217 140 0 0 2544 392711.00‐12.00 0 0 6 13 68 31 991 247 512 93 218 233 145 0 0 2557 405412.00‐13.00 0 0 6 14 58 35 903 343 607 141 183 177 132 0 0 2599 3843
p y
13.00‐14.00 0 0 11 14 38 24 798 235 475 72 116 162 91 0 0 2036 298014.00‐15.00 0 0 10 14 70 33 905 266 498 117 147 207 138 0 0 2405 375415.00‐16.00 0 0 12 9 63 32 1108 325 609 105 161 179 149 2 1 2755 404516.00‐17.00 0 0 18 13 59 39 1272 385 615 132 185 172 145 0 0 3035 434117.00‐18.00 0 0 10 13 50 47 1340 483 841 134 244 218 92 0 0 3472 469518.00‐19.00 0 0 9 17 52 45 1266 496 723 114 285 168 142 0 0 3317 466919.00‐20.00 0 0 5 20 54 45 1244 405 730 152 188 164 140 0 0 3147 438820.00‐21.00 0 0 3 14 38 24 881 318 566 76 197 323 183 0 0 2623 44190.00 .00 0 0 3 4 38 4 88 3 8 566 76 97 3 3 83 0 0 6 3 44 921.00‐22.00 0 0 8 13 43 43 767 211 437 63 210 224 271 0 0 2290 427622.00‐23.00 0 0 2 8 16 17 457 143 130 27 66 140 126 0 0 1132 2124Total 0 0 184 238 857 579 15889 5330 9665 1656 2883 3557 2555 2 1 43396 66949
CDM Smith KMRL

Location : PARAVOORDirection : BothDate 06/20/2013Day ThrusdayPCU Values 2.2 2.2 2.2 1.5 2.2 3.7 1 1 0.75 2 1.4 3.7 4 0.4 2
Public Private Public Private5.00‐6.00 0 0 3 2 3 8 53 26 44 51 17 15 10 4 0 236 3816.00‐7.00 0 0 5 3 18 21 68 50 125 57 26 23 9 4 0 409 6187.00‐8.00 0 0 11 2 14 26 122 46 116 66 30 16 10 3 0 462 6848.00‐9.00 0 0 20 13 10 26 242 71 137 76 160 73 16 3 0 847 13099.00‐10.00 0 0 13 9 14 27 264 56 119 89 101 75 13 6 0 786 123310.00‐11.00 0 0 2 12 10 26 278 76 149 149 84 47 21 1 0 855 128011.00‐12.00 0 0 2 2 9 21 249 41 122 122 76 41 13 8 0 706 104412.00‐13.00 0 0 0 9 9 20 219 37 97 97 43 23 4 6 0 564 79413.00‐14.00 0 0 4 11 9 21 236 35 104 104 48 18 6 3 0 599 83914.00‐15.00 0 0 3 7 9 17 213 26 95 95 53 28 8 4 0 558 81115.00‐16.00 0 0 16 7 10 20 252 46 117 117 67 29 10 0 0 691 100316.00‐17.00 0 0 17 10 10 19 254 38 104 104 56 20 17 9 0 658 94717.00‐18.00 0 0 14 9 8 22 275 39 169 169 58 26 9 7 0 805 113818.00‐19.00 0 0 2 5 10 34 246 33 165 165 42 22 10 2 0 736 107319.00‐20.00 0 0 2 5 8 20 129 17 63 63 42 17 11 1 0 378 58920.00‐21.00 0 0 0 3 5 7 87 16 42 42 21 29 17 5 0 274 46721.00‐22.00 0 0 1 1 4 6 66 14 17 17 17 12 13 1 0 169 28222.00‐23.00 0 0 1 2 2 7 61 21 14 14 8 9 9 0 0 148 237Total 0 0 116 112 162 348 3314 688 1799 1597 949 523 206 67 0 9881 14727
TOTALBus Private Vehicle & IPT Goods Vehicles Slow Moving Vehicles
Vehicles PCUsTime
Trucks MAV and Above
Cycles othersTaxi Two Wheelers
Auto Rickshaw
LCVCity bus Institutional/
Company BusMini Bus
Long Distance BusCar
CDM Smith KMRLCDM Smith KMRL
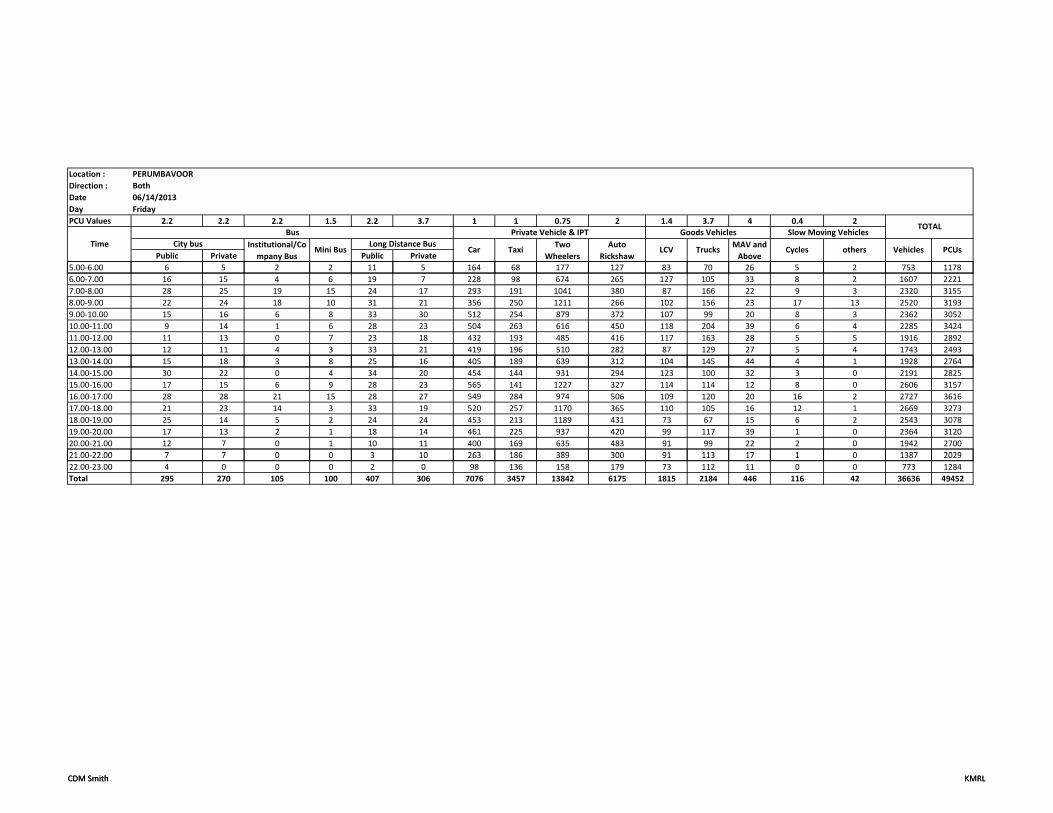
Location : PERUMBAVOORDirection : BothDate 06/14/2013Day FridayPCU Values 2.2 2.2 2.2 1.5 2.2 3.7 1 1 0.75 2 1.4 3.7 4 0.4 2
Public Private Public PrivateLCV
City bus Institutional/Company Bus
Mini BusLong Distance Bus
Car
TOTALBus Private Vehicle & IPT Goods Vehicles Slow Moving Vehicles
TimeVehicles PCUsTrucks
MAV and Above
Cycles othersTaxiTwo
WheelersAuto
Rickshaw
CDM Smith KMRL
5.00‐6.00 6 5 2 2 11 5 164 68 177 127 83 70 26 5 2 753 11786.00‐7.00 16 15 4 6 19 7 228 98 674 265 127 105 33 8 2 1607 22217.00‐8.00 28 25 19 15 24 17 293 191 1041 380 87 166 22 9 3 2320 31558.00‐9.00 22 24 18 10 31 21 356 250 1211 266 102 156 23 17 13 2520 31939.00‐10.00 15 16 6 8 33 30 512 254 879 372 107 99 20 8 3 2362 305210.00‐11.00 9 14 1 6 28 23 504 263 616 450 118 204 39 6 4 2285 342411.00‐12.00 11 13 0 7 23 18 432 193 485 416 117 163 28 5 5 1916 289212.00‐13.00 12 11 4 3 33 21 419 196 510 282 87 129 27 5 4 1743 249313 00 14 00 1 18 3 8 2 16 40 189 639 312 104 14 44 4 1 1928 2 6413.00‐14.00 15 18 3 8 25 16 405 189 639 312 104 145 44 4 1 1928 276414.00‐15.00 30 22 0 4 34 20 454 144 931 294 123 100 32 3 0 2191 282515.00‐16.00 17 15 6 9 28 23 565 141 1227 327 114 114 12 8 0 2606 315716.00‐17.00 28 28 21 15 28 27 549 284 974 506 109 120 20 16 2 2727 361617.00‐18.00 21 23 14 3 33 19 520 257 1170 365 110 105 16 12 1 2669 327318.00‐19.00 25 14 5 2 24 24 453 213 1189 431 73 67 15 6 2 2543 307819.00‐20.00 17 13 2 1 18 14 461 225 937 420 99 117 39 1 0 2364 312020.00‐21.00 12 7 0 1 10 11 400 169 635 483 91 99 22 2 0 1942 270021 00 22 00 7 7 0 0 3 10 263 186 389 300 91 113 17 1 0 1387 202921.00‐22.00 7 7 0 0 3 10 263 186 389 300 91 113 17 1 0 1387 202922.00‐23.00 4 0 0 0 2 0 98 136 158 179 73 112 11 0 0 773 1284Total 295 270 105 100 407 306 7076 3457 13842 6175 1815 2184 446 116 42 36636 49452
CDM Smith KMRL
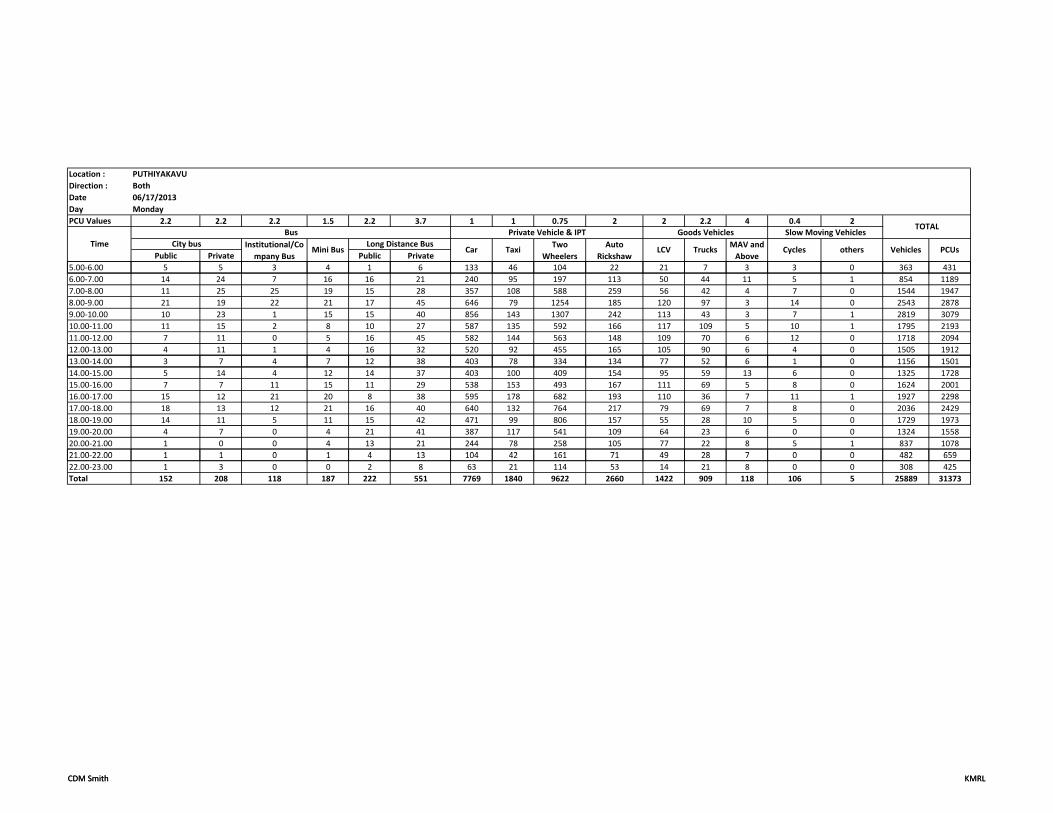
Location : PUTHIYAKAVUDirection : BothDate 06/17/2013Day MondayPCU Values 2.2 2.2 2.2 1.5 2.2 3.7 1 1 0.75 2 2 2.2 4 0.4 2
Public Private Public Private
TOTALBus Private Vehicle & IPT Goods Vehicles Slow Moving Vehicles
TimeVehicles PCUsTrucks
MAV and Above
Cycles othersTaxiTwo
WheelersAuto
RickshawLCV
City bus Institutional/Company Bus
Mini BusLong Distance Bus
Car
CDM Smith KMRL
5.00‐6.00 5 5 3 4 1 6 133 46 104 22 21 7 3 3 0 363 4316.00‐7.00 14 24 7 16 16 21 240 95 197 113 50 44 11 5 1 854 11897.00‐8.00 11 25 25 19 15 28 357 108 588 259 56 42 4 7 0 1544 19478.00‐9.00 21 19 22 21 17 45 646 79 1254 185 120 97 3 14 0 2543 28789.00‐10.00 10 23 1 15 15 40 856 143 1307 242 113 43 3 7 1 2819 307910.00‐11.00 11 15 2 8 10 27 587 135 592 166 117 109 5 10 1 1795 219311.00‐12.00 7 11 0 5 16 45 582 144 563 148 109 70 6 12 0 1718 209412.00‐13.00 4 11 1 4 16 32 520 92 455 165 105 90 6 4 0 1505 191213 00 14 00 3 4 12 38 403 8 334 134 2 6 1 0 11 6 1 0113.00‐14.00 3 7 4 7 12 38 403 78 334 134 77 52 6 1 0 1156 150114.00‐15.00 5 14 4 12 14 37 403 100 409 154 95 59 13 6 0 1325 172815.00‐16.00 7 7 11 15 11 29 538 153 493 167 111 69 5 8 0 1624 200116.00‐17.00 15 12 21 20 8 38 595 178 682 193 110 36 7 11 1 1927 229817.00‐18.00 18 13 12 21 16 40 640 132 764 217 79 69 7 8 0 2036 242918.00‐19.00 14 11 5 11 15 42 471 99 806 157 55 28 10 5 0 1729 197319.00‐20.00 4 7 0 4 21 41 387 117 541 109 64 23 6 0 0 1324 155820.00‐21.00 1 0 0 4 13 21 244 78 258 105 77 22 8 5 1 837 107821 00 22 00 1 1 0 1 4 13 104 42 161 71 49 28 7 0 0 482 65921.00‐22.00 1 1 0 1 4 13 104 42 161 71 49 28 7 0 0 482 65922.00‐23.00 1 3 0 0 2 8 63 21 114 53 14 21 8 0 0 308 425Total 152 208 118 187 222 551 7769 1840 9622 2660 1422 909 118 106 5 25889 31373
CDM Smith KMRL

Location : ThiruvakulamDirection : BothDate 06/19/2013Day WednesdayPCU Values 2.2 2.2 2.2 1.5 2.2 3.7 1 1 0.75 2 1.4 3.7 4 0.4 2
Public Private Public Private
TOTALBus Private Vehicle & IPT Goods Vehicles Slow Moving Vehicles
TimeVehicles PCUsTrucks
MAV and Above
Cycles othersTaxiTwo
WheelersAuto
RickshawLCV
City bus Institutional/Company Bus
Mini BusLong Distance Bus
Car
CDM Smith KMRL
5.00‐6.00 6 3 4 4 8 5 84 18 150 27 14 12 5 4 0 344 4256.00‐7.00 10 1 8 3 8 1 121 35 187 29 22 56 9 3 0 493 6977.00‐8.00 11 3 22 12 8 3 247 47 367 50 46 96 7 9 0 928 12468.00‐9.00 14 6 14 16 15 5 358 41 620 94 53 72 7 6 3 1324 15799.00‐10.00 13 2 6 9 12 5 436 57 850 102 43 53 4 3 0 1595 171310.00‐11.00 23 3 1 11 9 2 385 59 453 100 68 108 7 8 0 1237 161311.00‐12.00 4 2 2 11 8 1 363 48 396 73 70 71 10 9 0 1068 131412.00‐13.00 17 1 0 9 13 1 334 46 393 77 93 76 16 5 0 1081 139213 00 14 00 6 6 8 12 9 3 32 62 311 91 3 38 0 938 114113.00‐14.00 6 6 8 12 9 3 325 62 311 91 53 38 7 7 0 938 114114.00‐15.00 20 3 13 6 7 0 421 69 401 102 69 40 7 2 0 1160 137215.00‐16.00 15 2 8 9 13 0 347 44 365 90 58 75 15 7 0 1048 136316.00‐17.00 15 2 22 22 12 2 409 46 486 98 72 32 9 9 0 1236 142717.00‐18.00 14 0 11 16 5 8 385 44 598 112 61 45 6 4 0 1309 149918.00‐19.00 17 2 4 13 21 1 434 76 520 90 56 35 6 7 2 1284 143919.00‐20.00 15 4 1 13 9 3 369 63 624 88 66 76 8 6 2 1347 158220.00‐21.00 12 0 0 3 7 3 368 19 305 45 35 47 15 0 0 859 104621 00 22 00 6 2 0 7 9 1 372 15 134 24 13 40 15 0 0 638 81321.00‐22.00 6 2 0 7 9 1 372 15 134 24 13 40 15 0 0 638 81322.00‐23.00 2 0 11 1 6 0 191 15 105 5 7 30 13 0 0 386 511Total 220 42 135 177 179 44 5949 804 7265 1297 899 1002 166 89 7 18275 22171
CDM Smith KMRL
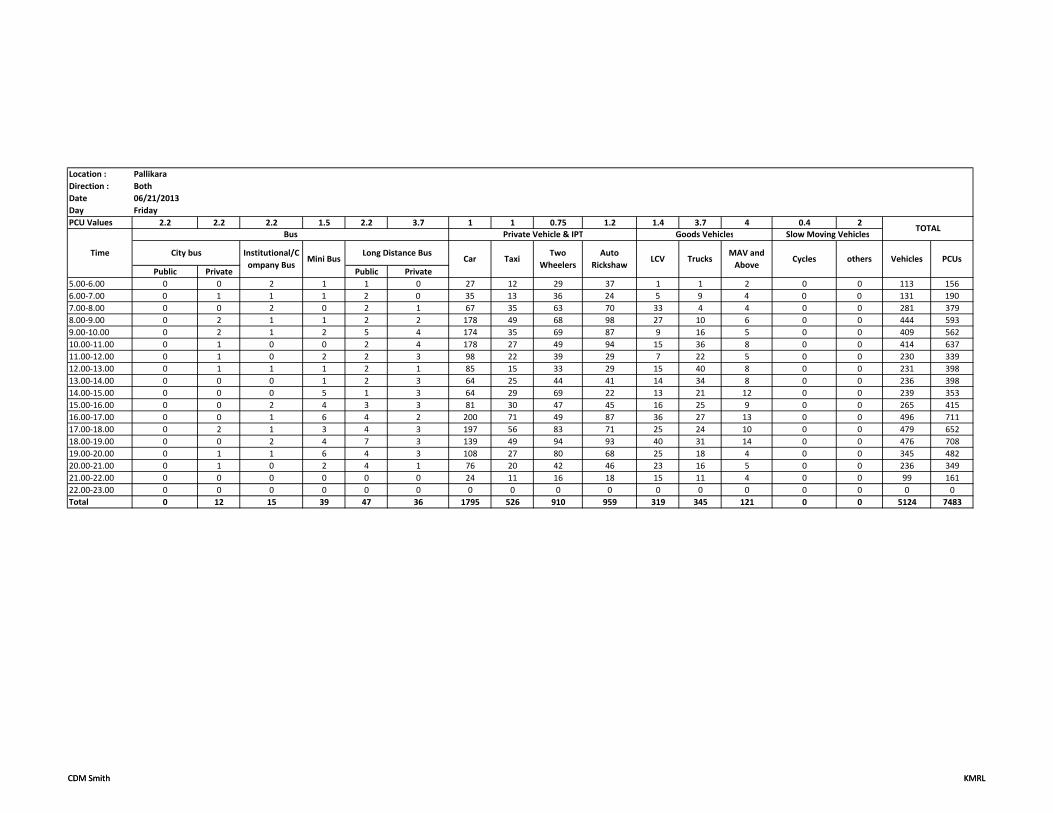
Location : Pallikara Direction : BothDate 06/21/2013Day FridayPCU Values 2.2 2.2 2.2 1.5 2.2 3.7 1 1 0.75 1.2 1.4 3.7 4 0.4 2
Public Private Public Private5.00‐6.00 0 0 2 1 1 0 27 12 29 37 1 1 2 0 0 113 1566.00‐7.00 0 1 1 1 2 0 35 13 36 24 5 9 4 0 0 131 1907.00‐8.00 0 0 2 0 2 1 67 35 63 70 33 4 4 0 0 281 3798.00‐9.00 0 2 1 1 2 2 178 49 68 98 27 10 6 0 0 444 5939.00‐10.00 0 2 1 2 5 4 174 35 69 87 9 16 5 0 0 409 56210.00‐11.00 0 1 0 0 2 4 178 27 49 94 15 36 8 0 0 414 63711.00‐12.00 0 1 0 2 2 3 98 22 39 29 7 22 5 0 0 230 33912.00‐13.00 0 1 1 1 2 1 85 15 33 29 15 40 8 0 0 231 39813.00‐14.00 0 0 0 1 2 3 64 25 44 41 14 34 8 0 0 236 39814.00‐15.00 0 0 0 5 1 3 64 29 69 22 13 21 12 0 0 239 35315.00‐16.00 0 0 2 4 3 3 81 30 47 45 16 25 9 0 0 265 41516.00‐17.00 0 0 1 6 4 2 200 71 49 87 36 27 13 0 0 496 71117.00‐18.00 0 2 1 3 4 3 197 56 83 71 25 24 10 0 0 479 65218.00‐19.00 0 0 2 4 7 3 139 49 94 93 40 31 14 0 0 476 70819.00‐20.00 0 1 1 6 4 3 108 27 80 68 25 18 4 0 0 345 48220.00‐21.00 0 1 0 2 4 1 76 20 42 46 23 16 5 0 0 236 34921.00‐22.00 0 0 0 0 0 0 24 11 16 18 15 11 4 0 0 99 16122.00‐23.00 0 0 0 0 0 0 0 0 0 0 0 0 0 0 0 0 0Total 0 12 15 39 47 36 1795 526 910 959 319 345 121 0 0 5124 7483
TOTALBus Private Vehicle & IPT Goods Vehicles Slow Moving Vehicles
TimeVehicles PCUsTrucks
MAV and Above
Cycles othersTaxiTwo
WheelersAuto
RickshawLCV
City bus Institutional/Company Bus
Mini BusLong Distance Bus
Car
CDM Smith KMRLCDM Smith KMRL
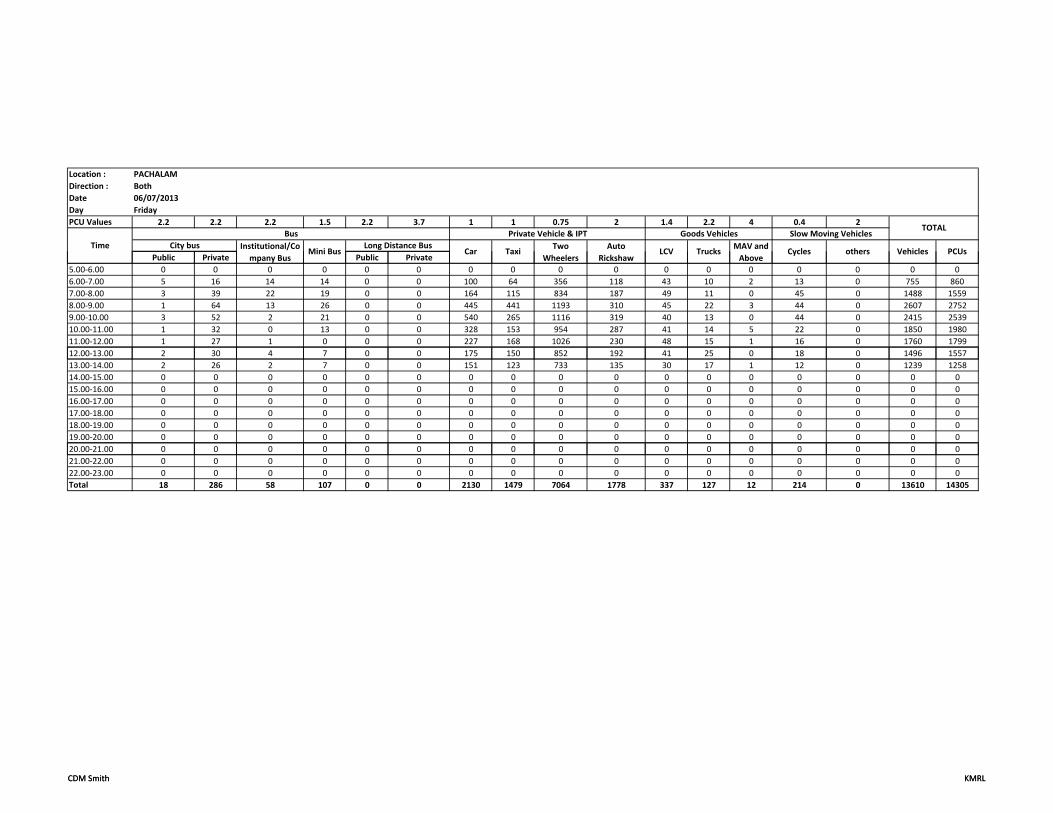
Location : PACHALAMDirection : BothDate 06/07/2013Day FridayPCU Values 2.2 2.2 2.2 1.5 2.2 3.7 1 1 0.75 2 1.4 2.2 4 0.4 2
Public Private Public Private
TOTALBus Private Vehicle & IPT Goods Vehicles Slow Moving Vehicles
TimeVehicles PCUsTrucks
MAV and Above
Cycles othersTaxiTwo
WheelersAuto
RickshawLCV
City bus Institutional/Company Bus
Mini BusLong Distance Bus
Car
CDM Smith KMRL
5.00‐6.00 0 0 0 0 0 0 0 0 0 0 0 0 0 0 0 0 06.00‐7.00 5 16 14 14 0 0 100 64 356 118 43 10 2 13 0 755 8607.00‐8.00 3 39 22 19 0 0 164 115 834 187 49 11 0 45 0 1488 15598.00‐9.00 1 64 13 26 0 0 445 441 1193 310 45 22 3 44 0 2607 27529.00‐10.00 3 52 2 21 0 0 540 265 1116 319 40 13 0 44 0 2415 253910.00‐11.00 1 32 0 13 0 0 328 153 954 287 41 14 5 22 0 1850 198011.00‐12.00 1 27 1 0 0 0 227 168 1026 230 48 15 1 16 0 1760 179912.00‐13.00 2 30 4 7 0 0 175 150 852 192 41 25 0 18 0 1496 1557
p y
13.00‐14.00 2 26 2 7 0 0 151 123 733 135 30 17 1 12 0 1239 125814.00‐15.00 0 0 0 0 0 0 0 0 0 0 0 0 0 0 0 0 015.00‐16.00 0 0 0 0 0 0 0 0 0 0 0 0 0 0 0 0 016.00‐17.00 0 0 0 0 0 0 0 0 0 0 0 0 0 0 0 0 017.00‐18.00 0 0 0 0 0 0 0 0 0 0 0 0 0 0 0 0 018.00‐19.00 0 0 0 0 0 0 0 0 0 0 0 0 0 0 0 0 019.00‐20.00 0 0 0 0 0 0 0 0 0 0 0 0 0 0 0 0 020.00‐21.00 0 0 0 0 0 0 0 0 0 0 0 0 0 0 0 0 00.00 .00 0 0 0 0 0 0 0 0 0 0 0 0 0 0 0 0 021.00‐22.00 0 0 0 0 0 0 0 0 0 0 0 0 0 0 0 0 022.00‐23.00 0 0 0 0 0 0 0 0 0 0 0 0 0 0 0 0 0Total 18 286 58 107 0 0 2130 1479 7064 1778 337 127 12 214 0 13610 14305
CDM Smith KMRL

Location : PALARIVATTOMDirection : BothDate 06/14/2013Day FridayPCU Values 2.2 2.2 2.2 1.5 2.2 3.7 1 1 0.75 2 1.4 2.2 4 0.4 2
Public Private Public PrivateLCV
City bus Institutional/Company Bus
Mini BusLong Distance Bus
Car
TOTALBus Private Vehicle & IPT Goods Vehicles Slow Moving Vehicles
TimeVehicles PCUsTrucks
MAV and Above
Cycles othersTaxiTwo
WheelersAuto
Rickshaw
CDM Smith KMRL
5.00‐6.00 0 0 0 0 0 0 0 0 0 0 0 0 0 0 0 0 06.00‐7.00 2 22 11 13 3 5 243 94 330 79 135 69 3 1 1 1011 12197.00‐8.00 4 42 22 19 7 8 460 153 729 162 99 70 4 11 3 1793 20268.00‐9.00 7 37 21 23 5 9 739 157 1711 249 59 129 11 18 1 3176 33199.00‐10.00 5 32 7 31 2 8 709 187 1500 330 90 102 2 13 1 3019 322410.00‐11.00 3 25 1 18 2 8 711 228 1502 274 108 72 7 5 0 2964 307811.00‐12.00 1 25 1 11 2 6 671 203 1181 256 90 73 3 10 0 2533 267712.00‐13.00 6 20 1 12 8 10 514 130 1021 139 81 85 8 10 3 2048 2162
p y
13.00‐14.00 10 20 3 16 4 5 435 118 921 83 77 47 6 8 4 1757 178014.00‐15.00 0 0 0 0 0 0 0 0 0 0 0 0 0 0 0 0 015.00‐16.00 0 0 0 0 0 0 0 0 0 0 0 0 0 0 0 0 016.00‐17.00 0 0 0 0 0 0 0 0 0 0 0 0 0 0 0 0 017.00‐18.00 0 0 0 0 0 0 0 0 0 0 0 0 0 0 0 0 018.00‐19.00 0 0 0 0 0 0 0 0 0 0 0 0 0 0 0 0 019.00‐20.00 0 0 0 0 0 0 0 0 0 0 0 0 0 0 0 0 020.00‐21.00 0 0 0 0 0 0 0 0 0 0 0 0 0 0 0 0 00.00 .00 0 0 0 0 0 0 0 0 0 0 0 0 0 0 0 0 021.00‐22.00 0 0 0 0 0 0 0 0 0 0 0 0 0 0 0 0 022.00‐23.00 0 0 0 0 0 0 0 0 0 0 0 0 0 0 0 0 0Total 38 223 67 143 33 59 4482 1270 8895 1572 739 647 44 76 13 18301 19485
CDM Smith KMRL

Location : THOPUMPADY TOLL BRIDGEDirection : BothDate 06/07/2013Day FridayPCU Values 2.2 2.2 2.2 1.5 2.2 3.7 1 1 0.75 2 2 3.7 4 0.4 2
Public Private Public Private
TOTALBus Private Vehicle & IPT Goods Vehicles Slow Moving Vehicles
TimeVehicles PCUsTrucks
MAV and Above
Cycles othersTaxiTwo
WheelersAuto
RickshawLCV
City bus Institutional/Company Bus
Mini BusLong Distance Bus
Car
CDM Smith KMRL
5.00‐6.00 0 0 0 0 0 0 0 0 0 0 0 0 0 0 0 0 06.00‐7.00 9 82 11 12 13 3 116 132 417 222 65 133 9 3 0 1227 19467.00‐8.00 25 113 13 13 12 1 313 161 860 269 116 231 10 4 0 2141 31678.00‐9.00 42 160 10 18 12 1 847 181 1420 268 140 252 7 4 0 3362 43959.00‐10.00 55 168 1 16 17 2 1050 161 1811 263 137 149 5 1 0 3836 450310.00‐11.00 40 174 2 15 11 0 879 139 1219 210 192 188 9 1 0 3079 399011.00‐12.00 30 75 1 8 12 2 885 102 618 166 136 181 8 0 0 2224 303512.00‐13.00 29 79 1 7 17 3 654 99 489 194 192 228 13 0 0 2005 3086
p y
13.00‐14.00 23 80 4 16 10 1 577 97 466 182 140 160 9 0 0 1765 258114.00‐15.00 0 0 0 0 0 0 0 0 0 0 0 0 0 0 0 0 015.00‐16.00 0 0 0 0 0 0 0 0 0 0 0 0 0 0 0 0 016.00‐17.00 0 0 0 0 0 0 0 0 0 0 0 0 0 0 0 0 017.00‐18.00 0 0 0 0 0 0 0 0 0 0 0 0 0 0 0 0 018.00‐19.00 0 0 0 0 0 0 0 0 0 0 0 0 0 0 0 0 019.00‐20.00 0 0 0 0 0 0 0 0 0 0 0 0 0 0 0 0 020.00‐21.00 0 0 0 0 0 0 0 0 0 0 0 0 0 0 0 0 00.00 .00 0 0 0 0 0 0 0 0 0 0 0 0 0 0 0 0 021.00‐22.00 0 0 0 0 0 0 0 0 0 0 0 0 0 0 0 0 022.00‐23.00 0 0 0 0 0 0 0 0 0 0 0 0 0 0 0 0 0Total 253 931 43 105 104 13 5321 1072 7300 1774 1118 1522 70 13 0 19639 26702
CDM Smith KMRL

Location : EDAPALLY FLY OVERDirection : BothDate 06/11/2013Day TuesdayPCU Values 2.2 2.2 2.2 1.5 2.2 3.7 1 1 0.75 2 2 2.2 4 0.4 2
Public Private Public PrivateLCV
City bus Institutional/Company Bus
Mini BusLong Distance Bus
Car
TOTALBus Private Vehicle & IPT Goods Vehicles Slow Moving Vehicles
TimeVehicles PCUsTrucks
MAV and Above
Cycles othersTaxiTwo
WheelersAuto
Rickshaw
CDM Smith KMRL
5.00‐6.00 0 0 0 0 0 0 0 0 0 0 0 0 0 0 0 0 06.00‐7.00 4 13 5 4 1 2 123 21 255 71 9 27 9 4 1 549 658.257.00‐8.00 3 27 16 13 5 9 222 67 767 148 27 29 10 6 0 1349 14858.00‐9.00 7 41 4 5 16 8 388 86 1085 148 59 54 10 11 0 1922 20529.00‐10.00 9 28 0 4 7 9 407 81 888 106 140 49 12 3 0 1743 193910.00‐11.00 8 15 0 3 4 8 330 74 560 96 159 56 15 4 0 1332 161211.00‐12.00 7 20 0 8 2 11 326 47 376 73 166 54 12 4 0 1106 141812.00‐13.00 7 16 1 10 2 9 313 97 489 71 71 52 16 8 0 1162 1348
p y
13.00‐14.00 9 19 2 7 5 6 278 68 350 43 71 44 11 7 2 922 109414.00‐15.00 0 0 0 0 0 0 26 4 13 5 12 2 0 0 0 62 7815.00‐16.00 0 0 0 0 0 0 0 0 0 0 0 0 0 0 0 0 016.00‐17.00 0 0 0 0 0 0 0 0 0 0 0 0 0 0 0 0 017.00‐18.00 0 0 0 0 0 0 0 0 0 0 0 0 0 0 0 0 018.00‐19.00 0 0 0 0 0 0 0 0 0 0 0 0 0 0 0 0 019.00‐20.00 0 0 0 0 0 0 0 0 0 0 0 0 0 0 0 0 020.00‐21.00 0 0 0 0 0 0 0 0 0 0 0 0 0 0 0 0 00.00 .00 0 0 0 0 0 0 0 0 0 0 0 0 0 0 0 0 021.00‐22.00 0 0 0 0 0 0 0 0 0 0 0 0 0 0 0 0 0Total 54 179 28 54 42 62 2413 545 4783 761 714 367 95 47 3 10147 11684
CDM Smith KMRL

ANNEXURE – 3 Zone List & OD Matrix
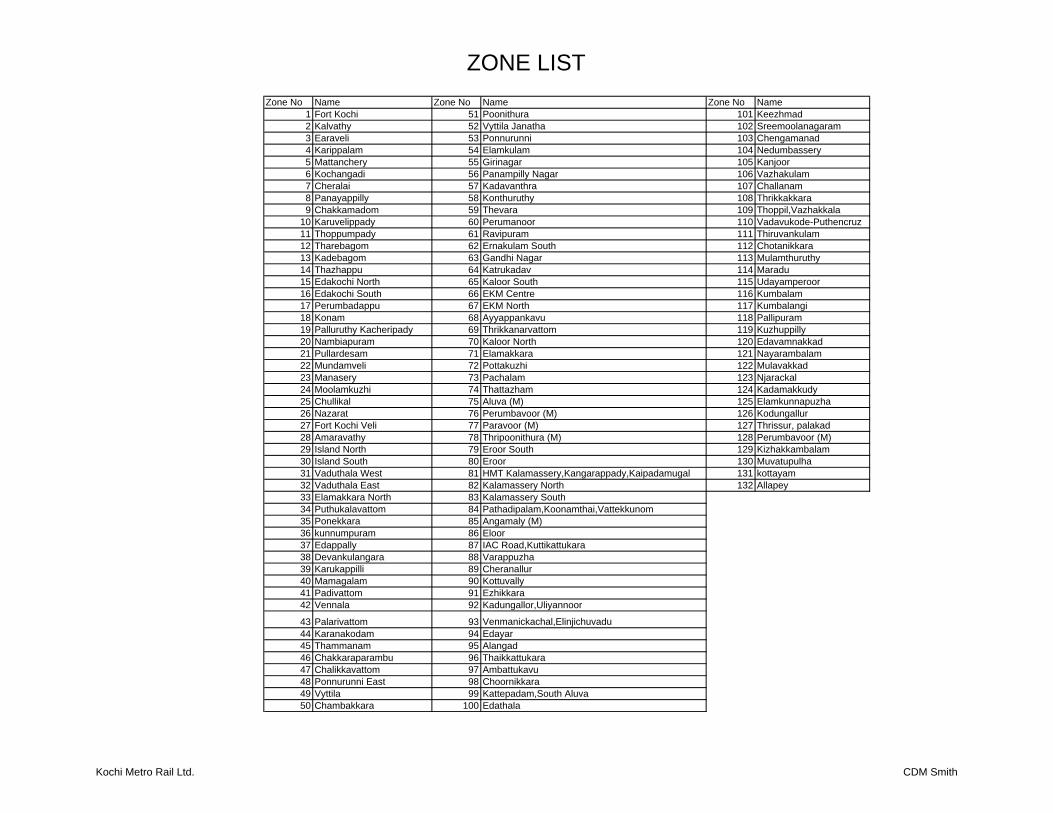
ZONE LIST
Zone No Name Zone No Name Zone No Name1 Fort Kochi 51 Poonithura 101 Keezhmad2 Kalvathy 52 Vyttila Janatha 102 Sreemoolanagaram3 Earaveli 53 Ponnurunni 103 Chengamanad4 Karippalam 54 Elamkulam 104 Nedumbassery5 Mattanchery 55 Girinagar 105 Kanjoor6 Kochangadi 56 Panampilly Nagar 106 Vazhakulam7 Cheralai 57 Kadavanthra 107 Challanam8 Panayappilly 58 Konthuruthy 108 Thrikkakkara9 Chakkamadom 59 Thevara 109 Thoppil,Vazhakkala
10 Karuvelippady 60 Perumanoor 110 Vadavukode-Puthencruz11 Thoppumpady 61 Ravipuram 111 Thiruvankulam12 Tharebagom 62 Ernakulam South 112 Chotanikkara13 Kadebagom 63 Gandhi Nagar 113 Mulamthuruthy14 Thazhappu 64 Katrukadav 114 Maradu15 Edakochi North 65 Kaloor South 115 Udayamperoor16 Edakochi South 66 EKM Centre 116 Kumbalam17 Perumbadappu 67 EKM North 117 Kumbalangi18 Konam 68 Ayyappankavu 118 Pallipuram19 Palluruthy Kacheripady 69 Thrikkanarvattom 119 Kuzhuppilly20 Nambiapuram 70 Kaloor North 120 Edavamnakkad21 Pullardesam 71 Elamakkara 121 Nayarambalam22 Mundamveli 72 Pottakuzhi 122 Mulavakkad23 Manasery 73 Pachalam 123 Njarackal24 Moolamkuzhi 74 Thattazham 124 Kadamakkudy25 Chullikal 75 Aluva (M) 125 Elamkunnapuzha26 Nazarat 76 Perumbavoor (M) 126 Kodungallur27 Fort Kochi Veli 77 Paravoor (M) 127 Thrissur, palakad28 Amaravathy 78 Thripoonithura (M) 128 Perumbavoor (M)29 Island North 79 Eroor South 129 Kizhakkambalam30 Island South 80 Eroor 130 Muvatupulha31 Vaduthala West 81 HMT Kalamassery,Kangarappady,Kaipadamugal 131 kottayam32 Vaduthala East 82 Kalamassery North 132 Allapey33 Elamakkara North 83 Kalamassery South34 Puthukalavattom 84 Pathadipalam,Koonamthai,Vattekkunom35 Ponekkara 85 Angamaly (M)36 kunnumpuram 86 Eloor37 Edappally 87 IAC Road,Kuttikattukara 38 Devankulangara 88 Varappuzha39 Karukappilli 89 Cheranallur40 Mamagalam 90 Kottuvally41 Padivattom 91 Ezhikkara42 Vennala 92 Kadungallor,Uliyannoor
43 Palarivattom 93 Venmanickachal,Elinjichuvadu44 Karanakodam 94 Edayar45 Thammanam 95 Alangad46 Chakkaraparambu 96 Thaikkattukara47 Chalikkavattom 97 Ambattukavu48 Ponnurunni East 98 Choornikkara49 Vyttila 99 Kattepadam,South Aluva50 Chambakkara 100 Edathala
Kochi Metro Rail Ltd. CDM Smith
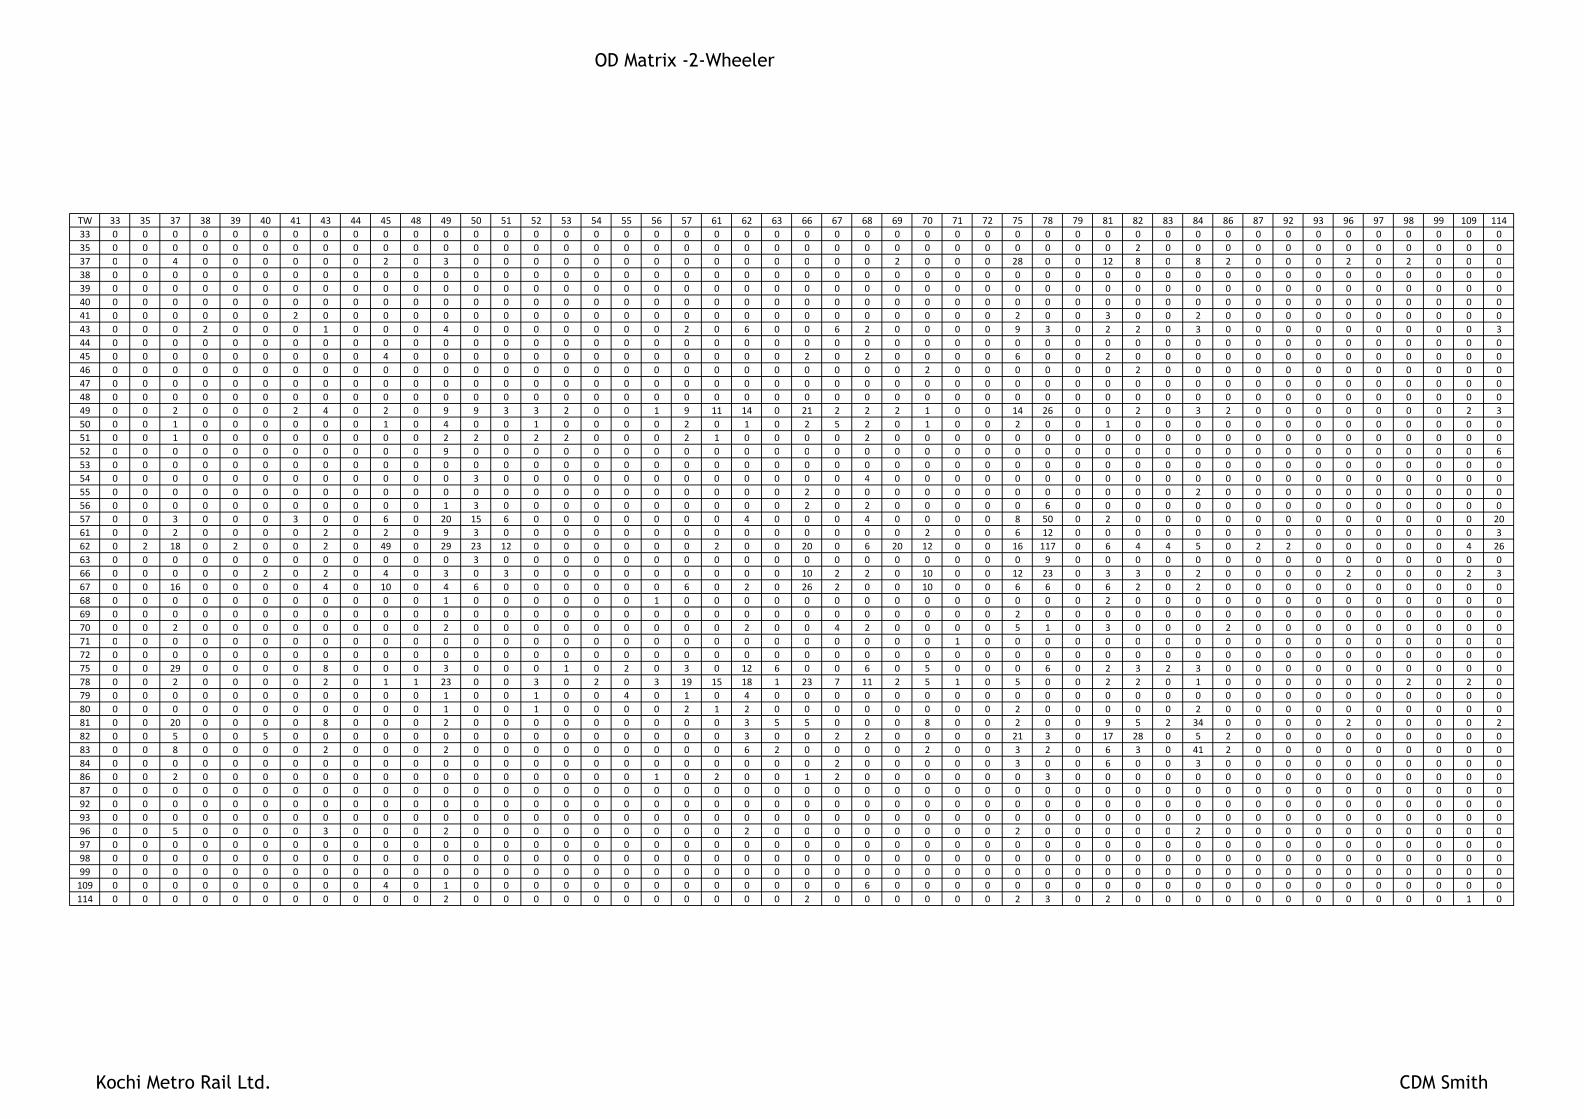
TW 33 35 37 38 39 40 41 43 44 45 48 49 50 51 52 53 54 55 56 57 61 62 63 66 67 68 69 70 71 72 75 78 79 81 82 83 84 86 87 92 93 96 97 98 99 109 11433 0 0 0 0 0 0 0 0 0 0 0 0 0 0 0 0 0 0 0 0 0 0 0 0 0 0 0 0 0 0 0 0 0 0 0 0 0 0 0 0 0 0 0 0 0 0 035 0 0 0 0 0 0 0 0 0 0 0 0 0 0 0 0 0 0 0 0 0 0 0 0 0 0 0 0 0 0 0 0 0 0 2 0 0 0 0 0 0 0 0 0 0 0 037 0 0 4 0 0 0 0 0 0 2 0 3 0 0 0 0 0 0 0 0 0 0 0 0 0 0 2 0 0 0 28 0 0 12 8 0 8 2 0 0 0 2 0 2 0 0 037 0 0 4 0 0 0 0 0 0 2 0 3 0 0 0 0 0 0 0 0 0 0 0 0 0 0 2 0 0 0 28 0 0 12 8 0 8 2 0 0 0 2 0 2 0 0 038 0 0 0 0 0 0 0 0 0 0 0 0 0 0 0 0 0 0 0 0 0 0 0 0 0 0 0 0 0 0 0 0 0 0 0 0 0 0 0 0 0 0 0 0 0 0 039 0 0 0 0 0 0 0 0 0 0 0 0 0 0 0 0 0 0 0 0 0 0 0 0 0 0 0 0 0 0 0 0 0 0 0 0 0 0 0 0 0 0 0 0 0 0 040 0 0 0 0 0 0 0 0 0 0 0 0 0 0 0 0 0 0 0 0 0 0 0 0 0 0 0 0 0 0 0 0 0 0 0 0 0 0 0 0 0 0 0 0 0 0 041 0 0 0 0 0 0 2 0 0 0 0 0 0 0 0 0 0 0 0 0 0 0 0 0 0 0 0 0 0 0 2 0 0 3 0 0 2 0 0 0 0 0 0 0 0 0 043 0 0 0 2 0 0 0 1 0 0 0 4 0 0 0 0 0 0 0 2 0 6 0 0 6 2 0 0 0 0 9 3 0 2 2 0 3 0 0 0 0 0 0 0 0 0 344 0 0 0 0 0 0 0 0 0 0 0 0 0 0 0 0 0 0 0 0 0 0 0 0 0 0 0 0 0 0 0 0 0 0 0 0 0 0 0 0 0 0 0 0 0 0 045 0 0 0 0 0 0 0 0 0 4 0 0 0 0 0 0 0 0 0 0 0 0 0 2 0 2 0 0 0 0 6 0 0 2 0 0 0 0 0 0 0 0 0 0 0 0 046 0 0 0 0 0 0 0 0 0 0 0 0 0 0 0 0 0 0 0 0 0 0 0 0 0 0 0 2 0 0 0 0 0 0 2 0 0 0 0 0 0 0 0 0 0 0 047 0 0 0 0 0 0 0 0 0 0 0 0 0 0 0 0 0 0 0 0 0 0 0 0 0 0 0 0 0 0 0 0 0 0 0 0 0 0 0 0 0 0 0 0 0 0 048 0 0 0 0 0 0 0 0 0 0 0 0 0 0 0 0 0 0 0 0 0 0 0 0 0 0 0 0 0 0 0 0 0 0 0 0 0 0 0 0 0 0 0 0 0 0 049 0 0 2 0 0 0 2 4 0 2 0 9 9 3 3 2 0 0 1 9 11 14 0 21 2 2 2 1 0 0 14 26 0 0 2 0 3 2 0 0 0 0 0 0 0 2 350 0 0 1 0 0 0 0 0 0 1 0 4 0 0 1 0 0 0 0 2 0 1 0 2 5 2 0 1 0 0 2 0 0 1 0 0 0 0 0 0 0 0 0 0 0 0 051 0 0 1 0 0 0 0 0 0 0 0 2 2 0 2 2 0 0 0 2 1 0 0 0 0 2 0 0 0 0 0 0 0 0 0 0 0 0 0 0 0 0 0 0 0 0 052 0 0 0 0 0 0 0 0 0 0 0 9 0 0 0 0 0 0 0 0 0 0 0 0 0 0 0 0 0 0 0 0 0 0 0 0 0 0 0 0 0 0 0 0 0 0 652 0 0 0 0 0 0 0 0 0 0 0 9 0 0 0 0 0 0 0 0 0 0 0 0 0 0 0 0 0 0 0 0 0 0 0 0 0 0 0 0 0 0 0 0 0 0 653 0 0 0 0 0 0 0 0 0 0 0 0 0 0 0 0 0 0 0 0 0 0 0 0 0 0 0 0 0 0 0 0 0 0 0 0 0 0 0 0 0 0 0 0 0 0 054 0 0 0 0 0 0 0 0 0 0 0 0 3 0 0 0 0 0 0 0 0 0 0 0 0 4 0 0 0 0 0 0 0 0 0 0 0 0 0 0 0 0 0 0 0 0 055 0 0 0 0 0 0 0 0 0 0 0 0 0 0 0 0 0 0 0 0 0 0 0 2 0 0 0 0 0 0 0 0 0 0 0 0 2 0 0 0 0 0 0 0 0 0 056 0 0 0 0 0 0 0 0 0 0 0 1 3 0 0 0 0 0 0 0 0 0 0 2 0 2 0 0 0 0 0 6 0 0 0 0 0 0 0 0 0 0 0 0 0 0 057 0 0 3 0 0 0 3 0 0 6 0 20 15 6 0 0 0 0 0 0 0 4 0 0 0 4 0 0 0 0 8 50 0 2 0 0 0 0 0 0 0 0 0 0 0 0 2061 0 0 2 0 0 0 0 2 0 2 0 9 3 0 0 0 0 0 0 0 0 0 0 0 0 0 0 2 0 0 6 12 0 0 0 0 0 0 0 0 0 0 0 0 0 0 362 0 2 18 0 2 0 0 2 0 49 0 29 23 12 0 0 0 0 0 0 2 0 0 20 0 6 20 12 0 0 16 117 0 6 4 4 5 0 2 2 0 0 0 0 0 4 2663 0 0 0 0 0 0 0 0 0 0 0 0 3 0 0 0 0 0 0 0 0 0 0 0 0 0 0 0 0 0 0 9 0 0 0 0 0 0 0 0 0 0 0 0 0 0 066 0 0 0 0 0 2 0 2 0 4 0 3 0 3 0 0 0 0 0 0 0 0 0 10 2 2 0 10 0 0 12 23 0 3 3 0 2 0 0 0 0 2 0 0 0 2 367 0 0 16 0 0 0 0 4 0 10 0 4 6 0 0 0 0 0 0 6 0 2 0 26 2 0 0 10 0 0 6 6 0 6 2 0 2 0 0 0 0 0 0 0 0 0 068 0 0 0 0 0 0 0 0 0 0 0 1 0 0 0 0 0 0 1 0 0 0 0 0 0 0 0 0 0 0 0 0 0 2 0 0 0 0 0 0 0 0 0 0 0 0 069 0 0 0 0 0 0 0 0 0 0 0 0 0 0 0 0 0 0 0 0 0 0 0 0 0 0 0 0 0 0 2 0 0 0 0 0 0 0 0 0 0 0 0 0 0 0 070 0 0 2 0 0 0 0 0 0 0 0 2 0 0 0 0 0 0 0 0 0 2 0 0 4 2 0 0 0 0 5 1 0 3 0 0 0 2 0 0 0 0 0 0 0 0 071 0 0 0 0 0 0 0 0 0 0 0 0 0 0 0 0 0 0 0 0 0 0 0 0 0 0 0 0 1 0 0 0 0 0 0 0 0 0 0 0 0 0 0 0 0 0 071 0 0 0 0 0 0 0 0 0 0 0 0 0 0 0 0 0 0 0 0 0 0 0 0 0 0 0 0 1 0 0 0 0 0 0 0 0 0 0 0 0 0 0 0 0 0 072 0 0 0 0 0 0 0 0 0 0 0 0 0 0 0 0 0 0 0 0 0 0 0 0 0 0 0 0 0 0 0 0 0 0 0 0 0 0 0 0 0 0 0 0 0 0 075 0 0 29 0 0 0 0 8 0 0 0 3 0 0 0 1 0 2 0 3 0 12 6 0 0 6 0 5 0 0 0 6 0 2 3 2 3 0 0 0 0 0 0 0 0 0 078 0 0 2 0 0 0 0 2 0 1 1 23 0 0 3 0 2 0 3 19 15 18 1 23 7 11 2 5 1 0 5 0 0 2 2 0 1 0 0 0 0 0 0 2 0 2 079 0 0 0 0 0 0 0 0 0 0 0 1 0 0 1 0 0 4 0 1 0 4 0 0 0 0 0 0 0 0 0 0 0 0 0 0 0 0 0 0 0 0 0 0 0 0 080 0 0 0 0 0 0 0 0 0 0 0 1 0 0 1 0 0 0 0 2 1 2 0 0 0 0 0 0 0 0 2 0 0 0 0 0 2 0 0 0 0 0 0 0 0 0 081 0 0 20 0 0 0 0 8 0 0 0 2 0 0 0 0 0 0 0 0 0 3 5 5 0 0 0 8 0 0 2 0 0 9 5 2 34 0 0 0 0 2 0 0 0 0 282 0 0 5 0 0 5 0 0 0 0 0 0 0 0 0 0 0 0 0 0 0 3 0 0 2 2 0 0 0 0 21 3 0 17 28 0 5 2 0 0 0 0 0 0 0 0 083 0 0 8 0 0 0 0 2 0 0 0 2 0 0 0 0 0 0 0 0 0 6 2 0 0 0 0 2 0 0 3 2 0 6 3 0 41 2 0 0 0 0 0 0 0 0 084 0 0 0 0 0 0 0 0 0 0 0 0 0 0 0 0 0 0 0 0 0 0 0 0 2 0 0 0 0 0 3 0 0 6 0 0 3 0 0 0 0 0 0 0 0 0 086 0 0 2 0 0 0 0 0 0 0 0 0 0 0 0 0 0 0 1 0 2 0 0 1 2 0 0 0 0 0 0 3 0 0 0 0 0 0 0 0 0 0 0 0 0 0 087 0 0 0 0 0 0 0 0 0 0 0 0 0 0 0 0 0 0 0 0 0 0 0 0 0 0 0 0 0 0 0 0 0 0 0 0 0 0 0 0 0 0 0 0 0 0 092 0 0 0 0 0 0 0 0 0 0 0 0 0 0 0 0 0 0 0 0 0 0 0 0 0 0 0 0 0 0 0 0 0 0 0 0 0 0 0 0 0 0 0 0 0 0 093 0 0 0 0 0 0 0 0 0 0 0 0 0 0 0 0 0 0 0 0 0 0 0 0 0 0 0 0 0 0 0 0 0 0 0 0 0 0 0 0 0 0 0 0 0 0 096 0 0 5 0 0 0 0 3 0 0 0 2 0 0 0 0 0 0 0 0 0 2 0 0 0 0 0 0 0 0 2 0 0 0 0 0 2 0 0 0 0 0 0 0 0 0 096 0 0 5 0 0 0 0 3 0 0 0 2 0 0 0 0 0 0 0 0 0 2 0 0 0 0 0 0 0 0 2 0 0 0 0 0 2 0 0 0 0 0 0 0 0 0 097 0 0 0 0 0 0 0 0 0 0 0 0 0 0 0 0 0 0 0 0 0 0 0 0 0 0 0 0 0 0 0 0 0 0 0 0 0 0 0 0 0 0 0 0 0 0 098 0 0 0 0 0 0 0 0 0 0 0 0 0 0 0 0 0 0 0 0 0 0 0 0 0 0 0 0 0 0 0 0 0 0 0 0 0 0 0 0 0 0 0 0 0 0 099 0 0 0 0 0 0 0 0 0 0 0 0 0 0 0 0 0 0 0 0 0 0 0 0 0 0 0 0 0 0 0 0 0 0 0 0 0 0 0 0 0 0 0 0 0 0 0109 0 0 0 0 0 0 0 0 0 4 0 1 0 0 0 0 0 0 0 0 0 0 0 0 0 6 0 0 0 0 0 0 0 0 0 0 0 0 0 0 0 0 0 0 0 0 0114 0 0 0 0 0 0 0 0 0 0 0 2 0 0 0 0 0 0 0 0 0 0 0 2 0 0 0 0 0 0 2 3 0 2 0 0 0 0 0 0 0 0 0 0 0 1 0
OD Matrix -2-Wheeler
Kochi Metro Rail Ltd. CDM Smith

Auto 33 35 37 38 39 40 41 43 44 45 48 49 50 51 52 53 54 55 56 57 61 62 63 66 67 68 69 70 71 72 75 78 79 81 82 83 84 86 87 92 93 96 97 98 99 109 11433 0 0 0 0 0 0 0 0 0 0 0 0 0 0 0 0 0 0 0 0 0 0 0 0 0 0 0 0 0 0 0 0 0 0 0 0 0 0 0 0 0 0 0 0 0 0 035 0 0 0 0 0 0 0 0 0 0 0 0 0 0 0 0 0 0 0 0 0 0 0 0 0 0 0 0 0 0 0 0 0 0 0 0 4 0 0 0 0 0 0 0 0 0 037 0 0 0 0 0 0 0 0 0 0 0 0 0 0 0 0 0 0 0 0 0 0 0 0 0 0 0 0 0 0 4 0 0 4 0 0 4 0 0 0 0 0 0 0 0 0 037 0 0 0 0 0 0 0 0 0 0 0 0 0 0 0 0 0 0 0 0 0 0 0 0 0 0 0 0 0 0 4 0 0 4 0 0 4 0 0 0 0 0 0 0 0 0 038 0 0 0 0 0 0 0 0 0 0 0 0 0 0 0 0 0 0 0 0 0 0 0 0 0 6 0 0 0 0 0 0 0 0 0 0 0 0 0 0 0 0 0 0 0 0 039 0 0 0 0 0 0 0 0 0 0 0 0 0 0 0 0 0 0 0 0 0 0 0 0 0 0 0 0 0 0 0 0 0 0 0 0 0 0 0 0 0 0 0 0 0 0 040 0 0 0 0 0 0 0 0 0 0 0 0 0 0 0 0 0 0 0 0 0 0 0 0 0 0 0 0 0 0 0 0 0 0 0 0 0 0 0 0 0 0 0 0 0 0 041 0 0 0 0 0 0 0 0 0 0 0 0 0 0 0 0 0 0 0 0 0 0 0 0 0 0 0 0 0 0 0 0 0 0 0 0 0 0 0 0 0 0 0 0 0 0 043 0 0 0 0 0 0 0 4 0 0 0 0 0 0 0 0 0 0 0 0 0 0 0 0 0 0 0 0 0 0 4 0 0 0 0 0 0 0 0 0 0 0 0 0 0 0 044 0 0 0 0 0 0 0 0 0 0 0 0 0 0 0 0 0 0 0 0 0 0 0 0 0 0 0 0 0 0 0 0 0 0 0 0 0 0 0 0 0 0 0 0 0 0 045 0 0 0 0 0 0 0 0 0 0 0 0 0 0 0 0 0 0 0 0 0 0 0 0 0 0 0 0 0 0 0 0 0 0 0 0 0 0 0 0 0 0 0 0 0 0 046 0 0 0 0 0 0 0 0 0 0 0 0 0 0 0 0 0 0 0 0 0 0 0 0 0 0 0 0 0 0 0 0 0 0 0 0 0 0 0 0 0 0 0 0 0 0 047 0 0 0 0 0 0 0 0 0 0 0 0 0 0 0 0 0 0 0 0 0 0 0 0 0 0 0 0 0 0 0 0 0 0 0 0 0 0 0 0 0 0 0 0 0 0 048 0 0 0 0 0 0 0 0 0 0 0 0 0 0 0 0 0 0 0 0 0 0 0 0 0 0 0 0 0 0 0 0 0 0 0 0 0 0 0 0 0 0 0 0 0 0 049 0 0 0 0 0 0 0 0 0 0 0 11 9 0 0 0 0 0 0 11 11 6 0 0 0 0 0 0 0 0 0 7 0 0 0 0 0 0 0 0 0 0 0 0 0 0 050 0 0 0 0 0 0 0 0 0 0 0 22 0 0 0 0 0 0 0 0 0 0 0 0 0 0 0 0 0 0 4 0 0 0 0 0 0 0 0 0 0 0 0 0 0 0 051 0 0 0 0 0 0 0 0 0 0 0 0 0 0 0 0 0 0 0 0 0 0 0 0 0 0 0 0 0 0 0 0 0 0 0 0 0 0 0 0 0 0 0 0 0 0 052 0 0 0 0 0 0 0 0 0 0 0 0 0 0 0 0 0 0 0 0 0 0 0 0 0 0 0 0 0 0 0 2 0 0 0 0 0 0 0 0 0 0 0 0 0 0 052 0 0 0 0 0 0 0 0 0 0 0 0 0 0 0 0 0 0 0 0 0 0 0 0 0 0 0 0 0 0 0 2 0 0 0 0 0 0 0 0 0 0 0 0 0 0 053 0 0 0 0 0 0 0 0 0 0 0 0 0 0 0 0 0 0 0 0 0 0 0 0 0 0 0 0 0 0 0 0 0 0 0 0 0 0 0 0 0 0 0 0 0 0 054 0 0 0 0 0 0 0 0 0 0 0 0 0 0 0 0 0 0 0 0 0 0 0 0 0 0 0 0 0 0 0 0 0 0 0 0 0 0 0 0 0 0 0 0 0 0 055 0 0 0 0 0 0 0 0 0 0 0 0 0 0 0 0 0 0 0 0 0 0 0 0 0 0 0 0 0 0 0 0 0 0 0 0 0 0 0 0 0 0 0 0 0 0 056 0 0 0 0 0 0 0 0 0 6 0 0 0 0 0 0 0 0 0 0 0 0 0 6 0 0 0 6 0 0 0 0 0 0 0 0 0 0 0 0 0 0 0 0 0 0 057 0 0 0 0 0 0 0 0 0 0 0 4 0 2 0 0 0 0 0 0 0 0 0 0 0 0 0 0 0 0 0 9 0 0 0 0 0 0 0 0 0 0 0 0 0 6 261 0 0 0 0 0 0 0 2 0 0 0 0 0 0 0 0 0 0 0 0 0 0 0 0 0 0 0 0 0 0 0 0 0 0 2 0 0 0 0 0 0 0 0 0 0 0 062 0 0 12 0 0 0 0 0 0 72 0 7 9 0 0 0 0 0 0 0 0 0 0 6 0 24 0 18 0 0 4 25 0 0 0 0 4 0 0 0 0 0 0 0 0 0 263 0 0 0 0 0 0 0 0 0 0 0 0 0 0 0 0 0 0 0 0 0 0 0 0 0 0 0 0 0 0 0 0 0 0 0 0 0 0 0 0 0 0 0 0 0 0 066 0 0 6 0 0 0 0 6 0 42 0 0 0 0 0 0 0 0 0 0 0 0 0 6 0 0 0 0 0 0 4 2 0 0 0 0 0 0 0 0 0 0 0 0 0 0 067 0 0 0 0 0 0 0 0 0 0 0 2 0 0 0 0 0 0 0 0 0 0 0 30 0 0 0 6 0 0 6 0 0 0 0 0 0 0 0 0 0 0 0 0 0 0 068 0 0 0 0 0 0 0 0 0 0 0 0 0 0 0 0 0 0 0 0 0 0 0 0 0 0 0 0 0 0 0 0 0 0 0 0 0 0 0 0 0 0 0 0 0 0 069 0 0 0 0 0 0 0 0 0 0 0 0 0 0 0 0 0 0 0 0 0 0 0 0 0 0 0 0 0 0 0 0 0 0 0 0 0 0 0 0 0 0 0 0 0 0 070 0 0 0 0 0 0 0 0 0 0 0 0 0 0 0 0 0 0 0 0 0 0 0 0 6 0 0 0 0 0 0 0 0 0 0 0 4 0 0 0 0 0 0 0 0 0 071 0 0 0 0 0 0 0 0 0 0 0 0 0 0 0 0 0 0 0 0 0 0 0 0 0 0 0 0 0 0 0 0 0 0 0 0 0 0 0 0 0 0 0 0 0 0 071 0 0 0 0 0 0 0 0 0 0 0 0 0 0 0 0 0 0 0 0 0 0 0 0 0 0 0 0 0 0 0 0 0 0 0 0 0 0 0 0 0 0 0 0 0 0 072 0 0 0 0 0 0 0 0 0 0 0 0 0 0 0 0 0 0 0 0 0 0 0 0 0 0 0 0 0 0 0 0 0 0 0 0 0 0 0 0 0 0 0 0 0 0 075 0 0 27 0 0 0 0 4 0 0 0 0 0 0 0 0 0 0 0 0 0 0 0 0 0 0 0 4 0 0 0 0 0 4 0 0 0 0 0 0 0 0 0 0 0 0 078 0 0 0 0 0 0 0 0 0 0 0 0 0 0 0 0 0 0 0 22 0 0 0 33 0 0 0 0 0 0 0 0 0 0 0 0 0 0 0 0 0 0 0 0 0 0 079 0 0 0 0 0 0 0 0 0 0 0 0 0 0 0 0 0 0 0 0 0 0 0 0 0 0 0 0 0 0 0 0 0 0 0 0 0 0 0 0 0 0 0 0 0 0 080 0 0 0 0 0 0 0 0 0 0 0 0 0 0 0 0 11 0 0 0 0 0 0 0 11 0 0 0 0 0 0 2 0 0 0 0 0 0 0 0 0 0 0 0 0 0 081 0 0 9 0 0 0 0 0 0 0 0 0 0 0 0 0 0 0 0 0 4 0 0 4 0 0 0 0 0 0 0 0 0 0 0 0 0 0 0 0 0 0 0 0 0 0 082 0 0 0 0 0 0 0 0 0 0 0 0 0 0 0 0 0 0 0 0 0 0 0 0 0 0 0 0 0 0 0 0 0 0 0 0 0 0 0 0 0 0 0 0 0 0 083 0 0 18 0 0 0 0 0 0 0 0 4 0 0 0 0 0 0 0 0 0 0 0 0 0 0 0 0 0 0 0 0 0 0 0 0 0 0 0 0 0 0 0 0 0 0 084 0 0 0 0 0 0 0 0 0 0 0 0 0 0 0 0 0 0 0 0 0 0 0 0 0 0 0 0 0 0 0 0 0 4 4 0 0 0 0 0 0 4 0 0 0 0 086 0 0 0 0 0 0 0 0 0 0 0 0 0 0 0 0 0 0 0 0 0 6 0 0 0 0 0 0 0 0 0 0 0 0 0 0 0 0 0 0 0 0 0 0 0 0 087 0 0 0 0 0 0 0 0 0 0 0 0 0 0 0 0 0 0 0 0 0 0 0 0 0 0 0 0 0 0 0 0 0 0 0 0 0 0 0 0 0 0 0 0 0 0 092 0 0 0 0 0 0 0 0 0 0 0 0 0 0 0 0 0 0 0 0 0 0 0 0 0 0 0 0 0 0 0 0 0 0 0 0 0 0 0 0 0 0 0 0 0 0 093 0 0 0 0 0 0 0 0 0 0 0 0 0 0 0 0 0 0 0 0 0 0 0 0 0 0 0 0 0 0 0 0 0 0 0 0 0 0 0 0 0 0 0 0 0 0 096 0 0 18 0 0 0 0 4 0 0 0 0 0 0 0 0 0 0 0 0 0 0 0 0 0 0 0 0 0 0 0 0 0 0 0 0 0 0 0 0 0 0 0 0 0 0 096 0 0 18 0 0 0 0 4 0 0 0 0 0 0 0 0 0 0 0 0 0 0 0 0 0 0 0 0 0 0 0 0 0 0 0 0 0 0 0 0 0 0 0 0 0 0 097 0 0 0 0 0 0 0 0 0 0 0 0 0 0 0 0 0 0 0 0 0 0 0 0 0 0 0 0 0 0 0 0 0 0 0 0 0 0 0 0 0 0 0 0 0 0 098 0 0 0 0 0 0 0 0 0 0 0 0 0 0 0 0 0 0 0 0 0 0 0 0 0 0 0 0 0 0 0 0 0 0 0 0 0 0 0 0 0 0 0 0 0 0 099 0 0 0 0 0 0 0 0 0 0 0 0 0 0 0 0 0 0 0 0 0 0 0 0 0 0 0 0 0 0 0 0 0 0 0 0 0 0 0 0 0 0 0 0 0 0 0109 0 0 6 0 0 0 0 0 0 0 0 0 0 0 0 0 0 0 0 0 0 0 0 0 0 18 0 0 0 0 0 0 0 0 0 0 0 0 0 0 0 0 0 0 0 0 0114 0 0 0 0 0 0 0 0 0 0 0 0 0 0 0 0 0 0 0 0 0 0 0 0 0 0 0 0 0 0 0 0 0 0 0 0 0 0 0 0 0 0 0 0 0 0 0
OD Matrix - 3-Wheeler
Kochi Metro Rail Ltd. CDM Smith

CAR 33 35 37 38 39 40 41 43 44 45 48 49 50 51 52 53 54 55 56 57 61 62 63 66 67 68 69 70 71 72 75 78 79 81 82 83 84 86 87 92 93 96 97 98 99 109 11433 0 0 0 0 0 0 0 0 0 0 0 0 0 0 0 0 0 0 0 0 0 0 0 0 0 0 0 0 0 0 0 0 0 0 0 0 0 0 0 0 0 0 0 0 0 0 035 0 0 0 0 0 0 0 0 0 0 0 0 0 0 0 0 0 0 0 0 0 0 0 0 0 0 0 0 0 0 0 0 0 0 0 0 0 0 0 0 0 0 0 0 0 0 037 0 0 0 0 0 0 0 0 0 0 0 0 0 0 0 0 0 0 0 0 0 0 0 0 0 0 0 0 0 0 0 0 0 0 0 0 0 0 0 0 0 0 0 0 0 0 037 0 0 0 0 0 0 0 0 0 0 0 0 0 0 0 0 0 0 0 0 0 0 0 0 0 0 0 0 0 0 0 0 0 0 0 0 0 0 0 0 0 0 0 0 0 0 038 0 0 0 0 0 0 0 0 0 0 0 0 0 0 0 0 0 0 0 0 0 0 0 0 0 0 0 0 0 0 0 0 0 0 0 0 0 0 0 0 0 0 0 0 0 0 039 0 0 0 0 0 0 0 0 0 0 0 0 0 0 0 0 0 0 0 0 0 0 0 0 0 0 0 0 0 0 0 0 0 0 0 0 0 0 0 0 0 0 0 0 0 0 040 0 0 0 0 0 0 0 0 0 0 0 0 0 0 0 0 0 0 0 0 0 0 0 0 0 0 0 0 0 0 0 0 0 0 0 0 0 0 0 0 0 0 0 0 0 0 041 0 0 0 0 0 0 0 0 0 0 0 0 0 0 0 0 0 0 0 0 0 0 0 0 0 0 0 0 0 0 0 0 0 0 0 0 0 0 0 0 0 0 0 0 0 0 043 0 0 0 0 0 0 0 0 0 0 0 0 0 0 0 0 0 0 0 0 0 0 0 0 0 0 0 0 0 0 0 0 0 0 0 0 0 0 0 0 0 0 0 0 0 0 044 0 0 0 0 0 0 0 0 0 0 0 0 0 0 0 0 0 0 0 0 0 0 0 0 0 0 0 0 0 0 0 0 0 0 0 0 0 0 0 0 0 0 0 0 0 0 045 0 0 0 0 0 0 0 0 0 0 0 0 0 0 0 0 0 0 0 0 0 0 0 0 0 0 0 0 0 0 0 0 0 0 0 0 0 0 0 0 0 0 0 0 0 0 046 0 0 0 0 0 0 0 0 0 0 0 0 0 0 0 0 0 0 0 0 0 0 0 0 0 0 0 0 0 0 0 0 0 0 0 0 0 0 0 0 0 0 0 0 0 0 047 0 0 0 0 0 0 0 0 0 0 0 0 0 0 0 0 0 0 0 0 0 0 0 0 0 0 0 0 0 0 0 0 0 0 0 0 0 0 0 0 0 0 0 0 0 0 048 0 0 0 0 0 0 0 0 0 0 0 0 0 0 0 0 0 0 0 0 0 0 0 0 0 0 0 0 0 0 0 0 0 0 0 0 0 0 0 0 0 0 0 0 0 0 049 0 0 0 0 0 0 0 0 0 0 0 0 0 0 0 0 0 0 0 0 0 0 0 0 0 0 0 0 0 0 0 0 0 0 0 0 0 0 0 0 0 0 0 0 0 0 050 0 0 0 0 0 0 0 0 0 0 0 0 0 0 0 0 0 0 0 0 0 0 0 0 0 0 0 0 0 0 0 0 0 0 0 0 0 0 0 0 0 0 0 0 0 0 051 0 0 0 0 0 0 0 0 0 0 0 0 0 0 0 0 0 0 0 0 0 0 0 0 0 0 0 0 0 0 0 0 0 0 0 0 0 0 0 0 0 0 0 0 0 0 052 0 0 0 0 0 0 0 0 0 0 0 0 0 0 0 0 0 0 0 0 0 0 0 0 0 0 0 0 0 0 0 0 0 0 0 0 0 0 0 0 0 0 0 0 0 0 052 0 0 0 0 0 0 0 0 0 0 0 0 0 0 0 0 0 0 0 0 0 0 0 0 0 0 0 0 0 0 0 0 0 0 0 0 0 0 0 0 0 0 0 0 0 0 053 0 0 0 0 0 0 0 0 0 0 0 0 0 0 0 0 0 0 0 0 0 0 0 0 0 0 0 0 0 0 0 0 0 0 0 0 0 0 0 0 0 0 0 0 0 0 054 0 0 0 0 0 0 0 0 0 0 0 0 0 0 0 0 0 0 0 0 0 0 0 0 0 0 0 0 0 0 0 0 0 0 0 0 0 0 0 0 0 0 0 0 0 0 055 0 0 0 0 0 0 0 0 0 0 0 0 0 0 0 0 0 0 0 0 0 0 0 0 0 0 0 0 0 0 0 0 0 0 0 0 0 0 0 0 0 0 0 0 0 0 056 0 0 0 0 0 0 0 0 0 0 0 0 0 0 0 0 0 0 0 0 0 0 0 0 0 0 0 0 0 0 0 0 0 0 0 0 0 0 0 0 0 0 0 0 0 0 057 0 0 0 0 0 0 0 0 0 0 0 0 0 0 0 0 0 0 0 0 0 0 0 0 0 0 0 0 0 0 0 0 0 0 0 0 0 0 0 0 0 0 0 0 0 0 061 0 0 0 0 0 0 0 0 0 0 0 0 0 0 0 0 0 0 0 0 0 0 0 0 0 0 0 0 0 0 0 0 0 0 0 0 0 0 0 0 0 0 0 0 0 0 062 0 0 0 0 0 0 0 0 0 1 0 0 0 0 0 0 0 0 0 0 0 0 0 1 0 0 0 0 0 0 1 0 0 0 0 0 0 0 0 0 0 0 0 0 0 0 063 0 0 0 0 0 0 0 0 0 0 0 0 0 0 0 0 0 0 0 0 0 0 0 0 0 0 0 0 0 0 0 0 0 0 0 0 0 0 0 0 0 0 0 0 0 0 066 0 0 0 0 0 0 0 0 0 0 0 0 0 0 0 0 0 0 0 0 0 0 0 0 0 0 0 0 0 0 0 0 0 0 0 0 0 0 0 0 0 0 0 0 0 0 067 0 0 0 0 0 0 0 0 0 0 0 0 0 0 0 0 0 0 0 0 0 0 0 0 0 0 0 0 0 0 0 0 0 0 0 0 0 0 0 0 0 0 0 0 0 0 068 0 0 0 0 0 0 0 0 0 0 0 0 0 0 0 0 0 0 0 0 0 0 0 0 0 0 0 0 0 0 0 0 0 0 0 0 0 0 0 0 0 0 0 0 0 0 069 0 0 0 0 0 0 0 0 0 0 0 0 0 0 0 0 0 0 0 0 0 0 0 0 0 0 0 0 0 0 0 0 0 0 0 0 0 0 0 0 0 0 0 0 0 0 070 0 0 0 0 0 0 0 0 0 0 0 0 0 0 0 0 0 0 0 0 0 0 0 0 0 0 0 0 0 0 0 0 0 0 0 0 0 0 0 0 0 0 0 0 0 0 071 0 0 0 0 0 0 0 0 0 0 0 0 0 0 0 0 0 0 0 0 0 0 0 0 0 0 0 0 0 0 0 0 0 0 0 0 0 0 0 0 0 0 0 0 0 0 071 0 0 0 0 0 0 0 0 0 0 0 0 0 0 0 0 0 0 0 0 0 0 0 0 0 0 0 0 0 0 0 0 0 0 0 0 0 0 0 0 0 0 0 0 0 0 072 0 0 0 0 0 0 0 0 0 0 0 0 0 0 0 0 0 0 0 0 0 0 0 0 0 0 0 0 0 0 0 0 0 0 0 0 0 0 0 0 0 0 0 0 0 0 075 0 0 0 0 0 0 0 0 0 0 0 0 0 0 0 0 0 0 0 0 0 1 0 0 0 2 0 0 0 0 0 0 0 0 0 0 0 0 0 0 0 0 0 0 0 0 078 0 0 2 0 0 0 0 0 0 0 0 0 0 0 0 0 0 0 0 0 0 0 0 0 0 0 0 0 0 0 0 0 0 0 0 0 0 0 0 0 0 0 0 0 0 0 079 0 0 0 0 0 0 0 0 0 0 0 0 0 0 0 0 0 0 0 0 0 0 0 0 0 0 0 0 0 0 0 0 0 0 0 0 0 0 0 0 0 0 0 0 0 0 080 0 0 0 0 0 0 0 0 0 0 0 0 0 0 0 0 0 0 0 0 0 0 0 0 0 0 0 0 0 0 0 0 0 0 0 0 0 0 0 0 0 0 0 0 0 0 081 0 0 0 0 0 0 0 0 0 0 0 0 0 0 0 0 0 0 0 0 0 0 0 0 0 0 0 0 0 0 0 0 0 0 0 0 0 0 0 0 0 0 0 0 0 0 082 0 0 0 0 0 0 0 0 0 0 0 0 0 0 0 0 0 0 0 0 0 0 0 0 0 0 0 0 0 0 0 0 0 0 0 0 0 0 0 0 0 0 0 0 0 0 083 0 0 0 0 0 0 0 0 0 0 0 0 0 0 0 0 0 0 0 0 0 0 0 0 0 0 0 0 0 0 0 0 0 0 0 0 0 0 0 0 0 0 0 0 0 0 084 0 0 0 0 0 0 0 0 0 0 0 0 0 0 0 0 0 0 0 0 0 0 0 0 0 0 0 0 0 0 0 0 0 0 0 0 0 0 0 0 0 0 0 0 0 0 086 0 0 0 0 0 0 0 0 0 0 0 0 0 0 0 0 0 0 0 0 0 0 0 0 0 0 0 0 0 0 0 0 0 0 0 0 0 0 0 0 0 0 0 0 0 0 087 0 0 0 0 0 0 0 0 0 0 0 0 0 0 0 0 0 0 0 0 0 0 0 0 0 0 0 0 0 0 0 0 0 0 0 0 0 0 0 0 0 0 0 0 0 0 092 0 0 0 0 0 0 0 0 0 0 0 0 0 0 0 0 0 0 0 0 0 0 0 0 0 0 0 0 0 0 0 0 0 0 0 0 0 0 0 0 0 0 0 0 0 0 093 0 0 0 0 0 0 0 0 0 0 0 0 0 0 0 0 0 0 0 0 0 0 0 0 0 0 0 0 0 0 0 0 0 0 0 0 0 0 0 0 0 0 0 0 0 0 096 0 0 0 0 0 0 0 0 0 0 0 0 0 0 0 0 0 0 0 0 0 0 0 0 0 0 0 0 0 0 0 0 0 0 0 0 0 0 0 0 0 0 0 0 0 0 096 0 0 0 0 0 0 0 0 0 0 0 0 0 0 0 0 0 0 0 0 0 0 0 0 0 0 0 0 0 0 0 0 0 0 0 0 0 0 0 0 0 0 0 0 0 0 097 0 0 0 0 0 0 0 0 0 0 0 0 0 0 0 0 0 0 0 0 0 0 0 0 0 0 0 0 0 0 0 0 0 0 0 0 0 0 0 0 0 0 0 0 0 0 098 0 0 0 0 0 0 0 0 0 0 0 0 0 0 0 0 0 0 0 0 0 0 0 0 0 0 0 0 0 0 0 0 0 0 0 0 0 0 0 0 0 0 0 0 0 0 099 0 0 0 0 0 0 0 0 0 0 0 0 0 0 0 0 0 0 0 0 0 0 0 0 0 0 0 0 0 0 0 0 0 0 0 0 0 0 0 0 0 0 0 0 0 0 0109 0 0 0 0 0 0 0 0 0 0 0 0 0 0 0 0 0 0 0 0 0 1 0 0 0 1 0 0 0 0 0 0 0 0 0 0 0 0 0 0 0 0 0 0 0 0 0114 0 0 0 0 0 0 0 0 0 0 0 0 0 0 0 0 0 0 0 0 0 0 0 0 0 0 0 0 0 0 0 0 0 0 0 0 0 0 0 0 0 0 0 0 0 0 0
OD Matrix- Car
Kochi Metro Rail Ltd. CDM Smith
ANNUXURE 4
BUS ROUTES DETAILS
Kochi Metro Rail Ltd. CDM Smith

Operational Routes by KSRTC Buses
SI. No From To Via
1 Ernakulam Aluva Menaka, Thoppumpady, Edakochi, Aroor
2 Ernakulam Aluva Padma, Thoppumpady, Edakochi, Aroor
3 Ernakulam Aluva Padma, Thoppumpady, Fort Kochi
4 Ernakulam Fort Kochi Menaka, Thoppumpady
5 Aluva Ekm Jetty Menaka
6 Ernakulam Fort Kochi Menaka, Mattanchery
7 Ernakulam Cherai
8 Aroor Kakkanad
9 Kollamkudimugal Ernakulam Kakkanad, MG Road
10 Eramalloor North Paravoor
11 Cherai Eramalloor
12 North Paravoor Thripoonithara
13 Thripoonithara Ernakulam
14 Ernakulam Poothotta Menaka
15 Ernakulam Poothotta Padma, Vytila, Thripoonithara, South Paravoor
16 Poothotta Aluva
17 Pookattupady Aluva
18 Thripoonithara Pookattupady
19 Thevara Pookattupady
20 Ernakulam Pookattupady
21 Kumbalangi Kakkanad Thoppumpady
22 Ernakulam Kumbalangi
23 Thuthiyoor Mattanchery
24 Kakkanad Mattanchery
25 Ernakulam Thuthiyoor Menaka
26 Thevara Ferry Aluva
27 Kakkanad Thevara Ferry
28 Ernakulam Njarakkal
29 Njarakkal Aluva
30 Kakkanad Cherai
31 Ernakulam Kadamakudy Varapuzha
32 Ernakulam Thevara Ferry
33 Kadamakudy Aroor Varapuzha
34 Varapuzha Thevara Ferry
35 Aluva Cochi Airport
36 Ernakulam Kothamangalam
37 Ernakulam Ankamaly
38 Ernakulam Moovatupuzha
39 Ernakulam Koothattukulam
40 Fortcochi Ankamaly Menaka
41 Ernakulam Coimbatore
42 Ernakulam Banglore
43 Ernakulam Trivandrum Alapuzha
44 Ernakulam Trivandrum Kottayam
45 Ernakulam Manglore
46 Ernakulam Madhurai
47 Ernakulam Perumbavoor Aluva
48 Ernakulam Moovatupuzha Aluva
Kochi Metro Rail Ltd. CDM Smith

Operational Routes by Private Buses
SI. No. From To Via
1 Chellanam Aluva Aroor
2 Aluva Chittoor
3 Aluva Chotanikkara
4 Aluva Kakkanad
5 Kannamaly Aluva Vytila
6 Kumbalam Aluva Vytila
7 Pambaimoola Aluva Vytila
8 Panangad Aluva Vytila
9 Perumpadappu Aluva Vytila
10 Aluva Irumpanam Vytila
11 Kothuruthy Aluva Vytila
12 Kumbalangi Aluva Vytila
13 Palluruthi Aluva Vytila
14 Panampilly Nagar Aluva Vytila
15 Cheppanam Aluva
16 Idacochi Aluva
17 Nettoor Aluva
18 Pallimukku Aluva Vytila
19 Pallimukku Aluva Kacheripady
20 Mundamveli Aluva Vytila
21 Kadavanthra Vytila
22 Ameda Aluva Vytila
23 Thevara Jn Aluva Vytila
24 Aluva Kothad Ferry Kadungaloor
25 Vattaparamba Manjapra Aluva
26 Kalamassery Eloor Ferry
27 Pallimukku Kanjiramattom
28 Vypin Munambam
29 Vytila Vytila
(Source: Rajiv Gandhi Municipal Bus Terminal, Aluva)
Kochi Metro Rail Ltd. CDM Smith