wt ridership report nov07 - njtransit.com · section 2: ridership forecasting methodology ......
TRANSCRIPT

FINAL DRAFT
WEST TRENTON LINE RIDERSHIP AND PARKING FORECASTS
FOR ENVIRONMENTAL ASSESSMENT DOCUMENTATION
TECHNICAL MEMO #2
PREPARED BY: NJ TRANSIT RESEARCH AND FORECASTING
Revised, January 2007

Proposed Restoration of Passenger Rail Service on the West Trenton LineDraft Environmental AssessmentNovember 2007 Appendix B
Table of ContentsEXECUTIVE SUMMARY .........................................................................................................................B-1FINDINGS ..................................................................................................................................................B-2SUMMARY OF SYSTEM IMPACTS........................................................................................................B-3Section 1: Station and Line Impacts ...........................................................................................................B-4
Station and Service Assumptions ............................................................................................................B-4Station Ridership Forecasts .....................................................................................................................B-5Impact of West Trenton Service on Other NJT Rail Lines ......................................................................B-7Impact of West Trenton Service on Diversion of Auto Trips ..................................................................B-9Station Access Modes & Parking Demand..............................................................................................B-9VMT Reduction.....................................................................................................................................B-10
Section 2: Ridership Forecasting Methodology........................................................................................B-11Overall Approach - Trip Generation and Distribution...........................................................................B-11Mode Split & Trip Assignment .............................................................................................................B-12Non-Model Adjustments .......................................................................................................................B-12
Section 3: Demographic Forecasts ...........................................................................................................B-132000 Population, Household and Employment Data .............................................................................B-132025 Population, Household and Employment Forecasts......................................................................B-13
List of TablesTable 1.........................................................................................................................................................B-3Summary of 2025 Daily Ridership by Source for West Trenton Line Project.............................................B-3Table 2: West Trenton Line Station Ridership Summary by Time Period .................................................B-6Table 5: West Trenton Line Parking and Access Summary ......................................................................B-10Table 6: West Trenton Line Directional Origin of Parkers........................................................................B-10Table Y:.....................................................................................................................................................B-142000 and 2025 Population, Households and Employment by Municipality ..............................................B-14Table Z: 2000 and 2025 Population, Households and Employment by County .......................................B-15

Proposed Restoration of Passenger Rail Service on the West Trenton LineDraft Environmental AssessmentNovember 2007 Appendix B
1
EXECUTIVE SUMMARY
This technical memo summarizes the key elements of ridership and parking demand associated with the proposed restoration of commuter rail service on the West Trenton line. The report includes a summary of forecast year 2025 ridership and parking demand for each of the six proposed West Trenton line stations. The report also provides information regarding diversions of ridership from existing commuter rail stations on both the Northeast Corridor (NEC) and Raritan Valley Lines (RVL) to West Trenton Line stations. New rail riders include estimates of diversions from both auto and bus. Finally Eastbound AM Peak Period ridership is estimated for use in service planning to integrate and balance West Trenton ridership impacts with the existing Raritan Valley Line service and seating capacity.
This report also contains general information regarding the methodology and techniques utilized to forecast ridership and diversions from other lines and modes. A technical appendix documents the details of the North Jersey Transit Demand Forecasting Model (NJTDFM), which is the primary tool used by NJ TRANSIT staff for most of the ridership forecasts in this study. The NJTDFM is used for most new project ridership forecasting by NJ TRANSIT, and has been thoroughly validated to the year 2000.
This report is divided into three sections. Section one summarizes West Trenton station level ridership, parking, access modes, peak period ridership, and system wide changes resulting from implementation of the West Trenton service. It also includes a discussion of the service patterns assumed on the West Trenton Line, NEC, RVL, and Morris & Essex lines (M&E). This section also documents new rail riders, auto diversions by market, and station level diversions of existing rail riders.
Section two provides a brief summary of the ridership forecasting process and techniques used in this study. This includes describing key elements of the NJTDFM, as well as adjustments that were made and modifications incorporated into the model to account for unique issues related to the West Trenton project. This includes techniques that were used to account for trips outside the area covered by the model, and trip distribution related to the Merrill Lynch development. This section of the report also summarizes the transportation network changes assumed for the year 2025 No-Build condition and the West Trenton Build Alternative.
Section three summarizes municipal level demographic forecasts and methods used to provide future growth to 2025 from Somerset, Mercer and Bucks Counties, the primary areas served by the West Trenton line. It also has a summary of the forecasts used for the rest of the region.

[THIS PAGE INTENTIONALLY LEFT BLANK AND NOT NUMBERED]
Proposed Restoration of Passenger Rail Service on the West Trenton LineDraft Environmental AssessmentNovember 2007 Appendix B
2
FINDINGS
Key highlights of the findings of this technical memo follow.
West Trenton Ridership Results
The six proposed West Trenton stations will generate a total of 1,330 daily eastbound boarding riders, or 2,660 daily trips in 2025. The overwhelming majority of these riders, 1,170 or 88%, are traveling in the traditional eastbound AM Peak Period with destinations in the urban core, which is defined as New York City, Hudson County, and Newark. 120 of these riders are destined to points along the Raritan Valley from Bound Brook through Union Township. The largest RVL destination station is Roselle Park, with 50 riders disembarking. Another 90 or 7% are reverse commuters or riders destined to employment near the I-95 or West Trenton stations, primarily the Merrill Lynch office complex. 70 or 5% are transfers from the R-3 SEPTA line or local travel between West Trenton and the Merrill Lynch office complex.
The West Trenton Line stations will add 620 new daily rail riders (1,240 trips) to the NJ TRANSIT system. Thus, 47% of the West Trenton Line ridership consists of new rail riders to the NJ TRANSIT system. Of these, 120 riders are diverted from bus and the balance or 500 riders making 1000 trips are either auto drivers or passengers diverted (auto persons), including long distance drivers to PATH or the Hudson-Bergen LRT. Table 1 documents the source of new and existing riders for both the West Trenton line and the overall project. These 500 riders diverted from auto represent new transit trips. Of the auto diversions, 340 are to the urban core, 90 are reverse commuters, and 70 are other suburban autos.
The auto diversions translate into approximately 430 cars removed from the highway system per day at an average auto occupancy of 1.15. This includes approximately 85 autos diverted from the Merrill Lynch site and 280 diverted from the Trans-Hudson crossings or urban core area approach roads, and 65 diverted from other New Jersey destinations.
710 daily eastbound West Trenton riders, or 53% of the total, are riders that would otherwise utilize the Northeast Corridor or Raritan Valley lines. A total of 490 peak period riders are diverted from the Northeast Corridor to the West Trenton Line in 2025 (See Table 1), particularly from Trenton and Princeton Junction stations. This translates to a saving of about 460 parking spaces at these stations. The West Trenton stations will also divert 220 riders from the Raritan Valley line, primarily at Raritan and Somerville. This will save about 210 parking spaces at these stations.

[THIS PAGE INTENTIONALLY LEFT BLANK AND NOT NUMBERED]
Proposed Restoration of Passenger Rail Service on the West Trenton LineDraft Environmental AssessmentNovember 2007 Appendix B
3
SUMMARY OF SYSTEM IMPACTS
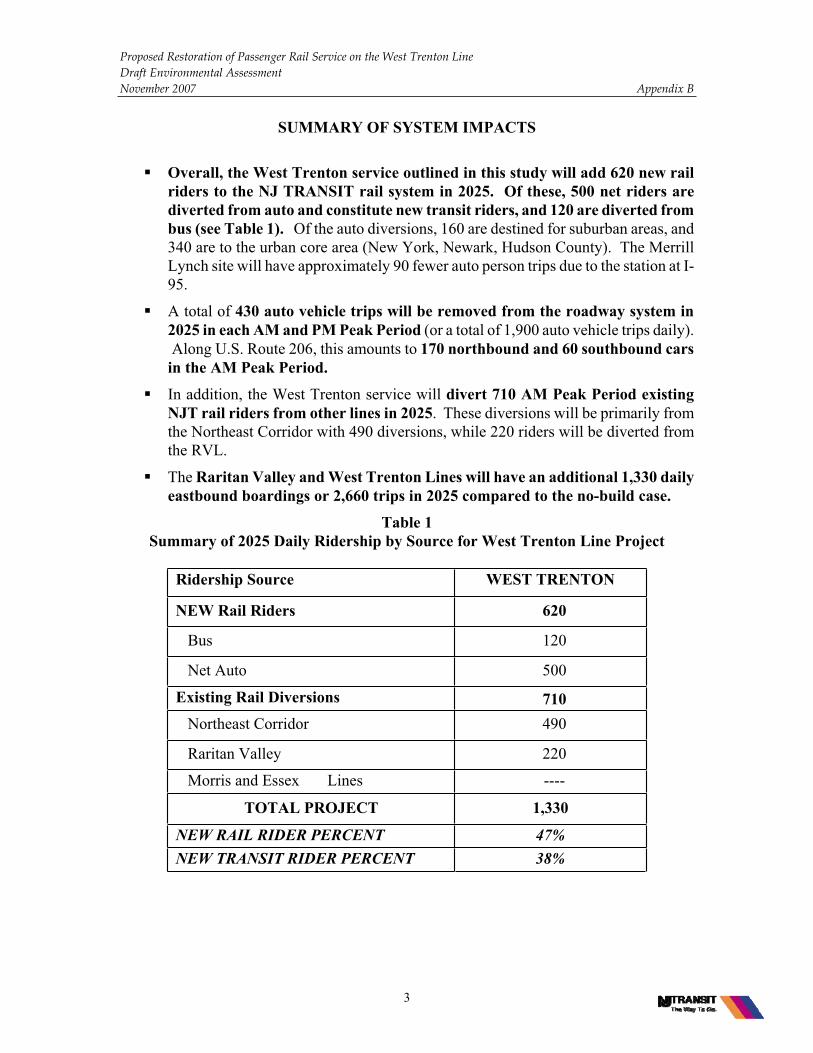
Overall, the West Trenton service outlined in this study will add 620 new rail riders to the NJ TRANSIT rail system in 2025. Of these, 500 net riders are diverted from auto and constitute new transit riders, and 120 are diverted from bus (see Table 1). Of the auto diversions, 160 are destined for suburban areas, and 340 are to the urban core area (New York, Newark, Hudson County). The Merrill Lynch site will have approximately 90 fewer auto person trips due to the station at I-95.
A total of 430 auto vehicle trips will be removed from the roadway system in 2025 in each AM and PM Peak Period (or a total of 1,900 auto vehicle trips daily). Along U.S. Route 206, this amounts to 170 northbound and 60 southbound cars in the AM Peak Period.
In addition, the West Trenton service will divert 710 AM Peak Period existing NJT rail riders from other lines in 2025. These diversions will be primarily from the Northeast Corridor with 490 diversions, while 220 riders will be diverted from the RVL.
The Raritan Valley and West Trenton Lines will have an additional 1,330 daily eastbound boardings or 2,660 trips in 2025 compared to the no-build case.
Table 1 Summary of 2025 Daily Ridership by Source for West Trenton Line Project
Ridership Source WEST TRENTON
NEW Rail Riders 620
Bus 120
Net Auto 500
Existing Rail Diversions 710 Northeast Corridor 490
Raritan Valley 220
Morris and Essex Lines ----
TOTAL PROJECT 1,330
NEW RAIL RIDER PERCENT 47% NEW TRANSIT RIDER PERCENT 38%

[THIS PAGE INTENTIONALLY LEFT BLANK AND NOT NUMBERED]
Proposed Restoration of Passenger Rail Service on the West Trenton LineDraft Environmental AssessmentNovember 2007 Appendix B
4
Section 1: Station and Line Impacts The West Trenton Line project is designed to re-introduce commuter rail service on a line that was active until 1983. This section of the report documents the system-wide impacts of the proposed rail service, as well as the individual West Trenton Line station ridership and parking forecasts. All forecasts are for the year 2025, which is the design year of the project, and required for the environmental assessment. All demographic forecasts and regional transportation network improvements utilized in this project are discussed in Section 2 of this report.
Station and Service AssumptionsThe West Trenton Line ridership forecasts are based on the following six station locations:
West Trenton (Existing SEPTA station), with transfer possibilities to SEPTA’s R-3 Line
I-95 Hopewell Township, site of proposed Merrill Lynch office complex
Hopewell Boro, near site of historic station
Belle Meade, site of old station in Montgomery Twp.
Hillsborough, on Amwell Road
Manville, at South Main and Kennedy Blvd.
For details on station locations and line location, see the maps in the main body of the report.
The service plan has the following characteristics:
1. Five AM and Five PM Peak Period trains starting at West Trenton in the AM, and Newark in the PM. These trains arrive and depart in a three-hour peak period, offering service approximately every 30-40 minutes. These trains serve the traditional commuter market to the urban core area of New York City, Hudson County, and Newark, as well as points along the Raritan Valley line from Bound Brook and east. All five of these trains will serve intermediate Raritan Valley Line stations, and will be integrated into the existing service patterns. These trains will constitute a net increase of three AM Peak and five PM Peak Period trains from Bridgewater through Newark. Somerville and Raritan will have two less eastbound AM Peak Period trains.
2. One westbound Reverse Commute train arriving at West Trenton stations from the Raritan Valley during the AM Peak Hour, and leaving eastbound from West Trenton Line stations during the PM Peak Hour. This train will serve riders destined to the Merrill Lynch complex, Trenton, and reverse commuters along the Raritan Valley Line.
3. One late morning off-peak train from West Trenton stations to Newark. This train is a return of the Reverse Commute train, and allows for occasional rider travel to the urban core in the late morning. It also provides a late arrival at the Merrill Lynch office park
Proposed Restoration of Passenger Rail Service on the West Trenton LineDraft Environmental AssessmentNovember 2007 Appendix B
5
for connecting SEPTA riders from the west.
4. One early afternoon off-peak departure from Newark to West Trenton stations. This allows urban core riders to return home early and provide a way home for emergency or half day purposes. This train also serves crew functions and is turned to accommodate the PM Peak Reverse Commute.
5. Improved coordination with SEPTA R-3 line service is assumed, in that where feasible transfer times are minimized. However a totally coordinated schedule that matches the NJ TRANSIT schedule has not been assumed. PM Peak shuttle van service from the Merrill Lynch office complex to the West Trenton station is also assumed to fill in a gap in westbound train service for R-3 connections.
This total of 7 trains each way provides good urban core service, and a minimal reverse and off-peak service. The running times shown were coded into the ridership forecasting model on a train by train basis.
Station Ridership Forecasts Table 2 outlines the daily 2025 ridership forecasts at each of the West Trenton Line stations. The station daily ridership forecasts are defined as total daily eastbound boardings. Although there are 30 westbound daily boardings at West Trenton line stations, these trips are counted and assigned as eastbound station boardings. Counting boardings in both directions would double count the 30 riders that travel between two West Trenton stations. Thus a rider boarding westbound at Hopewell destined for Merrill Lynch at I-95 is counted as an eastbound I-95 boarding rider for station level ridership forecasting purposes. All daily eastbound daily ridership numbers can be multiplied by two to estimate trips.
However, for parking and access planning at the station level, both eastbound and westbound boarding riders are considered. In the station access table (Table 5), the Hopewell to Merrill Lynch rider is counted as both a Hopewell and I-95 rider for access planning purposes. The result is that the station access tables will have about 60 additional boarding riders compared to the daily ridership table. This represents the difference between linked trips used in the daily eastbound boarding ridership figure and the unlinked trips used for station access ridership and planning.
Table 2 also indicates riders getting on or off both the 5 traditional eastbound AM Peak trains, as well as the combined Off-Peak/PM Peak Period ridership that consists of one off-peak and one reverse commute PM Peak train. .
As indicated in Table 2, the West Trenton Line has a total of 1,330 daily eastbound boarding riders, which amounts to 2,660 daily trips. At the station level, the highesteastbound boarding daily ridership is found at the Hillsborough and Belle Mead stations. With 380 and 540 eastbound daily riders respectively, these two stations account for 69% of the Line’s ridership. In descending order, I-95, West Trenton and Hopewell follow, with 190, 150and 70 riders respectively. Due to its proximity to Bridgewater and Bound Brook stations, the model does not generate any trips for Manville. A minimal number of up to ten riders (20 trips) can be assumed for local walk access trips, but the analysis will not take these trips into account.
Proposed Restoration of Passenger Rail Service on the West Trenton LineDraft Environmental AssessmentNovember 2007 Appendix B
6
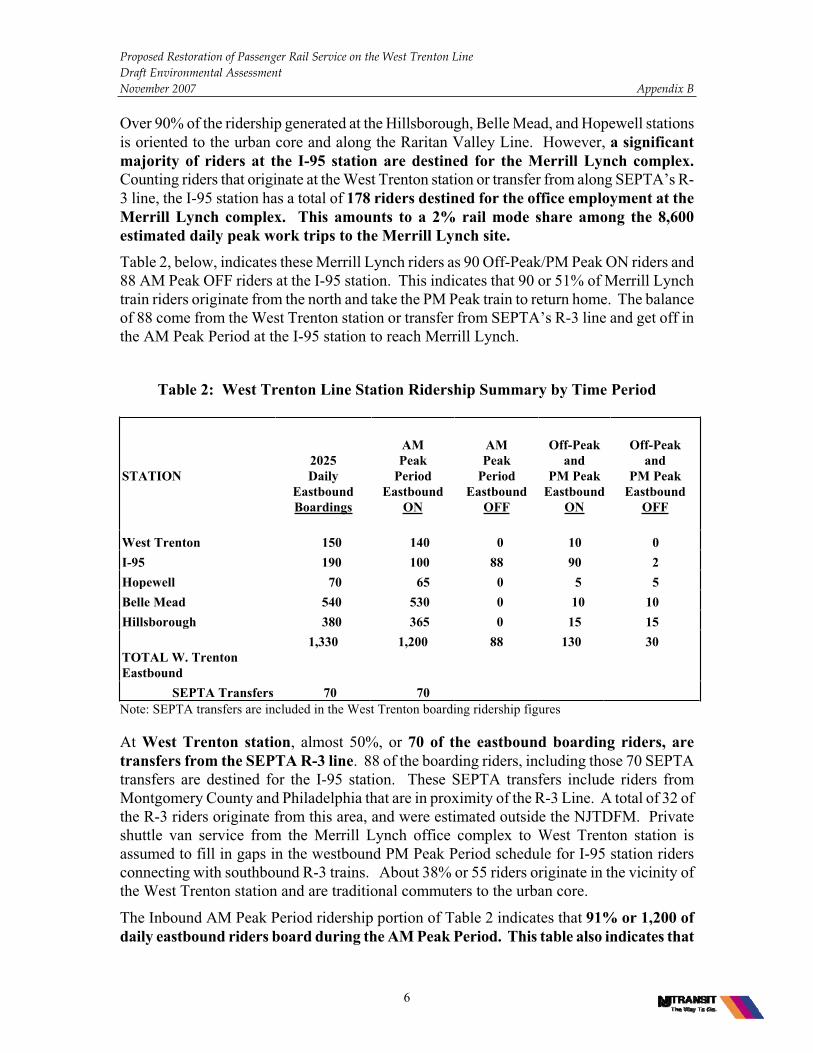
Over 90% of the ridership generated at the Hillsborough, Belle Mead, and Hopewell stations is oriented to the urban core and along the Raritan Valley Line. However, a significant majority of riders at the I-95 station are destined for the Merrill Lynch complex.Counting riders that originate at the West Trenton station or transfer from along SEPTA’s R-3 line, the I-95 station has a total of 178 riders destined for the office employment at the Merrill Lynch complex. This amounts to a 2% rail mode share among the 8,600 estimated daily peak work trips to the Merrill Lynch site. Table 2, below, indicates these Merrill Lynch riders as 90 Off-Peak/PM Peak ON riders and 88 AM Peak OFF riders at the I-95 station. This indicates that 90 or 51% of Merrill Lynch train riders originate from the north and take the PM Peak train to return home. The balance of 88 come from the West Trenton station or transfer from SEPTA’s R-3 line and get off in the AM Peak Period at the I-95 station to reach Merrill Lynch.
Table 2: West Trenton Line Station Ridership Summary by Time Period
STATION2025Daily
EastboundBoardings
AMPeak
PeriodEastbound
ON
AMPeak
PeriodEastbound
OFF
Off-Peak and
PM Peak Eastbound
ON
Off-Peak and
PM Peak Eastbound
OFF
West Trenton 150 140 0 10 0 I-95 190 100 88 90 2 Hopewell 70 65 0 5 5 Belle Mead 540 530 0 10 10Hillsborough 380 365 0 15 15
TOTAL W. Trenton Eastbound
1,330 1,200 88 130 30
SEPTA Transfers 70 70 Note: SEPTA transfers are included in the West Trenton boarding ridership figures
At West Trenton station, almost 50%, or 70 of the eastbound boarding riders, are transfers from the SEPTA R-3 line. 88 of the boarding riders, including those 70 SEPTA transfers are destined for the I-95 station. These SEPTA transfers include riders from Montgomery County and Philadelphia that are in proximity of the R-3 Line. A total of 32 of the R-3 riders originate from this area, and were estimated outside the NJTDFM. Private shuttle van service from the Merrill Lynch office complex to West Trenton station is assumed to fill in gaps in the westbound PM Peak Period schedule for I-95 station riders connecting with southbound R-3 trains. About 38% or 55 riders originate in the vicinity of the West Trenton station and are traditional commuters to the urban core.
The Inbound AM Peak Period ridership portion of Table 2 indicates that 91% or 1,200 of daily eastbound riders board during the AM Peak Period. This table also indicates that
Proposed Restoration of Passenger Rail Service on the West Trenton LineDraft Environmental AssessmentNovember 2007 Appendix B
7
the two westernmost stations at I-95 and West Trenton generate comparatively few AM Peak inbound riders, a total of 240 or 20% of the peak period total. After accounting for the riders destined to Merrill Lynch, only 152, or 14% of the 1,112 traditional AM Peak riders destined to the urban core or Raritan Valley board at these stations. This is because the proximity to the high speed, frequent, and all day service on the Northeast Corridor line available from Hamilton, Princeton Junction, and Trenton attracts all but a very few riders who otherwise could use this part of the West Trenton line.
The more easterly portion of the line at the Belle Mead and Hillsborough stations are closer to the Raritan Valley Line, and in an area with lower existing rail mode shares. Travel times on the West Trenton Line are more competitive with other services. This area has a greater potential to attract new riders, and is less competitive with Northeast Corridor rail service. Due to these factors, these two eastern stations have higher projected ridership, generating about 74% of AM Peak Period eastbound ridership.
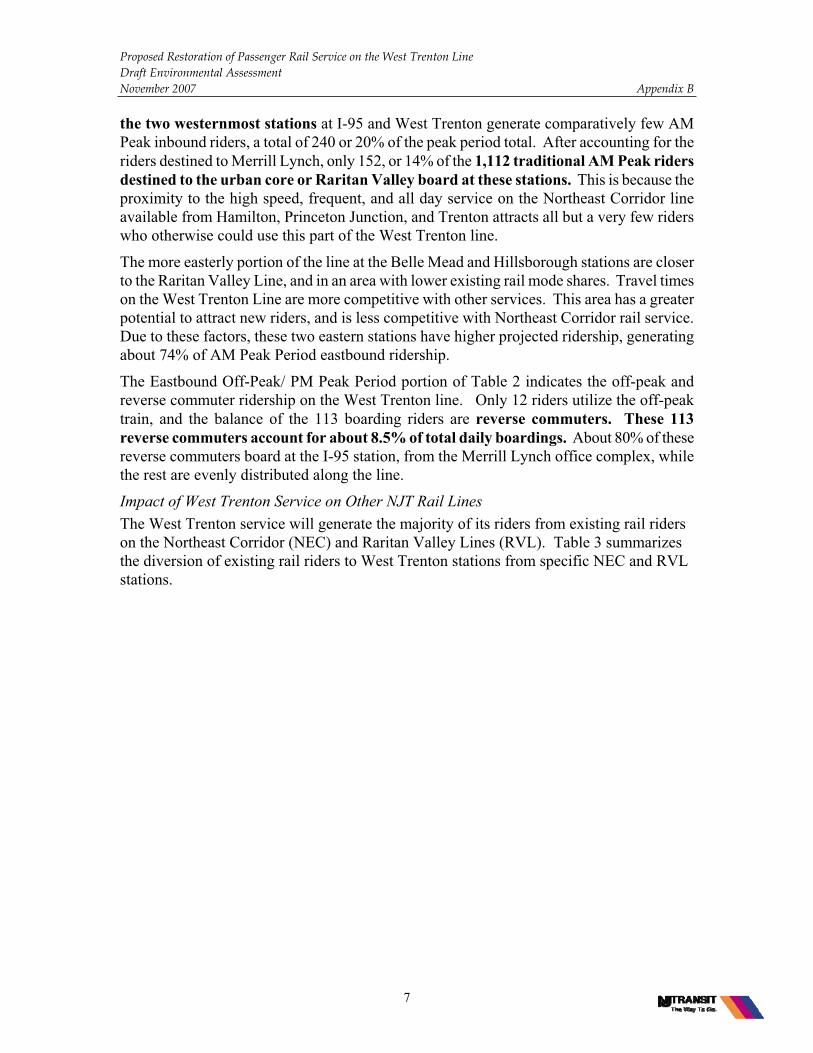
The Eastbound Off-Peak/ PM Peak Period portion of Table 2 indicates the off-peak and reverse commuter ridership on the West Trenton line. Only 12 riders utilize the off-peak train, and the balance of the 113 boarding riders are reverse commuters. These 113 reverse commuters account for about 8.5% of total daily boardings. About 80% of these reverse commuters board at the I-95 station, from the Merrill Lynch office complex, while the rest are evenly distributed along the line.
Impact of West Trenton Service on Other NJT Rail Lines The West Trenton service will generate the majority of its riders from existing rail riders on the Northeast Corridor (NEC) and Raritan Valley Lines (RVL). Table 3 summarizes the diversion of existing rail riders to West Trenton stations from specific NEC and RVL stations.
Proposed Restoration of Passenger Rail Service on the West Trenton LineDraft Environmental AssessmentNovember 2007 Appendix B
8
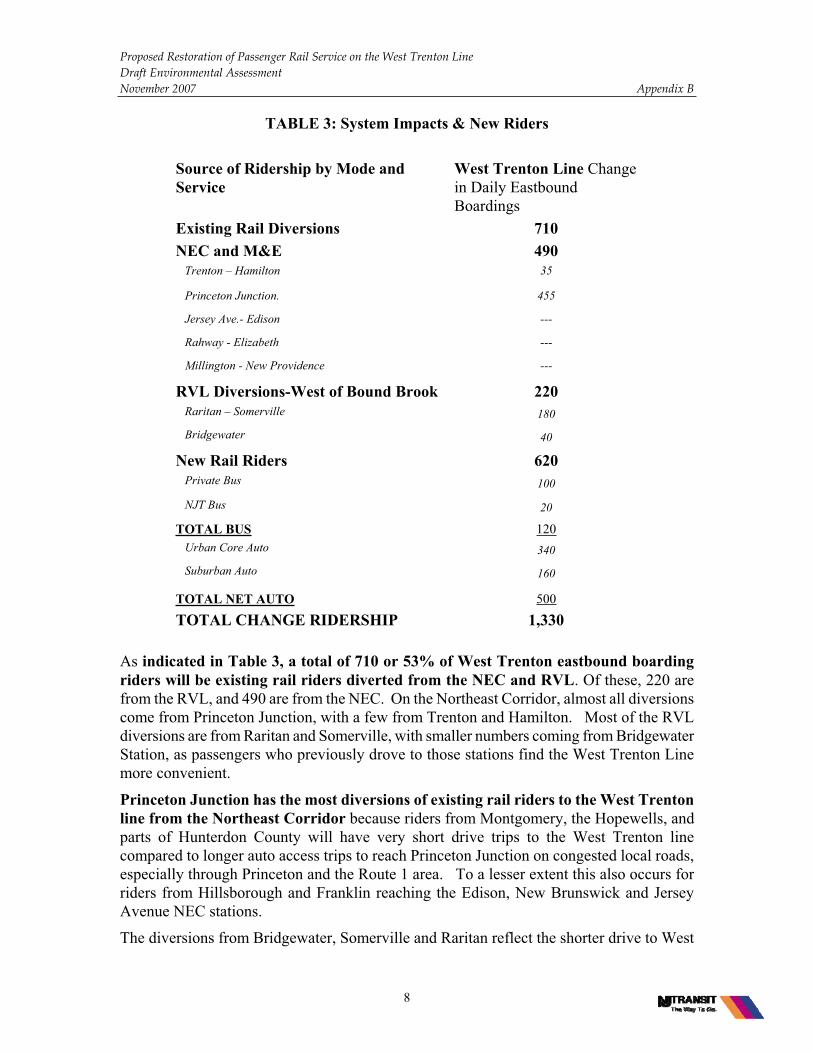
TABLE 3: System Impacts & New Riders
Source of Ridership by Mode and Service
West Trenton Line Changein Daily Eastbound Boardings
Existing Rail Diversions 710NEC and M&E 490 Trenton – Hamilton 35
Princeton Junction. 455
Jersey Ave.- Edison ---
Rahway - Elizabeth ---
Millington - New Providence ---
RVL Diversions-West of Bound Brook 220 Raritan – Somerville 180
Bridgewater 40
New Rail Riders 620 Private Bus 100
NJT Bus 20
TOTAL BUS 120 Urban Core Auto 340
Suburban Auto 160
TOTAL NET AUTO 500
TOTAL CHANGE RIDERSHIP 1,330
As indicated in Table 3, a total of 710 or 53% of West Trenton eastbound boarding riders will be existing rail riders diverted from the NEC and RVL. Of these, 220 are from the RVL, and 490 are from the NEC. On the Northeast Corridor, almost all diversions come from Princeton Junction, with a few from Trenton and Hamilton. Most of the RVL diversions are from Raritan and Somerville, with smaller numbers coming from Bridgewater Station, as passengers who previously drove to those stations find the West Trenton Line more convenient.
Princeton Junction has the most diversions of existing rail riders to the West Trenton line from the Northeast Corridor because riders from Montgomery, the Hopewells, and parts of Hunterdon County will have very short drive trips to the West Trenton line compared to longer auto access trips to reach Princeton Junction on congested local roads, especially through Princeton and the Route 1 area. To a lesser extent this also occurs for riders from Hillsborough and Franklin reaching the Edison, New Brunswick and Jersey Avenue NEC stations.
The diversions from Bridgewater, Somerville and Raritan reflect the shorter drive to West
Proposed Restoration of Passenger Rail Service on the West Trenton LineDraft Environmental AssessmentNovember 2007 Appendix B
9
Trenton line stations, and the cutback of two peak period AM trains from these stations as a result of new service on the West Trenton line. The frequency of trains on the West Trenton Line will be comparable to headways on the Raritan Valley Line from at Somerville and Raritan.
Impact of West Trenton Service on Diversion of Auto Trips The West Trenton Line is forecast to divert 500 daily persons from autos. This translates into 1,000 auto person trips per day. About 340 of these daily persons, or about 280 cars, are diverted from the Trans-Hudson approach roads. This includes trips driving to PATH or the HBLRT park-rides as well as autos crossing the Hudson River. At the Merrill Lynch site, 90 auto persons will be diverted.
These auto person diversions translate into 430 vehicles being diverted from the highway system, all in either the AM or PM Peak Periods. In terms of Route 206 traffic, approximately 170 northbound and 60 southbound AM Peak Period vehicle trips would be removed from the 2025 traffic flows, excluding station access trips. An auto occupancy of 1.2 is used for auto trips to the urban core locations (New York, Hudson County, Newark), and 1.05 for auto trips to suburban areas.
Station Access Modes & Parking Demand This section of the report summarizes the mode of access to the station of all eastbound boarding riders. This includes walk, drive and park, drop-off, and transfers from other transit modes (SEPTA Rail, bus) as access modes to reach West Trenton Line stations. An additional factor is the number of westbound riders that access a station, primarily for reverse commutation. These riders need to be considered in the total demand for parking and drop-off trips at the station boarding level. Because of these riders, the total boarding ridership is slightly higher at individual stations then the eastbound boarding ridership indicated earlier in Table 2. Thus, the total number of riders for access planning purposes is equal to the AM Peak Period Ons, the Off-peak/PM Peak period ons and the Off-peak/PM peak offs, who are reverse commuters.
Table 5 indicates riders by access mode and total parking demand for each of the West Trenton Line stations. It also includes the forecast change in 2025 parking demand and other access modes at West Trenton Line and Raritan Valley Line stations resulting from the implementation of the West Trenton service.
As indicated in Table 5, approximately 67% of the West Trenton station riders drive and park. This results in a need of 1,030 parking spaces at West Trenton stations. This includes consideration of a factor of approximately 15% that is added to parking demand to estimate parking spaces to be constructed at each station. Increasing the parking number by such a factor accounts for heavier ridership days due to weather or special events, variation in the forecasts, and to allow some room for future growth. Auto occupancy of riders using autos to drive to rail stations is typically assumed to be 1.05. However, to be conservative for planning parking lot sizes and traffic impacts, no adjustment for auto occupancy is made, thus auto occupancy of 1.0 is assumed in this report.
Proposed Restoration of Passenger Rail Service on the West Trenton LineDraft Environmental AssessmentNovember 2007 Appendix B
10
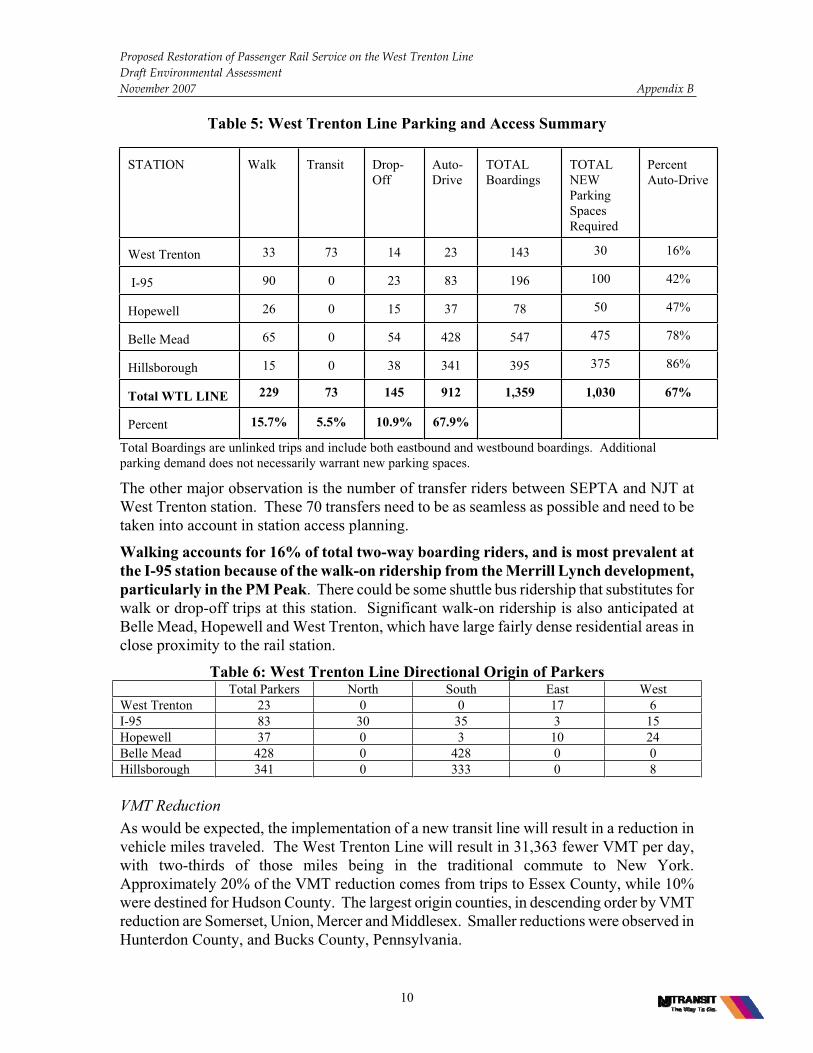
Table 5: West Trenton Line Parking and Access Summary
STATION Walk Transit Drop-Off
Auto-Drive
TOTALBoardings
TOTALNEW ParkingSpacesRequired
PercentAuto-Drive
West Trenton 33 73 14 23 143 30 16%
I-95 90 0 23 83 196 100 42%
Hopewell 26 0 15 37 78 50 47%
Belle Mead 65 0 54 428 547 475 78%
Hillsborough 15 0 38 341 395 375 86%
Total WTL LINE 229 73 145 912 1,359 1,030 67%
Percent 15.7% 5.5% 10.9% 67.9%
Total Boardings are unlinked trips and include both eastbound and westbound boardings. Additional parking demand does not necessarily warrant new parking spaces.
The other major observation is the number of transfer riders between SEPTA and NJT at West Trenton station. These 70 transfers need to be as seamless as possible and need to be taken into account in station access planning.
Walking accounts for 16% of total two-way boarding riders, and is most prevalent at the I-95 station because of the walk-on ridership from the Merrill Lynch development, particularly in the PM Peak. There could be some shuttle bus ridership that substitutes for walk or drop-off trips at this station. Significant walk-on ridership is also anticipated at Belle Mead, Hopewell and West Trenton, which have large fairly dense residential areas in close proximity to the rail station.
Table 6: West Trenton Line Directional Origin of Parkers Total Parkers North South East West West Trenton 23 0 0 17 6 I-95 83 30 35 3 15 Hopewell 37 0 3 10 24 Belle Mead 428 0 428 0 0 Hillsborough 341 0 333 0 8
VMT Reduction As would be expected, the implementation of a new transit line will result in a reduction in vehicle miles traveled. The West Trenton Line will result in 31,363 fewer VMT per day, with two-thirds of those miles being in the traditional commute to New York. Approximately 20% of the VMT reduction comes from trips to Essex County, while 10% were destined for Hudson County. The largest origin counties, in descending order by VMT reduction are Somerset, Union, Mercer and Middlesex. Smaller reductions were observed in Hunterdon County, and Bucks County, Pennsylvania.

[THIS PAGE INTENTIONALLY LEFT BLANK AND NOT NUMBERED]
Proposed Restoration of Passenger Rail Service on the West Trenton LineDraft Environmental AssessmentNovember 2007 Appendix B
11
Section 2: Ridership Forecasting Methodology This section of the report provides a brief summary of the ridership forecasting methodology used in the West Trenton project. This includes modifications to the basic forecasting tool, the North Jersey Transit Demand Forecasting Model (NJTDFM). The NJTDFM was used for most of the ridership forecasts produced in this report. The only exception was for trips originating in the portions of Pennsylvania in the Philadelphia metropolitan area (Philadelphia, Montgomery, and Bucks counties) with a destination of the I-95 station. For these trips, a spreadsheet version of the DVRPC model was used.
The NJTDFM was modified to address unique development issues in the West Trenton study area. The primary issue considered was the development of a major office complex at the proposed I-95 station.
The 2025 transit network for the West Trenton study was developed based on the most likely state of transit service. This includes service frequencies based on predicted equipment levels and committed projects that will be completed by the forecast year.
With these changes, the NJTDFM was updated to reflect most of the trip patterns that would be impacted by the West Trenton Line project. Following is a brief summary of the NJTFDM model and how it was used to estimate West Trenton Line ridership in this study. A more detailed description of the NJTDFM model components, validation, and mode choice process is contained in the report entitled “North Jersey Transit Demand Forecasting Model for Base Year 2000 Ridership Forecasting Methodology Report (Draft)”, dated October 2004.
Overall Approach - Trip Generation and Distribution The NJTDFM uses an incremental approach to ridership forecasting. The model is based on actual surveys of all Trans-Hudson travel (auto, bus, rail, PATH, ferry), as well as survey or 2000 Census Journey to Work (JTW) data for all other transit travel for areas west of the Hudson River. For auto travel not crossing the Hudson River, the North Jersey Model auto trip table is used for all travel within the 13 county North Jersey Transportation Planning Authority (NJTPA) region. For travel between DVRPC counties of Bucks and Mercer and the NJTPA region, 2000 census JTW data were used to estimate auto work trips. This data was also used for travel between Bucks and Mercer counties.
The use of existing survey and model data makes validation of the model with actual results easier, since there is no trip generation step. However travel for major new land uses, or areas with minimal travel patterns require the use of high growth factors or special treatment.
For this reason, the Merrill Lynch development site in Hopewell Township received a special zone and special treatment. This included development of a trip table for this complex based partly on a distribution of existing Merrill Lynch employees that were relocated to this site.
The full build out employment of the Merrill Lynch would result in 14,500 daily work trips by 2025, with 8,600 in the peak period time period served by West Trenton trains. This includes retail and non-Merrill Lynch office development. The distribution of trips to this site was done based on a combination of judgment, review of 2,000 existing employee

Proposed Restoration of Passenger Rail Service on the West Trenton LineDraft Environmental AssessmentNovember 2007 Appendix B
12
locations of Merrill Lynch workers to be moved to the site from three facilities, existing census JTW distributions of areas such as Plainsboro and future 2025 distributions of Hopewell and Plainsboro. The resulting trip distribution of the Merrill Lynch site takes all of these factors into account. Overall, about 25% of Merrill Lynch’s future employees are estimated to travel from Pennsylvania.
Trip distribution for all other areas of the study area is accomplished using a FRATAR trip distribution process using future employment and population forecasts for 2025. These forecasts are indicated in Tables Y and Z.
Mode Split & Trip Assignment The NJTDFM uses a nested logit based mode choice model. The model considers five transit modes and the auto mode. Within transit, there is a breakdown of walk to transit (including transit to transit access) and drive to transit. In addition, there are up to 11 geographic specific submarkets, eight income groups, four trip purposes, and peak and off-peak time of day mode specific constants or factors. This reflects the diversity of markets served by transit in North Jersey, and results in the model being able to replicate transit ridership to many diverse markets.
The mode split model also considers the traditional factors that influence modal split including travel time, cost, number of transfers, headway, and travel distance. These factors are outlined in the methodology report.
Non-Model Adjustments The NJTDFM is utilized for most, but not all of the ridership forecasts in the West Trenton project. There are two areas where the model results were supplemented with other data. The first is an adjustment to account for trips traveling to the Merrill Lynch site and other areas from parts of Montgomery County and Philadelphia. These areas are outside the area of the NJTDFM model, and a manual procedure utilizing Census JTW data and a spreadsheet version of the DVRPC model was employed. This spreadsheet model has been validated to within 10% of the full DVRPC travel demand model, and is thus within acceptable parameters.
The second area of non-model adjustment was for access mode split to West Trenton stations. Although the NJTDFM gives an overall split of auto and walk access, these numbers were modified by NJT staff based on the experience of other similar, station areas, and include consideration of local residential development patterns. Origin data from the model was also incorporated in the overall assessment of origin access modes.

Proposed Restoration of Passenger Rail Service on the West Trenton LineDraft Environmental AssessmentNovember 2007 Appendix B
13
Section 3: Demographic Forecasts 2000 Population, Household and Employment Data This section of this report documents demographic forecasts utilized in the West Trenton ridership estimates. The 2000 Population and Household data for the NJTDFM was obtained from 2000 Census Data. Employment data was developed by NYMTC at the county level using New Jersey Department of Labor data, and including data on self-employed workers from the federal Bureau of Economic Analysis (BEA). The 2000 employment estimate from NYMTC, including self-employment and proprietors was used as county-level control totals, which were then disaggregated by NJTPA to the municipal or Minor Civil Division (MCD) level. In Bucks and Mercer counties, DVRPC data and estimations were used. Household data was not provided for the DVRPC region.
2025 Population, Household and Employment Forecasts For 2025 data, the relevant MPO’s data was used. In the thirteen-county North Jersey region, NJTPA provided MCD data, which was based on NYMTC county-level control totals. These county-level data were once again disaggregated to municipal level based through a process utilizing forecasted growth rates and extensive coordination with county officials. In Mercer and Bucks Counties, DVRPC data was used. The DVRPC data already took into account the projected growth of employment in Hopewell Township, Mercer County due to the development of the Merrill Lynch site. The DVRPC county-level forecasts for Bucks County were disaggregated using appropriate techniques to the NJTDFM zones. In New York City and other areas outside of the NJTPA, NYMTC forecasts were used.
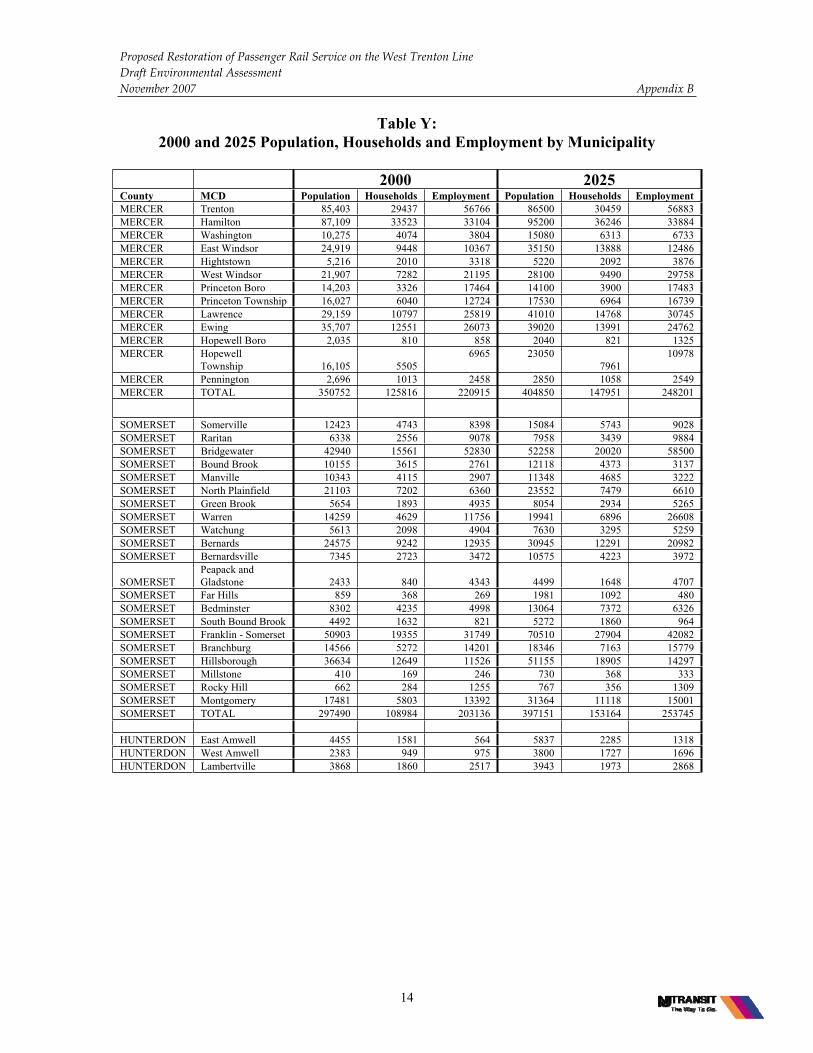
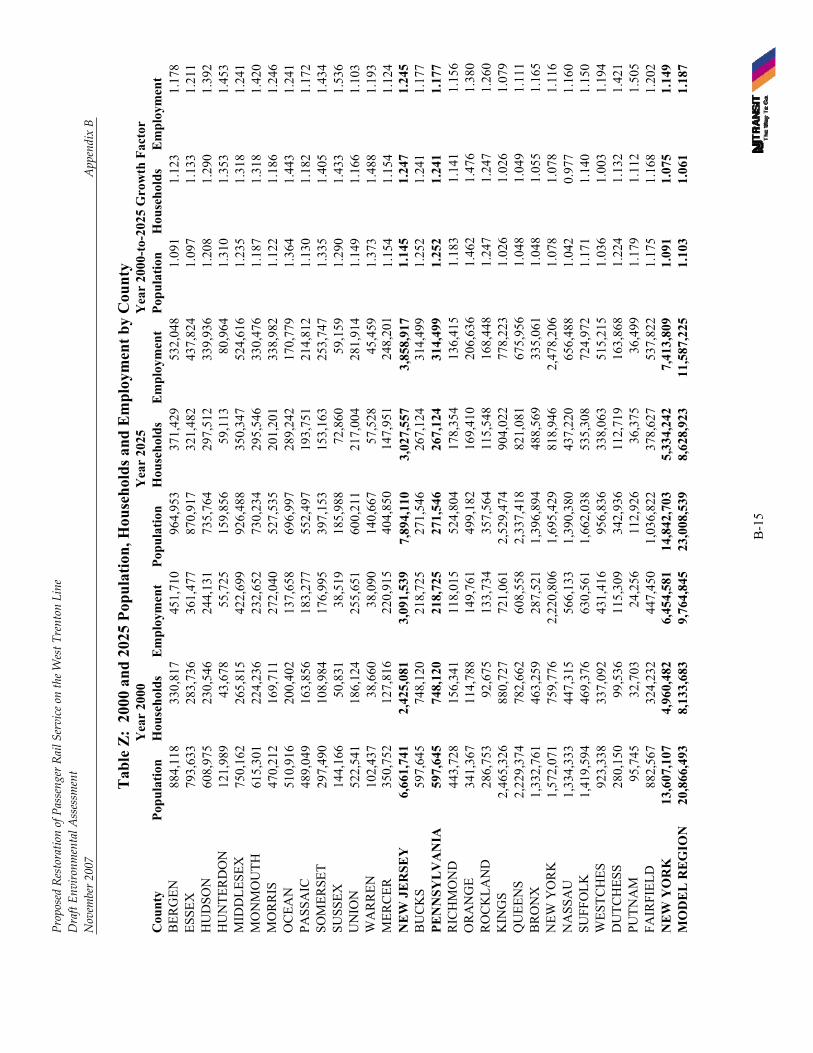
The MCD level population, household and employment data for the years 2000 and 2025 are provided in Table Y for Mercer and Somerset counties, and relevant portions of Hunterdon County. Table Z includes county-level totals for all areas covered by the NJTDFM in New Jersey, Pennsylvania, New York and Connecticut.
Proposed Restoration of Passenger Rail Service on the West Trenton LineDraft Environmental AssessmentNovember 2007 Appendix B
14
Table Y: 2000 and 2025 Population, Households and Employment by Municipality
2000 2025 County MCD Population Households Employment Population Households Employment MERCER Trenton 85,403 29437 56766 86500 30459 56883 MERCER Hamilton 87,109 33523 33104 95200 36246 33884 MERCER Washington 10,275 4074 3804 15080 6313 6733MERCER East Windsor 24,919 9448 10367 35150 13888 12486 MERCER Hightstown 5,216 2010 3318 5220 2092 3876 MERCER West Windsor 21,907 7282 21195 28100 9490 29758 MERCER Princeton Boro 14,203 3326 17464 14100 3900 17483 MERCER Princeton Township 16,027 6040 12724 17530 6964 16739 MERCER Lawrence 29,159 10797 25819 41010 14768 30745 MERCER Ewing 35,707 12551 26073 39020 13991 24762 MERCER Hopewell Boro 2,035 810 858 2040 821 1325 MERCER Hopewell
Township 16,105 5505 6965 23050
796110978
MERCER Pennington 2,696 1013 2458 2850 1058 2549 MERCER TOTAL 350752 125816 220915 404850 147951 248201
SOMERSET Somerville 12423 4743 8398 15084 5743 9028 SOMERSET Raritan 6338 2556 9078 7958 3439 9884 SOMERSET Bridgewater 42940 15561 52830 52258 20020 58500 SOMERSET Bound Brook 10155 3615 2761 12118 4373 3137 SOMERSET Manville 10343 4115 2907 11348 4685 3222 SOMERSET North Plainfield 21103 7202 6360 23552 7479 6610 SOMERSET Green Brook 5654 1893 4935 8054 2934 5265 SOMERSET Warren 14259 4629 11756 19941 6896 26608 SOMERSET Watchung 5613 2098 4904 7630 3295 5259 SOMERSET Bernards 24575 9242 12935 30945 12291 20982 SOMERSET Bernardsville 7345 2723 3472 10575 4223 3972
SOMERSETPeapack and Gladstone 2433 840 4343 4499 1648 4707
SOMERSET Far Hills 859 368 269 1981 1092 480 SOMERSET Bedminster 8302 4235 4998 13064 7372 6326 SOMERSET South Bound Brook 4492 1632 821 5272 1860 964 SOMERSET Franklin - Somerset 50903 19355 31749 70510 27904 42082 SOMERSET Branchburg 14566 5272 14201 18346 7163 15779 SOMERSET Hillsborough 36634 12649 11526 51155 18905 14297 SOMERSET Millstone 410 169 246 730 368 333 SOMERSET Rocky Hill 662 284 1255 767 356 1309 SOMERSET Montgomery 17481 5803 13392 31364 11118 15001 SOMERSET TOTAL 297490 108984 203136 397151 153164 253745 HUNTERDON East Amwell 4455 1581 564 5837 2285 1318 HUNTERDON West Amwell 2383 949 975 3800 1727 1696 HUNTERDON Lambertville 3868 1860 2517 3943 1973 2868
ProposedRestorationofPassengerRailServiceontheWestTrentonLine
DraftEnvironmentalAssessment
November2007
AppendixB
B-1
5
Tab
le Z
: 20
00 a
nd 2
025
Popu
latio
n, H
ouse
hold
s and
Em
ploy
men
t by
Cou
nty
Y
ear
2000
Y
ear
2025
Y
ear
2000
-to-
2025
Gro
wth
Fac
tor
Cou
nty
Popu
latio
n H
ouse
hold
s E
mpl
oym
ent
Popu
latio
n H
ouse
hold
s E
mpl
oym
ent
Popu
latio
n H
ouse
hold
s E
mpl
oym
ent
BER
GEN
884,
118
330,
817
451,
710
964,
953
371,
429
532,
048
1.09
11.
123
1.17
8 ES
SEX
793,
633
283,
736
361,
477
870,
917
321,
482
437,
824
1.09
71.
133
1.21
1 H
UD
SON
608,
975
230,
546
244,
131
735,
764
297,
512
339,
936
1.20
81.
290
1.39
2 H
UN
TER
DO
N12
1,98
9 43
,678
55,7
2515
9,85
659
,113
80
,964
1.31
01.
353
1.45
3 M
IDD
LESE
X75
0,16
2 26
5,81
542
2,69
992
6,48
835
0,34
7 52
4,61
61.
235
1.31
81.
241
MO
NM
OU
TH61
5,30
1 22
4,23
623
2,65
273
0,23
429
5,54
6 33
0,47
61.
187
1.31
81.
420
MO
RR
IS47
0,21
2 16
9,71
127
2,04
052
7,53
520
1,20
1 33
8,98
21.
122
1.18
61.
246
OC
EAN
510,
916
200,
402
137,
658
696,
997
289,
242
170,
779
1.36
41.
443
1.24
1 PA
SSA
IC48
9,04
9 16
3,85
618
3,27
755
2,49
719
3,75
1 21
4,81
21.
130
1.18
21.
172
SOM
ERSE
T29
7,49
0 10
8,98
417
6,99
539
7,15
315
3,16
3 25
3,74
71.
335
1.40
51.
434
SUSS
EX14
4,16
6 50
,831
38,5
1918
5,98
872
,860
59
,159
1.29
01.
433
1.53
6 U
NIO
N52
2,54
1 18
6,12
425
5,65
160
0,21
121
7,00
4 28
1,91
41.
149
1.16
61.
103
WA
RR
EN
102,
437
38,6
6038
,090
140,
667
57,5
28
45,4
591.
373
1.48
81.
193
MER
CER
35
0,75
2
1
27,8
16
220,
915
404,
850
147,
951
248,
201
1.15
41.
154
1.12
4 N
EW
JE
RSE
Y
6,66
1,74
1 2,
425,
081
3,09
1,53
97,
894,
110
3,02
7,55
7 3,
858,
917
1.14
51.
247
1.24
5 B
UC
KS
597,
645
748,
120
218,
725
271,
546
267,
124
314,
499
1.25
21.
241
1.17
7 PE
NN
SYL
VA
NIA
59
7,64
5 74
8,12
021
8,72
527
1,54
626
7,12
4 31
4,49
91.
252
1.24
11.
177
RIC
HM
ON
D
443,
728
1
56,3
41
1
18,0
15
524
,804
178
,354
136
,415
1.1
83
1
.141
1.1
56
OR
AN
GE
34
1,36
7
114
,788
149
,761
4
99,1
82
1
69,4
10
2
06,6
36
1
.462
1.4
76
1
.380
R
OC
KLA
ND
28
6,75
3
9
2,67
5
133
,734
3
57,5
64
1
15,5
48
1
68,4
48
1
.247
1.2
47
1
.260
K
ING
S
2,
465,
326
8
80,7
27
7
21,0
61
2
,529
,474
904
,022
778
,223
1.0
26
1
.026
1.0
79
QU
EEN
S
2,
229,
374
7
82,6
62
608
,558
2,3
37,4
18
8
21,0
81
675
,956
1.0
48
1
.049
1.1
11
BR
ON
X
1,
332,
761
4
63,2
59
287
,521
1,3
96,8
94
4
88,5
69
335
,061
1.0
48
1
.055
1.1
65
NEW
YO
RK
1,
572,
071
7
59,7
76
2
,220
,806
1,6
95,4
29
8
18,9
46
2,47
8,20
6
1.0
78
1
.078
1.1
16
NA
SSA
U 1
,334
,333
4
47,3
15
566
,133
1
,390
,380
4
37,2
20
656
,488
1.
042
0.97
71.
160
SUFF
OLK
1,4
19,5
94
469
,376
6
30,5
61
1,6
62,0
38
535
,308
7
24,9
72
1.17
11.
140
1.15
0 W
ESTC
HES
923
,338
3
37,0
92
431
,416
956
,836
3
38,0
63
515
,215
1.
036
1.00
31.
194
DU
TCH
ESS
2
80,1
50
9
9,53
6 1
15,3
09
3
42,9
36
112
,719
1
63,8
68
1.22
41.
132
1.42
1 PU
TNA
M
9
5,74
5
32,
703
2
4,25
6
112
,926
36,
375
3
6,49
9 1.
179
1.11
21.
505
FAIR
FIEL
D
882
,567
3
24,2
32
447
,450
1
,036
,822
3
78,6
27
537
,822
1.
175
1.16
81.
202
NE
W Y
OR
K
13,6
07,1
07
4,96
0,48
26,
454,
581
14,8
42,7
035,
334,
242
7,41
3,80
91.
091
1.07
51.
149
MO
DE
L R
EG
ION
20
,866
,493
8,
133,
683
9,76
4,84
523
,008
,539
8,62
8,92
3 11
,587
,225
1.10
31.
061
1.18
7