riboflavin transporters and breast cancer resistance protein ... · ii riboflavin transporters and...
TRANSCRIPT

Riboflavin Transporters and Breast Cancer Resistance Protein: Cimetidine-Riboflavin
Interactions in the Mammary Gland
by
Liana Dedina
A thesis submitted in conformity with the requirements for the degree of Master of Science
Department of Pharmacology and Toxicology University of Toronto
© Copyright by Liana Dedina 2012

ii
Riboflavin Transporters and Breast Cancer Resistance Protein: Cimetidine-Riboflavin Interactions in the Mammary Gland
Liana Dedina
Master of Science
Department of Pharmacology and Toxicology
University of Toronto
2012
ABSTRACT
Mother's milk provides multiple benefits to the offspring. However, xenobiotics
transferred into breast milk may pose a risk to the nursing infant. The breast cancer
resistance protein (BCRP) actively transports xenobiotics into breast milk. BCRP also
transports nutrients, like riboflavin, and together with recently identified riboflavin
transporters (RFT), may provide a mechanism for riboflavin secretion into breast milk.
Expression of RFT in the mammary gland remained unknown. Our objective was to
characterize Bcrp and Rft mRNA expression in the mammary gland of FVB/N mice, and
investigate a strategy to decrease excretion of BCRP-transported xenobiotics into the
milk using riboflavin intervention. Rft and Bcrp mRNA were upregulated in the mammary
gland of lactating mice. An intravenous riboflavin administration significantly reduced the
levels of BCRP-transported cimetidine in milk. This study demonstrates the use of
riboflavin to exploit the function of mammary BCRP in order to reduce xenobiotic
secretion into breast milk.

iii
ACKNOWLEDGEMENTS
I would like to thank Dr. Shinya Ito, my supervisor, without whose zealous
support and guidance none of my thesis work would have been possible. Our weekly
meetings with Dr. Ito have been of the most productive nature during my time at the
Hospital for Sick Children. He has always been patient in answering my questions, and
always happy to share his knowledge and wisdom with me. For this, I will remain
forever grateful.
I would also like to thank Alex Wu for his colossal help in teaching me the
essential laboratory skills and sharing his invaluable expertise and insights with me.
Alex’s time and advice have truly been priceless. I also want to thank Dr. Patricia
Harper for her immense and ardent instructions. I express my gratitude to all Ito lab
technicians: Pooja Dalvi, Xiaoli Lu and Ming Dong Yang. Their help throughout this
project has been inestimable. Many thanks go to my advisor, Dr. David Riddick, for his
support and a wonderful sense of humor. I also wish to thank Dr. Hisaki Fujii, whose
animal work experience has been inimitable for my project.
Finally, I wish to thank my family, Lia, Vladimir and Nikita, for their continual
encouragement and help.
My journey to the Land of Graduate Studies has been an experience never to be
forgotten.

iv
TABLE OF CONTENTS
ABSTRACT ii
AKNOWLEDGEMNETS iii
TABLE OF CONTENTS iv
LIST OF TABLES x
LIST OF FIGURES xi
LIST OF APPENDICES xiii
LIST OF ABBREVIATIONS xiv
INTRODUCTION 1
1. Thesis Overview and Statement of Problem 1
2. Background 1
2.1. Riboflavin 1
2.1.1 Discovery of Riboflavin 1
2.1.2 Structure and Properties 2
2.1.3 Synthesis of FMN and FAD 2
2.1.4 Riboflavin Sources, Absorption, Protein Binding and Excretion 4
2.1.4.1 Dietary Sources and Safety 4
2.1.4.2 Absorption 4
2.1.4.3 Protein Binding 6
2.1.4.4 Excretion 7
2.1.5 Biological Functions of Flavins – Riboflavin, FAD and FMN 7
2.1.6 Riboflavin Deficiency and Relevance in Disease 7
2.1.6.1 Developmental Abnormalities 8
2.1.6.2 Iron Status and Gastrointestinal Development 8

v
2.1.6.3 Cancer 9
2.1.6.4 Vision 9
2.1.6.5 Cardiovascular Diseases 9
2.1.7 Riboflavin Overdose 10
2.2. Riboflavin Transporters 10
2.2.1 RFT1 10
2.2.1.1 Structure 10
2.2.1.2 Tissue Distribution 10
2.2.1.3 Cellular Localization 11
2.2.1.4 Functional Characterization 11
2.2.1.5 RFT1 in Other Species 11
2.2.1.6 Summary 12
2.2.2 RFT2 12
2.2.2.1 Structure 12
2.2.2.2 Tissue Distribution 12
2.2.2.3 Cellular Localization 14
2.2.2.4 Functional Characterization 15
2.2.2.5 RFT2 in Other Species 16
2.2.2.6 Summary 16
2.2.3 RFT3 16
2.2.3.1 Structure 16
2.2.3.2 Tissue Distribution 16
2.2.3.3 Cellular Localization 17
2.2.3.4 Functional Characterization 17
2.2.3.5 RFT3 in Other Species 17
2.2.3.6 Summary 17
2.2.4 Differential Expression and Function of RFT 18
2.2.5 RFT and Disease 18
2.2.5.1 Esophageal Squamous Cell Carcinoma and hRFT2 18
2.2.5.2 Maternal riboflavin deficiency and hRFT1 19
2.2.5.3 Brown-Vialetto-Van Laere Syndrome and hRFT2 19
2.3. Breast Cancer Resistance Protein 19
2.3.1 The ABC Transporter Superfamily 19

vi
2.3.2 BCRP Structure 20
2.3.3 BCRP Substrates 20
2.3.3.1 Cimetidine 22
2.3.4 Cellular Localization, Tissue Expression and Function 22
2.3.4.1 Placenta 24
2.3.4.2 Gastrointestinal Tract 24
2.3.4.3 Brain and Testis 24
2.3.4.4 Kidney and Liver 24
2.3.4.5 Mammary Gland 25
2.3.5 Cancer and BCRP 26
2.4. The Mammary Gland 26
2.4.1 Human Breast 26
2.4.1.1 Anatomy and Development of the Human Breast 26
2.4.1.1.1 Prenatal Stage 26
2.4.1.1.2 Postnatal Stages 27
2.4.1.1.3 Human Breast during Pregnancy and Lactation 27
2.4.1.2 Breastfeeding and Human Breast Milk 28
2.4.1.2.1 Benefits of Breastfeeding 28
2.4.1.2.2 Human Breast Milk Composition 28
2.4.1.2.3 Cells in Human Breast Milk 28
2.4.1.2.4 Breastfeeding and Maternal Drug Therapy 30
2.4.2 Anatomy and Development of the Mouse Mammary Gland 31
2.4.2.1 Prenatal Development 31
2.4.2.2 Postnatal Development 31
2.4.2.3 Pregnancy, Lactation and Involution 32
2.4.2.4 Species Differences 32
3. Statement of Research Hypotheses 34
4. Objectives 34
4.1 Characterize temporal and spatial profiles of mammary RFT 34
4.2 Characterize riboflavin-cimetidine interaction
in the mouse mammary gland in vivo 34
5. Rationale 35

vii
MATERIALS AND METHODS 36
1. Materials 36
2. Cell Culture 36
2.1 Cell Lines and Maintenance 36
2.2 Total RNA Isolation 36
2.3 Primer design for conventional PCR 37
2.4 Conventional Polymerase Chain Reaction (PCR) 37
3. In Vivo Mouse Experiments 38
3.1 In vivo Expression of mRft1 and mRft2 mRNA in the Mammary Gland 38
3.1.1 Animals 38
3.1.2 Tissue Collection 38
3.1.3 Total RNA Isolation 39
3.1.4 Reverse Transcription (RT) 39
3.1.5 Quantitative Real-Time Polymerase Chain Reaction (qPCR) 40
3.1.6 Laser Capture Microdissection (LCM) 40
3.1.7 Hematoxylin and Eosin (HE) Staining 42
3.2 In Vivo Riboflavin-Cimetidine Interaction Study 42
3.2.1 Animals 42
3.2.2 Drug Doses 42
3.2.3 High-performance liquid chromatography (HPLC) 42
3.2.4 Experimental Timeline 44
3.2.5 Milk and Blood Sampling 44
3.2.6 Sample Analysis 46
4. Human Breast Milk 46
4.1 Milk Collection 46
4.2 RNA Isolation and Sample Processing 47
5. Western Blotting 47
6. Custom Antibody Design 47
7. Localization Study: GFP-hRFT2 Fusion Protein 48
7.1 Plasmid prepation 48
7.2 Transfection and Imaging 49
8. Statistical Analysis 49

viii
9. Data Analysis 49
RESULTS 51
1. mRNA Levels of RFT in Human and Mouse Mammary-Derived Cells in vitro 51
1.1 Human and Mouse Mammary Gland Cell Lines 51
1.2 Cellular Fractions in Human Milk 51
2. mRNA Expression Profiles of Rft, Bcrp and Other Main ABC Transporters in
Virgin, Pregnant, Lactating and Post-Lactation Stages of Mouse Mammary Gland
in vivo 55
2.1 Bcrp 55
2.2 Rft (mRft1 and mRft2) 55
2.3 Mammary Epithelia-Specific mRNA Profiles of mRft1, mRft2 and Bcrp
in Virgin and Lactating Mice: Laser-Captured Microdissection (LCM) 59
2.4 Pgp3 (Abcb1a, Mdr3), Pgp1 (Abcb1b, Mdr1b) and Mrp2 (Abcc2) 65
3. Protein Levels of mRFT1 and mRFT2 in Virgin, Lactating and Post-lactation
Stages of Mouse Mammary Gland in vivo 65
3.1 mRFT1 65
3.2 mRFT2 67
4. Subcellular Localization of hRFT2 in Mammary-derived Cell Line MCF10A 67
5. Riboflavin-Cimetidine Interaction Study in Mice in vivo 67
5.1 Riboflavin Dose Finding 67
5.2 Reduction of Cimetidine Excretion into Milk by High-Dose Riboflavin 72
DISCUSSION 76
1. RFT mRNA Expression Studies in vitro 76
2. Rft mRNA Expression Studies in Mice in vivo 78
3. RFT Protein Expression 80
4. Subcellular Localization of hRFT2 in Mammary-derived Cell Line MCF10A 81
5. Riboflavin-Cimetidine Interaction Study in Mice in vivo 82
6. Limitations 84
7. Future Directions 84

ix
CONCLUSIONS 85
REFERENCES 86
APPENDICES 100

x
LIST OF TABLES
Table 1. Recommended Dietary Allowance Values for Riboflavin 5
Table 2. Select BCRP substrates 21
Table 3. Composition of Human Breast Milk 29
Table 4. Primer Probes for qPCR 41

xi
LIST OF FIGURES
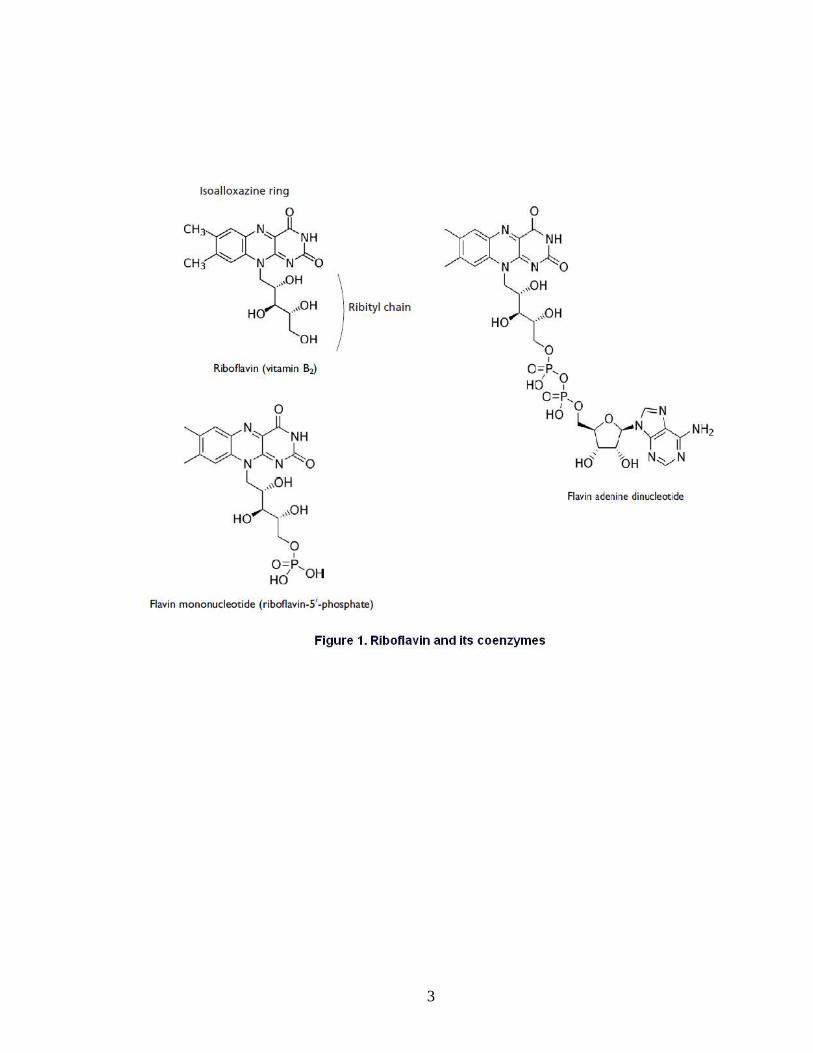
Figure 1. Riboflavin and its coenzymes 3
Figure 2. Inferred Structure of Mouse Riboflavin Transporter 1 (mRFT1) 13
Figure 3. Cimetidine and its metabolites 23
Figure 4. Hematoxylin and Eosin Staining of Mammary Glands 33
Figure 5. [N-Methyl-3H] Cimetidine 43 Figure 6. A representative chromatogram of riboflavin,
FAD and FMN in samples spiked with an internal standard lumiflavin 45
Figure 7. Levels of hRFT1, hRFT2 and hRFT3 mRNA Expression
in Human Mammary Epithelial Cell Lines 52
Figure 8. Levels of mRft1 and mRft2 mRNA Expression
in Mouse Mammary Epithelial Cell Lines 53
Figure 9. Levels of hRFT1, hRFT2 and hRFT3 mRNA Expression
in Human Milk Cells and Cell Fragments 54
Figure 10. Levels of Bcrp mRNA Expression at Different Stages
of Mammary Gland Development in FVB/N Mice 56
Figure 11. Levels of Bcrp mRNA Expression at Different Stages
of Mammary Gland Development in C57BL/6 Mice 57
Figure 12. Levels of mRft1 mRNA Expression at Different Stages
of Mammary Gland Development in FVB/N Mice 58

xii
LIST OF FIGURES
Figure 13. Levels of mRft2 mRNA Expression at Different Stages
of Mammary Gland Development in FVB/N Mice 60
Figure 14. Levels of beta-casein (Csn2) mRNA Expression
at Different Stages of Mammary Gland Development in FVB/N Mice 61
Figure 15. Levels of mRft1 and mRft2 mRNA Expression
at Different Stages of Mammary Gland Development in C57BL/6 Mice 62
Figure 16. Levels of mRft1 and mRft2 mRNA in the Mammary
Epithelial Cells of Virgin and Lactating FVB/N Mice 63
Figure 17. Levels of Bcrp mRNA in the Mammary
Epithelial Cells of Virgin and Lactating FVB/N Mice 64
Figure 18. Levels of Pgp3 (Abcb1a, Mdr3), Pgp1 (Abcb1b, Mdr1b)
and Mrp2 (Abcc2) mRNA Expression at Different Stages of
Mammary Gland Development in FVB/N Mice 66
Figure 19. mRFT2 Expression at Different Stages
of Mammary Gland Development in FVB/N Mice 68
Figure 20. Fluorescent Imaging of Green Fluorescent Protein
(GFP)-tagged hRFT2 69
Figure 21. Milk and Plasma Levels of Riboflavin in FVB/N Mice 70 Figure 22. Milk Levels of Riboflavin in FVB/N Mice 71 Figure 23. Milk and Plasma Levels of 5 mg/kg 3H-Cimetidine
in FVB/N Mice at 60 min after cimetidine IV injection 73
Figure 24. Milk and Plasma Levels of 5 mg/kg 3H-Cimetidine
in FVB/N Mice at 30 min after cimetidine IV injection 74
Figure 25. Summary of Cimetidine Milk-to-Plasma Ratios 75

xiii
LIST OF APPENDICES
Appendix I. Levels of intestinal mRft1 and mRft2 mRNA Expression during Pregnancy and Lactation in FVB/N Mice 100 Appendix II. Raw qPCR data of mammary fat cDNA Samples extracted by LCM 101
Appendix III. Milk and Plasma Levels of FAD and FMN in FVB/N Mice 102

xiv
LIST OF ABBREVIATIONS
ABC ATP-binding cassette
ATCC American Type Culture Collection
BCRP Breast cancer resistance protein
cDNA Complementary deoxyribonucleic acid
DEPC Diethylpyrocarbonate
DTT Dithiothreitol
ESCC Esophageal squamous cell carcinoma
FAD Flavin adenine dinucleotide
FMN Flavin mononucleotide
GFP Green fluorescent protein
HE Hematoxylin and Eosin
LCM Laser Capture Microdissection
MADD Multiple acyl-CoA dehydrogenation deficiency
MIQE Minimum Information for Publication of Quantitative Real-Time PCR Experiments
MP ratio Milk-to-plasma ratio
MMLV-RT Moloney Murine Leukemia Virus reverse transcriptase
NBF Nucleotide-binding folds

xv
LIST OF ABBREVIATIONS
PCR Polymerase chain reaction
RFT Riboflavin transporter
RIPA buffer Radioimmunoprecipitation assay buffer
SNP Single nucleotide polymorphism
TCP Toronto Centre for Phenogenomics
TEB Terminal end bud
TMD Transmembrane domain

1
INTRODUCTION
1. THESIS OVERVIEW AND STATEMENT OF PROBLEM
Mother's milk provides a multitude of benefits to the offspring. However, if the
lactating mother receives medication, the breastfed infant may be at risk of developing
drug toxicity through breast milk exposure.
Mechanisms of drug excretion into milk are complex, involving passive diffusion
and carrier-mediated transport. One of the transporters, breast cancer resistance
protein (BCRP), is apparently upregulated in the lactating mammary gland, playing a
key role in excretion of its substrate drugs and toxins into milk. Importantly, BCRP has
been shown to function as a mammary transporter for riboflavin (vitamin B2). The latter
observation suggests a dual role of mammary BCRP, both as a xenobiotic and a
nutrient transporter.
In this thesis, I describe a proof-of-principle study, exploring the potential of
BCRP-based nutrient (riboflavin) – cimetidine interaction as a method to reduce drug
excretion into milk.
2. BACKGROUND
2.1. Riboflavin
2.1.1 Discovery of Riboflavin
In 1879, an English chemist Alexander Wynter Blyth described the composition
of cow’s milk (Blyth, 1879). One of the chemical components isolated was a yellow
pigment, which Blyth named “lactochrome”.
For over 30 years after Blyth’s description, the yellow pigment remained
uncharacterized. Then, an observation made by McCollum and Kennedy initiated a
flurry of research in the field. In their studies on prevention of the deficiency state of
pellagra, McCollum and Kennedy noted the effectiveness of a tissue extract on pellagra
(McCollum and Kennedy, 1916). Further examinations revealed that the tissue extract
contained two separate fractions: a heat-liable fraction, and a heat-stable one. The latter
fraction was shown to contain a yellow factor, which was shortly purified and termed
riboflavin or vitamin B2 (Emmett and Luros, 1920).
The physiological importance of riboflavin remained unknown until the
breakthrough discovery made by Otto Warburg and Walter Christian in 1932 (Massey,
2000). They isolated an enzyme, dubbed “old yellow enzyme”, containing yellow factors

2
- flavin nucleotides - acting as co-enzymes for the protein function. This “old yellow
enzyme” is now known as a flavoprotein NADPH dehydrogenase, which requires flavin
mononucleotide (FMN) a cofactor.
In the late 1930’s chemical structures of both FMN and flavin adenine
dinucleotide (FAD) were identified (Rivlin and Pinto, 2001). Since then many enzymes
were identified to employ FAD and FMN not only as cofactors, but also covalently
binding flavins to gain functional activity (McCormick, 1994).
2.1.2 Structure and Properties
Riboflavin (7,8-dimethyl-10-ribityl-isoalloxazine) is a weak base, with a pKa of
about 10.2 (Nardiello et al., 2003). The name “riboflavin” comes from the ribityl side
chain and the isoalloxazine ring system (Figure 1), which imparts a yellow colour to the
vitamin (from Latin flavus for “yellow”), (Massey, 2000). The planar isoalloxazine ring
provides a structure to both riboflavin and its coenzymes (Rivlin and Pinto, 2001).
When excited with UV light, flavins exhibit a high degree of fluorescence, a
property that can be used to detect riboflavin and its coenzymes in various assays,
including quantification by high-pressure liquid chromatography (Zempleni, 1995; van
Herwaarden et al., 2007).
In addition to FAD and FMN, there are other naturally occurring flavins derived
from riboflavin (McCormick, 1994). Lumichrome and lumiflavin are photodegradation
products of riboflavin formed under acidic and basic conditions, respectively. Both,
however, are biologically inactive. Therefore, one of the key physicochemical properties
of riboflavin is its sensitivity to UV light. For this reason, phototherapy of neonatal
jaundice may result in deficiency of riboflavin, requiring supplementation of this vitamin
(Sisson, 1987).
2.1.3 Synthesis of FMN and FAD
Flavin coenzymes are synthesized from riboflavin via a chain of enzymatic
reactions (Rivlin, 1970). First, flavokinase phosphorylates riboflavin to produce FMN.
Some FMN can be used directly; however, the major fraction of FMN produced is
converted to FAD via a phosphorylation reaction catalyzed by FAD synthetase. These
reactions are reversible: phosphatases can dephosphorylate FAD to FMN, and in turn,
to riboflavin. Interestingly, FAD, rather than FMN, is the most common coenzyme used
by flavoproteins (Rivlin and Pinto, 2001).
3

4
2.1.4 Riboflavin Sources, Absorption, Protein Binding and Excretion
2.1.4.1 Dietary Sources and Safety
Riboflavin is an essential water-soluble vitamin, necessary for normal cellular
function, development and growth (Rivlin, 1986). Riboflavin and its coenzymes are
crucial for carbohydrate and fat metabolism, and thus energy production within the cell
(Buehler, 2011).
Humans and other vertebrates cannot synthesize riboflavin de novo, and
therefore, must obtain it from the diet, or in case of a fetus and neonates from maternal
sources (Swaan, 2011). Riboflavin and its coenzymes can be found in organ meats,
green vegetables and dairy products. It is known that riboflavin is excreted into milk
(Thomas, 1980), with levels of 0.36 mg/L and 1.75 mg/L reported in human and cow
milk, respectively. In the case of humans, milk riboflavin concentrations are about 100-
fold higher than maternal plasma concentrations (Lawrence, 2005a). In addition,
riboflavin can be acquired from the intestinal bacteria, indigenous to human colon
(Swaan, 2011).
The recommended daily allowance of riboflavin in an adult is about 1.1 to 1.3 mg
per day. The official Health Canada recommendations for daily intake of vitamin B2 are
summarized in Table 1. Riboflavin appears to have no known toxicity (Ames et al.,
2002). Doses as high as 400 mg/day of riboflavin were used for migraine prophylaxis,
without any adverse events being recorded (Shoenen et al., 1998; Boehnke et at.,
2004).
2.1.4.2 Absorption
The majority of dietary sources of riboflavin come in the form of its derivatives
and flavoproteins, with principal absorption happening in the proximal part of the small
intestine (Rivlin and Pinto, 2001). Absorption half-life is reported to be about 1.1 hour
(Zempleni et al., 1996). Before absorption can occur, FMN and FAD are hydrolyzed to
riboflavin, in a non-specific phosphatase-catalyzed reaction on the brush border
membrane of enterocytes. It has been reported that the upper limit of intestinal
absorption of riboflavin is about 25 mg, given at a single time (Zempleni et al., 1996).
Based on studies conducted in HepG2 human-derived liver cells (Said et al.,
1998), intestinal brush border membrane vesicle (Said and Arianas, 1991) and human
trophoblast-derived BeWo cells (Huang and Swaan, 2001), it was generally accepted
that riboflavin transport across the cellular membrane was carrier-mediated. However,

5
Table 1. Recommended Dietary Allowance Values for Riboflavin
(Health Canada values as based on IOM 2006)
Age group (years) Riboflavin (mg/day)
Children 1-3 y 0.5
4-8 y 0.6
Adolescent
males
9-13 y 0.9
14-18 y 1.3
Adult males ≥ 19 y 1.3
Adolescent
females
9-13 y 0.9
14-18 y 1
Adult females ≥ 19 y 1.1
Pregnancy 14-50 y 1.4
Nursing females 14-50 y 1.6

6
the exact mechanism of riboflavin transport within the intestinal and other epithelia
remained unknown until recently (van Herwaarden et al., 2007; Yonezawa et al.,2008),
when riboflavin transporters were identified. More on the specific transporters involved
will follow in the subsequent sections. Receptor-mediated endocytosis of riboflavin
internalization was proposed as an alternative mechanism for this vitamin’s entry into
the cell (Huang et al., 2003). However, the significance of this observation is still to be
determined.
Intestinal absorption of riboflavin can be affected by various factors. For instance,
in experimental animals with riboflavin deficiency or ariboflavinosis, riboflavin absorption
was elevated (Said and Mohammadkhani, 1993). Also, alcohol may negatively impact
both absorption and digestion of dietary flavins (Pinto et al., 1987). Other drugs and
metals, forming complexes with riboflavin, may also have an impact on the vitamin’s
bioavailability (McCormick, 1990). Examples of such include iron and zinc metals, as
well as caffeine and ascorbic acid; however, the clinical significance of these is not well
understood.
After its systemic absorption, riboflavin is converted to FMN and FAD inside the
tissues (Swaan, 2011). One third of total body riboflavin is contained within the liver,
while excess amounts of this vitamin are excreted in urine.
2.1.4.3 Protein Binding
In human blood, riboflavin is non-covalently bound to protein, with strong and
weak associations reported for immunoglobulins and albumin, respectively (Innis et
al.,1986). Specific riboflavin binding proteins are present in pregnancy and are
important for fetal development. For example, in hens lacking the expression of avian
riboflavin carrier protein, riboflavin deficiency occurs in eggs, shortly followed by
embryonic death (White and Merrill, 1988). Studies conducted in other species have
indentified similar riboflavin binding proteins in humans, rats, cows and moneys, as well
as the importance of these proteins for proper development (Krishnamurthy et al., 1984;
McCormick, 1994).
Within the tissues, FAD and FMN are bound to enzymes, both covalently and
non-covalently (Singer and Kenney, 1974; McCormick, 1994). Free flavins are quickly
hydrolyzed to riboflavin, which is readily excreted. Therefore, it seems that
phosphorylation of riboflavin derivatives is critical for capturing of FAD and FMN within
the cells (Gastaldi et al., 2000).

7
2.1.4.4 Excretion
Most riboflavin excretion occurs through urine, with only a minor part present in
the stool (Rivlin and Pinto, 2001). Urinary excretion of flavins occurs mainly in the form
of riboflavin, which contributes to about 60% to 70% of urinary flavins (Chastain and
McCormick, 1987). In addition, other derivatives are also present in urine, including 7-
hydroxymethylriboflavin, 10-hydroxylmethylriboflavin, lumiflavin and others. These
represent metabolites from both microorganismal degradation of riboflavin and
flavoproteins.
2.1.5 Biological Functions of Flavins – Riboflavin, FAD and FMN
Riboflavin’s main function in the body is to serve as a precursor for FAD and
FMN (Rivlin and Pinto, 2001). These coenzymes are essential for many of biological
oxidation-reduction reactions. For instance, FAD is an important component of cellular
respiration, as it functions in the electron transport chain reaction, making riboflavin
critical for energy metabolism.
Other roles of riboflavin include drug and endobiotic metabolism via cytochrome
P450 enzyme systems (Massey, 2000). Specifically, it is the NADPH-cytochrome P450
reductase that utilizes both FAD and FMN as its coenzymes. Furthermore, FAD and
FMN are required for function of various other flavoproteins, including Acyl-CoA
dehydrogenases, disulphide reductases and mono-oxygenases. Together,
flavoproteins catalyze a wide range of biologically vital reactions.
Although riboflavin itself is not a strong antioxidant, its phosphorylated derivatives
have a notable antioxidant potential (Rivlin and Pinto, 2001). Within the cell, the
glutathione redox cycle provides a powerful protection against lipid peroxides and some
drug metabolites (Forman et al., 2009). These can be deactivated by glutathione
peroxidase, an enzyme requiring reduced glutathione (GSH) for proper function. GSH
is regenerated from its oxidized form (GSSG) by glutathione reductase, a FAD-
containing enzyme. Therefore, riboflavin and its coenzymes are also imperative for cell
protection against oxidative stress.
2.1.6 Riboflavin Deficiency and Relevance in Disease
Clinical features of riboflavin deficiency include angular stomatitis, glossitis and
dermatitis (Rivlin and Pinto, 2001). However, these are not unique characteristics, and
may be due to multiple vitamin deficiencies. Nonetheless, numerous studies have

8
associated riboflavin deficiency with various abnormalities and diseases.
2.1.6.1 Developmental Abnormalities
Abnormal fetal development was documented in rodents with maternal riboflavin
deficiency. Both skeletal and soft tissue malformations were described (Warkany and
Nelson, 1972). In a human case-study, maternal riboflavin and folic acid deficiencies
were implicated in cleft lip and palate abnormalities in two newborns (Faron et al.,
2001); however, because riboflavin levels were not established in the study, this
association remains elusive.
2.1.6.2 Iron Status and Gastrointestinal Development
Early studies of riboflavin deficiency in both humans and animals pointed to this
vitamin’s involvement in proper function of the hematopoietic system. Foy and Kondi
described a case of pure red cell aplasia, which was successfully rescued by riboflavin
treatment (Foy and Kondi, 1953). In the follow-up studies of non-human primates fed a
riboflavin-deficient diet, abnormalities in both red blood cell production and iron status
were described (Foy et al., 1964).
In the past decades, possible mechanisms of riboflavin deficiency-induced iron
handling alterations were proposed. Flavins, in their reduced form, were noted to
mobilize ferritin iron (Sirivech et al., 1974; Crichton et al., 1975). Moreover, in tissues of
rats fed riboflavin-deficient diets, iron mobilization was inefficient as compared to control
animals (Sirivech, 1977; Powers, 1987). Further support that riboflavin levels may
influence iron status comes from human studies. Here, an enhanced response to iron
supplementation was seen when riboflavin deficiency was corrected (Decker et al.,
1977; Powers et al., 1983). Taken together, these findings suggest the importance of
riboflavin and its coenzymes in iron mobilization and absorption, as well as hematologic
status.
In addition, riboflavin deficiency is associated with gastrointestinal abnormalities
in weanling rodents (Powers et al., 1991; Williams et al., 1995). Weanling rats fed a
riboflavin-deficient diet showed early morphologic changes in the gastrointestinal tract.
The exact implications of these findings for human populations remain to be
established; however, dietary deficiency of riboflavin and potential effects on
gastrointestinal maturation should not be disregarded.

9
2.1.6.3 Cancer
The precise role and importance of riboflavin status in carcinogenesis is not quite
clear. Some studies show a protective effect of riboflavin deficiency in some cancers,
while others indicate a reduced risk of cancer development with adequate riboflavin
levels (Rivlin, 1973; Webster et al., 1996). In epidemiological studies of esophageal
cancer, low dietary riboflavin was associated with elevated risk of cancer development
(Van Ransberg, 1981; Foy and Kondi, 1984). Furthermore, reduced incidence of
esophageal cancer was observed in Linxian, China, after a combined daily regimen of
riboflavin and niacin supplementation (Blot et al., 1993).
On the molecular level, riboflavin deficiency was implicated in an increase in
DNA strand breaks in rats exposed to carcinogens (Webster et al., 1996). This
increased breakage was shown to be reversible on riboflavin supplementation.
Nonetheless, more studies are needed to evaluate the mechanisms by which riboflavin
can modulate carcinogenesis.
2.1.6.4 Vision
Occurrence of cataracts in riboflavin-deficient animals has been observed
(Hughes et al., 1981; Wintrobe et al., 1994). However, the implication of riboflavin
deficiency for cataract etiology in humans is not yet understood.
Cases of riboflavin-responsive night blindness were reported (Venkataswamy,
1967). It is thought that riboflavin-dependent photoreceptors in the retina are involved
in dark adaptation (Miyamota and Sancar, 1998), and therefore riboflavin deficiency
may be associated with night blindness.
2.1.6.5 Cardiovascular Diseases
As indicated by animal studies (Hultquist et al., 1993; Betz et al., 1994; Mack et
al., 1995), riboflavin may be protective in ischemia-reperfusion injury. Coupled with its
antioxidant properties and lack of known toxicity, riboflavin may become a potential
candidate for tissue protection against oxidative damage.
In the Framingham Offspring Cohort (Jacques et al., 2001), riboflavin intake was
indicated to reduce plasma homocysteine levels. Plasma homocysteine is a risk factor
for developing cardiovascular disease (Boushey et al., 1995; Humphrey et al., 2008).
Not surprisingly, methylenetetrahydrofolate reductase, an enzyme metabolizing folate in
a reaction later leading to homocysteine formation, uses FAD as its cofactor (Horigan et
al., 2010). Moreover, a common mutation 677CT in methylenetetrahydrofolate
10
reductase leads to elevated plasma homocysteine levels (Kang et al., 1991), which are
reported to be modulated by riboflavin status in the individuals with this polymorphism
(Hustad et al., 2000).
2.1.7 Riboflavin Overdose
There is no known toxicity attributed to riboflavin overdose. Excess riboflavin is
readily excreted in the urine (Rivlin and Pinto, 2001). For migraine prophylaxis,
riboflavin doses as high as 400 mg/day were used without any adverse events being
recorded (Shoenen et al., 1998; Boehnke et at., 2004).
2.2. RIBOFLAVIN TRANSPORTERS
For decades, riboflavin transport has been studied using human-derived cell lines
(Said and Ma, 1994; Huang and Swaan, 2000; Huang and Swaan, 2001; Kansara et al.,
2005; Said et al., 2005). This research suggested a carrier-mediated transport of
riboflavin, saturable in nature. It was not until 2008 that the first report of a mammalian
riboflavin transporter was made (Yonezawa et al., 2008).
2.2.1 RFT1
2.2.1.1 Structure
Using an mRNA expression database selected from a rat kidney cDNA library,
Yonezawa and colleagues searched among functionally unknown genes, and identified
rat and human riboflavin transporters (rRFT1 and hRFT1, respectively). rRFT1 and
hRFT1 are 450 and 448-amino acid proteins, respectively, which are predicted to have
10 putative transmembrane domains and a N-linked glycosylation site. Both
transporters have predicted sequences for protein kinase COOH-dependent
phosphorylation. rRFT1 and hRFT1 have 81.1% amino acid identity and 96.4%
similarity. In addition, an inactive splice variant of hRFT1 was identified (Yonezawa et
al., 2008). It encodes a 167-amino acid protein.
2.2.1.2 Tissue Distribution
Yonezawa and colleagues demonstrated that hRFT1 mRNAs were expressed
strongly in small intestine and placenta, while moderately so in prostate, lung, uterus,
colon and kidney. Weak expression of hRFT1 was demonstrated in liver, stomach, heart,
whole brain, adrenal gland, skeletal muscle and spleen. Likewise, mRNA expression
was assessed in rat tissues. Organs of high rRft1 mRNA expression in rats were small
intestine, brain, colon, ovary, placenta, spleen and testis, while low expression was

11
detected in skeletal muscle, pancreas, kidney, liver and lung. Currently, nothing is
known about RFT1 distribution in the mammary gland.
2.2.1.3 Cellular Localization
To study cellular localization of these proteins, Yonezawa and colleagues
transfected HEK-293 cells with GFP-tagged RFT1. Both human and rat RFT1 proteins
localized to the plasma membrane. Further evidence supporting hRFT1 and rRFT1
localization in plasma membrane came from a Western blot analysis performed in crude
membrane and cell lysate preparations, probing for GFP-tagged RFT1. A strong signal
was detected in crude membrane fraction for both proteins; however, only a slight signal
was observed in cell lysate. In a later study, it was demonstrated that GFP-hRFT1 was
localized basolaterally in human intestinal Caco-2 and canine kidney MDCK polarized
epithelial cells (Veendamali et al., 2011). Together, these findings indicate that plasma
membrane is the primary site of RFT1 localization.
2.2.1.4 Functional Characterization
Yonezawa and colleagues showed that overexpression of hRFT1 and rRFT1 in
HEK-293 resulted in increased cellular accumulation of riboflavin. Riboflavin uptake was
reduced in the presence of riboflavin analogues, specifically FAD, FMN and lumiflavin.
Neither probenecid nor cimetidine had an influence on riboflavin uptake by the cells.
Riboflavin uptake in HEK-293 and Caco-2 cells was significantly reduced after hRFT1
siRNA transfection. Moreover, siRNA treatment of cells did not alter uptake of other
chemicals, including cimeditine. These observations underscored the involvement and
likely specificity of RFT1 in riboflavin transport.
Riboflavin transport by hRFT1 was also concluded to be independent of sodium,
pH and membrane potential. In addition, Michaelis-Menten kinetic analysis revealed the
apparent Km values for the uptake at pH 7.4 by HEK-293 and Caco-2 cells to be 28.1
nM and 63.7 nM, respectively (Yonezawa et al., 2008). Another set of experiments
determined the apparent Km value of hRFT1 in HEK-293 cells to be 1380 nM at pH 7.4
(Yao et al., 2010). The reason for the large discrepancy between the apparent Km
values reported by Yonezawa et al. and Yao et al. is unknown. Neither of the authors
commented on the sequence of the cDNA and whether any mismatches or mutations
were encountered.
2.2.1.5 RFT1 in Other Species
Homologues of hRFT1 were identified in other species by BLAST search in the

12
GenBank database (Moriyama, 2011). These include: mouse, chimpanzee, macaque,
and others. These RFT1 proteins exhibit over 69% identity and 91% similarity to hRFT1.
More specifically, mRFT1 shows 82% identity and 96% similarity to hRFT1. mRFT1 is a
450-amino acid protein, with inferred structure consisting of 11 putative transmembrane
domains (Figure 2).
2.2.1.6 Summary
In conclusion, RFT1 is likely to play a role in riboflavin transport, specifically in
the process of intestinal absorption and mother-to-fetus transfer of this vitamin.
Furthermore, research suggests that RFT1 shows no significant similarity to bacterial
riboflavin transporters; and therefore, RFT1 is currently classified as belonging to a
novel family of mammalian riboflavin transporters.
2.2.2 RFT2
Soon after Yonezawa et al. functionally characterized RFT1, a homologous
transporter was identified and termed RFT2 (Yamamoto et al., 2009).
2.2.2.1 Structure
Yamamoto et al. focused on characterization of rRFT2, which was identified by
BLAST searches of amino acid sequence of a novel bacterial candidate riboflavin
transporter impX (Vitreschak et al., 2002). rRFT2 consists of 463 amino acids, and
contains 11 potential transmembrane domains and a putative N-glycosylation site. It is
also 57% similar to rRFT1 (Yamamoto et al., 2009). Yamamoto and colleagues also
found a cDNA coding for an orthologous protein in humans, which was termed hRFT2.
hRFT2 has 469-amino acids with 83% similarity to rRFT2, and 42.9% identity with
hRFT1. Its function was later characterized by Fujimura et al. (2010).
2.2.2.2 Tissue Distribution
Analysis by Northern blot revealed high rRft2 mRNA expression in ileum, jejunum
and testis (Yamamoto et al., 2009). Moderate expression was observed in lung, kidney,
stomach and colon, while other organs - brain, heart, liver and skeletal muscle –
showed a low expression. Further analysis by RT-PCR detected rRft2 mRNA
expression in all of the above tissues; however small intestine, kidney and testis stood
out as the organs with the greatest expression.
RT-PCR analysis of hRFT2 mRNA revealed small intestine to have among the
highest expression, suggesting potential of this transporter in riboflavin absorption.

13
Figure 2. Inferred Structure of Mouse Riboflavin Transporter 1 (mRFT1). Hydropathy
analysis was performed using TMHMM 2.0 (http://www.cbs.dtu.dk/services/TMHMM-2.0/),
based on predicted mRFT1 protein sequence (NP_083919.1).

14
(Fujimura et al., 2010). Other organs, including placenta and testis, also showed high
mRNA levels of hRFT2. Moderate to low expression was noted in skeletal muscle,
kidney and stomach, while brain, lung, liver and colon showed no detectable signal. In a
different study, RT-PCR analysis confirmed the above pattern of hRFT2 tissue
distribution (Yao et al., 2010). In addition, prostate was identified as a tissue of high
expression, while spleen, thymus and uterus showed little to no expression. Currently,
no data are available about RFT2 distribution in the mammary gland.
2.2.2.3 Cellular Localization
Cellular expression of rRFT2 was examined via GFP-tagged rRFT2 (Yamamoto
et al., 2009). The signal localized to the plasma membrane of HEK-293 cells. Strong
signal was detected in crude membrane fractions using Western blot, indicating rRFT2
expression in cellular membranes. Interestingly, transfection with GFP-tagged rRFT2
revealed enhanced riboflavin uptake activity when compared to GFP-tagged rRFT1
transfected cells. These results suggest that rRFT2 may have a greater activity in
riboflavin transport than rRFT1.
Expression of GFP-rRFT2 in the polarized MDCKII canine renal tubular cell line
showed localization at the apical membrane (Fujimura et al., 2010). This observation
suggests the likely expression of rRFT2 at the brush border membrane in the small
intestine. In addition, rRft2 mRNA expression in the small intestine was upregulated in
rats fed a riboflavin-deficient diet (Fujimura et al., 2010), suggesting an adaptive
response to increase riboflavin absorption from the gut. Together, these observations
further implicate rRFT2 in riboflavin absorption from the intestinal lumen.
To visualize cellular expression of hRFT2, EGFP-tagged hRFT2 was transfected
into HEK-293 cells (Yao et al., 2010). Fluorescence was detected in the plasma
membrane. Additionally, Western blot indicated a strong signal for EGFP-tagged hRFT2
in crude membrane fractions. Subramanian et al. (2011a) showed GFP-hRFT2 to be
exclusively expressed at the apical membrane of the polarized human intestinal Caco-2
and canine kidney MDCK epithelial cells, implying a functional role and involvement of
hRFT2 in riboflavin uptake form the intestinal lumen.
Surface expression of hRFT2 was found to be determined by C-terminal
sequence, specifically by the conserved cysteine residues C463 and C467
(Subramanian et al., 2011b). Mutation of these residues resulted in significant reduction
of riboflavin uptake. This was further explained by retention of the mutated hRFT2 in the

15
endoplasmic reticulum. Furthermore, mutating an additional cysteine C386, predicted to
be involved in disulfide bridge formation with C463, resulted in intracellular retention of
hRFT2 (Subramanian et al., 2011b). Taken together, these findings suggest a crucial
role of specific cysteine residues in the C-terminus of hRFT2. Mutations in these
residues may be associated with loss of cell surface localization and function of hRFT2.
2.2.2.4 Functional Characterization
Riboflavin transport via rRFT2 was found to be Na+-independent and unchanged
by the cell potential. However unlike hRFT1, rRFT2-mediated transport was moderately
altered by pH, being more efficient under ambient acidic conditions (Yamamoto et al.,
2009). Kinetic analysis showed that rRFT2 transport was saturable (Vmax 11
pmol/min/mg protein), and had an apparent Km of 210 nM in transiently transfected
HEK-293 cells (Yamamoto et al., 2009).
Substrate specificity of rRFT2 was also assessed (Yamamoto et al., 2009). It was
found that riboflavin derivatives (lumiflavin, FAD and FMN) significantly lowered
riboflavin transport. Moreover, lumiflavin was found to have the highest affinity among
the riboflavin analogues for rRFT2, followed by FMN and then FAD. Nevertheless,
lumiflavin’s affinity was still about 5-fold lower than that of riboflavin, indicating that this
vitamin is likely the preferred substrate for rRFT2. Other chemicals, including folate and
cimetidine were found to have no inhibitory effect on riboflavin transport by rRFT2.
Similar characterization was performed for hRFT2 (Fujimura et al., 2010).
Efficiency of riboflavin transport was affected by pH, being optimal in the acidic range.
Replacement of sodium chloride with choline chloride in the medium did not result in
changes of hRFT2 riboflavin transport, suggesting a Na+-independent mechanism. A
slight reduction in riboflavin transport was noted with cellular membrane depolarization;
however, the biological significance of this observation remains unclear. Kinetic
analysis in HEK-293 showed riboflavin transport by hRFT2 to be saturable (Vmax 22
pmol/min/mg protein), with an apparent Km of 770 nM at pH 6. At pH 7.4 apparent Km
was reported to be 980 nM (Yao et al., 2010).
Similar to rRFT2, riboflavin uptake by hRFT2 was significantly reduced in the
presence of riboflavin derivatives, and unaffected by 1mM cimetidine and imipramine
(Fujimura et al., 2010). However, Yao et al. (2010) reported about 15% reduction in
riboflavin uptake in the presence of 1 mM cimetidine. In addition, non-riboflavin
derivatives ethidium and methylene blue also inhibited riboflavin transport in HEK-293

16
cells, yet to a lower extent (Fujimura et al., 2010).
Yamamoto et al. (2009) also showed that riboflavin transport activities of hRFT2
and rRFT2 exceeded those of hRFT1 and rRFT1. Similarly, Subramanian et al. (2011a)
reported that an increase of riboflavin uptake in HuTu-80 cells was significantly higher
than that seen with hRFT1 and hRFT3. These observations may indicate that RFT2
possesses a more dominant role in riboflavin transport and absorption than RFT1.
2.2.2.5 RFT2 in Other Species
RFT2 appears to be well conserved across different species, including mouse
and panda (Moriyama, 2011). In mouse, two isoforms of mRFT2 are present: 460- and
250-amino acid in length, respectively. These are thought to be produced by alternative
splicing, with the longer isoform being chosen as a canonical sequence. mRFT2 shares
90% identity with rRFT2.
2.2.2.6 Summary
RFT2 is likely another player in riboflavin transport within the cells and organisms.
Its expression and cellular localization suggest RFT2 involvement in riboflavin
homeostasis, particularly the absorption of this essential vitamin from the small intestine.
Overall, given the structural and functional similarities between RFT1 and RFT2, RFT2
is classified as a member of the RFT family of mammalian riboflavin transporters.
2.2.3 RFT3
Identification and functional characterization of hRFT3 followed shortly after the
other two members of the RFT family were discovered.
2.2.3.1 Structure
By searching for the human homolog of hRFT1, Yao et al. identified a sequence,
later termed hRFT3 (Yao et al., 2010). hRFT3 cDNA is 1451 base pairs long, and
encodes a 445-amino acid protein. Structurally, hRFT3 is predicted to have 10 putative
membrane-spanning domains. Furthermore, hRFT3 has 86.7% amino acid identity with
hRFT1, 44.1% with hRFT2, 81.5% with rRFT1, and 43.1% with rRFT2.
2.2.3.2 Tissue Distribution
RT-PCR analysis for hRFT3 expression in various human tissues revealed
strong expression in both fetal and adult brain, as well as salivary gland (Yao et al.,
2010). Tissues such as small intestine, liver, kidney and lung were found to have low
expression of hRFT3 mRNA. These observations suggest that hRFT3 may be more

17
important in brain homeostasis of riboflavin, rather than the absorption of this vitamin
from the gut. Currently, nothing is known about RFT3 distribution in the mammary gland.
2.2.3.3 Cellular Localization
Cellular localization of hRFT3 was investigated by two different groups. Yao et al.
(2010) introduced EGFP-tagged hRFT3 into HEK-293 cells. Subsequent fluorescence
was observed mainly in the plasma membrane of transfected cells. When localization of
GFP-hRFT3 was examined by Subramanian et al. (2011a) in polarized epithelia –
intestinal Caco2 and renal MDCK, hRFT3 was found predominantly within the
intracellular vesicles, with some expression detected at the basolateral membrane.
Such observations suggest that regulatory processes may be in place, which mediate
hRFT3 translocation to and from the basolateral membrane, thereby maintaining
riboflavin homeostasis and transport within the epithelial cells.
2.2.3.4 Functional Characterization
Riboflavin uptake was significantly increased following HEK-293 transfection with
hRFT3. In addition, riboflavin transport by hRFT3 was found to be Na+-independent.
Similar to hRFT1, no pH dependency for hRFT3-mediated riboflavin uptake was
observed (Yao et al., 2010).
Uptake studies conducted in HEK-293 cells revealed an apparent Km for hRFT3
to be 330 nM, and a Vmax value of 5.2 pmol/min/mg protein (Yao et al., 2010). Similar to
other RFT, riboflavin uptake by hRFT3 was significantly reduced in the presence of
riboflavin and its analogues, while 1mM folate and probenecid had no effect on this
vitamin’s uptake in HEK-293 cells. Interestingly, both thiamine and cimetidine at 1 mM
were found to reduce riboflavin uptake by about 20% (Yao et al., 2010).
2.2.3.5 RFT3 in Other Species
Unlike with the other RFT, no homologues of hRFT3 are identified in rodent
species. The only reported species to possess these homologues are chimpanzee and
gibbon (Moriyama, 2011).
2.2.3.6 Summary
hRFT3 is the most recently identified member of the RFT family of mammalian
riboflavin transporters. Its high mRNA expression in the brain suggests that hRFT3 may
have a role in brain riboflavin homeostasis. Moreover, hRFT3 is similar in sequence to
hRFT1, but shows less similarity to hRFT2.

18
2.2.4 Differential Expression and Function of RFT
Subramanian et al. (2011a) investigated the expression patterns and functional
activity of the three human RFT in polarized epithelia. Their findings are summarized
below.
Cellular localization of hRFT1 was primarily to the basolateral membrane in
Caco-2 and MDCK cells, while hRFT2 was exclusively found at the apical domain of
these cells. Distinctively, hRFT3 was mainly expressed in the intracellular vesicular
structures, with some expression at the basolateral membrane of some cells
(Subramanian et al, 2011a). These observations suggest RFT alone may form a
transporter network necessary for absorption and trans-epithelial transport of riboflavin,
thereby regulating vitamin B2 homeostasis.
Assessment of relative amounts of hRFT mRNA in differentiated Caco-2 cells
and native human small intestine revealed that hRFT2 mRNA levels were significantly
higher than those of hRFT1 and hRFT3 (Subramanian et al, 2011a). Coupled with the
observations that riboflavin uptake in HuTu-80 cells was significantly higher in the
presence of hRFT2 than with either hRFT1 or hRFT3 (Subramanian et al, 2011a), it is
possible that hRFT2 plays a chief role in riboflavin absorption and transport, at least in
the small intestine.
2.2.5 RFT and Disease
Although very little is known about association of RFT with diseases, a few
studies have linked RFT with certain conditions.
2.2.5.1 Esophageal Squamous Cell Carcinoma and hRFT2
A genome-wide association study of esophageal squamous cell carcinoma
(ESCC) was conducted in a Chinese population (Want et al., 2010). The study identified
a novel locus of susceptibility, corresponding to single nucleotide polymorphisms
(SNPs) in the hRFT2 gene.
Riboflavin deficiency may contribute to the risk of developing certain cancers,
specifically increasing the risk of ESCC (Siassi and Ghadirian, 2005). In addition,
riboflavin supplementation has been reported to reduce the risk of ESCC (He et al.,
2009).
Therefore, an association between hRFT2 and ESCC seems plausible;
especially given the information that hRFT2 may be predominantly apically-located in

19
the intestinal cells and more effective in transporting riboflavin than its orthologs.
Nevertheless, functional characterizations of hRFT2 and ensuing associations are
needed to be explored further.
2.2.5.2 Maternal riboflavin deficiency and hRFT1
Ho and colleagues (2010) have described a case of a newborn female, who
presented with biochemical and clinical symptoms of multiple acyl-CoA dehydrogenase
deficiency (MADD). Riboflavin supplementation corrected this deficiency. Further
investigations have revealed that the mother was riboflavin deficient, suggesting the
likely reason for newborn’s MADD.
Investigators went further, and screened the mother for possible mutations in
hRFT1 and hRFT2 (hRFT3 was not characterized at the time). Two missense variations
were identified in hRFT1; however, in vitro functional analysis showed that riboflavin
transport was not affected by these variations. Additional analysis revealed a deletion in
the hRFT1 gene in one of the maternal alleles. It was concluded that maternal
haploinsufficiency may result in riboflavin deficiency in both the nursing mother and the
newborn.
Although this is a case-report study, it may lead to further investigations of the
reasons behind riboflavin deficiency and potential associations with MADD.
2.2.5.3 Brown-Vialetto-Van Laere Syndrome and hRFT2
The hRFT2 mutations were identified in patients with a rare neurological disorder
- Brown-Vialetto-Van Laere syndrome, characterised by progressive ponto-bulbar palsy
and bilateral sensorineural hearing loss (Bosch et al., 2010). In a different study, the
same syndrome was also associated with hRFT2 (Green et al., 2010). However, both
studies neglected to assess hRFT1 and hRFT3 in their genetic analyses, and possible
contributions of these genes to disease etiology. In order to further validate these claims,
a functional analysis of the identified mutations is necessary.
2.3. BREAST CANCER RESISTANCE PROTEIN
2.3.1 The ABC Transporter Superfamily
The ATP-binding cassette (ABC) transporters are a superfamily of active
transport proteins (Higgins, 1992). They are present and plentiful in genomes of both
eukaryotes and prokaryotes (Davidson and Chen, 2004; Annilo et al., 2006; Robey et al.,
2009). Interestingly, in eukaryotic cells ABC transporters are almost always efflux

20
transporters, transporting substrates from cytoplasm out of the cell (Robey et al., 2009).
Also, the function of almost all ABC transporters is thought to involve ATP hydrolysis.
In the human genome, there are 48 ABC transporter genes (Robey et al., 2009).
The transporters are classified into subfamilies, based on the conservation of ATP-
binding domains or nucleotide-binding folds (NBF) (Robey et al., 2009). Seven of eight
eukaryotic subfamilies (A through G) are present in the human genome.
ABCG2, or breast cancer resistance protein (BCRP), is a highly conserved
member of the ABC transporter superfamily. This gene has been found in all sequenced
vertebrates, including fish and chicken (Annilo et al., 2006).
Other ABC members include p-glycoprotein (ABCB1, Pgp) and multidrug
resistance-associated proteins (ABCC, MRP). Pgp is known to function as a drug
transporter, assisting in xenobiotic elimination (Ito and Alcorn, 2003). Pgp was reported
to be expressed in both non-lactating and lactating mammary glands (van der Valk et al.,
1990; Alcorn et al., 2002). Interestingly, lactation seems to down-regulate Pgp mRNA
levels (Alcorn et al., 2002).
MRPs comprise another subfamily of transporters in the ABC superfamily (Dean
et al., 2001). Several proteins, specifically MRP1, MRP2 and MRP5 have been reported
to be expressed in the mammary gland. However, the precise localization of MRPs in
the mammary gland is unclear (Ito and Alcorn, 2003).
2.3.2 BCRP Structure
The human BCRP gene is located on chromosome 4 and contains 16 exons and
15 introns (Robey et al., 2009). BCRP is a 72 kDa protein, consisting of 665 amino
acids. BCRP is predicted to have six transmembrane segments and an extracellular
loop between the fifth and sixth segment. The BCRP gene encodes a “half transporter”,
since only one NFB and ATP-binding domain are present in BCRP, compared to two
each in most other ABC proteins. It is suggested that BCRP may homodimerize or
oligomerize in order to function (Ozvegy et al., 2001; Kage et al., 2002; Henriksen et al.,
2005; McDevitt et al., 2006).
2.3.3 BCRP Substrates
To date, many BCRP substrates have been identified (Table 2). However, no
clear structure-function relationship is observed among these chemicals (Robey et al.,
2009). One of the first discovered substrate groups for BCRP was chemotherapeutic

21
Table 2. Select BCRP substrates
Drug Class Substrate
Antivirals Zidovudine
Abacavir
Dietary carcinogens
Aflatoxin B1
PhIP
Dipyridamole
Antibiotics
Ciprofloxacin
Erythromycin
Nitrofurantoin
Chemotherapeutic drugs
Topotecan
Doxorubicin
Other drugs
Cimetidine
Riboflavin
Glyburide

22
agents, including imatinib, mitoxantrone, topotecan and others (Polagar et al., 2008).
Other drug classes have also been shown to be BCRP-substrates, such as antivirals,
carcinogens and flavins (Jonker et al., 2005; Robey et al., 2009). Therefore, BCRP is
considered to be a promiscuous cellular efflux pump with a broad spectrum of
xenobiotic and endobiotic substrates.
2.3.3.1 Cimetidine
Because cimetidine was used as a model drug to investigate Bcrp transport of
riboflavin in vivo (see Hypotheses and Rationale), a brief summary of pertinent
information is provided below.
Cimetidine is a histamine H2-receptor antagonist, used to treat peptic ulcers and
gastric hypersecretory conditions. Oral bioavailability of cimetidine is 65-80%, with 20%
plasma protein binding and an apparent volume of distribution of 1-2 L/kg. Cimetidine
clearance occurs mainly via the kidney, with about 20% undergoing metabolism, and its
half-life in adults is about 2 hours (Bennett et al., 1996). In humans, metabolites of
cimetidine include sulfoxide, hydroxymethyl and guanyl urea derivatives (Figure 3).
In both rodents and humans cimetidine is transported into milk. In FVB mice,
milk-to-plasma (MP) ratio at 30 minutes was reported to be about 13 (Jonker et al.,
2005). In Sprague Dawley rats milk-to-serum ratios of about 29 were recorded
(McNamara et al., 1996), or in other words drug concentration in the milk is 29 fold
higher as compared to plasma levels (See section 5. Mammary Gland). In humans, MP
ratios range from 3 to 11, depending on the time since last dose administration
(Somogyi and Gugler, 1979). Comparable mean observed milk-to-serum ratio for
humans is reported to be 5.77 (Oo et al., 1995).
2.3.4 Cellular Localization, Tissue Expression and Function
Upon its discovery, cellular localization and tissue expression of BCRP were
investigated. It was determined that BCRP was expressed on the apical membrane of
epithelial cells, and involved in an efflux transport of substrates out of the cells Vlaming
et al., 2009). Northern blot analyses revealed high to moderate levels of BCRP mRNA
in placenta, brain, prostate, testis, kidney, liver, small and large intestine. Low or absent
expression was reported for heart, lung, pancreas, skeletal muscle, spleen, peripheral
blood leukocytes and thymus (Doyle et al., 1998; Fetsch et al., 2006).

23
24
A number of studies have investigated the functional role of BCRP in the organs
of high expression. Below follows a brief summary of these investigations.
2.3.4.1 Placenta
Placental BCRP is thought to have a protective effect for the fetus, transporting
drugs and other potential toxins from the fetal to the maternal side (Jonker et al., 2000;
Zhang et al., 2007). Placental perfusion studies in both rats and humans suggest that
BCRP removes toxins from the fetal space (Staud et al., 2006; Myllynen et al., 2008). In
addition, studies have shown that BCRP limits fetal penetration of glyburide (Gedeon et
al., 2008; Zhou et al., 2008), an antidiabetic drug used in treatment of gestational
diabetes (Moore, 2007).
2.3.4.2 Gastrointestinal Tract
Further investigations of BCRP expression in small and large intestines revealed
highest expression in the duodenum, followed by decreasing levels along the
gastrointestinal tract, from ileum to the rectum (Gutmann et al., 2005).
Multiple studies suggest that BCRP in the gastrointestinal tract can limit the oral
absorption of its substrate xenobiotics. For instance, Bcrp knock-out mice were shown
to have increased intestinal uptake of quercetin (Sesink et al., 2005), sulfasalazine
(Zaher et al., 2006), dietary carcinogen PhIP (Jonker et al., 2005), and nitrofurantoin
(Merino et al., 2005) as compared to wild-type mice.
2.3.4.3 Brain and Testis
BCRP functions in both blood-testis barrier and blood–brain barrier. A study
conducted in BCRP-deficient mice suggests a protective role of this transporter for germ
cells (Enokizono et al., 2008). In the brain, BCRP was shown to localize to the micro-
vessel endothelium (Cooray et al., 2002), suggesting brain to blood transfer of BCRP-
substrates. For example, penetration of imatinib, a BCRP-substrate xenobiotic, through
the brain-blood barrier was enhanced in Bcrp knock-out mice (Oostendorp et al., 2008).
2.3.4.4 Kidney and Liver
Due to the major drug elimination activities of liver and kidney, BCRP functional
variation in those tissues may affect the pharmacokinetics of many drugs by changing
their clearance.
In the kidney, BCRP was reported to localize to the kidney cortical tubule (Fetsch
et al, 2006) and the proximal tubule brush border membrane (Huls et al., 2008). In
addition, findings that sulfates (Mizuno et al., 2004; Mizuno et al., 2007) have an

25
impaired renal clearance in Bcrp knock-out mice suggest the possible role of this
transporter in renal drug elimination.
In the liver, BCRP localized to the canalicular membrane (Maliepaard et al.,
2001). In addition, BCRP expression was noted in the bile ducts and endothelium
(Vander Borght et al., 2006), as well as luminal membrane of gall bladder epithelial cells
(Aust et al., 2004). Biliary excretion of many xenobiotics was impaired in BCRP-deficient
animal models (Hirano et al., 2005; Merino et al., 2005; Enokizono et al., 2007),
providing support for a potential role of BCRP in hepatic drug clearance.
2.3.4.5 Mammary Gland
Recent studies indicated that BCRP is also expressed in mammary glands of
human, mouse, sheep and cow (Jonker et al., 2005). Mammary expression of BCRP is
induced in pregnancy and lactation, with levels decreasing after weaning (Jonker et al.,
2005). BCRP is found on the apical side of alveolar epithelium, where it secretes its
substrates into milk, thereby exposing suckling newborns to various xenobiotics (Jonker
et al., 2005; van Herwaarden et al., 2006).
BCRP upregulation in the lactating mammary gland suggested a potential
endogenous role for this transporter. More specifically, it was hypothesized that BCRP
may play a role in nutrient transfer from mother to infant (Vlaming et al., 2009).
Van Herwaarden and colleagues ( 2007) were able to show that milk secretion of
riboflavin was reduced by 60-fold in Bcrp −/− mice as compared to wild type mice .
Furthermore, levels of FMN were reduced 6-fold, suggesting that this cofactor may also
be a substrate for BCRP. Yet, pups from Bcrp −/− mothers did not show any signs of
riboflavin deficiency. The authors suggested that the most likely explanation for this
observation is the fact that the transport into the milk of FAD, the other riboflavin-derived
cofactor, was not perturbed in Bcrp −/− mothers.
Levels of other vitamins in milk of Bcrp −/− mice were also analyzed (van
Herwaarden et al., 2007). Biotin (Vitamin B7) was decreased in the milk of knock-out
animals by 3.5 fold. Interestingly, folic acid levels were found unchanged in both wild-
type and Bcrp −/− mice (van Herwaarden et al., 2007), even though folate was shown to
be transported by BCRP in vitro (Assaraf, 2006).
Overall, BCRP transport of riboflavin in milk appears to be the most affected in
Bcrp −/− mice. The lack of developmental abnormalities associated with riboflavin
deficiency in the pups fed by Bcrp −/− mothers suggests that there may be multiple

26
pathways available for transporting vitamin B2-derived cofactors into the milk.
Nevertheless, as a transporter initially thought to have no known endogenous role, Bcrp
may be essential for mammary transfer of nutrients into the milk.
2.3.5 Cancer and BCRP
BCRP expression in cancer cell lines has been associated with drug resistance
(Robey et al., 2009). Therefore, various studies have tried to determine the role of
BCRP in cancer patients. It has been noted that BCRP may confer drug resistance in
leukemia (Ross et al., 2000; Benderra et al., 2004). However, this issue is still
controversial (Robey et al., 2007). It has been suggested that BCRP may have a role in
chemotherapeutic resistance of solid tumours in the digestive tract, endometrium and
lung (Diestra et al., 2002). Although breast cancer has been the most researched,
BCRP expression is usually reported to be low (Robey et al., 2007).
2.4. THE MAMMARY GLAND
Mammary gland consists of two components: the parenchyma and the stroma.
The parenchyma is a collective term applied to the alveoli and branching ductal system
within the gland. Two main cell types are found in the mammary ducts: inner epithelial
cells and outer myoepithelial cells. The stroma, made mainly of adipose, serves as both
the support and the substrate for parenchymal growth (Howard and Gusterson, 2002;
Richert et al., 2000).
2.4.1 Human Breast
2.4.1.1 Anatomy and Development of the Human Breast
2.4.1.1.1 Prenatal Stage
In both males and females, breast development starts pre-natally at about 7 to 8
weeks post-conception. At this point, only tissue thickening could be observed. At 12 to
16 weeks breast components begin to emerge: some cells become the foundation for
mammary ducts and glands, while others differentiate into muscles of nipple and areola.
In late pregnancy, maternal hormones stimulate formation of ducts in the fetus. These
hormones even stimulate the lobules, the milk producing glands, to secrete colostrum.
This phenomenon subsides shortly after birth (Howard and Gusterson, 2002; Lawrence,
2005b; Hens and Wysolmerski, 2005).

27
2.4.1.1.2 Postnatal Stages
Until puberty, no difference can be observed between male and female breasts.
However at puberty, release of estrogen followed by progesterone stimulates further
development of female breast. Mature female breast is then comprised of four main
structures of lobules (glands), fat, milk ducts and connective tissue (Lawrence, 2005b,
Watson and Khaled, 2008).
Mammary alveoli are the basic units of mammary gland. They are lined with
cuboidal cells (milk-secreting cells) and surrounded by contractile myoepithelial cells
(similar to structures described in Section 2.4.2). Alveoli are grouped together to form
lobules, which are further grouped into larger structures are known as lobes. The lobes
empty into lactiferous ducts. These structures lined with non-secreting columnar
epithelium. Lactiferous ducts dilate within the areola to form lactiferous sinuses,
structures which allow for milk accumulation during lactation. The lobes are surrounded
by stroma, a structure consisting of adipose, connective tissue, vasculature and
lympatics (Howard and Gusterson, 2002; Lawrence, 2005b, Watson and Khaled, 2008).
With age and at menopause, estrogen levels drop in women. As a result, the
lobules involute and are replaced with fatty tissues, thereby loosing their support
(Howard and Gusterson, 2002).
2.4.1.1.3 Human Breast during Pregnancy and Lactation
Elevated levels of hormones, such as progesterone and estrogen, have a
dramatic effect on breast development during pregnancy (Page and Anderson, 1987).
The mammary gland enlarges due to an increased proliferation of parenchymal
(epithelial) cells, as well as due to the distension of the alveoli. And although the alveoli
are able to secrete milk proteins in mid-gestation, this event is delayed by high levels of
progesterone and ensues at parturition (Neville, 2001).
The lactating breast is composed of more epithelial cells, as a result of
proliferation in pregnancy, and less adipose tissue surrounding the lobes (Lawrence,
2005b). At weaning, the suckling stimulus is terminated, and the breast undergoes
involution. Here, the excess secretory epithelia are removed by apoptosis, and replaced
by fat. The breast returns to its pre-pregnancy state: few acini and ducts remain and are
dispersed throughout the adipose tissue (Howard and Gusterson, 2002).

28
2.4.1.2 Breastfeeding and Human Breast Milk
2.4.1.2.1 Benefits of Breastfeeding
Numerous advantages of breastfeeding are documented in the literature. Studies
have shown that breastfeeding can positively impact infants’ health and development.
For instance, breast milk was reported to lower the risk of infections associated with
diarrhea (Dewey et al., 1995), otitis media (Owen et al., 1993), pneumonia (Write et al.,
1989), meningitis (Cochi et al., 1986) and necrotizing enterocolitis (Lucas and Cole,
1990). In addition, higher cognitive function has been reported in individuals breastfed
as children (Lucas et al., 1992; Mortensen et al., 2002; Kramer et al., 2008). Moreover,
breast milk may modulate immune function, and has been noted to lower the risks of
type 1 diabetes mellitus (Mayer et al., 1988; Samuelsson et al., 1993) and Crohn’s
disease (Koletzko et al., 1989). Additionally, breastfeeding is associated with reduced
incidence of breast cancer among women (Stuebe et al., 2009).
2.4.1.2.2 Human Breast Milk Composition
Breast milk is composed of numerous components, including proteins, lipids,
carbohydrates, water-soluble vitamins and cellular components (Table 3) (Picciano,
2001; Lawrence, 2005c). Milk composition is not fixed and varies among women
depending on the stage of lactation and maternal nutrition (Picciano, 2001).
Following parturition, the initial breast milk is known as colostrum, a thick
yellowish fluid. Colostrum is high in proteins and water-soluble minerals and vitamins,
while fat content is low. As breast milk matures, levels of fat, lactose and fat-soluble
vitamins increases, while protein levels drop (Hibberd et al., 1982; Lawrence, 2005c).
2.4.1.2.3 Cells in Human Breast Milk
Mammary secretions collected at different stages of lactation contain various cell
populations, including neutrophils, macrophages, lymphocytes and epithelial cells (Ho et
al., 1979; Brooker, 1980; Boutinaud and Jammes, 2002). The highest number of cells is
present in colostrum, and decreases as lactation continues. Similarly, the cells of the
immune system show a decreasing pattern as nursing progresses. However, the
proportion of epithelial cells in relation to total cell content increases from colostrum to
mid-lactation (Ho et al., 1979; Brooker, 1980; Boutinaud and Jammes, 2002).
Epithelial cells and their fragments are shed into milk during the lactation
(Boutinaud and Jammes, 2002; Maningat et al., 2009). Most of these epithelial cells can
be identified as alveolar cells (Boutinaud and Jammes, 2002). As a result, numerous

29
Table 3. Composition of Human Breast Milk
Category Components
Lipids Fatty acids
Triglycerides
Carbohydrates Lactose
Oligosaccharides
Minerals
Calcium
Chlorine
Sodium
Potassium
Vitamins
Vitamin C
Choline
B vitamins
Fat-soluble vitamins
Nitrogen compounds Carnitine
Urea
Cells
Leukocytes
Epithelial cells
Neutrophils
Macrophages
Proteins
Caseins
Peptide hormones
Growth factors
Immunoglobulins
Lactalbumins

30
studies were able to isolate RNA from the milk cells in order to describe potential gene
regulatory processes in the mammary gland (Smith-Kirwin et al., 1998; Alcorn et al.,
2002; Maningat et al., 2009). Because studying the human breast during lactation is
exceedingly difficult (Howard and Gusterson, 2002), this method is currently the least
invasive way in trying to understand gene expression and regulation in the human
mammary gland epithelia.
Until recently, RNA was isolated from the cell pellet obtained from centrifuged
milk samples (Smith-Kirwin et al., 1998; Alcorn et al., 2002). However, the result
interpretation of results was complicated by the presence of various cell types in the
pellet. A novel method of studying human mammary epithelial cells was proposed by
Maningat et al. (2007). It was known that milk fat was secreted through a budding
mechanism, which could potentially bring along cytoplasmic portions of mammary
epithelial cells enveloped in plasma membrane (Huston and Patton, 1990). In other
words, some milk fat globules (mainly triglycerides surrounded by lipid bilayer) were
found to contain epithelial cell cytoplasmic fractions. Based on these observations,
Maningat and colleagues (2007) were able to show that RNA isolated from the milk fat
globules was likely coming from the mammary epithelial cells, as suggested by the
expression of mammary epithelial specific genes, such as milk-protein related genes.
2.4.1.2.4 Breastfeeding and Maternal Drug Therapy
Studies have shown that drugs can be excreted into breast milk via different
mechanisms, including passive diffusion (Miller et al., 1967; Rasmussen, 1958) and
carrier-mediated transport (Oo et al., 1995; McNamara et al., 1996; Gerk et al., 2001).
The amount of drug excreted depended on the ionization of the drug, plasma protein
binding, lipophilicity, molecular weight, and maternal pharmacokinetics. In general, drug
excretion into milk is enhanced for low plasma protein bound and low molecular weight
drugs, as wells as lipophilic and cationic drugs (Ito, 2000). Lower pH and higher lipid
content of milk as compared to plasma contribute to these observations (Ito and Lee,
2003).
Milk-to-plasma (MP) ratio is the ratio of drug concentration in breast milk as
compared to drug concentration in maternal plasma. MP ratio can vary significantly over
post-dose time, and therefore, is often represented as a time-averaged ratio (Ito, 2000).
Most drugs have an MP ratio of 1 or less, and only about 15% of drugs have MP ratios
greater than 2 (Ito and Koren, 1994). Although an MP ratio greater than 1 indicates that

31
the drug is accumulated in breast milk, the implications of such an observation may be
clinically insignificant. For instance, if the infant ingested amount of drug is substantially
lower than that required for therapeutic purposes, then regardless of the MP ratio of the
drug the level of exposure would be considered minimal (Ito and Lee, 2003). Therefore,
the evaluation of drugs’ MP ratios should be conducted in reference with other factors in
order to gain clinical insight.
While many drugs are known to be safely taken by nursing mothers, few
epidemiological studies have looked at adverse effects in breastfed infants as a
consequence of maternal drug therapy. In a follow-up study of 838 breastfed infants
exposed to a variety of drugs through maternal milk, 1 in 10 women reported alterations
in their infants’ condition. Nonetheless, none of these infants required medical attention
(Ito et al., 1993). However, numerous case reports have indicated possible infant
toxicity as a result of maternal drug therapy (Matheson et al., 1985; Chasnoff et al.,
1987; Schimmel et al., 1989; Lester et al., 1993; Frey et al., 1999; Madadi et al., 2009).
It is, therefore, not surprising that breastfeeding may reduce maternal adherence to
drug therapy (Ito and Lee, 2003). Currently, there are no intervention strategies to
decrease drug excretion into milk.
2.4.2 Anatomy and Development of the Mouse Mammary Gland
Among different mammals, anatomy and development of mouse mammary gland
is perhaps the best understood and characterized (Hovey et al., 1999; Richert et al.,
2000). It bares noteworthy similarities with human mammary gland, which also make
mouse a suitable model.
2.4.2.1 Prenatal Development
At embryonic days 10-11 mammary streak appears. It extends from the posterior
to anterior limb bud, and is a result of the ectodermic enlargement. By day 12, an
epithelial bud, a mammary rudiment, becomes visible. It increases in size and takes on
a bulb-like shape. On day 16, rapid epithelial proliferation occurs, forming a mammary
sprout, which penetrates the mammary fat pad precursor tissue. This growth continues
until birth, forming a rudimentary ductal system (Richert et al., 2000).
2.4.2.2 Postnatal Development
At approximately three to six weeks of age, mouse mammary ducts begin to
grow rapidly. Highly proliferative structures, known as terminal end buds (TEB), are

32
located at the ends of ductal branches, and are responsible for this fast expansion.
TEBs are composed of two cell types. The cap cells, found on the outside, interact with
the surrounding stroma, and later differentiate into myoepithelial cells of the mature duct.
The body cells, found inside the TEBs, differentiate into ductal epithelial cells. Ductal
development is slowed down, as the mouse matures, and TEBs form terminal ducts. By
10-12 weeks, the majority of postnatal mammary development has occurred, and
alveolar buds are visible (Figure 4, A). These alveolar buds will fully differentiate in
pregnancy (Richert et al., 2000; Sternlicht, 2005).
2.4.2.3 Pregnancy, Lactation and Involution
Initially, pregnancy induces rapid proliferation of ductal branches and formation of
additional alveolar buds. In mid-pregnancy, alveolar buds differentiate into alveoli, the
ultimate structure of milk secretion. By late pregnancy, alveoli are visible throughout the
mammary fat pad and the ratio of epithelia to adipocytes increases drastically (Richert
et al., 2000).
Mammary gland continues to grow in early phases of parturition. As lactation
establishes, mammary adipocytes are metabolized and alveolar epithelia expand within
the mammary gland (Figure 4, B) (Rillema, 1994; Richert et al., 2000).
After weaning, the mammary gland goes through a process termed involution.
Involution is a process of cell death and remodeling (Quarrie et al., 1996). Initially,
involution is reversible (Li et al., 1997; Furth, 1999). However, 2 days after suckling
cessation the process is irreversible. Here, the apoptosis of secretory epithelial cells is
followed by the degradation of lobular structures and mammary basement membrane
(Strange et al., 1992). By day 6 of involution, epithelium and stroma are being
rearranged (Figure 4, C) (Richert et al., 2000).
2.4.2.4 Species Differences
As described above, there are many similarities between human and mouse
mammary gland development, structure and function. In addition, relative ease of
manipulation and short gestation term (18-21 days) make mouse an acceptable and
representative model to study human mammary gland physiology and pathology.
Nevertheless, there exist species differences in mammary gland morphogenesis
that are worth mentioning. For example, human mammary parenchyma undergoes a
more profound lobulation during development when compared to that of a mouse
(Hovey et al., 1999). In addition, cellular composition and stromal architecture is specie-

33
A. Virgin
B. Lactating
C. Involuting
Figure 4. Hematoxylin and Eosin Staining of Mammary Glands: (A) 10-week-old virgin mouse, (B)
1-week lactating mouse, (C) 1-week involuting mouse; magnification, x10. Mammary glands were
isolated from FVB/N mice and fixed in 10% PFA overnight. Tissues were stained with hematoxylin,
followed by washing and eosin counterstain. Tissues were dehydrated in 95% and absolute alcohols, to
remove excess eosin. Samples were mounted on the slides and scanned using Aperio ScanScope.
Mammary epithelial cells are stained in deep purple.

34
specific, providing a unique regulatory pattern of mammary development in humans and
mice (Hovey et al., 1999). Furthermore, unlike the identical in utero mammary
development in human males and females, in male mice testosterone induces
condensation of mammary epithelium, resulting in irregular mammary shape, and
therefore, a distinction between developing male and female mice (Kratochwil and
Schwartz, 1973; Richert et al., 2000).
Another obvious difference is the number of mammary glands: humans have one
pair, while most mouse strains have 5 pairs, 3 thoracic and 2 inguinal (Cardiff and
Wellings; 1999). The ductal system is also more complex in humans: a single nipple
may contain five to ten lactiferous ducts, which branch in a radial pattern. In contrast, a
single lactiferous duct marks the termination of mammary structure in rodents (Cardiff
and Wellings; 1999).
Overall, mice are suitable models for studying mammary development and
functions. However, caution is advised when directly extrapolating from mice to humans,
as multiple species differences exist.
3. STATEMENT OF RESEARCH HYPOTHESES
Central Hypothesis: Riboflavin inhibits BCRP-mediated drug excretion into the milk.
Specific Hypotheses:
1. RFT are expressed in the mammary gland, and their expression is
upregulated in lactation.
2. RFT are expressed on the plasma membrane of mammary epithelia.
3. Riboflavin reduces the excretion of BCRP-substrate xenobiotic cimetidine
into the milk in FVB/N mice.
4. OBJECTIVES
4.1 Characterize temporal and spatial profiles of mammary RFT in:
1. Mouse and human mammary epithelial cell lines
2. Human mammary cells (cells from the breast milk)
3. Mouse mammary glands and epithelial cells
4.2 Characterize riboflavin-cimetidine interaction in the mouse mammary
gland in vivo:
Using high dose riboflavin intervention as treatment, evaluate the levels of
radiolabelled cimetidine in milk and plasma of treated and control mice

35
5. RATIONALE
Riboflavin is one of the most concentrated vitamins in the milk, by about 100-fold
compared to plasma levels (Lawrence, 2005a; Hustad et al., 2000). Given this vitamin’s
substantial milk transfer, the lactating mammary gland is likely to possess a riboflavin
transport system. Indeed, luminally expressed mammary BCRP was shown to pump
riboflavin into milk, in addition to its other substrate drugs and toxins (cimetidine, PhIP,
aflatoxin B1, etc.). At present, the riboflavin uptake system on the basal side of the
mammary gland is unknown. Recently characterized riboflavin transporters or RFT are
possible candidate proteins for this role. Therefore, temporal and spatial profiles of RFT
in the mammary gland and its models are explored in this thesis.
BCRP plays a major role in excretion of drugs and toxins into the milk. Therefore,
an intervention strategy to decrease BCRP-transported xenobiotic excretion into breast
milk may be possible. One approach might be to inhibit BCRP function systemically.
However, this may not only reduce milk levels of BCRP substrates, but also increase
systemic levels of these drugs. The latter outcome may not be clinically desirable,
although dose alterations may evade the problem. A different approach is a mammary-
selective competition between BCRP substrates, using a high-dose riboflavin
intervention. In this scenario, the mechanism of mammary accumulation of riboflavin is
exploited to saturate BCRP transport function with riboflavin; thereby, reducing BCRP-
mediated xenobiotic transport into the breast milk. This approach is investigated in vivo
in this thesis. If this concept is shown to be valid, this may open a door to a clinical
strategy for reduction of drug and toxin transfer into breast milk.
Overall, understanding riboflavin transport in the mammary gland is in itself
important. Acquiring further knowledge on potential manipulation of mammary
xenobiotic transport in order to reduce excretion of xenobiotics into milk may have
potential implications for breastfeeding mother-infant pairs.

36
MATERIALS AND METHODS
1. MATERIALS
Tritiated cimetidine was purchased from American Radiolabeled Chemicals (St.
Louis, MO). All secondary antibodies were purchased from Invitrogen (Burlington, ON).
Microvette 0.3 mL lithium-heparin blood collection tubes were purchased from Braintree
Scientific (Braintree, MA). All other chemicals were purchased from Sigma-Aldrich
Canada, unless otherwise specified.
2. CELL CULTURE
2.1 Cell Lines and Maintenance
All cell lines were obtained from the American Type Culture Collection (ATCC)
(Rockville, MD). EMT6 cells were grown in DMEM and 15% fetal bovine serum. HC11
cells were grown in RPMI 1640 medium supplemented with 10% FBS, 5ug/mL insulin,
and 10ng/mL epidermal growth factor. T47D cells were grown in RPMI 1640 medium
containing 10% BSA. MCF10A cells were grown in a 1:1 mixture of DMEM and Ham’s
F12 medium containing 20 ng/mL epidermal growth factor, 100 ng/mL cholera toxin,
0.01 mg/mL insulin, 500 ng/mL hydrocortisone and 5% horse serum.
All cells were maintained at 37ºC under atmospheric mixture of 5% CO2 and 95%
air. Medium was replaced 2-4 times per week. The cells were subcultured using 0.05%
trypsin when reaching 75-100% confluency.
Because the effect of underlying cellular pathology on RFT expression could not
be ruled out, both tumourigenic (EMT6 and T47D) and non-tumorigenic (HC11 and
MCF10A) mammary epithelial cell lines were used. In addition, these cell lines vary in
their degree of cellular differentiation, thereby providing the means for the evaluation of
the potential differences in RFT expression, based on the state of mammary
differentiation. For instance, T47D cells represent a fully differentiated mammary ductal
epithelial cell model, while HC11 cells are undifferentiated epithelia used as a model of
mammary lactogenic differentiation.
2.2 Total RNA Isolation
Total RNA was isolated from the cells by using RNeasy Mini Kit (Qiagen;
Valencia, CA). The procedure was conducted according to the RNeasy Mini information
handbook. In brief, cells were grown in a monolayer (70% - 80% confluency) on a 6-well
plate. Cell-culture medium was aspirated, and buffer RLT was added to lyse the cells.

37
350 uL of cell lysate was pipetted into a QIAshredder spin column placed in a 2 mL
collection tube, and centrifuged for 2 min at full speed. 350 uL of 70% ethanol was
added to homogenized lysate. 700 μl of the sample was transferred to an RNeasy spin
column. Flow-through was discarded. Next, 700 μl of buffer RW1 was added to the
RNeasy spin column and centrifuged for 15 s at 8000 x g, to wash the column
membrane. Then, 500 μl of buffer RPE was added to the RNeasy spin column, and
centrifuged for 15 s at 8000 x g; flow-through was discarded. This step was repeated
once more, to ensure that no ethanol remained in the column. RNA was eluted into a
new 1.5 ml collection tube with 50 μL of RNase-free water. Samples were stored at -
80ºC until needed.
2.3 Primer design for conventional PCR
The parameters outlined below were used to design primers used in this project.
The primers were highly specific for the each individual gene. Primer length was set to
be between 19 to 25 base pairs, with a GC content of 55% - 60%. Primer melting
temperatures ranged from 60ºC to 65ºC. For gene expression studies (excluding primer
design for cloning experiments) the annealing position of primers was chosen to be on
different exons, so that there would be an intron-exon boundary to distinguish the RT-
derived cDNA from possible contamination by the genomic DNA. All primers were
commercially synthesized by the Centre for Applied Genomics (The Hospital for Sick
Children, Toronto, ON). Each primer set generated a single band of expected size on
2% agarose gel stained with 0.5 μg/μL of ethidium bromide.
2.4 Conventional Polymerase Chain Reaction (PCR)
To check for the presence of riboflavin transporters in both human and mouse
cell lines, conventional PCR was run. A 25 μL reaction mixture was set up as follows: 4
μL of reverse transcription product, 2.5 μL of 10 x PCR reaction buffer (200 mM Tris-
HCl pH 8.4, 500 mM KCl), 0.75 μL 50 mM magnesium chloride, 20 mM forward and
reverse primers, 10 mM dNTPs, 0.05 U/ μL recombinant Taq DNA polymerase
(Invitrogen, Burlington, ON), and RNase-free water.
All reactions were carried out in an automated thermocycler. A typical PCR
reaction was programmed with the following parameters: (1) denaturation at 94 ºC for
30 sec to separate DNA double-strands; (2) annealing at 57 ºC for 30 sec to promote
DNA-primer association; (3) elongation at 72 ºC for 30 sec to synthesize new DNA
strand. Slight modifications to this protocol were applied, when necessary. These three

38
phases were propagated for 35 cycles to obtain required product. After the final cycle
was completed, the PCR reaction was allowed to cool to 4 ºC.
PCR products were visualized under UV light on 2% agarose gel (0.05%
ethidium bromide) following the electrophoresis.
3. IN VIVO MOUSE EXPERIMENTS
The experimental procedures outlined below were approved by the animal care
committee of the Toronto Centre for Phenogenomics (TCP, Toronto, Canada).
3.1 In vivo Expression of mRft1 and mRft2 mRNA in the Mammary Gland
3.1.1 Animals
Animal care and housing were provided by the TCP. Mammary expression of
mRft1 and mRft2 mRNA was examined in five groups of FBV/N mice on standard chow:
1) virgin (9-10 weeks old), 2) mid-gestational (15th day post coitus), 3) mid-lactating (on
the 7th day post delivery), 4) late-lactating (on the 14th day post delivery), and 5)
involution (a week after litter-weaning). The TCP standard chow contained 15 mg/kg of
riboflavin. All time-pregnant mice were first time mothers. All timed-pregnant mice were
housed singly in separate cages throughout the course of the experiment. To control for
the litter size between replicates, a litter size of six pups was maintained immediately
after the delivery.
The reason for choosing FVB/N mice is two-fold. Firstly, previous studies
evaluating the excretion of BCRP-substrate xenobiotics and riboflavin into the mouse
milk were conducted in BCRP knock-out and wild-type mice with FVB genetic
background. Secondly, the most extensive characterizations of mouse mammary gland
development were conducted in FVB mice. C57Bl/6 mice were selected for the purpose
of analyzing any strain differences in RFT expression.
3.1.2 Tissue Collection
Mice were euthanized in a sealed CO2 chamber, followed by cervical dislocation.
Collected tissues included mammary gland and small intestine. Mammary gland was
the tissue of primary interest; the rest were reference tissues for positive expression of
mRft1 and mRft2 mRNA. Tissues were preserved in RNAlater solution (Invitrogen,
Carlsbad, CA), and stored at -80ºC.

39
3.1.3 Total RNA Isolation
Total RNA was isolated from the collected tissues using QIAzol Lysis Reagent
(Qiagen; Valencia, CA). The procedure was performed according to the QIAzol
information handbook, with minor modifications to the protocol. In short, 1 mL QIAzol
Lysis Reagent was added to about 50 mg of tissue, followed by completed sample
homogenization. Tubes containing the homogenate were incubated at room
temperature for 5 min, to promote nucleoprotein complex dissociation. Next, 0.2 mL of
chloroform was added to the homogenate. Tubes were shaken for 15 sec, then placed
on the bench-top at room temperature for 3 min. Samples were centrifuged at 12,000 x
g for 15 min at 4°C. The upper, aqueous phase containing RNA was transferred into a
new tube. To precipitate RNA, 0.5 mL of 100% isopropanol was added, and mix
thoroughly by vortexing. Samples were allowed to incubate at room temperature for 10
min, followed by centrifugation at 12,000 x g for 10 min at 4°C. Supernatant was
aspirated and discarded. To wash the pellet, 1 mL of 75% ethanol was added to the
tubes, followed by centrifugation at 12,000 x g for 10 min at 4°C. Supernatant was
completely removed, and the pellet was left to air-dry briefly. RNA was resuspended in
an appropriate volume (depending on the pellet size) of diethylpyrocarbonate-treated
(DEPC) water. Samples were stored at -80ºC until needed.
RNA concentration and purity were assessed using a NanoDrop
Spectrophotometer (Thermo Scientific). OD260/OD280 ratio ranging from 1.8 to 2.0 was
indicative of high purity. Additionally, RNA integrity was determined by visualizing under
ultraviolet light the intact eukaryotic ribosomal subunits (28S and 18S) after
electrophoresis on a 2% agarose gel (2% w/v agarose, 1xTAE [40mM acetic acid,
40mM Tris base, 1 mM EDTA, pH 8.0] ) stained with ethidium bromide (0.5mg/mL).
Also, random samples were sent to the Centre for the Applied Genomics, where RNA
integrity was assessed by agilent BioAnalyzer analysis. RNA integrity numbers ranged
from 8 to 9.7, indicative of high quality RNA.
3.1.4 Reverse Transcription (RT)
Moloney Murine Leukemia Virus reverse transcriptase (MMLV-RT) (Invitrogen,
Burlington, ON) was used to synthesize complementary DNA (cDNA) from mRNA. Prior
to reverse transcription, 2 μg of total RNA was incubated for 3 min at 90ºC in presence
of 2 μL of oligo-d(T) primers (0.4 μg/μL), for the total reaction volume of 10 μL. Next, 30
μL of Master-mix were added to the RNA samples. Master-mix contained: 5x PCR

40
buffer, 1.75 mM MgCl2, 10 mM dNTPs, 10 mM dithiothreitol (DTT), 10 U/ μL MMLV-RT,
and RNase-free water. Samples were incubated for 10 min at 20ºC, followed by
incubation for 60 min at 42 ºC. Resultant cDNA samples were stored at -20ºC, until
further use.
3.1.5 Quantitative Real-Time Polymerase Chain Reaction (qPCR)
Minimum Information for Publication of Quantitative Real-Time PCR Experiments
(MIQE) guidelines (Bustin et al., 2009) were followed in processing the samples and
running qPCR. TaqMan probes (Table 4) for gene expression (Applied Biosystems)
were used for Real-Time PCR. Mouse cDNA samples, as well as cDNA isolated from
mouse and human cell lines and human breast milk, were analyzed by qPCR.
Reactions were set up in a 96-well plate as follows: 2 μL cDNA, 1 μL TaqMan probe, 7
μL DEPC-treated water, and 10 μL TaqMan universal PCR master mix.
Plate was centrifuged at 800 x g for 5 min. Applied Biosystems 7500 Real-Time PCR
System was used to run the samples, and later obtain the results. The thermal profile
used consisted of three stages. First, 1 cycle at 50ºC for 2 min. Second, 1 cycle at 95ºC
for 10 min. Third, 40 cycles at 95ºC for 15 sec, followed by cooling to 60ºC for 1 min.
Resultant data in form of Ct values were saved to Excel files for later analysis.
3.1.6 Laser Capture Microdissection (LCM)
LCM was performed by the Histology department at the Toronto Centre for
Phenogenomics. All reagents and Arcturus Paradise Plus Quality Assessment kits were
purchased from Applied Biosystems.
In brief, mammary glands from virgin and 1-week lactating FVB/N female mice
were surgically removed and incubated for 6 hours at room temperature in
paraformaldehyde (PFA). Tissues were then paraffin-embedded, and later sectioned
and mounted on RNase free membrane slides. RNA was isolated using Arcturus
Paradise Kit according to the manufacturer’s instructions. The quality of the RNA was
analyzed using an Agilent Bioanalyser (The Hospital for Sick Children, Toronto).
Reverse transcription protocol to generate cDNA was performed according to the
manufacturer’s instructions, using the reagents provided in the Arcturus Paradise kit.
The samples were quantified using a NanoDrop spectrophotometer. The samples were
stored at -80 ºC until further analysis by qPCR.

41
Table 4. Primer Probes for qPCR
Human Genes (Accession #) Catalogue number from ABI
RFT1 (NM_001104577) Hs00606016_g1
RFT2 (NM_033409) Hs00364295_m1
RFT3 (NM_024531) Hs00363824_g1
BCRP (NM_004827) Hs01053790_m1
β-ACTIN NM_001101) Hs99999903_m1
GAPDH (NM_002046) Hs02758991_g1
KERATIN 18 (NM_000224) Hs01941416_g1
Mouse Genes (Accession #) Catalogue number from ABI
Rft1 (NM_029643) Mm01205717_g1
Rft2 (NM_001164819) Mm00510191_g1
Bcrp (NM_011920) Mm00496364_m1
Abcb1a (NM_011076) Mm00440761_m1
Abcb1b (NM_011075) Mm00440736_m1
Abcc2 (NM_013806) Mm00496899_m1
β-Actin (NM_007393) Mm00607939_s1
Gapdh (NM_008084) Mm99999915_g1
Keratin 18 (NM_010664) Mm01601704_g1
β-Casein (NM_009972) Mm00839664_m1

42
3.1.7 Hematoxylin and Eosin (HE) Staining
Mammary glands were isolated from FVB/N mice and fixed in 10% PFA
overnight. Tissues were then processed by the Pathology Department at the Hospital
for Sick Children. In short, tissues were paraffin embedded and stored for future use.
For HE stating, tissue preparations were sectioned, deparaffinized and hydrated.
Hematoxylin was applied for 15 minutes, followed by washing. To counterstain, eosin
was applied for 2 minutes. Tissues were dehydrated in 95% and absolute alcohols, to
remove excess eosin. Samples were then mounted on the slides and scanned using
Aperio ScanScope.
3.2 In Vivo Riboflavin-Cimetidine Interaction Study
3.2.1 Animals
Animal care and housing were provided by the TCP. Animals received standard
chow and water ad libitum. Lactating FVB/N mice at 7-9 days after delivery were used
for the experiment. Within one day after the delivery, the litter size was controlled to six
pups. Mice were not allowed to recover from the anesthesia, and were euthanized by
conducting cervical dislocation.
3.2.2 Drug Doses
Doses of ketamine/xylazine at 100/10 mg/kg, respectively, were used, with
maintenance doses of about 30/3 mg/kg. Riboflavin dose was optimized by
quantitatively assessing the levels of the vitamin in both milk and plasma by high-
performance liquid chromatography. Riboflavin was dissolved in phosphate buffered
saline, and injected at a dose of 5 μg/g body weight. To enhance milk secretion, 250 μL
of a 1 IU/ml oxytocin solution was injected subcutaneously (Jonker et al., 2005).
Radiolabeled cimetidine [N-methyl-3H] (Figure 5) was injected at doses of 5 mg/kg body
weight.
3.2.3 High-performance liquid chromatography (HPLC)
Levels of riboflavin, FAD and FMN were determined as described previously (van
Herwaarden et al, 2006; Hamilton and al, 2009). During the procedure, samples were
protected from light. 35 µl plasma or 25 µl of 1/10 dilution milk samples were transferred
into Eppendorf tubes and spiked with 5 ng of Lumiflavin (internal standard). 250 µl of
methanol were added to each tube to precipitate proteins. The samples were then
mixed for 1 minute, and placed on ice for 1 hour. Samples were centrifuged for 15 min

43

44
at 10,500 x g. Supernatants were carefully removed and transferred to a new set of
tubes. 250 µl methanol were added to original tubes, and the procedures were repeated.
Combined methanol fractions were evaporated to dryness at 40°C under a stream of
nitrogen. Samples were reconstituted in 100 µl of methanol / 50 mM ammonium acetate
(pH = 5.0) (25 / 75), and transferred to 200 µl inserts. 10 µl aliquots were injected into
the HPLC system.
The chromatographic system consisted of a Dionex Ultimate 3000 series pump
and autosampler. Chromatographic separation was performed on a Nova-Pak C18
column (150 x 3.9 mm (inside diameter); 4 µm particle size) (Waters Corporation,
Milford, MA). The mobile phase consisted of a mixture of 50 mM ammonium acetate
(pH = 5.0) and methanol (75 / 25). The flow rate was 0.8 ml / minute and the detection
was performed fluorimetrically using a Dionex RF 2000 fluorescence detector with
excitation and emission wavelengths set at 372 and 520 nm, respectively. Elution of the
flavins followed the order of polarity (FAD>FMN>Riboflavin>Lumiflavin) with
approximate retention times of 2.2, 3.1, 5.0 and 8.4 minutes, respectively. Calibration
curves spanned 0.1 to 50 ng / 100 µl and were spiked with 5 ng Lumiflavin. A
representative chromatogram of riboflavin, FAD and FMN is shown in Figure 6.
3.2.4 Experimental Timeline
A previously described protocol (Jonker et al., 2005) was adapted for the experiment.
The timeline of the experimental procedures was as follows:
- 2 min: ketamine-xylazine injection (IP)
0 min: riboflavin or vehicle control injection (IV)
30 min: 3H-labelled cimetidine injection (IV)
50 or 80 min: oxytocin injection (SQ)
60 or 90 min: milk and blood sampling
Note, milk was collected from the inguinal mammary glands, followed by blood sampling
1-2 minutes later.
3.2.5 Milk and Blood Sampling
Milk was collected as per the method described by Parr et al. (1995), with minor
modifications. In short, at 7-8 days post-partum, the pups were removed from the
mothers for 3 h to allow for milk accumulation in the mammary glands. The dams were
anesthetized with ketamine-xylazine, as per TCP protocol described above. At time 50
or 80 minutes, the females received a subcutaneous injection of oxytocin (250 μL of a 1

45
Figure 6. A representative chromatogram of riboflavin, FAD and FMN in samples spiked with an internal standard lumiflavin.

46
IU/ml oxytocin). The breast tissue was massaged lightly for about 30 sec. 10 min later
the mice were placed on their backs. Nipples were pulled back slightly and cut off. Milk
flowed to the surface. About 200 μL was collected into amber tubes (Eppendorf
Canada) to protect the samples from light.
Blood samples were collected from the heart using cardiac puncture. The mice
were fully anesthetized at the time of the procedure. Briefly, the animal was placed on
its back. The 23 gauge needle was inserted slightly left of and under the sternum,
directed toward animal’s cranial end. The needle was held 20-30° off horizontal, and
inserted into the heart. Negative pressure was gently applied on syringe plunger.
Needle was withdrawn upon blood collection. About 200 μL of blood was injected into a
heparin-coated Microvette tube (Braintree Scientific; Braintree, MA). The Microvette
tube was sealed with a plastic cap, and inserted into the outer case designed for
centrifugation. Whole blood was centrifuged at 2000 x g for 10 min at room temperature.
Plasma (upper aqueous layer) was pipetted into new tubes.
3.2.6 Sample Analysis
Levels of radioactivity in plasma and milk samples were determined by liquid
scintillation counting. In short, 50 μL of milk or plasma were added to 2 mL of
scintillation fluid, and measured over a 2-minute range in a scintillation counter. DPM
values were obtained and later converted to concentration values in ng/mL.
4. HUMAN BREAST MILK
A waiver from the Research Ethics Board at the Hospital for Sick Children
(Toronto, ON) was obtained to perform the following study.
4.1 Milk Collection
Mature breast milk (15 mL), 1-2 months post-partum, was collected from a donor
via a standard breast pump. The sample was immediately stored at 4ºC, and processed
within the next twelve hours. Approximately 15 mL of milk was transferred into sterile
tubes, tightly sealed, and then centrifuged at 3,000 rpm for 10 min at 4°C. The
supernatant fat layer was transferred into a new tube using a sterile spatula. The
supernatant aqueous layer was discarded, and cell pellet was preserved. 1 mL of
TRIzol (Invitrogen) was added to the fat and pellet samples, prior to storage at -80°C.
47
4.2 RNA Isolation and Sample Processing
RNA was isolated from TRIzol-treated samples according to manufacturer’s
guidelines. In short, 200 μL of chloroform were added to the samples. The samples
were centrifuged at 12,000 x g for 15 min at 4°C. The upper, aqueous phase containing
RNA was transferred into a new tube. To precipitate RNA, 0.5 mL of 100% isopropanol
was added. Samples were allowed to incubate at room temperature for 10 min, followed
by centrifugation at 12,000 x g for 10 min at 4°C. Supernatant was aspirated and
discarded. The resultant pellet was washed with 1 mL of 75% ethanol, followed by
centrifugation at 12,000 x g for 10 min at 4°C. Supernatant was removed, and the pellet
was left to air-dry. RNA was reconstituted in DEPC water.
Reverse transcription reactions and qPCR were performed according to the
procedures outlined in sections 3.1.4 and 3.1.5, respectively.
5. WESTERN BLOTTING
Whole tissue and cell lysates were prepared in radioimmunoprecipitation assay
(RIPA) buffer (50 mM Tris-Cl pH 7.5, 150 mM NaCl, 5 mM EDTA, 0.5% sodium
deoxycholate, 1% Triton X-100, 0.1% SDS), and then centrifuged at 10,000 rpm for 10
min at 4°C to isolate the supernatant. Bradford assay was used to measure protein
concentration of the resultant preparations. Reduced protein samples were loaded onto
a 4-12% NuPAGE Novex bis-tris gel (Invitrogen), and later transferred to a nitrocellulose
membrane (Amersham Biosciences, NJ). Blots were blocked with 5% skim milk in 1X
PBST buffer (137mM NaCl, 2.7 mM KCl, 10 mM Na2HPO4 • 2 H2O, 2 mM KH2PO4,
0.05% Tween-20, pH 7.4) overnight. Primary antibodies (working concentrations) were
used: rabbit polyclonal anti-RFT2 (1:200) (Santa Cruz Biotechnology, CA); mouse
polyclonal anti-GAPDH (1:20000) (Santa Cruz Biotechnology, CA). To ensure equal
loading for the protein preparations, GAPDH was probed for on the same, stripped blot
membranes, used initially for detecting target RFT2 protein.
6. CUSTOM ANTIBODY DESIGN
Custom design for anti-mouse mRFT1 antibody was performed utilizing the
services provided by Open Biosystems. A unique antigenic peptide was selected, based
on mRFT1 (NP_083919) protein sequnce. BLASTp analysis of the antigenic peptide
RRLARGKGEQVPIR revealed no similarities to other mouse proteins. A 90 day Rabbit
48
Protocol was applied to raise the antibodies. In short, a control serum sample was
collected on day 0. Primary immunization occurred on day 1, with antigenic peptide
emulsified with Freund’s complete adjuvant. The first booster was given on day 14, and
serum was collected shorty after on day 28. The second booster with antigenic peptide
emulsified with Freund’s incomplete adjuvant occurred on day 42, and serum was
collected on day 56. The third booster shot was given on day 56, followed by two
additional bleeds on days 70 and 72. The latter serum was affinity purified. The
antibodies were tested in a Western blot protocol as described above.
7. LOCALIZATION STUDY: GFP-hRFT2 FUSION PROTEIN
7.1 Plasmid prepation
The full length 1407 kb hRFT2 cDNA (GenBank accession no. NM_033409) was
isolated by PCR cloning from the human placenta cDNA (Clontech). The hRFT2-
specific primers were designed: forward primer 5’ CGCAGAGATCTATG
GCCTTCCTGATGCAC 3’ with BgI II restriction site (underlined), reverse primer
5’GTTCAGGATCCGGCTGGACAGTGCAGATTGCA 3’ with BamH I restriction site
(underlined). Using QIAGEN LongRange kit, PCR reactions were set up as follows: 5 μl
of 10x LongRange PCR Buffer with Mg2+, 2.5 μl of 10 mM dNTP mix, 0.2 μl of each
forward and reverse primers, 11.7 μl RNase-free water, 0.4 μl LongRange PCR enzyme
mix, 30 μl of 3 ng/ μl human placenta cDNA to final volume of 50 μl per reaction. All
reactions were carried out in an automated thermocycler. The cycling protocol for
LongRange PCR was set as follows: (1) denaturation at 93 ºC for 15 sec; (2) annealing
at 62 ºC for 30 sec; (3) elongation at 68 ºC for 2 min. These three phases were
propagated for 35 cycles to obtain required product. After the final cycle was completed,
the PCR reaction was allowed to cool to 4 ºC. PCR products were visualized under UV
light on 1.5 % agarose gel (0.05% ethidium bromide) following the electrophoresis. The
band corresponding to PCR product size 1429 bp was cut from the gel. PCR product
was purified using QIAGEN gel extraction kit. PCR product was then subcloned to
TOPO TA cloning kit (Invitrogen): 3 μl of PCR product, 1 μl salt solution, 0.5 μl of TOPO
vector, 1.5 μl of distilled water to the final volume of 6 μl per reaction. Reaction
preparations were incubated for 20 minutes at room temperature, followed by
transformation of One Shot TOP10 chemically competent E. coli. To analyze
transformants, white colonies were cultured over night in lysogeny broth medium

49
containing 50 μl/mL kanamycin. QIAGEN Mini kit was used to isolate plasmid. To
confirm presence of the insert restriction enzymes BgI II and BamH I were used. To
confirm correct insert sequence and orientation, constructs were sequenced (The
Hospital for Sick Children). One mismatch was identified: C T, and later confirmed to
be a synonymous SNP: L L (255) (rs3746805, dbSNP). To make GFP-hRFT2 fusion
protein, hRFT2 insert was purified from chemically competent E. coli, and subcloned to
pAcGFP1-C1 vector using BgI II and BamH I restriction enzymes. DH5a competent
cells (Invitrogen) were then transformed with pAcGFP1-C1 vector. To confirm correct
insert sequence and orientation, constructs were sequenced (The Hospital for Sick
Children). The presence of the same synonymous SNP was confirmed. Plasmid was
prepared for later transfection using QIAGEN HiSpeed plasmid Midi kit. DNA
concentration was measured using a NanoDrop Spectrophotometer (Thermo Scientific).
7.2 Transfection and Imaging
MCF10A cells were seeded at 100 000 cells per well on 24-well plates in 500 µl
of complete growth medium, and grown to confluency. Plasmid solution was diluted in
OptiMEM to a final concentration of 0.02 µg/µl. 3:1 ratio of FuGENE HD transfecting
reagent to DNA was added to plasmid solution, and allowed to incubate at room
temperature for 15 min. Cells were transfected with 500 ng/well GFP-hRFT2 plasmid or
empty pAcGFP1-C1 vector by adding 50 uL of transfection solution to the wells. Forty-
eight hours after the transfection, the cells were visualized using a long-term imaging
microscope (Imaging Facility, The Hospital for Sick Children).
8. STATISTICAL ANALYSIS
Statistical tests were conducted using SPSS 17.0 (SPSS Inc., Chicago, IL).
Normality tests (Kolmogorov-Smirnov and Shapiro-Wilk) were first carried out to guide
subsequent statistical analyses. Multiple group comparisons were carried out by one-
way ANOVA. If statistical significance of p < 0.05 was achieved, Dunnett’s post-hoc
comparison test was performed to analyze the difference between the groups.
Comparisons between two groups on single variable were accomplished by Student’s
independent t-test. Differences of p < 0.05 were considered statistically significant.
9. DATA ANALYSIS
The ΔΔCT
method for relative quantitation of qPCR was used. First, the CT target

50
values (Rft, Bcrp) were normalized to an endogenous reference (Keratin 18, Villin or β
Actin) to obtain the ΔCT values. Next, the ΔC
T values were normalized relative to the
calibrator sample (virgin group) to obtain the ΔΔCT values. Then, the amount of target
was determined by the 2 –ΔΔC
T as a fold change compared to the virgin group.

51
RESULTS
1. mRNA Levels of RFT in Human and Mouse Mammary-Derived Cells in vitro
To understand whether RFT may have a potential role in mammary riboflavin
transport, we investigated the relative mRNA expression of these transporters in vitro.
1.1 Human and Mouse Mammary Gland Cell Lines
To assess the relative amounts of endogenous RFT mRNA in human and mouse
mammary epithelial cells, qPCR was performed using gene-specific primers (Table 4).
There were no previous reports of RFT mRNA expression in these cells, or any other
mammary epithelial cell lines.
The mRNA expression levels of hRFT1, hRFT2 and hRFT3 in human mammary
epithelial cells MCF10A and T47D were measured and normalized to β-Actin
expression (Figure 7). Multiple group comparison using one-way ANOVA, followed by
Dunnett’s post-hoc comparison test revealed significantly higher (p < 0.05) levels of
hRFT2 mRNA, as compared to hRFT1. On the other hand, no statistical difference was
observed between hRFT3 and hRFT1. This observation was consistent between the
two cell lines.
The expression levels of mRft1 and mRft2 mRNA in mouse mammary epithelial
cells EMT6 and HC11 were also measured and normalized to β-Actin expression
(Figure 8). Comparisons between the groups using Student’s independent t-test
revealed significantly higher mRNA levels of mRft1 as compared to mRft2, the
relationship conserved in both cell lines.
1.2 Cellular Fractions in Human Milk
To evaluate the possible expression patterns of RFT mRNA in human mammary
gland in a non-invasive way, levels of RFT were characterized in cells and cell
fragments derived from human breast milk.
The relative amounts of RFT mRNA were measured in cell pellet and milk fat cell
fragments using qPCR. Rft expression was normalized to β-Actin (Figure 9). Multiple
group comparison using one-way ANOVA did not reveal any statistically significant
difference between hRFT1, hRFT2 or hRFT3 expression, probably due to the small
sample size.

52
Figure 7. Levels of hRFT1, hRFT2 and hRFT3 mRNA Expression in Human Mammary Epithelial
Cell Lines. Cells were grown in standard media (see Materials and Methods) to 70-80% confluency. Total
RNA was isolated from the cells using RNeasy Mini Kit. The expression of hRFT1, hRFT2 and hRFT3
mRNA was analyzed using Real-Time Quantitative PCR. Results were normalized to β-actin, and
expressed as percent of β-actin expression. Each group value represents a mean ± standard error.
Multiple group comparisons were carried out by one-way ANOVA. Dunnett’s post-hoc comparison test
was performed to analyze the difference between the groups. Differences of p < 0.05 were considered
statistically significant. * denotes a statistically significant result as compared to hRFT1 within the same
cell line.

53
Figure 8. Levels of mRft1 and mRft2 mRNA Expression in Mouse Mammary Epithelial Cell Lines.
Cells were grown in standard media (see Materials and Methods) to 70-80% confluency. Total RNA was
isolated from the cells using RNeasy Mini Kit. The expression of mRft1 and mRft2 mRNA was analyzed
using Real-Time Quantitative PCR. Results were normalized to β-actin, and expressed as percent of β-
actin expression. Each group value represents a mean ± standard error. Comparisons between the two
groups were accomplished by Student’s independent t-test. Differences of p < 0.05 were considered
statistically significant. * denotes a statistically significant result as compared to mRft2 within the same
cell line.

54
Figure 9. Levels hRFT1, hRFT2 and hRFT3 mRNA Expression in Human Milk Cells and Cell
Fragments. Approximately 15 mL of milk were centrifuged at 3,000 rpm for 10 min at 4°C. The
supernatant fat layer was transferred into a new tube using a sterile spatula. The supernatant aqueous
layer was discarded, and cell pellet was preserved. 1 mL of TRIzol was added to the fat and pellet
samples. Total RNA was extracted from cell pellet and milk fat, and then reverse transcribed. The
expression of hRFT1, hRFT2 and hRFT3 mRNA was analyzed using Real-Time Quantitative PCR.
Results were normalized to β-actin, and expressed as percent of β-actin expression. Each group value
represents a mean ± standard deviation. Multiple group comparisons were carried out by one-way
ANOVA. Differences of p < 0.05 were considered statistically significant.

55
2. mRNA Expression Profiles of Rft, Bcrp and Other Main ABC Transporters in
Virgin, Pregnant, Lactating and Post-Lactation Stages of Mouse Mammary Gland
in vivo
To further evaluate the possible roles of Rft in mammary riboflavin transport,
relative mRNA expression of these transporter was investigated in mice in vivo. The
mRNA expression of ABC-family transporters, including Bcrp, were also characterized
in vivo, for reasons to be discussed below.
2.1 Bcrp
As described in the introductory section of this thesis (page 26), previous reports
have indicated that protein levels of BCRP follow a specific pattern of expression in the
mammary gland, with significant upregulation in lactating mammary gland (Jonker et al.,
2005). It was, however, previously unreported whether this is a transcriptional event.
The levels of mammary Bcrp expression in five groups of FVB/N were measured
using qPCR. The five groups included: virgin (9-10 weeks old); mid-gestational (15th
day post coitus); lactation 1st week (on the 7th day post delivery); lactation 2nd week (on
the 14th day post delivery); and involution (a week after litter-weaning). Results were
standardized to Keratin-18 at virgin stage. Significantly higher levels of Bcrp mRNA (>
25 fold) in lactating mice (1st and 2nd week), as compared to virgin group were observed
(Figure 10). No differences were found between mid-gestational and involution groups,
when compared to the virgin state. Similar statistically significant differences in
mammary Bcrp expression between virgin and lactating stages were observed in
C57BL/6 mice (Figure 11).
2.2 Rft ( mRft1 and mRft2)
As riboflavin is concentrated in breast milk (Lawrence, 2005a), it could be
anticipated that mRNA levels of Rft would be upregulated in the lactating mammary
gland, similar to the pattern of mammary Bcrp expression (Jonker et al., 2005). There
were no previous reports investigating this question.
The levels of mammary mRft1 and mRft2 expression in five groups of FVB/N
mice at different stages of mammary gland development (virgin, mid-gestational, 1st and
2nd week of lactation and involution) were measured using qPCR. Statistical analysis
revealed significantly higher levels of mRft1 mRNA (> 10 fold) in mid-gestational and
lactating mice (1st and 2nd week), with no difference in involuting animals, as compared
to virgin group (Figure 12). Similarly, a 3-fold induction in mRft2 mRNA was detected

56
Figure 10. Levels of Bcrp mRNA Expression at Different Stages of Mammary Gland Development
in FVB/N Mice. Inguinal mammary glands were excised from five groups of FBV/N mice on standard
chow: 1) virgin (9-10 weeks old), 2) mid-gestational (15th day post coitus), 3) lactation 1 wk (on the 7
th day
post delivery), 4) lactation 2 wk (on the 14th day post delivery), and 5) involution (a week after litter-
weaning). Total RNA was extracted from the mammary tissue, and then reverse transcribed. The
expression of Bcrp mRNA was analyzed using Real-Time Quantitative PCR. Results were first normalized
to Keratin-18, and then to virgin state. The 2-∆∆C
T method was used to determine relative changes in gene
expression. Each group value represents a mean ± standard deviation. Statistical tests were conducted
using SPSS 17.0. Normality tests were first carried out to guide subsequent statistical analyses. Multiple
group comparisons were carried out by one-way ANOVA. Dunnett’s post-hoc comparison test was
performed to analyze the differences between the virgin and the other four groups. *denotes a statistically
significant result as compared to virgin group.

57
Figure 11. Levels of Bcrp mRNA Expression at Different Stages of Mammary Gland Development
in C57BL/6 Mice. Inguinal mammary glands were excised from two groups of C57BL/6 mice on standard
chow: 1) virgin (9-10 weeks old), and 2) lactation 1 wk (on the 7th day post delivery). Total RNA was
extracted from the mammary tissue, and then reverse transcribed. The expression of Bcrp mRNA was
analyzed using Real-Time Quantitative PCR. Results were first normalized to Keratin-18, and then to
virgin state. The 2-∆∆C
T method was used to determine relative changes in gene expression. Each group
value represents a mean ± standard deviation. Statistical tests were conducted using SPSS 17.0.
Comparisons between the two groups were accomplished by Student’s independent t-test. Differences of
p < 0.05 were considered statistically significant.* denotes a statistically significant result as compared to
virgin group.

58
Figure 12. Levels of mRft1 mRNA Expression at Different Stages of Mammary Gland Development
in FVB/N Mice. Inguinal mammary glands were excised from five groups of FBV/N mice on standard
chow: 1) virgin (9-10 weeks old), 2) mid-gestational (15th day post coitus), 3) lactation 1 wk (on the 7
th day
post delivery), 4) lactation 2 wk (on the 14th day post delivery), and 5) involution (a week after litter-
weaning). Total RNA was extracted from the mammary tissue, and then reverse transcribed. The
expression of mRft1 mRNA was analyzed using Real-Time Quantitative PCR. Results were first
normalized to Keratin-18, and then to virgin state. The 2-∆∆C
T method was used to determine relative
changes in gene expression. Each group value represents a mean ± standard deviation. Statistical tests
were conducted using SPSS 17.0. Normality tests were first carried out to guide subsequent statistical
analyses. Multiple group comparisons were carried out by one-way ANOVA. Dunnett’s post-hoc
comparison test was performed to analyze the differences between the virgin and the other four groups.
*denotes a statistically significant result as compared to virgin group.

59
in 1st week lactating mice (Figure 13), with no difference between other groups, when
compared to the virgin state. Lactation state of animals was confirmed using a milk
protein gene β-Casein, which is a marker of lactogenesis (Kumar et al., 1994). β-Casein
was significantly upregulated (>75 fold) in 1st and 2nd week lactating mice (Figure 14).
Significant upregulation of mammary mRft1 and mRft2 was also observed
between virgin and lactating C57BL/6 mice (Figure 15), with about 17-fold and 8-fold
increase, respectively.
In addition, expression of mRft1 and mRft2 mRNA in the small intestine of the
FVB/N mice was examined. It was previously reported that human and rat intestinal
tissues were expressing high levels of Rft (Yonezawa et al., 2008; Yamamoto et al.,
2009). Therefore, small intestine was selected as a reference tissue for high Rft
expression. The expression of mRft1 and mRft2 in the proximal third of the small
intestine was measured in virgin, mid-gestational, 1st and 2nd week of lactation and
involuting FVB/N mice using qPCR (Appendix I). Rft expression was normalized to
Villin, the marker of intestinal epithelium. No significant changes in the intestinal mRft1
expression during the different stages of mammary gland development were observed.
On the other hand, a statistically significant reduction (about 2-fold) of intestinal mRft2 in
the gestational state was observed, as compared to the virgin group.
2.3 Mammary Epithelia-Specific mRNA Profiles of mRft1, mRft2 and Bcrp in Virgin
and Lactating Mice: Laser-Captured Microdissection (LCM)
As mammary epithelial cells are involved in milk production and secretion of
various milk constituents, including riboflavin, expression of Bcrp, mRft1 and mRft2
mRNA in these cells was investigated.
Inguinal mammary glands were excised from two groups of FVB/N mice on
standard chow: 1) virgin (9-10 weeks old), and 2) lactation 1 week (on the 7th day post
delivery). Total RNA was isolated exclusively from mammary epithelial cells using LCM
protocols. The expression of mRft1 and mRft2 mRNA was analyzed using qPCR. In the
instances where Ct values were undetected, a detection limit value of Ct = 40 was
assigned to the measurement. The results were first normalized to Keratin-18, and then
to virgin state.
Comparisons between the groups revealed significant upregulation in mRft1 and
Bcrp mRNA by 4- and 52-fold, respectively (Figure 16, Figure 17). On the other hand,
levels of mRft2 mRNA remained unchanged (Figure 16).

60
Figure 13. Levels of mRft2 mRNA Expression at Different Stages of Mammary Gland Development
in FVB/N Mice. Inguinal mammary glands were excised from five groups of FBV/N mice on standard
chow: 1) virgin (9-10 weeks old), 2) mid-gestational (15th day post coitus), 3) lactation 1 wk (on the 7
th day
post delivery), 4) lactation 2 wk (on the 14th day post delivery), and 5) involution (a week after litter-
weaning). Total RNA was extracted from the mammary tissue, and then reverse transcribed. The
expression of mRft2 mRNA was analyzed using Real-Time Quantitative PCR. Results were first
normalized to Keratin-18, and then to virgin state. The 2-∆∆C
T method was used to determine relative
changes in gene expression. Each group value represents a mean ± standard deviation. Statistical tests
were conducted using SPSS 17.0. Normality tests were first carried out to guide subsequent statistical
analyses. Multiple group comparisons were carried out by one-way ANOVA. Dunnett’s post-hoc
comparison test was performed to analyze the differences between the virgin and the other four groups.
*denotes a statistically significant result as compared to virgin group.

61
Figure 14. Levels of β-Casein (Csn2) mRNA Expression at Different Stages of Mammary Gland
Development in FVB/N Mice. Inguinal mammary glands were excised from five groups of FBV/N mice
on standard chow: 1) virgin (9-10 weeks old), 2) mid-gestational (15th day post coitus), 3) lactation 1 wk
(on the 7th day post delivery), 4) lactation 2 wk (on the 14
th day post delivery), and 5) involution (a week
after litter-weaning). Total RNA was extracted from the mammary tissue, and then reverse transcribed.
The expression of Csn2 mRNA was analyzed using Real-Time Quantitative PCR. Results were first
normalized to Keratin-18, and then to virgin state. The 2-∆∆C
T method was used to determine relative
changes in gene expression. Each group value represents a mean ± standard deviation. Statistical tests
were conducted using SPSS 17.0. Normality tests were first carried out to guide subsequent statistical
analyses. Multiple group comparisons were carried out by one-way ANOVA. Dunnett’s post-hoc
comparison test was performed to analyze the differences between the virgin and the other four groups.
*denotes a statistically significant result as compared to virgin group.

62
Figure 15. Levels of mRft1 and mRft2 mRNA Expression at Different Stages of Mammary Gland
Development in C57BL/6 Mice. Inguinal mammary glands were excised from two groups of C57BL/6
mice on standard chow: 1) virgin (9-10 weeks old), and 2) lactation 1 wk (on the 7th day post delivery).
Total RNA was extracted from the mammary tissue, and then reverse transcribed. The expression of
mRft1 and mRft2 mRNA was analyzed using Real-Time Quantitative PCR. Results were first normalized
to Keratin-18, and then to virgin state. The 2-∆∆C
T method was used to determine relative changes in gene
expression. Each group value represents a mean ± standard deviation. Statistical tests were conducted
using SPSS 17.0. Comparisons between the two groups were accomplished by Student’s independent t-
test. Differences of p < 0.05 were considered statistically significant.* denotes a statistically significant
result as compared to virgin group.

63
Figure 16. Levels of mRft1 and mRft2 mRNA in the Mammary Epithelial Cells of Virgin and
Lactating FVB/N Mice. Inguinal mammary glands were excised from two groups of FVB/N mice on
standard chow: 1) virgin (9-10 weeks old), and 2) lactation 1 wk (on the 7th day post delivery). Total RNA
was isolated exclusively from mammary epithelial cells using laser capture microdissection (LCM)
protocols. LCM was performed by the Histology department at the Toronto Centre for Phenogenomics.
The expression of mRft1 and mRft2 mRNA was analyzed using Real-Time Quantitative PCR. Results
were first normalized to Keratin-18, and then to virgin state. Each group value represents a mean ±
standard deviation. The 2-∆∆C
T method was used to determine relative changes in gene expression. Each
group value represents a mean ± standard deviation. Statistical tests were conducted using SPSS 17.0.
Comparisons between the two groups were accomplished by Student’s independent t-test. Differences of
p < 0.05 were considered statistically significant. * denotes a statistically significant result as compared to
virgin group.

64
Figure 17. Levels of Bcrp mRNA in the Mammary Epithelial Cells of Virgin and Lactating FVB/N
Mice. Inguinal mammary glands were excised from two groups of FVB/N mice on standard chow: 1) virgin
(9-10 weeks old), and 2) lactation 1 wk (on the 7th day post delivery). Total RNA was isolated exclusively
from mammary epithelial cells using laser capture microdissection (LCM) protocols. LCM was performed
by the Histology department at the Toronto Centre for Phenogenomics. The expression of Bcrp mRNA
was analyzed using Real-Time Quantitative PCR. Results were first normalized to Keratin-18, and then to
virgin state. Each group value represents a mean ± standard deviation. The 2-∆∆C
T method was used to
determine relative changes in gene expression. Each group value represents a mean ± standard
deviation. Statistical tests were conducted using SPSS 17.0. Comparisons between the two groups were
accomplished by Student’s independent t-test. Differences of p < 0.05 were considered statistically
significant. * denotes a statistically significant result as compared to virgin group.

65
It is noteworthy to mention that expression of Bcrp, mRft1 and mRft2 was also
measured in mammary adipose tissue. However, most Rft values remained undetected,
regardless of the state of mammary gland development. These values are summarized
in Appendix II.
2.4 Pgp3 (Abcb1a, Mdr3), Pgp1 (Abcb1b, Mdr1b) and Mrp2 (Abcc2)
To validate the specific nature of Rft and Bcrp upregulation in the lactating
mammary gland, the pattern of expression of other transporters at different stages of
mammary gland development in FBV/N mice was investigated.
Previous studies have indicated that protein levels of Pgp (ABCB1) and MRP2
(ABCC2) show reduced expression in the mammary glands of lactating FVB/N mice
(Jonker et al., 2005). It was, however, previously unknown whether the mRNA
expression of these genes follows the similar pattern of downregulation.
The levels of mRNA expression of mammary Mdr3 (Abcb1a), Mdr1b (Abcb1b)
and Mrp2 (Abcc2) were measured using qPCR in five groups of FVB/N mice, as
outlined above. Significantly lower levels of Mrp2 mRNA (about 4-fold) in the 1st and 2nd
week lactating mice, with no differences in other groups, as compared to virgins were
observed (Figure 18). On the other hand, Mdr3 and Mdr1b showed a trend toward
reduction during lactation; however, statistical significance was not observed.
3. Protein Levels of mRFT1 and mRFT2 in Virgin, Lactating and Post-lactation
Stages of Mouse Mammary Gland in vivo
To evaluate whether the pattern of RFT protein expression mirrored that of
mRNA in mouse mammary gland, Western blots were performed using two primary
antibodies: rabbit polyclonal anti-mRFT1 and anti-mRFT2.
3.1 mRFT1
As no anti-mouse mRFT1 antibody was commercially available, custom design
for anti-mouse mRFT1 antibody was performed utilizing the services provided by Open
Biosystems (see Methods). Using both crude and affinity purified sera numerous
Western blots were run using both cell preparations and mouse mammary gland
preparations. However, regardless of preparation, protein amount loaded and primary
antibody dilutions, no strong signal was detected at or near the predicted sizes of 46
and 37 kDa of mouse mRFT1 isoforms. Rather, multiple non-specific bands appeared
across blots (data not shown).

66
Figure 18. Levels of Pgp3 (Abcb1a, Mdr3), Pgp1 (Abcb1b, Mdr1b) and Mrp2 (Abcc2) mRNA
Expression at Different Stages of Mammary Gland Development in FVB/N Mice. Inguinal mammary
glands were excised from five groups of FBV/N mice on standard chow: 1) virgin (9-10 weeks old), 2)
mid-gestational (15th day post coitus), 3) lactation 1 wk (on the 7
th day post delivery), 4) lactation 2 wk (on
the 14th day post delivery), and 5) involution (a week after litter-weaning). Total RNA was extracted from
the mammary tissue, and then reverse transcribed. The expression of Pgp3, Pgp1 and Mrp2 mRNA was
analyzed using Real-Time Quantitative PCR. Results were first normalized to Keratin-18, and then to
virgin state. The 2-∆∆C
T method was used to determine relative changes in gene expression. Each group
value represents a mean ± standard deviation. Statistical tests were conducted using SPSS 17.0.
Normality tests were first carried out to guide subsequent statistical analyses. Multiple group comparisons
were carried out by one-way ANOVA. Dunnett’s post-hoc comparison test was performed to analyze the
difference between the virgin and the other four groups. *denotes a statistically significant result as
compared to virgin group.

67
3.2 mRFT2
Although commercialy available, anti-RFT2 antibody was not previously validated.
The antibody is claimed to cross react with both human and mouse RFT2 protein.
Whole mammary gland lysates from virgin, lactating and involuting FVB mice
were prepared. 60 microgram of each preparation was run on the Western blot (Figure
19). Stong bands of variable intensity were dected at about 40 kDa in all three
preparations. An additional band of lesser intensity was visualized for lactating
mammary tissue at 50 kDa. No corresponding signal in adjesent virgin and involuting
mammary samples was detected at 50 kDa. Predicted size of mRFT2 is 49.6 kDa.
4. Subcellular Localization of hRFT2 in Mammary-derived Cell Line MCF10A
To visualize the cellular localization of hRFT2, MCF10A cells were transfected
with GFP-tagged hRFT2 (Figure 20, A). Fluorescence was observed in the plasma
membrane of most cells transfected with GFP-tagged hRFT2. MCF10A cells transfected
with GFP-only vector showed no pattern of localization, with fluorescence observed
within whole cells (Figure 20, B).
5. Riboflavin-Cimetidine Interaction Study in Mice in vivo
5.1 Riboflavin Dose Finding
To identify the riboflavin dose that produces significantly higher plasma levels of
riboflavin in FVB/N mice on standard chow, a dose finding study was conducted. As per
the initial protocol, milk and plasma levels of riboflavin were quantified 90 min after
riboflavin intravenous injection (Figure 21). Milk and plasma riboflavin concentrations in
control mice, not receiving riboflavin supplementation, were 10800 nM and 160 nM,
respectively. Additional supplementation with 1, 2 or 5 μg/g body weight resulted in 1.8-,
2.9- and 8.8-fold increase in plasma levels and 1.8-, 2.7- and 3-fold increase in milk
levels of riboflavin at 90 minutes. Statistically significant differences in both milk and
plasma riboflavin concentrations were achieved at 5 μg/g weight. Subsequently, the
dose of 5 μg/g body weight of riboflavin was chosen for the in vivo experiments (see
below). Additional quantification of milk riboflavin levels using 5 μg/g body weight of
riboflavin were performed at 30 and 60 min post-dose (Figure 22). No significant
differences in milk riboflavin levels at 30, 60 and 90 min were found.
Levels of FAD and FMN were also quantified by HPLC at 90 min after riboflavin
supplementation (Appendix III). No significant changes in milk and plasma levels as

68
Figure 19. mRFT2 Expression at Different Stages of Mammary Gland Development in FVB/N Mice.
Whole tissue lysates were prepared in radioimmunoprecipitation assay (RIPA) buffer, and then
centrifuged at 10,000 rpm for 10 min at 4°C to isolate the supernatant. Reduced protein samples were
loaded onto a 4-12% NuPAGE Novex bis-tris gel, and later transferred to a nitrocellulose membrane.
Blots were blocked with 5% skim milk in 1X PBST buffer overnight. Primary antibodies were used: rabbit
polyclonal anti-mRFT2 (1:200); mouse polyclonal anti-GAPDH (1:20000).

69
Figure 20. Fluorescent Imaging of Green Fluorescent Protein (GFP)-tagged hRFT2. Human
mammary epithelial cells MCF10A were transfected with 500 ng/well GFP-hRFT2 (A) plasmid or empty
pAcGFP1-C1 vector (B). Forty-eight hours after the transfection, the cells were visualized using long-term
imaging microscope. Fluorescent images show GFP-hRFT2 outlining the cells at the plasma membrane.
Scale: A. bar 23 μm; B. bar 49 μm.
A. GFP-hRFT2
B. GFP

70
Figure 21. Milk and Plasma Levels of Riboflavin in FVB/N Mice. One-week lactating FVB/N mice
were intravenously administered riboflavin at doses of 1 μg/g, 2 μg/g or 5 μg/g body weight, or phosphate
buffered saline (control). To enhance milk secretion, 250 μL of a 1 IU/ml oxytocin solution was injected
subcutaneously 10 min prior to milk sampling. At 90 min, milk was collected from the inguinal mammary
glands, followed by blood collection via cardiac puncture 1-2 minutes later. Whole blood was centrifuged
at 2000 x g for 10 min at room temperature. Plasma was transferred into new tubes. Milk and plasma
samples were protected from light. Riboflavin levels were analyzed by high-performance liquid
chromatography. Each group value represents a mean ± standard error. Multiple group comparisons were
carried out by one-way ANOVA. . Dunnett’s post-hoc comparison test was performed to analyze the
differences (p < 0.05) between the control and the other three treatment groups. * denotes a statistically
significant result as compared to virgin group.
A. Milk
B. Plasma

71
Figure 22. Milk Levels of Riboflavin in FVB/N Mice. One-week lactating FVB/N mice were
intravenously administered riboflavin at a dose 5 μg/g body weight. To enhance milk secretion, 250 μL of
a 1 IU/ml oxytocin solution was injected subcutaneously 10 min prior to milk sampling. Milk was collected
from the inguinal mammary glands at 30, 60 or 90 min. Milk samples were protected from light. Riboflavin
levels were analyzed by high-performance liquid chromatography. Each group value represents a mean ±
standard error. Multiple group comparisons were carried out by one-way ANOVA. Differences of p < 0.05
were considered statistically significant.
72
compared to control group of these flavocoenzymes were observed.
5.2 Reduction of Cimetidine Excretion into Milk by High-Dose Riboflavin The initial set of experiments was conducted using 5 μg/g weight of cimetidine.
Milk and plamsa samples were collected at 90 minutes after riboflavin or PBS IV
injections, or in other words, at 60 minutes after cimetidine IV injection (Refer to
Experimental Time-line, page 47). Milk levels of cimetidine trended toward reduction
with high-dose riboflavin treatment; however, statistical significance was not observed
(Figure 23). Similarly, no significant differences in plasma levels of cimetidine were
observed. MP ratios of control and treatment groups were 4.59 and 4.14, respectively.
The reported MP ratio of cimetidine in FVB/N mice at 30 minutes post-injection
was about 13 (Jonker et al., 2005). As our observations indicated a 3-fold reduced MP
ratio at 60 minutes post cimetidine injection, the milk and plasma sampling time-points
were moved to 30 minutes after cimetidine IV injection. At this time-point and using 5
μg/g weight of cimetidine, a significant reduction in milk levels of cimetidine in the
treatment group was observed (Figure 24). No significant differences in plasma levels
of cimetidine were observed. MP ratios of control and treatment groups were 1.91 and
1.36, respectively. Experimental MP ratios are summarized in Figure 25.

73
Figure 23. Milk and Plasma Levels of 5 mg/kg 3H-Cimetidine in FVB/N Mice at 60 min after
cimetidine IV injection. One-week lactating FVB/N mice were intravenously administered riboflavin
(treatment group) or phosphate buffered saline (control group). Riboflavin was dissolved in phosphate
buffered saline, and injected at a dose of 5 μg/g body weight. After 30 min, radiolabeled cimetidine [N-
methyl-3H] was injected into the tail vein at the dose 5 mg/kg body weight. To enhance milk secretion, 250
μL of a 1 IU/ml oxytocin solution was injected subcutaneously 10 min prior to milk sampling. At 90 min,
milk was collected from the inguinal mammary glands, followed by blood collection via cardiac puncture 1-
2 minutes later. Whole blood was centrifuged at 2000 x g for 10 min at room temperature. Plasma was
transferred into new tubes. Levels of radioactivity in plasma and milk samples were determined by liquid
scintillation counting. Each group value represents a mean ± standard deviation. Mean Milk-to-Plasma
ratios are as follows: Control 4.59; Treatment 4.14. Comparisons between the groups were accomplished
by Student’s independent t-test. Differences of p < 0.05 were considered statistically significant.

74
Figure 24. Milk and Plasma Levels of 5 mg/kg 3H-Cimetidine in FVB/N Mice at 30 min after
cimetidine IV injection. One-week lactating FVB/N mice were intravenously administered riboflavin
(treatment group) or phosphate buffered saline (control group). Riboflavin was dissolved in phosphate
buffered saline, and injected at a dose of 5 μg/g body weight. 30 min later, radiolabeled cimetidine [N-
methyl-3H] was injected into the tail vein at the dose 5 mg/kg body weight. To enhance milk secretion, 250
μL of a 1 IU/ml oxytocin solution was injected subcutaneously 10 min prior to milk sampling. At 60 min,
milk was collected from the inguinal mammary glands, followed by blood collection via cardiac puncture 1-
2 minutes later. Whole blood was centrifuged at 2000 x g for 10 min at room temperature. Plasma was
transferred into new tubes. Levels of radioactivity in plasma and milk samples were determined by liquid
scintillation counting. Each group value represents a mean ± standard deviation. Mean Milk-to-Plasma
ratios are as follows: Control 1.91; Treatment 1.36. Comparisons between the groups were accomplished
by Student’s independent t-test. Differences of p < 0.05 were considered statistically significant. * denotes
a statistically significant result.

75
Figure 25. Summary of Cimetidine Milk-to-Plasma Ratios. Milk and plasma samples were collected at
30 or 60 minutes after cimetidine IV injection. Levels of radioactivity in plasma and milk samples were
determined by liquid scintillation counting. Comparisons between the groups were accomplished by
Student’s independent t-test. Differences of p < 0.05 were considered statistically significant. *denotes a
statistically significant result.

76
DISCUSSION
1. RFT mRNA Expression Studies in vitro
Recent discovery of RFT (Yonezawa et al., 2008; Yamamoto et al., 2009; Yao et
al., 2010) provided a possible explanation and mechanism for riboflavin transport within
the body. Although mRNA expression of these transporters was investigated in various
tissues (Yonezawa et al., 2008; Yamamoto et al., 2009), including small intestine,
nothing was known about RFT expression in the mammary gland. Given the fact that
riboflavin is highly concentrated in the breast milk (Lawrence, 2005a; Hustad et al.,
2000), it was reasonable to hypothesize that the mammary gland could expresses RFT.
I used human and mouse mammary epithelial cells as a model to investigate the
possibility of mammary RFT mRNA expression. Two human mammary epithelial cell
lines were used: T47D and MCF10A, a ductal carcinoma and a non-tumorigenic
epithelial cell lines, respectively. The mRNA expression of all three human RFT was
detected in these cells. Interestingly, despite the dissimilar origin of these cells and
potential cell line-to-cell line differences, the relative mRNA expression profiles of RFT
were remarkably comparable between these cell lines. Specifically, hRFT2 showed a
predominant expression in human mammary cells. Such differential expression of RFT
was also noted in human small intestine and Caco2 cells (Subramanian et al., 2011b).
In both instances, hRFT2 expression was shown to be significantly higher than that of
hRFT1 and hRFT3. Together these findings may suggest a principal role of hRFT2 in
riboflavin transport in the human intestine and mammary gland; however, given the lack
of knowledge about protein expression of RFT this point remains a speculation.
Similarly, two mouse mammary epithelial cell lines were used: EMT6 and HC11,
mammary carcinoma cells and BALB/c mouse mammary cells, latter considered to
retain important characteristics of normal mammary epithelia. Both were shown to
express Rft in my experiments. However, unlike the human mammary epithelial cells,
mRft1 expression was significantly higher than mRft2 in the two cell lines. This
observation indicated that there might be species specific differences in relative
expression profiles of Rft, and possibly in their contribution to riboflavin transport in a
given organism. The observed patterns of relative expression in the human and mouse
mammary epithelial cell lines brought forth the question about the Rft expression
profiles in vivo.
Because of practical and ethical issues, obtaining human mammary tissue is

77
challenging. Therefore, to investigate RFT expression in human mammary gland a
noninvasive method is desirable. Isolating and analyzing cells from breast milk
represents such a method. However, a few important issues must be considered. First,
the cellular fraction of breast milk is a complex matrix, consisting not only of mammary
epithelial cells, but also of macrophages and leukocytes (Ho et al., 1979; Boutinaud and
Jammes, 2002). Second, both cell count and relative cellular composition of breast milk
change with time, with the proportion of epithelial cells increasing from colostrum to mid-
lactation (Ho et al., 1979; Brooker, 1980). Therefore, in an attempt to enhance the
contribution of mammary epithelial cells (in the cell pellet) to my planned analysis, I
used mature breast milk 1-2 months postpartum. In addition to isolating RNA from the
milk cells (pellet), RNA from human mammary epithelial cell fragments (milk fat) was
also isolated (see page 30). It has been shown that milk fat globules contain
cytoplasmic fragments of epithelial cells, and are therefore, an additional way of
assessing gene expression more specific to mammary epithelial cells (Maningat et al.,
2009).
Real-time PCR analysis revealed that in cell pellet and milk fat cell fragments,
hRFT3 mRNA expression tended to be high, as compared to hRFT1 and hRFT2. The
lack of statistical significance is potentially explained by the small sample size (n = 4).
Because the exact pattern of RFT mRNA expression differs between human epithelial
cell lines and cells derived from human breast milk, it is difficult to predict the true
picture of RFT expression in the human mammary epithelium. As mammary cell lines
are derived from a diseased tissue, the contribution of the disease state to RFT
expression cannot be ruled out. Similarly, the relative contribution of non-epithelial milk
cells, isolated from the cellular pellet, and its effect on characterized RFT expression is
unknown. Furthermore, the epithelial cellular fragments from the milk fat may not be
representative of a complete human mammary secretory epithelium, as they are only
cell fragments. Nevertheless, regardless of the specific pattern of expression, RFT are
likely present in the human mammary gland.
Overall, it is possible to conclude that RFT mRNAs are expressed in the
mammary epithelial cell lines and potentially in the human mammary tissue. The relative
expression of different RFT and their contribution to riboflavin transport may be species-
specific.

78
2. Rft mRNA Expression Studies in Mice in vivo
The initial observation that protein levels of BCRP were upregulated in the
lactating mammary glands of various species (Jonker et al., 2005), including humans
and mice, was puzzling, because the increased levels of this transporter and its
xenobiotic substrates in milk, may be detrimental to the offspring. One possible
explanation to this phenomenon came with the discovery of BCRP-mediated transport
of an essential vitamin, riboflavin (van Herwaarden et al., 2007). It was proposed that
mammary BCRP is necessary for mother-to-infant nutrient transfer, hence, its dramatic
upregulation in lactation.
In our study, we have confirmed this pattern of mammary BCRP expression at
the mRNA level, which was previously unexplored. We have observed a dramatic
increase in Bcrp in the lactating mammary glands of FVB/N and C57Bl/6 mice. As
predicted, the levels of mammary Bcrp declined to the pre-pregnancy levels in the
involuting gland of FVB/N mice. Taken together, these findings suggest lactation-
specific functions of mammary BCRP, one of which may include enhanced nutrient
supply to the newborn.
A few mechanisms may explain the observed upregulation in mammary BCRP
expression. For instance, progesterone and estradiol have been shown to regulate
BCRP expression in vitro (Ee et al., 2004; Imai et al., 2005; Wang et al., 2008). Given
the significant involvement of these hormones in mammary gland development during
pregnancy and lactation, the contribution of hormonal regulatory pathways to mammary
BCRP upregulation should be considered. In addition, it has also been noted that
heterodimerization between the retinoid X receptor and the peroxisome proliferator-
activated receptor-γ resulted in an increase in BCRP expression in dendritic cells
(Szatmari et al., 2006). Contributions of this pathway to mammary BCRP upregulation
may have to be evaluated. Also, it was suggested that BCRP expression is
transcriptionally upregulated through the inhibition of extracellular signal-regulated
kinase pathway, providing yet another possible mechanism of mammary BCRP
regulation (Imai et al., 2009).
It was reasonable to assume that if nutrient transport to the infant through
maternal milk was essential, other nutrient transporters may also be upregulated in
lactation. RFT were suitable candidates to test this hypothesis, because of their
potential role in mammary riboflavin transport. By investigating their expression in the

79
mammary gland of FVB/N mice, I made an observation that both mRft1 and mRft2
levels were increased in lactation. Of the two, mRft1 showed a more pronounced
upregulation, as indicated by > 10-fold increase when compared to the virgin state (this
observation is also true for C57Bl/6 lactating mice). Although elevated in lactation,
mRft2 levels were more variable and lower than mRft1. Interestingly, the mRft1
dominant expression pattern observed in mouse mammary epithelial cell lines was also
maintained in vivo. At all stages of mammary development, mammary mRft1 mRNA
expression exceeded that of mRft2. Assuming that mRFT1 takes a primary role in
riboflavin transport (compared to mRFT2) in the mammary gland, then it is not
surprising that mRft1 mRNA shows a more distinct upregulation.
Another possible explanation may rely on differential functions of RFT. Although
the localization of RFT and their direction of transport in the mammary gland is unknown,
it may be possible that RFT1 and RFT2 are expressed on the opposite sides of
mammary epithelium, and therefore, have different roles in riboflavin transport. For
instance, if RFT2 is expressed luminally and serves as a complementary mechanism to
mammary BCRP excretion of riboflavin, then a dramatic upregulation in its levels may
be redundant. On the other had, if RFT1 is the sole transporter responsible for
riboflavin uptake to the mammary epithelium, then its remarkable upregulation in
lactation may be essential. However, without additional localization and function studies
of mammary RFT, these are simply theoretical renderings.
While some transporters are upregulated in lactation, others are downregulated.
Jonker et al. (2005) have shown that certain ABC transporters, including Pgp and MRP2,
are downregulated at the protein level in the lactating mammary gland of FVB mice. I
have shown similar findings in mRNA expression of these proteins. Although only
mammary Mrp2 mRNA has shown a statistically significant reduction in lactation, the
trend towards diminished mRNA levels in lactation is clear for Pgp. Most importantly,
however, is the fact that neither of these transporters are upregulated; thereby,
underscoring the significance of Rft and Bcrp patterns of mammary expression.
Because mammary gland consists of various cell types, it was essential to
confirm that Rft and Bcrp mRNA expression profiles, observed in the whole mammary
gland, were reflective of the cell type of interest – mammary epithelial cells. By applying
laser capture microdissection (LCM), RNA was isolated from mammary epithelium of
FVB/N mice. It was observed that both Bcrp and mRft1 where significantly upregulated

80
in the lactating epithelium, as compared to the virgin state. Interestingly, lactating
epithelial levels of Bcrp seemed upregulated by 20-fold more when compared to the
whole tissue levels. This may suggest that mammary epithelium in lactation is a
predominant contributor to BCRP expression.
On the other hand, lactating epithelial levels of mRft1 were slightly less than
those observed in the whole tissue. Here two explanations are possible. First, the
contribution of non-epithelial cells, including adipocytes and endothelial cells, to mRft1
levels detected in the mammary gland may not be marginal. Second, the type of
mammary epithelial cells may be of importance. In our experiment, longitudinal sections
of mammary gland were performed. This did not allow for clear distinction between
ductal and acinar mammary epithelium. Assuming that RFT are crucial for riboflavin
transfer into the milk, it stands to reason that acinar epithelial cells could be of the most
importance, as they mainly function in lactogenesis, and the LCM approach may have
failed to capture the acinar structure. Further analysis, using cross-sections of the
mammary tissue, may address Rft sub-tissue expression.
As for mRft2, no upregulation in mouse mammary epithelial cells was observed.
The most likely explanation for this observation lies in technical issues of the LCM. LCM
allows for morphological specificity at a cost of sensitivity. Although this method works
quite well for highly expressed genes when relative expression is in question, the
difficulty arises with low expression genes. Overall, it is likely that mRft2 expression in
mouse mammary epithelial cells is enhanced in lactation; however, a more robust
method of RNA isolation and further analysis is necessary to confirm this conjecture.
Lastly, the proximal small intestinal levels of Rft, used as a positive control for Rft
mRNA expression, remain relatively unchanged during pregnancy and lactation in the
FVB/N mice. Whether the statistically significant reduction of mRft2 in the small intestine
during gestation stage has any biological significance is open to speculations.
3. RFT Protein Expression
Previous attempts to raise antibodies against hRFT1 have been unsuccessful
(Yonezawa et al., 2008). Our endeavor to raise an antibody against mRFT1 was
similarly fruitless.
No attempts to produce an anti-hRFT2 antibody have been discussed in the
literature. Yet, a commercial polyclonal anti-RFT2 antibody is available from Santa Cruz

81
Biotechnology. The manufacturer claims this antibody to cross-react with human,
mouse and rat RFT2 proteins. We have used the anti-RFT2 antibody to evaluate the
levels of this protein in the mammary glands of FVB/N mice. Our mRNA studies
indicated a dramatic upregulation of mRft2 in lactation, followed by a return to virgin-like
levels during involution. It was hypothesized that the similar pattern of expression would
be observed at the protein level. The predicted size of mRFT2 is 49.6 kDa. Interestingly,
in the lactating state, we have observed two bands at 50 kDa and 40 kDa, with
noticeably stronger signal for the latter band. The signal at 40 kDa persisted in both
virgin and involuting mammary preparations, with no signal observed at 50 kDa. The
signal at 40 kDa was not initially anticipated. Whether it represents a splice variant of
mRFT2, or a completely different protein remains unknown.
Although it cannot be said for certain, which signal (if any) is to be attributed to
mRFT2, the pattern of protein expression observed at both 40 kDa and 50 kDa closely
parallels our mRNA findings. If true, this finding may suggest a lactation-specific role of
mammary mRFT2 in concentrating riboflavin in the milk.
In order to make a definitive conclusion, anti-RFT2 antibody must be validated.
One approach involves fusing GFP and RFT2 proteins. Here, by expressing the fusion
protein in a cell line of choice, and later running Western blots incubated in anti-GFP
and anti-RFT2 antibodies, the banding pattern can be analyzed. If signals recognized by
these two antibodies align, it could be possible that anti-RFT2 antibody indeed reacts
with RFT2. Alternately, a more robust proteomics approach can be applied, where
sequencing of a specific band could be performed; thereby, identifying the protein in
question.
4. Subcellular Localization of hRFT2 in Mammary-derived Cell Line MCF10A
Our mRNA studies and those of others (Subramanian et al., 2011b) indicate that
relative expression of hRFT2 exceeds that of other RFT. Hypothesizing that the same
observation is conserved at the protein level, and that functionally hRFT2 may play a
primary role in riboflavin transport, it was decided to investigate the localization of
hRFT2 in a mammary gland model.
Previous studies have shown that hRFT2 is localized primarily to the plasma
membrane of the HEK-293, Caco-2 and canine kidney MDCK cells (Yao et al., 2010;
Subramanian et al., 2011b). It was also shown that hRFT2 was exclusively expressed at

82
the apical membrane of the polarized human intestinal (Subramanian et al., 2011b). It
was hypothesized that in mammary epithelial cells, hRFT2 would be similarly localized
to plasma membrane, and likely to be expressed on the basal side of polarized
mammary epithelial cells.
Indeed, it was observed that in MCF10A mammary epithelial cells, GFP-hRFT2
fusion was localizing to the plasma membrane, underscoring a role for hRFT2 in
riboflavin transport across the cellular membrane. Although at the moment, it cannot be
stated, where on the plasma membrane of mammary epithelial cells hRFT2 is
expressed, we are currently exploring ways to polarize mammary epithelium, in order to
answer this question.
Overall, our observations are in agreement with the others: hRFT2 is localized to
the plasma membrane.
5. Riboflavin-Cimetidine Interaction Study in Mice in vivo
BCRP plays a major role in excretion of drugs and toxins into the breast milk
(Robey et al., 2009), such as chemotherapeutic agents, carcinogens and multiple other
drugs, including cimetidine. Implications for some of these drugs on the nursing infant
are currently unknown. Therefore, an intervention strategy to decrease BCRP-
transported xenobiotic excretion into breast milk may be necessary.
Cimetidine was chosen as a model drug for investigation of mammary BCRP
transport in vivo. It was hypothesized that mammary BCRP transport function could be
saturated with riboflavin, a vitamin with no known adverse effects; thereby, reducing the
accumulation of cimetidine in the milk.
To test this hypothesis, the dose of riboflavin supplementation was initially
characterized, by measuring milk and plasma levels of this vitamin 90 minutes after
administration. This time point was chosen initially as the endpoint of the proposed
experiment. Compared to the control FVB/N mice on standard chow, intravenous
administration of riboflavin at 2 μg/g and 5 μg/g of body weight significantly enhanced
the milk riboflavin levels, with only a slight increase at 5 μg/g when compared to 2 μg/g
dosing. On the other hand, plasma levels were dramatically increased only at 5 μg/g of
body weight of riboflavin. This observation suggested that at a dose of 5 μg/g of body
weight systemic riboflavin excretion including milk secretion is saturated, resulting in an
increase of plasma riboflavin. This observation is further supported by comparing MP

83
ratios of control and supplemented groups: 64, 62, 63, and 23 being the MP ratios of
control, 1 μg/g, 2 μg/g and 5 μg/g body weight riboflavin, respectively. Therefore, it was
decided to utilize a dose of 5 μg/g body weight of riboflavin to conduct the mammary
BCRP competition study.
By following the experimental outline (see page 47), using the 90 minute
endpoint, no significant reduction in milk levels of cimetidine was observed. It was
expected that in the presence of high-dose riboflavin supplementation, cimetidine milk
levels will be decreased, while plasma levels may rise. Furthermore, the observed MP
ratio of cimetidine was lower than expected. Jonker and colleagues (2005) report an MP
ratio of 13 at 30 minutes post-dose for cimetidine; however, we have only observed an
MP ratio of about 4 at 60 minutes post-dose.
It was then decided to alter the original protocol, and move the endpoint of the
experiment to 60 minutes. Additional quantifications of milk riboflavin levels at 60 and 30
minutes, using 5 μg/g body weight supplementation, were conducted in order to ensure
the milk levels of this vitamin remained sufficiently high. It was observed that in the
presence of high-dose riboflavin supplementation, cimetidine milk levels were
significantly reduced. This finding suggests that it may be possible to manipulate
mammary BCRP function, thereby reducing its substrate transport into the milk.
Having said that, it is unclear why our cimetidine MP ratios at 30 minutes post-
dose were still low, about 2 as compared to the study by Jonker et al. By comparing our
observations to those of Jonker and colleagues (2005), it can be seen that even though
the milk levels of 3H-cimetidine are similar, it is the plasma levels of the drug that makes
the difference. At 30 minutes post-dose, Jonker et al. (2005) report plasma 3H-
cimetidine levels to be 150 ng/ml, while we observe 1000 ng/ml. One possible
explanation is the difference in clearance between the animals used. Even though both
Jonker et al. (2005) and we used mice of the FVB genetic background, some
differences may be expected, as these animals are inbred.
Another explanation may relate to milk riboflavin levels in the animals on
standard chow. Even though the levels of riboflavin per kilogram of chow may be
identical, it is difficult to predict the eating behaviours and their differences between the
animals. It may be possible, that initially milk levels of riboflavin in mice used by Jonker
et al. (2005) were lower; thereby, indirectly influencing the cimetidine transport through
BCRP.

84
6. Limitations
We have characterized RFT mRNA expression in mammary epithelial cells in
vitro. Given further attempts to evaluate the possible patterns of expression in the
breast milk cells, the precise expression profiles in the human mammary gland and
epithelial cells in vivo remain unknown. Having shown that certain RFT are
predominantly expressed in mammary epithelial cell lines, it is unclear whether higher
mRNA levels relate directly to functional activity and protein expression. Specific and
sensitive RFT antibodies are needed to further address some of these questions.
7. Future Directions
There are a number of directions that can follow from this project. Firstly,
functional analysis and contribution of mammary RFT to riboflavin transport could be
further determined, in order to understand the patterns of predominance observed in
this project. Secondly, localization of hRFT-GFP fusion proteins in human polarized
mammary epithelium can be evaluated. These finding may suggest the likely
differences between RFT and their roles in mammary riboflavin transport. Furthermore,
raising and validating specific antibodies against RFT may provide not only a way to
analyze protein expression of RFT in cells and tissues, but also an alternative way of
evaluating RFT localization by immunohistochemistry in whole mammary gland
preparations.
In addition, the experimental protocols, described under BCRP interaction
studies, could be applied to study the effect of riboflavin enhanced or deficient diet on
BCRP substrate xenobiotics. Similarly, other substrates, such as chemotherapeutic
agents, and their interactions with riboflavin for BCRP transport could be evaluated. If
these proof-of-principle in vivo experiments show clinically significant differences, the
next step would be to refine the dosing schedule of riboflavin for clinical studies.

85
CONCLUSIONS
Currently, very little is known about riboflavin transport in the mammary gland. In
addressing Specific Hypothesis 1, I was able to show that RFT mRNAs are differentially
expressed in human and mouse mammary cell lines, as well as cells derived from
human breast milk and mouse mammary glands. In the mouse mammary tissue RFT
mRNAs were shown to be upregulated in lactation, consistent with Specific Hypothesis
1. Under Specific Hypothesis 2, I have shown that hRFT2 is expressed on the plasma
membrane of MCF10A mammary epithelial cells. Overall, these findings suggest a
potential role of RFT in mammary riboflavin transport. Informed by these findings, the
riboflavin-cimetidine interaction experiments in mice in vivo further suggested that
riboflavin may be utilized to reduce milk excretion of BCRP substrate xenobiotics.
This study provides valuable insight into mammary riboflavin transport and its
potential use for pharmacological intervention. It is hoped that further studies evaluating
BCRP-RFT networks of riboflavin transport will open doors to novel clinical application.

86
REFERENCES
Alcorn, J., Lu, X., Moscow, J.A., McNamara, P.J. (2002) Transporter gene expression in lactating and nonlactating human mammary epithelial cells using real-time reverse transcription-polymerase chain reaction. J Pharmacol Exp Ther 303:487.
Ames, B.N., Elson-Schwab, I., Silver, E.A. (2002) High-dose vitamin therapy stimulates
variant enzymes with decreased coenzyme binding affinity (increased Km): relevance to genetic disease and polymorphisms. Am J Clin 75:616.
Annilo, T., Chen, Z.Q., Shulenin, S., Costantino, J., Thomas, L., Lou, H., Stefanov, S.,
Dean, M. (2008) Evolution of the vertebrate ABC gene family: analysis of gene birth and death, Genomics 88:1.
Assaraf, Y.G. (2006) The role of multidrug resistance efflux transporters in antifolate
resistance and folate homeostasis. Drug Resist Updat 9:227.
Aust, S., Obrist, P., Jaeger, W., Klimpfinger, M., Tucek, G., Wrba, F., Penner, E., Thalhammer, T. (2004) Subcellular localization of the ABCG2 transporter in normal and malignant human gallbladder epithelium. Lab Invest 84:1024.
Benderra, Z., Faussat, A.M., Sayada, L., Perrot, J.Y., Chaoui, D., Marie, J.P., Legrand, O.
(2004) Breast cancer resistance protein and P-glycoprotein in 149 adult acute myeloid Leukemias. Clin Cancer Res 10:7896.
Bennett, P.N., Matheson, I., Notarianni, L.J., Rane, A., Reihardt, D. Monographs on
individual drugs, in Drugs and human lactation: a comprehensive guide to the content and consequences of drugs, micronutrients, radiopharmaceuticals, and environmental and occupational chemicals in human milk, Elsevier (1996).
Betz, A., Ren, X.D., Ennis, S.R., Hultquist, D.E. (1994) Riboflavin reduces edema in focal
cerebral ischemia. Acta Neurochir Suppl 60:314. Blot, W.J., Li, J.Y., Taylor, P.R., et al. (1993) Nutrition intervention trials in Linxian, China:
supplementation with specific vitamin/mineral combinations; cancer incidence and disease-specific mortality in the general population. J Natl Cancer Inst 85:1483.
Blyth, A.W. (1879) The composition of cow's milk in health and disease. J Chem Soc
35:530. Boehnke, C., Reuter, U., Flach, U., Schuh-Hofer, S., Einhaupl, K.M., Arnold G. (2004)
High-dose riboflavin treatment is efficacious in migraine prophylaxis: an open study in a tertiary care centre. Eur J Neurol 11: 475.
Bosch, A.M., Abeling, N.G., Ijlst, L., Knoester, H., van der Pol, W.L., Stroomer, A.E.,
Wanders, R.J., Visser, G., Wijburg, F.A., Duran M., Waterham, H.R. (2011) Brown-Vialetto-Van Laere and Fazio Londe syndrome is associated with a riboflavin transporter defect mimicking mild MADD: a new inborn error of metabolism with potential treatment. J Inherit Metab Dis 34:159.

87
Boushey, C.J., Beresford, S.A., Omenn, G.S., Motulsky, A.G. (1995) A quantitative
assessment of plasma homocysteine as a risk factor for vascular disease. Probable benefits of increasing folic acid intakes. JAMA 274:1049.
Boutinaud, M., Jammes, H. (2002) Potential uses of milk epithelial cells: a review. Reprod
Nurt Dev 42:133. Brooker, B.E. (1980) The epithelial cells and cell fragments in human milk. Cell Tissue
Res 210:321. Buehler, B.A. (2011) Vitamin B2: Riboflavin. J Evid Based Complement Alternat Med
16:88. Cardiff, R.D., Wellings, S.R. (1999) The comparative pathology of human and mouse
mammary glands. J Mammary Gland Biol Neoplasia 4:105. Chasnoff, I.J., Lewis, D.E., Squires, L. (1987) Cocaine intoxication in breast-fed infant.
Pediatrics 80:836. Chastain, J.L., McCormick, D.B. (1987) Flavin catabolites: identification and quantitation
in human urine. Am J Clin Nutr 46:830. Cochi, S.L., Fleming, D.W., Hightower, A.W., Limpakarnjanarat, K., Facklam, R.R., Smith,
J.D., Sikes, R.K., Broome, C.V. (1986) Primary invasive Haemophilus influenzae type b disease: a population-based assessment of risk factors. J Pediatr 108:887.
Cooray, H.C., Blackmore, C.G., Maskell, L., Barrand, M.A. (2002) Localisation of breast
cancer resistance protein in microvessel endothelium of human brain. Neuroreport 13:2059.
Crichton, R.R., Roman, F., Wauters, M. (1975) Reductive mobilisation of ferritin iron by
reduced nicotinamide adenine dinucleotide via flavin mononucleotide. Biochem Soc Trans 3:946.
Davidson, A.L., Chen, J. (2004) ATP-binding cassette transporters in bacteria. Annu Rev
Biochem 73:241. Dean, M., Rzhetsky, A., Allikmets, R. (2001) The human ATP-binding cassette (ABC)
transporter superfamily. Genome Res11:1156. Decker, K., Dotis, B., Glatzle, D., Hinselmann, M. (1977) Riboflavin status and anaemia in
pregnant women. Nutr Metab 21S:17. Dewey, K.G., Heinig, M.J., Nommsen-Rivers, L.A. (1995) Differences in morbidity
between breast-fed and formula-fed infants. J Pediatr 126:696. Diestra, J.E., Scheffer, G.L., Catala, I., Maliepaard, M., Schellens, J.H., Scheper, R.J.,
Germa-Lluch, J.R., Izquierdo, M,A. (2002) Frequent expression of the multi-drug

88
resistance-associated protein BCRP/MXR/ABCP/ABCG2 in human tumours detected by the BXP-21 monoclonal antibody in paraffin-embedded material. J Pathol 198:213.
Doyle, L.A., Yang, W., Abruzzo, L.E., Krogmann, T., Gao, Y., Rishi, A.K., Ross, D.D.
(1998) Cloning and characterization of breast cancer resistance protein (BCRP), a novel ATP-binding cassette (ABC) transporter that may contribute to the multi drug resistance phenotype of MCF-7/AdrVp breast cancer cells, Proc Am Assoc Cancer Res 39:656.
Ee, P.L., Kamalakaran, S., Tonetti, D., He, X., Ross, D.D., Beck, W.T. (2004)
Identification of a novel estrogen response element in the breast cancer resistance protein (ABCG2) gene. Cancer Res 64:1247.
Emmett, A.D., Luros, G.O. (1920) Water soluble vitamins. I. Are the antineuretic and the
growth-promoting water soluble B vitamins the same? J Biol Chem 43:265. Enokizono, J., Kusuhara, H., Ose, A., Schinkel, A.H., Sugiyama, Y. (2008) Quantitative
investigation of the role of breast cancer resistance protein (Bcrp/Abcg2) in limiting brain and testis penetration of xenobiotic compounds. Drug Metab Dispos 36:995.
Enokizono, J., Kusuhara, H., Sugiyama, Y. (2007) Involvement of breast cancer
resistance protein (BCRP/ABCG2) in the biliary excretion and intestinal efflux of troglitazone sulfate, the major metabolite of troglitazone with a cholestatic effect. Drug Metab Dispos 35:209.
Faron, G., Drouin, R., Pedneault, L. (2011) Recurrent cleft lip and palate in siblings of a
patient with malabsorption syndrome, probably caused by hypovitaminosis A associated with folic acid and riboflavin deficiencies. Teratology 63:161.
Fetsch, P.A., Abati, A., Litman, T., Morisaki, K., Honjo, Y., Mittal, K., Bates, S.E. (2006)
Localization of the ABCG2 mitoxantrone resistance-associated protein in normal Tissues. Cancer Lett 8:84.
Forman, H.J., Zhang, H., Rinna, A. (2009) Glutathione: Overview of its protective roles,
measurement, and biosynthesis. Mol Aspect Med 30:1. Foy, H., Kondi, A. (1953) A case of true red cell aplastic anaemia successfully treated
with riboflavin. J Pathol Bacteriol 65:559. Foy, H., Kondi, A. (1984) The vulnerable oesophagus: riboflavin deficiency and squamous
cell dysplasia of the skin and the oesophagus. J Natl Cancer Inst 72:941. Foy, H., Kondi, A., Mbaya, V. (1964) Effects of riboflavin deficiency on bone marrow
function and protein metabolism in baboons. Br J Nutr 18:307. Frey, O.R., Scheidt, P., von Brenndorff, A.I. (1998) Adverse effects in a newborn infant
breast-fed by a mother treated with doxepin. Ann Pharmacother 33:690. Furth, P.A. (1999) Mammary gland involution and apoptosis of mammary epithelial cells.
J Mammary Gland Biol Neoplasia 4:123.

89
Gastaldi, G., Ferrari, G., Verri, A., Casirola, D., Orsenigo, M.N., Laforenza, U. (2000)
Riboflavin phosphorylation is the crucial event in riboflavin transport by isolated rate enterocytes. J Nutr 130:2556.
Gedeon, C., Anger, G., Piquette-Miller, M., Koren, G. (2008) Breast cancer resistance
protein: mediating the trans-placental transfer of glyburide across the human placenta. Placenta 29:39.
Gerk, P.M., Oo, C.Y., .Paxton, E.W., Moscow, J.A., McNamara, P.J. (2001) Interactions
between cimetidine, nitrofurantoin, and probenecid active transport into rat milk, J Pharmacol Exp Ther 296:175.
Green, P., Wiseman, M., Crow, Y.J., Houlden, H., Riphagen, S., Lin, J.P., Raymond, F.L.,
Childs, A.M., Sheridan, E., Edwards, S., Josifova, D.J. (2010) Brown-Vialetto-Van Laere syndrome, a ponto-bulbar palsy with deafness, is caused by mutations in c20orf54. Am J Hum Genet 86:485.
Gutmann, H., Hruz, P.. Zimmermann, C., Beglinger, C., Drewe, J. (2005) Distribution of
breast cancer resistance protein (BCRP/ABCG2) mRNA expression along the human GI tract. Biochem Pharmacol 70:695.
He, Y., Ye, L., Shan, B., Song, G., Meng, F., Wang, S. (2009) Effect of riboflavin-fortified
salt nutrition intervention on esophageal squamous cell carcinoma in a high incidence area, China. Asian Pac J Cancer Prev 10:619.
Henriksen, U., Gether, U., Litman, T. (2005) Effect of Walker A mutation (K86M) on
oligomerization and surface targeting of the multidrug resistance transporter ABCG2 J Cell Sci 118:1417.
Hens, J.R., Wysolmerski, J.J. (2005) Key stages of mammary gland development:
molecular mechanisms involved in the formation of the embryonic mammary gland. Breast Cancer Res 7:220.
Hibberd, C.M., Brooke, O.G., Carter, N.D., Haug, M., Harzer, G. (1982) Variation in the composition of breast milk during the first 5 weeks of lactation: implications for the feeding of preterm infants. Arch Dis Child 57:658.
Higgins, C.F. (1992) ABC transporters: from microorganisms to man. Annu Rev Cell Biol
8:67. Hirano, M., Maeda, K., Matsushima, S., Nozaki, Y., Kusuhara, H., Sugiyama, Y. (2005)
Involvement of BCRP (ABCG2) in the biliary excretion of pitavastatin. Mol Pharmacol. 68:800.
Ho, F.C.S., Wong, R.L.C., Lawton, J.M.W. (1979) Human colostral and breast milk cells.
Acta Paediatr Scand 68:389.
90
Ho, G., Yonezawa, A., Masuda, S., Inui, K., Sim, K.G., Carpenter, K., Olsen, R.K., Mitchell, J.J., Rhead, W.J., Peters, G., Christodoulou, J. (2011) Maternal riboflavin deficiency, resulting in transient neonatal-onset glutaric aciduria Type 2, is caused by a microdeletion in the riboflavin transporter gene GPR172B. Hum Mutat 32:E1976.
Horigan, G., McNulty, H., Ward, M., Strain, J.J., Purvis, J., Scott, J.M. (2010) Riboflavin
lowers blood pressure in cardiovascular disease patients homozygous for the 677C →T polymorphism in MTHFR. J Hypertens 28: 478.
Hovey, R.C., McFadden, T.B., Akers, R.M. (1999) Regulation of mammary gland growth
and morphogenesis by the mammary fat pad: a species comparison. J Mamm Gland Biol Neoplasia 4:53.
Howard, B.A., Gusterson, B.A. (2000) Human breast development. J Mammary Gland
Biol Neoplasia 5:119. Huang, S.N., Phelps, M.A., Swaan, P.W. (2003) Involvment of endocytic organelles in the
subcellular trafficking and localization of riboflavin. J Pharmacol Exp Ther 306:681. Huang, S.N., Swaan, P.W. (2000) Involvement of a receptor-mediated component in
cellular translocation of riboflavin. J Pharmacol Exp Ther 294:117. Huang, S.N., Swaan, P.W. (2001) Riboflavin uptake in human trophoblast-derived BeWo
cell monolayers: cellular translocation and regulatory mechanisms. J Pharmacol Exp Ther 298:264.
Hughes, S.G., Rus, R.C., Nickum, J.G., Rumsey, R. (1981) Biomicroscopic and histologic pathology of the eye in riboflavin-deficient rainbow trout (Salmo gairdneri). Cornell Vet 71:269.
Huls, M., Brown, C.D., Windass, A.S., Sayer, R., van den Heuvel, J.J., Heemskerk, S.,
Russel, F.G., Masereeuw, R. (2008) The breast cancer resistance protein transporter ABCG2 is expressed in the human kidney proximal tubule apical membrane. Kidney Int 73:220.
Hultquist, D.E., Xu, F., Quandt, K.S., Shlafer, M., Mack, C.P. (1993) Evidence that
NADPH-dependent methaemoglobin reductase and administered riboflavin protect tissue from oxidative injury. Am J Hematol 42:13.
Humphrey, L.L., Fu, R., Rogers, K., Freeman, M., Helfand, M. (2008) Homocysteine level
and coronary heart disease incidence: a systematic review and meta-analysis. Mayo Clin Proc 83:1203.
Hustad, S., Ueland, P.M., Vollset, S.E., Zhang, Y., Bjorke-Monsen, A.L., Schneede, J.
(2000) Riboflavin as a determinant of plasma total homocysteine: effect modification by the methylenetetrahydrofolate reductase C677T polymorphism. Clin Chem 46:1065.
Huston, G.E., Patton, S. (1990) Factors related to the formation of cytoplasmic crescents
on milk fat globules. J Dairy Sci 73:2061.

91
Imai, Y., Ishikawa, E., Asada, S., Sugimoto, Y. (2005) Estrogen-mediated post
transcriptional down-regulation of breast cancer resistance protein/ABCG2. Cancer Res 65:596.
Imai, Y., Ohmori, K., Yasuda, S., Wada, M., Suzuki, T., Ueda, Y. (2009) Breast cancer
resistance protein/ABCG2 is differentially regulated downstream of extracellular signal-regulated kinase. Cancer Sci 100:1118.
Innis, W.S., McCormick, D.B., Merrill, A.H. Jr. (1986) Variations in riboflavin binding by
human plasma: identification of immunoglobulins as the major proteins responsible. Biochem Med 34:151.
Institute of Medicine, IOM. Otten, J.J., Pitzi Hellwig, J,, Meyers, L.D., eds. Dietary
reference intakes: the essential guide to nutrient requirements. Washington (DC), National Academies Press (2006).
Ito, S. (2000) Drug therapy for breast-feeding women. N Eng J Med 343:118.
Ito, S., Alcorn, J. (2003) Xenobiotic transporter expression and function in the human
mammary glan. Adv Drug Deliv Rev 55:653. Ito, S., Blajchman, A., Stephenson, M., Eliopoulos, C., Koren, G. (1993) Prospective
follow-up of adverse reactions in breast-fed infants exposed to maternal medication. Am J Obstet Gynecol 168:1393.
Ito, S., Koren, G. (1994) A novel index for expressing exposure of the infant to drug in
breast milk. Br J Clin Pharmacol 38:99.
Ito, S., Lee, A. (2003) Drug excretion into breast milk - overview. Adv Drug Deliv Rev 55:617.
Jacques, P.F., Bostom, A.G., Wilson, P.W., Rich, S., Rosenberg, I.H., Selhub, J. (2001) Determinants of plasma homocysteine concentration in the Framingham Offspring cohort. Am J Clin Nutr 73:613.
Jonker, J.W., Merino, G., Musters, S., van Herwaarden, A.E., Bolscher, E., Wagenaar, E.,
Mesman, E., Dale, T.C., Schinkel, A.H. (2005) The breast cancer resistance protein BCRP (ABCG2) concentrates drugs and carcinogenic xenotoxins into milk. Nat Med 11: 127.
Jonker, J.W., Smit, J.W., Brinkhuis, R.F., Maliepaard, M., Beijnen, J.H., Schellens, J.H.,
Schinkel, A.H. (2000) Role of breast cancer resistance protein in the bioavailability and fetal penetration of topotecan. J Natl Cancer Inst 92:1651.
Kage, K., Tsukahara, S., Sugiyama, T., Asada, S., Ishikawa, E., Tsuruo, T., Sugimoto, Y.
(2002) Dominant-negative inhibition of breast cancer resistance protein as drug efflux pump through the inhibition of S–S dependent homodimerization. Int J Cancer 97:626.

92
Kang, S.S., Wong, P., Susmano, A., Sora, J., Norusis, M., Ruggie, N. (1991) Thermolabile methylene tetrahydrofolate reductase: an inherited risk factor for coronary artery disease. Am J Hum Genet 48:536.
Kansara, V., Pal, D., Jain, R., Mitra, A.K. (2005) Identification and functional
characterization of riboflavin transporter in human-derived retinoblastoma cell line (Y-79): mechanisms of cellular uptake and translocation. J Ocul Pharmacol Ther 21: 275.
Koletzko, S., Sherman, P., Corey, M., Griffiths, A., Smith, C. (1989) Role of infant feeding
practices in development of Crohn's disease in childhood. BMJ 298:1617. Kramer, M.S., Aboud, F., Mironova, E., Vanilovich, I., Platt ,R.W., Matush, L., Igumnov, S.,
Fombonne, E., Bogdanovich, N., et al. (2008) Breastfeeding and child cognitive development: new evidence from a large randomized trial. Arch Gen Psychiatry 65:578.
Kratochwil, K., Schwartz., P. (1976) Tissue interaction in androgen response of
embryonic mammary rudiment of mouse: identification of target tissue of testosterone. PNAS 73:4041.
Krishnamurthy, K., Surolia, M., Adiga, P.R. (1984) Mechanism of foetal wastage following
immunoneutralisation of riboflavin carrier protein in the pregnant rat: disturbances in flavin coenzyme levels. FEBS Lett 178:87.
Kumar, C.K., Yanagawa, N., Ortiz, A., Said, H.M. (1998) Mechanism and regulation of
riboflavin uptake by human renal proximal tubule epithelial cell line HK-2. Am J Physiol Renal Physiol 274:F104.
Kumar, S., Clarke, A.R., Hooper, M.L., Horne, D.S., Law, A.J., Leaver, J., Springbett,
A., Stevenson E., Simons, J.P. (1994) Milk composition and lactation of beta-casein-deficient mice. Proc Natl Acad Sci USA 91:6138.
Lawrence, R.A., Lawrence, R.M. Anatomy of the human breast, in Breastfeeding: a guide
for the medical profession, Mosby, St. Louis (2005b). Lawrence, R.A., Lawrence, R.M. Biochemistry of human milk, in Breastfeeding: a guide
for the medical profession, Mosby, St. Louis (2005c). Lawrence, R.A., Lawrence, R.M. Vitamins, in Breastfeeding: a guide for the medical
profession, Mosby, St. Louis (2005a). Lester, B.M., Cucca, J., Andreozzi, L., Flanagan, P., Oh, W. (1993) Possible association
between fluoxetine hydrochloride and colic in an infant. J Am Acad Child Adolesc Psychiatry 32:1253.
Li, M., Liu, X., Robinson, G.W., Bar-Peled, U., Wagner, K.U., Young, W.S., Hennighausen,
L., Furth, P.A. (1997) Mammary-derived signals activate programmed cell death during the first stage of mammary gland involution. Proc Natl Acad Sci USA 94:3425.

93
Lucas, A., Cole, T.J. (1990) Breast milk and neonatal necrotising enterocolitis. Lancet 336:1519.
Lucas, A., Morley, R., Cole, T.J., Lister, G., Leeson-Payne, C. (1992) Breast milk and
subsequent intelligence quotient in children born preterm. Lancet 339:261. Mack, C., Hulquist, D.E., Shlafer, M. (1995) Mycocardial flavin reductase and riboflavin: a
potential role in decreasing reoxygenation injury. Biochem Biophys Res Commun 212:35.
Madadi, P., Ross, C.J.D., Hayden, M.R., Carleton, B.C., Gaedigk, A., Leeder, J.S., Koren,
G. (2009) Pharmacogenetics of neonatal opioid toxicity following maternal use of codeine during breastfeeding: a case–control study. Clin Pharmacol Ther 85:31.
Maliepaard, M., Scheffer, G.L., Faneyte, I.F., van Gastelen, M.A., Pijnenborg, A.C.,
Schinkel, A.H., van De Vijver, M.J., Scheper, R.J., Schellens, J.H. (2001) Subcellular localization and distribution of the breast cancer resistance protein transporter in normal human tissues. Cancer Res 61:3458.
Maningat, P.D, Sen, P., Rijnkels, M., Sunehag, A.L., Hadsell, D.L., Bray, M., Haymond,
M.W. (2009) Gene expression in the human mammary epithelium during lactation: the milk fat globule transcriptome. Physiol Genomics 37: 12.
Maningat, P.D., Sen, P., Sunehag, A.L., Hadsell, D.L., Haymond, M.W. (2007) Regulation
of gene expression in human mammary epithelium: effect of breast pumping. J Endocrinol 195:503.
Massey, V. (2000) The chemical and biological versatility of Riboflavin. Biochem Soc
Trans 28: 283. Matheson,I., Pande, H., Alertsen, A.R. (1985) Respiratory depression caused by N-
desmethyldoxepin in breast milk. Lancet 2:1124. Mayer, E.J., Hamman, R.F., Gay, E.C., Lezotte, D.C., Savitz, D.A., Klingensmith, G.J.
(1988) Reduced risk of IDDM among breast-fed children: the Colorado IDDM Registry. Diabetes 37:1625.
McCollum, E.V., Kennedy, C. (1916) The dietary factors operating in the production of
polyneuritis. J Biol Chem 24:491. McCormick, D.B. Riboflavin, in Modern Nutrition in Health and Disease, 8th ed. (M.E. Shils,
J.A. Olson, and M. Shike, eds.), Lea and Febiger, Philadelphia (1994). McCormick, D.B. Riboflavin, in Present Knowledge in Nutrition, 6th ed. (M.L. Brown, ed.),
International Life Sciences Institute, Washington, DC, (1990). McDevitt, C.A., Collins, R.F., Conway, M., Modok, S., Storm, J., Kerr, I.D., Ford, R.C.,
Callaghan, R. (2006) Purification and 3D structural analysis of oligomeric human multidrug transporter ABCG2. Structure 14:623.

94
McNamara, P.J., Meece, J.A., Paxton, E. (1996) Active transport of cimetidine and
ranitidine into the milk of Sprague Dawley rats. J Pharmacol Exp Ther 277:1615. Merino, G., Jonker, J.W., Wagenaar, E., van Herwaarden, A.E., Schinkel, A.H. (2005)
The breast cancer resistance protein (BCRP/ABCG2) affects pharmacokinetics, hepatobiliary excretion, and milk secretion of the antibiotic nitrofurantoin. Mol Pharmacol 67:1758.
Miller, M.E., Banerjee, N.C., Stowe Jr., C.M. (1967) Diffusion of certain weak organic
acids and bases across the bovine mammary gland membrane after systemic administration. J Pharmacol Exp Ther 157:245.
Miyamota, Y., Sancar, A. (1998) Vitamin B2 based blue photoreceptors in the
retinohypothalamic tract as the photoactive pigments for setting the circadian clock in mammals. Proc Natl Acad Sci U S A 95:6097.
Mizuno, N., Suzuki, M., Kusuhara, H., Suzuki, H., Takeuchi, K., Niwa, T., Jonker, J.W.,
Sugiyama, Y. (2004) Impaired renal excretion of 6-hydroxy-5,7-dimethyl-2-methylamino-4-(3-pyridylmethyl) benzothiazole (E3040) sulfate in breast cancer resistance protein (BCRP1/ABCG2) knockout mice. Drug Metab Dispos 32:898.
Mizuno, N., Takahashi, T., Kusuhara, H., Schuetz, J.D., Niwa, T., Sugiyama, Y. (2007)
Evaluation of the role of breast cancer resistance protein (BCRP/ABCG2) and multidrug resistance-associated protein 4 (MRP4/ABCC4) in the urinary excretion of sulfate and glucuronide metabolites of edaravone (MCI-186; 3-methyl-1- phenyl-2-pyrazolin-5-one). Drug Metab Dispos 35:2045.
Moore, T.R. (2007) Glyburide for the Treatment of Gestational Diabetes. Diabetes Care
30:S209. Moriyama, Y. (2011) Riboflavin transporter is finally identified. J Biochem 50:341-343. Mortensen, E.L., Michaelsen, K.F., Sanders, S.A., Reinisch, J.M. (2002) The association
between duration of breastfeeding and adult intelligence. JAMA 8:2365. Myllynen, P., Kummu, M., Kangas, T., Ilves, M., Immonen, E., Rysa, J., Pirila, R.,
Lastumaki, A., Vahakangas, K.H. (2008) ABCG2/BCRP decreases the transfer of a food-born chemical carcinogen, 2-amino-1-methyl-6-phenylimidazo[4,5-b]pyridine (PhIP) in perfused term human placenta. Toxicol Appl Pharmacol 232:210.
Nardiello, D., Bufo S.A., Cataldi, T.R.I. (2003) Riboflavin in dietary sources: separation
and detection by CE–LIF. LC-GC Europe 1:1. Neville, M.C. (2000) Anatomy and physiology of lactation. Pediatr Clin North Am 48:13. Oo, C.Y., Kuhn, R.J., Desai, N., McNamara, PJ. (1995) Active transport of cimetidine into
human milk. Clin Pharmacol Ther 58:548.
95
Oostendorp, R.L., Buckle, T., Beijnen, J.H., van Tellingen, O., Schellens, J.H. (2009) The effect of P-gp (Mdr1a/1b), BCRP (Bcrp1) and P-gp/BCRP inhibitors on the in vivo absorption, distribution, metabolism and excretion of imatinib. Invest New Drugs 27:31.
Owen, M.J., Baldwin, C.D., Swank, P.R., Pannu, A.K., Johnson, D.L., Howie, V.M. (1993)
Relation of infant feeding practices, cigarette smoke exposure, and group child care to the onset and duration of otitis media with effusion in the first two years of life. J Pediatr 123:702.
Ozvegy, C., Litman, T., Szakacs, G., Nagy, Z., Bates, S., Varadi, A., Sarkadi, B. (2001)
Functional characterization of the human multidrug transporter, ABCG2, expressed in insect cells. Biochem Biophys Res Commun 285:111.
Page, D. L., Anderson, T. J. Diagnostic Histopathology of the Breast, Churchill
Livingstone, Edinburgh (1987). Picciano, M.F. (2001) Nutrient composition of human milk. Pediatr Clin North Am 48:53. Pinto, J.T., Huang, J.P., Rivlin, R.S. (1987) Mechanisms underlying the differenctial
effects of ethanol upon the bioavailability of riboflavin and flavin adenine dinucleotide. J Clin Invest 79:1343.
Polgar, O., Robey, R.W., Bates, S.E. (2008) ABCG2: structure, function and role in drug
response. Expert Opin Drug Metab Toxicol 4:1. Powers, H.J. (1987) A study of maternofoetal iron transfer in the riboflavin deficient rat. J
Nutr 117:852. Powers, H.J., Bates, C.J., Prentice, A.M., Lamb, W.H., Jepson, M., Bowman, H. (1983)
The relative effectiveness of iron and iron with riboflavin in correcting a microcytic anaemia in men and children in rural Gambia. Hum Nutr Clin Nutr 37C:413.
Powers, H.J., Weaver, L.T., Austin, S., Wright, A.J.A., Fairweather-Tait, S.J. (1991)
Riboflavin deficiency in the rat: effects on iron utilization and loss. Br J Nutr 65:487. Quarrie, L.H., Addey, C.V.P., Wilde, C.J. (1996) Programmed cell death during mammary
tissue involution induced by weaning, litter removal, and milk stasis. J Cell Physiol 168:559.
Rasmussen, F. (1958) Mammary excretion of sulphonamides. Acta Pharmacol Toxicol
15:139. Richert, M.M., Schwertfeger, K.L., Ryder, J.W., Anderson, S.M. (2000) An atlas of mouse
mammary gland development. J Mammary Gland Biol Neoplasia 5:227.
Rillema, J. (1994) Development of the mammary gland and lactation. TEM 5:149.
Rivlin, R.S. (1970) Riboflavin metabolism. N Engl J Med 283:463.

96
Rivlin, R.S. (1973) Riboflavin and cancer: a review. Cancer Res 3:1977. Rivlin, R.S. (1986) Riboflavin. Adv Exp Med Biol 206:249. Rivlin, R.S., Pinto, J.T. Riboflavin (Vitamin B2), in Handbook of Vitamins, 3rd ed. (R.B.
Rucker, J.W. Suttie, D.B. McCormick, L.J. Machlin, eds.), Marcel Dekker, New York (2001).
Robey, R.W., Polgar, O., Deeken, J., To, K.W., Bates, S.E. (2007) ABCG2: determining
its relevance in clinical drug resistance. Cancer Metastasis Rev 26:39. Robey, R.W., To, K.K., Polgar, O., Dohse, M., Fetsch, P., Dean, M., Bates, S.E. (2009)
ABCG2: a perspective. Adv Drug Deliv Rev 61:3. Ross, D.D., Karp, J.E., Chen, T.T., Doyle, L.A. (2000) Expression of breast cancer
resistance protein in blast cells from patients with acute leukemia. Blood 96:365. Said, H.M. (2004) Recent advances in carrier-mediated intestinal absorption of water-
soluble vitamins. Annu Rev Physiol 66:419. Said, H.M., Arianas, P. (1991) Transport of riboflavin in human intestinal brush border
membrane vesicles. Gastroenterology 100:82. Said, H.M., Ma, T.Y. (1994) Mechanism of riboflavine uptake by Caco-2 human intestinal
epithelial cells. Am J Physiol Gastrointest Liver Physiol 266:G15. Said, H.M., Mohammadkhani, R. (1993) Uptake of riboflavin across the brush border
membrane of rat intestine: regulation by dietary vitamin levels. Gastroenterology105:1294.
Said, H.M., Ortiz, A., Ma, T.Y., McCloud, E. (1998) Riboflavin uptake by the
humanderived liver cells Hep G2: mechanism and regulation. J Cell Physiol 176:588. Said, H.M., Wang, S., Ma, T.Y. (2005) Mechanism of riboflavin uptake by cultured human
retinal pigment epithelial ARPE-19 cells: possible regulation by an intracellular Ca2+-calmodulin-mediated pathway. J Physiol 566:369.
Samuelsson, U., Johansson, C., Ludvigsson, J. (1993) Breast-feeding seems to play a
marginal role in the prevention of insulin-dependent diabetes mellitus. Diabetes Res Clin Pract 19:203.
Schimmel, M.S., Eidelman, A.I., Wilschanski, M.A., Shaw Jr., D., Ogilvie, R.J., Koren, G.
(1989) Toxic effects of atenolol consumed during breast feeding. J Pediatr 114:476. Schoenen, J., Jacquy, J., Lenaerts, M. (1998) Effectiveness of high-dose riboflavin in
migraine prophylaxis. A randomized controlled trial. Neurology 50:466. Sesink, A.L., Arts, I.C.,de Boer, V.C., Breedveld, P., Schellens, J.H., Hollman, P.C.,
Russel, F.G. (2005) Breast cancer resistance protein (Bcrp1/Abcg2) limits net intestinal

97
uptake of quercetin in rats by facilitating apical efflux of glucuronides Mol Pharmacol 67:1999.
Siassi, F., Ghadirian, P. (2005) Riboflavin deficiency and esophageal cancer: a case
control-household study in the Caspian Littoral of Iran. Cancer Detect Prev 29:464. Singer, T.P., Kenney, W.C. (1974) Biochemistry of covalently-bound flavins. Vitam Horm
32:1. Sirivech, S. (1977) NADH: FMN oxidoreductase activity and iron content of organs from
riboflavin and iron deficient rats. J Nutr 107:739. Sirivech, S., Driskell, J., Frieden, E. (1974) The release of iron from horse spleen ferritin
by reduced flavins. Biochem J 143:311. Sisson, T.R. (1987) Photodegradation of riboflavin in neonates. Fed Proc 46:1883. Smith-Kirwin, S,M., O'Connor, D.M., De Johnston, J., Lancey, E.D., Hassink, S.G.,
Funanage, V.L. (1998) Leptin expression in human mammary epithelial cells and breast milk. J Clin Endocrinol Metab 83:1810.
Somogyi, A., Gugler, R. (1979) Cimetidine excretion into break milk. Br J Clin Pharmac
7:627. Staud, F., Vackova, Z., Pospechova, K., Pavek, P., Ceckova, M., Libra, A., Cygalova, L.,
Nachtigal, P., Fendrich, Z. (2006) Expression and transport activity of breast cancer resistance protein (Bcrp/Abcg2) in dually perfused rat placenta and HRP-1 cell line. J Pharmacol Exp Ther 319:53.
Sternlicht, M.D. (2006) Key stages in mammary gland development: the cues that
regulate ductal branching morphogenesis. Breast Cancer Res 8:201. Strange, R., Li, F., Saurer, S., Burkhardt, A., Friis, R.R. (1992) Apoptotic cell death and
tissue remodelling during mouse mammary gland involution. Development 115:49. Stuebe, A.M., Willett, W.C., Xue, F., Michels, K.B. (2009) Lactation and incidence of
premenopausal breast cancer. Arch Intern Med 169:1364. Subramanian, V.S., Rapp, L., Marchant, J.S., Said, H.M. (2011) Role of cysteine residues
in cell surface expression of the human riboflavin transporter-2 (hRFT2) in intestinal epithelial cells. Am J Physiol Gastrointest Liver Physiol 301:G100.
Subramanian, V.S., Subramanya, S.B., Rapp, L., Marchant, J.S., Ma, T.Y., Said, H.M.
(2011) Differential expression of human riboflavin transporters -1, -2, and -3 in polarized epithelia: a key role for hRFT-2 in intestinal riboflavin uptake. Biochim Biophys Acta 1808:3016.
Swaan, P.W. Vitamin B2 – Riboflavin, in Vitamins in the Prevention of Human Diseases
(W. Herrmann, R. Obeid, eds.) Walter de Gruyter, New York (2011).
98
Szatmari, I., Vamosi, G., Brazda, P., Balint, B.L., Benko, S., Szeles, L.., Jeney, V., Ozvegy-Laczka, C., Szanto, A., Barta, E., et al. (2006) Peroxisome proliferator-activated receptor gamma-regulated ABCG2 expression confers cytoprotection to human dendritic cells. J Biol Chem 281:23812.
Thomas, M.R., Sneed, S.M., Wei, C., Nail, P.A., Wilson, M., Sprinkle, E.E., (1980). The
effects of vitamin C, vitamin B6, vitamin B12, folic acid, riboflavin, and thiamin on the breast milk and maternal status of well-nourished women at 6 months postpartum. Am J Clin Nutr 33:2151.
van der Valk, P., van Kalken, C.K., Ketelaars, H., Broxterman, H.J., Scheffer, G., Kuiper,
C.M., Tsuruo, T., Lankelma, J., Meijer, C.J., Pinedo, H.M., et al. (1990) Distribution of multi-drug resistance-associated P-glycoprotein in normal and neoplastic human tissues. Analysis with 3 monoclonal antibodies recognizing different epitopes of the P-glycoprotein molecule. Ann Oncol 1:56.
van Herwaarden, A.E., Wagenaar, E., Karnekamp, B., Merino, G., Jonker, J.W., Schinkel,
A.H. (2006) Breast cancer resistance protein (Bcrp1/Abcg2) reduces systemic exposure of the dietary carcinogens aflatoxin B1, IQ and Trp-P-1 but also mediates their secretion into breast milk. Carcinogenesis 27:123.
van Herwaarden, A.E., Wagenaar, E., Merino, G., Jonker, J.W., Rosing, H., Beijnen, J.H.,
Schinkel, A.H. (2007) Multidrug transporter ABCG2/breast cancer resistance protein secretes riboflavin (vitamin b2) into milk. Mol Cell Biol 27:1247.
Van Rensberg, S.J. (1981) Epidemiological and dietary evidence for a specific nutritional
predisposition to oesophageal cancer. J Natl Cancer Inst 67:243. Vander Borght, S., Libbrecht, L., Katoonizadeh, A., van Pelt, J., Cassiman, D., Nevens, F.,
Van Lommel, A., Petersen, B.E., Fevery, J., Jansen, P.L. (2006) Roskams, T.A. Breast cancer resistance protein (BCRP/ABCG2) is expressed by progenitor cells/reactive ductules and hepatocytes and its expression pattern is influenced by disease etiology and species type: possible functional consequences. J Histochem Cytochem 54:1051.
Venkataswamy, G. (1967) Ocular manifestations of vitamin B complex deficiency. Br J
Ophthalmol 51:749. Vitreschak, A.G., Rodionov, D.A., Mironov, A.A., Gelfand, M.S. (2002) Regulation of
riboflavin biosynthesis and transport genes in bacteria by transcriptional and translational attenuation. Nucleic Acids Res 30:3141.
Vlaming, M.L., Lagas, J.S., Schinkel, A.H. (2009) Physiological and pharmacological roles
of ABCG2 (BCRP): recent findings in Abcg2 knockout mice. Adv Drug Deliv Rev 61:14. Wang, L., Zhou, F., Li, X., Sun, L., et al. (2010) Genome-wide association study of
esophageal squamous cell carcinoma in Chinese subjects identifies susceptibility loci at PLCE1 and C20orf54. Nat Genet 42:759.
99
Warkany, J., Nelson, R.C. (1942) Congenital malformations induced by rats by maternal nutritional deficiency. J Nutr 23:83.
Watson, C.J., Khaled, W.T. (2008) Mammary development in the embryo and adult: a
journey of morphogenesis and commitment. Development 135:995. Webster, P.P., Gawde, M.D., Bhattacharya, R.K. (1996) Modulation of carcinogen-
induced damage and repair enzyme activity by riboflavin. Cancer Lett 98:129. White, H.B. III, Merrill, A.H. Jr. (1988) Riboflavin-binding proteins. Annu Rev Nutr 8:279. Williams, E.A., Powers, H.J., Rumsey, R.D.E. (1995) Morphological changes in the rat
small intestine in response to riboflavin depletion. Br J Nutr 73:141. Wintrobe, M.M., Buschke, W., Follis, R.H., Humphreys, S. (1994) Riboflavin deficiency in
swine with special reference to the occurrence of cataracts. Bull Johns Hopkins Hosp 75:102.
Wright, A.L., Holberg, C.J., Martinez, F.D., Morgan, W.J., Taussig, L.M. (1989) Breast
feeding and lower respiratory tract illness in the first year of life. BMJ 299:946. Yamamoto, S., Inoue, K., Ohta, K.Y., Fukatsu, R., Maeda, J.Y., Yoshida, Y., Yuasa, H.
(2009) Identification and functional characterization of rat riboflavin transporter 2. J Biochem 145:437.
Yonezawa, A., Masuda, S., Katsura, T., Inui, K. (2008) Identification and functional
characterization of a novel human and rat riboflavin transporter, RFT1. Am J Physiol Cell Physiol 295:C632.
Zaher, H., Khan, A.A., Palandra, J., Brayman, T.G., Yu, L., Ware, J.A. (2006) Breast cancer resistance protein (Bcrp/abcg2) is a major determinant of sulfasalazine absorption and elimination in the mouse. Mol Pharm 3:55.
Zempleni, J. (1995) Determination of riboflavin and flavocoenzymes in human blood
plasma by high-performance liquid chromatography. Ann Nutr Metab 39:224. Zempleni, J., Galloway, J.R., McCormick, D.B.(1996) Pharmacokinetics of orally and
intravenously administered riboflavin in healthy humans. Am J Clin Nutr 63:54. Zhang, Y., Wang, H., Unadkat, J.D., Mao, Q. (2007) Breast cancer resistance protein 1
limits fetal distribution of nitrofurantoin in the pregnant mouse. Drug Metab Dispos 35:2154.
Zhou, L., Naraharisetti, S.B., Wang, H., Unadkat, J.D., Hebert, M.F., Mao, Q. (2008) The
breast cancer resistance protein (Bcrp1/Abcg2) limits fetal distribution of glyburide in the pregnant mouse: an Obstetric-Fetal Pharmacology Research Unit Network and University of Washington Specialized Center of Research Study. Mol Pharmacol 73:949.

100
APPENDICES
Appendix I. Levels of intestinal mRft1 and mRft2 mRNA Expression during Pregnancy and
Lactation in FVB/N Mice. Proximal third of small intestine was excised from five groups of FBV/N mice
on standard chow: 1) virgin (9-10 weeks old), 2) mid-gestational (15th day post coitus), 3) lactation 1 wk
(on the 7th day post delivery), 4) lactation 2 wk (on the 14
th day post delivery), and 5) involution (a week
after litter-weaning). Total RNA was extracted, and then reverse transcribed. The expression of mRft1
and mRft2 mRNA was analyzed using Real-Time Quantitative PCR. Results were first normalized to villin,
and then to virgin state. The 2-∆∆C
T method was used to determine relative changes in gene expression.
Each group value represents a mean ± standard deviation. Statistical tests were conducted using SPSS
17.0. Normality tests were first carried out to guide subsequent statistical analyses. Multiple group
comparisons were carried out by one-way ANOVA. Dunnett’s post-hoc comparison test was performed to
analyze the differences between the virgin and the other four groups. *denotes a statistically significant
result as compared to virgin group.

101
Appendix II. Raw qPCR data of mammary fat cDNA samples extracted by LCM
Sample mRFT1 mRFT2 m-Csn2 m-
Gapdh
Fat
Virign 1 Undet. Undet. Undet. 33.783
Virign 2 Undet. Undet. 33.542 34.457
Virign 3 Undet. Undet. 35.248 31.137
Lactating 1 (1 wk) 38.294 Undet. 19.404 32.780
Lactating 2 (1 wk) 38.550 Undet. 21.696 31.339
Lactating 3 (1 wk) Undet. Undet. 21.535 34.484

102
Appendix III. Milk and Plasma Levels of FAD and FMN in FVB/N Mice. One-week lactating FVB/N
mice were intravenously administered riboflavin at doses of 1 μg/g, 2 μg/g or 5 μg/g body weight, or
phosphate buffered saline (control). To enhance milk secretion, 250 μL of a 1 IU/ml oxytocin solution was
injected subcutaneously 10 min prior to milk sampling. At 90 min, milk was collected from the inguinal
mammary glands, followed by blood collection via cardiac puncture 1 to 2 minutes later. Whole blood was
centrifuged at 2000 x g for 10 min at room temperature. Plasma was transferred into new tubes. Milk and
plasma samples were protected from light. Riboflavin levels were analyzed by high-performance liquid
chromatography. Each group value represents a mean ± standard error. Multiple group comparisons
were carried out by one-way ANOVA. Dunnett’s post-hoc comparison test did not reveal significant
differences (p < 0.05) between the control and the other three treatment groups.
A. Milk
B. Plasma