revista colombiana de anestesiología - scielo.org.co · demedicina veterinaria y zootecnia,...
TRANSCRIPT

r e v c o l o m b a n e s t e s i o l . 2 0 1 7;4 5(4):280–290
Revista Colombiana de AnestesiologíaColombian Journal of Anesthesiology
w w w.revcolanest .com.co
Scientific and Technological Research
Hypertonic saline solution for modifying tissueischemia/reperfusion injury: Porcine aorticocclusion model�
Bibiana Escobara,∗, Oscar Alexander Guevara-Cruzb, José Ricardo Navarro-Vargasc,Andrés Felipe Giraldo-Fajardoc, Jorge Alberto Dumar-Rodriguezc,Crystian Borrero-Cortésd
a Unidad de Anestesiología, Departamento de Cirugía, Facultad de Medicina, Universidad Nacional de Colombia, Bogotá, D.C., Colombiab Instituto de Investigaciones Clínicas, Facultad de Medicina, Universidad Nacional de Colombia, Bogotá, D.C., Colombiac Facultad de Medicina Veterinaria y Zootecnia, Universidad Nacional de Colombia, Bogotá, D.C., Colombiad Estudiante postgrado Especialización en Anestesiología y Reanimación, Universidad Nacional de Colombia, Bogotá, D.C., Colombia
a r t i c l e i n f o
Article history:
Received 11 July 2016
Accepted 30 June 2017
Available online 13 September 2017
Keywords:
Saline solution, hypertonic
Myocardial contraction
Ischemia
Stroke volume
Perfusion
a b s t r a c t
Introduction: Decreased blood flow disrupts the endothelium, changes the nitric
oxide/endothelin-1 ratio, narrows the capillaries and results in microcirculatory dys-
function. Secondary anoxia leads to mitochondrial energy imbalance, depletion of
adenosine-triphosphate and disruption of the intracellular hydrogen, sodium and calcium
homeostasis. If the flow is restored, the reperfusion stimulates the endothelial expression
of adhesion molecules attracting polymorphic nucleotides and platelets, with subendothe-
lial infiltration of these cells and their entrapment in the microvasculature, as well as
vasoconstriction, endothelial edema and reduced flexibility of the cellular membrane.
Ischemia/reperfusion may result in inflammation and organ failure.
Objective: To determine whether hypertonic saline solution reduces the ischemic/
reperfusion injury in the liver, the kidney, and the ileum.
Materials and methods: Experimental trial in pigs. Aortic blood flow suppression (15 min) and
reperfusion (60 min). The experimental group was pretreated with 7.5% hypertonic saline
and the control group received normal 0.9% saline solution. Hemodynamic, gasometric, and
biochemical measurements were taken, and the serum and tissue levels of ET-1, TNF-alpha,
etermined.
IL-10, and IL-2 were dResults: There were no significant differences in the tissue expression of ET-1, TNF-alpha,
IL-10, and IL-2 between the two groups. The hemodynamic behavior was similar in both
� Please cite this article as: Escobar B, Guevara-Cruz OA, Navarro-Vargas JR, Giraldo-Fajardo AF, Dumar-Rodriguez JA, Borrero-Cortés C.Solución salina hipertónica para modificar la lesión tisular por isquemia/reperfusión: modelo porcino de oclusión de aorta. Rev ColombAnestesiol. 2017;45:280–290.
∗ Corresponding author at: Unidad de Anestesiología, Departamento de Cirugía, Facultad de Medicina, Universidad Nacional de Colombia,Carrera 30 No. 45-03, Edificio 471, Oficina 107, Bogotá, Colombia.
E-mail address: [email protected] (B. Escobar).2256-2087/© 2017 Sociedad Colombiana de Anestesiologıa y Reanimacion. Published by Elsevier Espana, S.L.U. This is an open accessarticle under the CC BY-NC-ND license (http://creativecommons.org/licenses/by-nc-nd/4.0/).

r e v c o l o m b a n e s t e s i o l . 2 0 1 7;4 5(4):280–290 281
groups. The group treated with hypertonic solution showed an increasing post-perfusion
systolic rate up to the basal values, while the systolic rate in the control group dropped
significantly (p = 0.015).
Conclusion: Hypertonic solution prior to the ischemic insult improves the ventricular func-
tion after reperfusion.
© 2017 Sociedad Colombiana de Anestesiologıa y Reanimacion. Published by Elsevier
Espana, S.L.U. This is an open access article under the CC BY-NC-ND license (http://
creativecommons.org/licenses/by-nc-nd/4.0/).
Solución salina hipertónica para modificar la lesión tisular porisquemia/reperfusión: modelo porcino de oclusión de aorta
Palabras clave:
Solución salina hipertónica
Contracción miocárdica
Isquemia
Volúmen sistólico
Perfusión
r e s u m e n
Introducción: La disminución del flujo sanguíneo altera el endotelio, cambia la relación
oxido nítrico/endotelina-1, estrecha capilares y produce disfunción microcirculatoria. La
anoxia secundaria lleva a desacople energético mitocondrial, depleción de adenosin-tri-
fosfato y alteración de la homeostasis intracelular de hidrógeno, sodio y calcio. Si el flujo
se reanuda, la reperfusión estimula la expresión endotelial de moléculas de adhesión que
atraen polimorfonucleares y plaquetas, con infiltración subendotelial de estas células y su
atrapamiento en la microvasculatura, así como vasoconstricción, edema endotelial y dis-
minución de la flexibilidad de la membrana celular. La isquemia/reperfusión puede derivar
en inflamación y fallo orgánico.
Objetivo: Determinar si la solución salina hipertónica disminuye la lesión
isquemia/reperfusión en hígado, rinón e íleon.
Materiales y métodos: Estudio experimental en cerdos. Supresión del flujo sanguíneo aórtico
(15 minutos) y reperfusión (60 minutos). El grupo experimental recibió pre-tratamiento con
solución salina hipertónica al 7,5% y el grupo control solución salina normal al 0,9%. Se
realizaron mediciones hemodinámicas, gasométricas, bioquímicas, y determinación sérica
y tisular de ET-1, TNF-alfa, IL-10, IL-2.
Resultados: No hubo diferencias significativas en la expresión tisular de ET-1, TNF-alfa, IL-10,
IL-2 entre los grupos. Los grupos presentaron un comportamiento hemodinámico similar.
El grupo tratado con hipertónica exhibió un índice sistólico post-reperfusión que aumentó
hasta los valores basales, mientras que el índice sistólico del grupo control presentó una
caída significativa (p = 0.015).
Conslusión: La solución hipertónica antes del insulto isquémico mejora la función ventricular
después de la reperfusión.
© 2017 Sociedad Colombiana de Anestesiologıa y Reanimacion. Publicado por Elsevier
Espana, S.L.U. Este es un artıculo Open Access bajo la licencia CC BY-NC-ND (http://
creativecommons.org/licenses/by-nc-nd/4.0/).
I
Varpsioncimt
ntroduction
arious models have been proposed to explain the mech-nisms of tissue damage secondary to ischemia andeperfusion.1–7 With regards to ischemia, the variations inulsatile flow on the arterial wall shear stress have beenhown to disrupt the cellular microenvironment, generat-ng an imbalance concentration of endothelin-1 (ET-1)/nitricxide (NO)/prostacyclin, decelerating the blood flow down toon-reflux limits, and favoring the participation of erythro-
ytes to finally suppress the inflow of oxygen and glucosento the cell.1,8 The response of the cell to anoxia9,10 involvesitochondrial energy mismatch, depletion of adenosine-riphosphate (ATP) and disruption of the homeostasis of the
hydrogen (H+), sodium (Na+), and calcium (Ca2+) ions. Theseevents activate proteolytic enzymes and damage the cellvolume regulatory capacity (cell edema), specifically affectingthe endothelial cells and the macrophages. This phenomenon,together with a change in the NO/ET-1 production ratio, con-tributes to further narrowing of the lumen of the capillariesand to microcirculatory dysfunction. The narrowing of thecapillaries results in the accumulation of neutrophils (PMNs)and the simultaneous activation of macrophages, stimulat-ing the release of reactive oxygen species (ROS). These ROSare also released through the mitochondrial pathway or the
xanthine/xanthine oxidase (X/XO) pathway of the endothe-lial cells, as well as by the action of inflammatory cytokines,including tumor necrosis factor alpha (TNF-alpha) and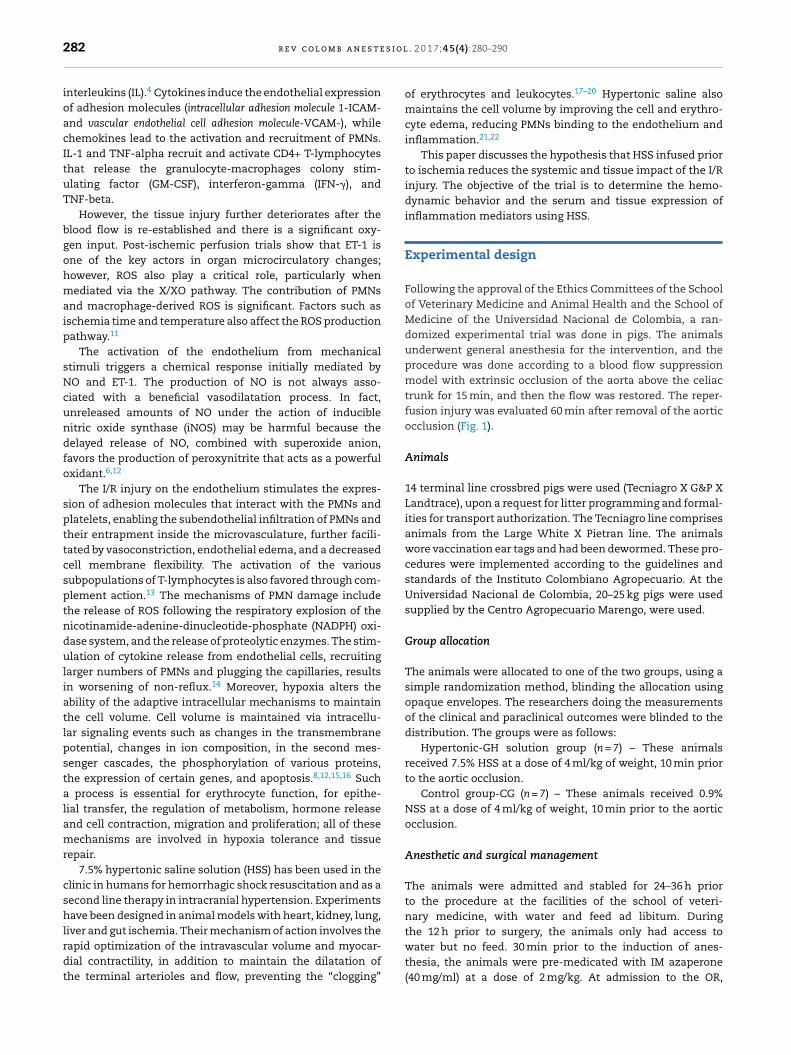
s i o l
282 r e v c o l o m b a n e s t einterleukins (IL).4 Cytokines induce the endothelial expressionof adhesion molecules (intracellular adhesion molecule 1-ICAM-and vascular endothelial cell adhesion molecule-VCAM-), whilechemokines lead to the activation and recruitment of PMNs.IL-1 and TNF-alpha recruit and activate CD4+ T-lymphocytesthat release the granulocyte-macrophages colony stim-ulating factor (GM-CSF), interferon-gamma (IFN-�), andTNF-beta.
However, the tissue injury further deteriorates after theblood flow is re-established and there is a significant oxy-gen input. Post-ischemic perfusion trials show that ET-1 isone of the key actors in organ microcirculatory changes;however, ROS also play a critical role, particularly whenmediated via the X/XO pathway. The contribution of PMNsand macrophage-derived ROS is significant. Factors such asischemia time and temperature also affect the ROS productionpathway.11
The activation of the endothelium from mechanicalstimuli triggers a chemical response initially mediated byNO and ET-1. The production of NO is not always asso-ciated with a beneficial vasodilatation process. In fact,unreleased amounts of NO under the action of induciblenitric oxide synthase (iNOS) may be harmful because thedelayed release of NO, combined with superoxide anion,favors the production of peroxynitrite that acts as a powerfuloxidant.6,12
The I/R injury on the endothelium stimulates the expres-sion of adhesion molecules that interact with the PMNs andplatelets, enabling the subendothelial infiltration of PMNs andtheir entrapment inside the microvasculature, further facili-tated by vasoconstriction, endothelial edema, and a decreasedcell membrane flexibility. The activation of the varioussubpopulations of T-lymphocytes is also favored through com-plement action.13 The mechanisms of PMN damage includethe release of ROS following the respiratory explosion of thenicotinamide-adenine-dinucleotide-phosphate (NADPH) oxi-dase system, and the release of proteolytic enzymes. The stim-ulation of cytokine release from endothelial cells, recruitinglarger numbers of PMNs and plugging the capillaries, resultsin worsening of non-reflux.14 Moreover, hypoxia alters theability of the adaptive intracellular mechanisms to maintainthe cell volume. Cell volume is maintained via intracellu-lar signaling events such as changes in the transmembranepotential, changes in ion composition, in the second mes-senger cascades, the phosphorylation of various proteins,the expression of certain genes, and apoptosis.8,12,15,16 Sucha process is essential for erythrocyte function, for epithe-lial transfer, the regulation of metabolism, hormone releaseand cell contraction, migration and proliferation; all of thesemechanisms are involved in hypoxia tolerance and tissuerepair.
7.5% hypertonic saline solution (HSS) has been used in theclinic in humans for hemorrhagic shock resuscitation and as asecond line therapy in intracranial hypertension. Experimentshave been designed in animal models with heart, kidney, lung,liver and gut ischemia. Their mechanism of action involves the
rapid optimization of the intravascular volume and myocar-dial contractility, in addition to maintain the dilatation ofthe terminal arterioles and flow, preventing the “clogging”. 2 0 1 7;4 5(4):280–290
of erythrocytes and leukocytes.17–20 Hypertonic saline alsomaintains the cell volume by improving the cell and erythro-cyte edema, reducing PMNs binding to the endothelium andinflammation.21,22
This paper discusses the hypothesis that HSS infused priorto ischemia reduces the systemic and tissue impact of the I/Rinjury. The objective of the trial is to determine the hemo-dynamic behavior and the serum and tissue expression ofinflammation mediators using HSS.
Experimental design
Following the approval of the Ethics Committees of the Schoolof Veterinary Medicine and Animal Health and the School ofMedicine of the Universidad Nacional de Colombia, a ran-domized experimental trial was done in pigs. The animalsunderwent general anesthesia for the intervention, and theprocedure was done according to a blood flow suppressionmodel with extrinsic occlusion of the aorta above the celiactrunk for 15 min, and then the flow was restored. The reper-fusion injury was evaluated 60 min after removal of the aorticocclusion (Fig. 1).
Animals
14 terminal line crossbred pigs were used (Tecniagro X G&P XLandtrace), upon a request for litter programming and formal-ities for transport authorization. The Tecniagro line comprisesanimals from the Large White X Pietran line. The animalswore vaccination ear tags and had been dewormed. These pro-cedures were implemented according to the guidelines andstandards of the Instituto Colombiano Agropecuario. At theUniversidad Nacional de Colombia, 20–25 kg pigs were usedsupplied by the Centro Agropecuario Marengo, were used.
Group allocation
The animals were allocated to one of the two groups, using asimple randomization method, blinding the allocation usingopaque envelopes. The researchers doing the measurementsof the clinical and paraclinical outcomes were blinded to thedistribution. The groups were as follows:
Hypertonic-GH solution group (n = 7) – These animalsreceived 7.5% HSS at a dose of 4 ml/kg of weight, 10 min priorto the aortic occlusion.
Control group-CG (n = 7) – These animals received 0.9%NSS at a dose of 4 ml/kg of weight, 10 min prior to the aorticocclusion.
Anesthetic and surgical management
The animals were admitted and stabled for 24–36 h priorto the procedure at the facilities of the school of veteri-nary medicine, with water and feed ad libitum. Duringthe 12 h prior to surgery, the animals only had access to
water but no feed. 30 min prior to the induction of anes-thesia, the animals were pre-medicated with IM azaperone(40 mg/ml) at a dose of 2 mg/kg. At admission to the OR,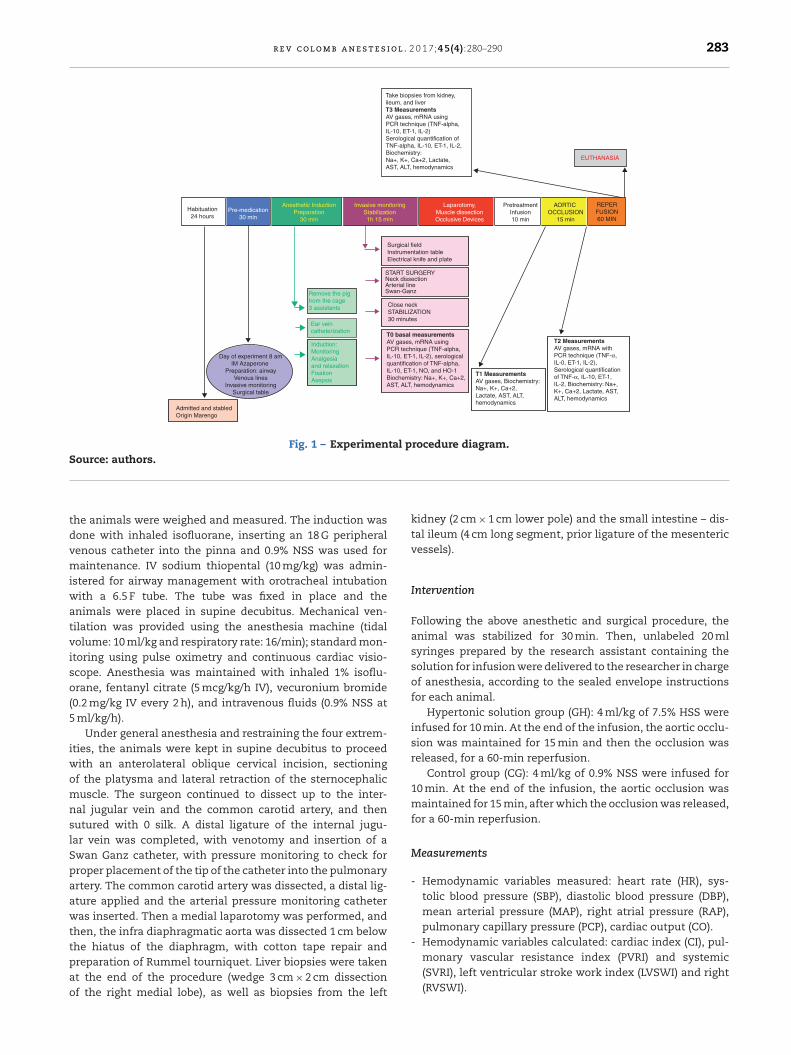
r e v c o l o m b a n e s t e s i o l . 2 0 1 7;4 5(4):280–290 283
Take biopsies from kidney,ileum, and liverT3 MeasurementsAV gases, mRNA usingPCR technique (TNF-alpha,IL-10, ET-1, IL-2)Serological quantification ofTNF-alpha, IL-10, ET-1, IL-2,Biochemistry:Na+, K+, Ca+2, Lactate,AST, ALT, hemodynamics
Habituation24 hours
Pre-medication30 min
Anesthetic InductionPreparation
30 min
Invasive monitoringStabilization1h 15 min
Laparotomy,Muscle dissectionOcclusive Devices
PretreatmentInfusion10 min
AORTIC OCCLUSION
15 min
REPERFUSION60 MIN
Surgical fieldInstrumentation tableElectrical knife and plate
START SURGERYNeck dissectionArterial lineSwan-Ganz
Close neckSTABILIZATION30 minutes
T0 basal measurementsAV gases, mRNA usingPCR technique (TNF-alpha,IL-10, ET-1, IL-2), serologicalquantification of TNF-alpha,IL-10, ET-1, NO, and HO-1Biochemistry: Na+, K+, Ca+2,AST, ALT, hemodynamics
T1 MeasurementsAV gases, Biochemistry:Na+, K+, Ca+2,Lactate, AST, ALT,hemodynamics
T2 MeasurementsAV gases, mRNA withPCR technique (TNF-α,IL-0, ET-1, IL-2),Serological quantificationof TNF- α, IL-10, ET-1,IL-2, Biochemistry: Na+,K+, Ca+2, Lactate, AST,ALT, hemodynamics
Remove the pigfrom the cage3 assistants
Ear veincatheterization
Induction: MonitoringAnalgesiaand relaxationFixationAsepsis
Day of experiment 8 amIM Azaperone
Preparation: airwayVenous lines
Invasive monitoringSurgical table
Admitted and stabledOrigin Marengo
EUTHANASIA
Fig. 1 – Experimental procedure diagram.Source: authors.
tdvmiwatviso(5
iwomnslSpaawttpao
- Hemodynamic variables calculated: cardiac index (CI), pul-
he animals were weighed and measured. The induction wasone with inhaled isofluorane, inserting an 18 G peripheralenous catheter into the pinna and 0.9% NSS was used foraintenance. IV sodium thiopental (10 mg/kg) was admin-
stered for airway management with orotracheal intubationith a 6.5 F tube. The tube was fixed in place and the
nimals were placed in supine decubitus. Mechanical ven-ilation was provided using the anesthesia machine (tidalolume: 10 ml/kg and respiratory rate: 16/min); standard mon-toring using pulse oximetry and continuous cardiac visio-cope. Anesthesia was maintained with inhaled 1% isoflu-rane, fentanyl citrate (5 mcg/kg/h IV), vecuronium bromide
0.2 mg/kg IV every 2 h), and intravenous fluids (0.9% NSS at ml/kg/h).
Under general anesthesia and restraining the four extrem-ties, the animals were kept in supine decubitus to proceed
ith an anterolateral oblique cervical incision, sectioningf the platysma and lateral retraction of the sternocephalicuscle. The surgeon continued to dissect up to the inter-
al jugular vein and the common carotid artery, and thenutured with 0 silk. A distal ligature of the internal jugu-ar vein was completed, with venotomy and insertion of awan Ganz catheter, with pressure monitoring to check forroper placement of the tip of the catheter into the pulmonaryrtery. The common carotid artery was dissected, a distal lig-ture applied and the arterial pressure monitoring catheteras inserted. Then a medial laparotomy was performed, and
hen, the infra diaphragmatic aorta was dissected 1 cm belowhe hiatus of the diaphragm, with cotton tape repair and
reparation of Rummel tourniquet. Liver biopsies were takent the end of the procedure (wedge 3 cm × 2 cm dissectionf the right medial lobe), as well as biopsies from the leftkidney (2 cm × 1 cm lower pole) and the small intestine – dis-tal ileum (4 cm long segment, prior ligature of the mesentericvessels).
Intervention
Following the above anesthetic and surgical procedure, theanimal was stabilized for 30 min. Then, unlabeled 20 mlsyringes prepared by the research assistant containing thesolution for infusion were delivered to the researcher in chargeof anesthesia, according to the sealed envelope instructionsfor each animal.
Hypertonic solution group (GH): 4 ml/kg of 7.5% HSS wereinfused for 10 min. At the end of the infusion, the aortic occlu-sion was maintained for 15 min and then the occlusion wasreleased, for a 60-min reperfusion.
Control group (CG): 4 ml/kg of 0.9% NSS were infused for10 min. At the end of the infusion, the aortic occlusion wasmaintained for 15 min, after which the occlusion was released,for a 60-min reperfusion.
Measurements
- Hemodynamic variables measured: heart rate (HR), sys-tolic blood pressure (SBP), diastolic blood pressure (DBP),mean arterial pressure (MAP), right atrial pressure (RAP),pulmonary capillary pressure (PCP), cardiac output (CO).
monary vascular resistance index (PVRI) and systemic(SVRI), left ventricular stroke work index (LVSWI) and right(RVSWI).

s i o l
284 r e v c o l o m b a n e s t e- Gasometric variables: O2 arterial blood pressure (PaO2), CO2
arterial blood pressure (PaCO2), Arterial pH (pH art), arterialO2 saturation (SaO2), base excess arterial (BE art), arte-rial lactate concentration (Lactate art), O2 venous pressure(PvO2), CO2 venous pressure (PvCO2), venous pH (pH ven),venous O2 saturation (SatvO2), base excess venous (BE ven),PaO2/FiO2, rate of O2 extraction (ExtO2).
- Hemoglobin, hematocrit.- Blood chemistry: Glycaemia, BUN, creatinine, transami-
nases (AST, ALT), sodium (Na+), potassium (K+), calcium(Ca2+).
- Molecular biology: Serum determination of TNF-alphaand IL-2 (inflammatory cytokines) levels, IL-10 (anti-inflammatory cytokines), ET-1 (markers of endothelialinjury) in serum or plasma using the Enzyme-Linked-Immuno-Sorbent-Assay ELISA technique.
- Detection of protein expression with immunohistochem-istry for TNF-alpha (inflammatory cytokines) and IL-10(anti-inflammatory cytokine) in liver, kidney, and ileumtissue.
- Histological determination (using hematoxylin/eosin -HE-in the gut, the liver and kidney) of ischemia/reperfusioninjury. The extent of congestion and hemorrhage, edemaand the presence of intercellular dehiscence, necrosis, andapoptosis were analyzed.
Data collection times
- -T0: Baseline: Following the induction of anesthesia andafter 30 min of animal stability, the hemodynamic variableswere recorded and blood samples were drawn for arterialand venous gases, blood chemistry, and molecular biology.
- -T1: At the end of the NSS or HSS infusion (10 min): priorto the aortic occlusion, the hemodynamic variables wererecorded and blood samples were drawn for arterial andvenous gases, blood chemistry and molecular biology.
- -T2: After 5 min of aortic occlusion: prior to removing theaortic occlusion devices, the hemodynamic variables wererecorded and blood samples were drawn for arterial andvenous gases, blood chemistry and molecular biology.
- -T3: 60 min post-reperfusion: The hemodynamic variableswere recorded and blood samples were drawn for arterialand venous gases, blood chemistry and molecular biology.Liver, kidney, and ileum biopsies were then taken.
Sampling protocol
Blood samples
- Arterial gases: from the single-lumen catheter inserted intothe carotid artery.
- Venous gases: from the proximal line of the pulmonaryartery catheter.
- Blood chemistry and molecular biology: plasma and serumsamples were taken through the proximal line of the pul-monary artery catheter.
All samples were properly labeled and packaged as per theexperimental protocol. The samples were sent to be processedat the Clinical laboratory of the School of Veterinary Medicine
. 2 0 1 7;4 5(4):280–290
and the Laboratory of Physiology of the School of Medicine,Universidad Nacional.
Tissue samplesTo avoid any bleeding that could hemodynamically com-
promise the animal during harvesting of tissue samples, thefollowing steps were followed:
- Ileum wedge biopsy from the antimesenteric margin: 30 cmaway from the ileocecal junction, the proximal and dis-tal intestine underwent painless clamping along a 10 cmsegment, avoiding clamping the mesentery. A knife wedgebiopsy was taken from the antimesenteric margin, witha 3 cm base and the apex at 5 mm from the mesentericmargin. The gut was then sutured in one plane using 4-0polypropylene.
- Free margin wedge biopsy of the liver: cold knife section,5 cm base and 1 cm apex. The hemostasis was done with a4-0 polypropylene suture.
- Wedge biopsy of the renal cortex: cold knife section, 5 cmbases and 1 cm apex, macroscopically checking for a com-plete inclusion of the cortex.
Every 0.3 cm3 tissue fragments of the organs biopsied(ileum, liver, and kidney) were placed in non-sterile bottleswith 10% formaldehyde to be forwarded to the Pathology lab-oratory of the School of Medicine.
Euthanasia
Upon completion of the protocol and with the animal undergeneral anesthesia, a bolus of 40 milliequivalents of undi-luted potassium chloride was administered via the distalpulmonary artery catheter. When the cardiac activity stopped,the anesthesia management was interrupted. Each animalwas placed in a double bag for animal waste from experimen-tal laboratories, and kept in the cold storage to be collectedafterwards by the staff in charge of hospital waste disposal.
Statistical analysis
The data from the continuous variables were expressed asmeans, standard deviation and ranges. The data from the cate-gorical variables were expressed as numbers and percentages.The quantitative variables were compared against Student-t and the qualitative variables against Chi square or Fisher’sTest. For non-normal distribution variables, Mann–Whitney’sU was used. A p ≤ 0.05 value was estimated. The statisticalanalysis was based on STATA 10.1 (STATA Corp LP).
Results
The measurements of the hemodynamic changes through-out the experiment did not show any significant differencesbetween the two groups (Table 1).
During the aortic occlusion (T2), significant increases werefound against the baseline values in each group, with regards
to heart rate (p = 0.0023 GH, p = 0.0004 CG), mean systemicblood pressure (p = 0.0005 GH, p = 0.003 CG), and systemic vas-cular resistance (p = 0.009 GH, p = 0.04 CG).
r e v c o l o m b a n e s t e s i o l . 2 0 1 7;4 5(4):280–290 285
Table 1 – Hemodynamic behavior throughout the experiment.
Hypertonic group (GH) Control group (CG) pn = 7 n = 7
Heart rate (HR) beatsper minute
T0 84 ± 8 92 ± 10 0.125T1 91 ± 10 84 ± 7 0.216T2 181 ± 51ϕϕϕ 153 ± 40ϕϕ 0.295T3 123 ± 19 131 ± 23 0.549
Systemic VascularResistance Index(SVRI) dyness cm5/m2
T0 979 ± 480 853 ± 130 0.516T1 906 ± 449 835 ± 334 0.740T2 1821 ± 479ϕϕ 1599 ± 862ϕ 0.588T3 1033 ± 923 624 ± 247ϕ 0.282
Left VentricularStroke Work Index(LVSWI) g m/m2
T0 35 ± 10 34 ± 0 0.918T1 30 ± 19 30 ± 7 0.985T2 52 ± 20 60 ± 37 0.640T3 18 ± 9ϕ 15 ± 6ϕϕ 0.595
Systolic Index (SI)ml/beat/m2
T0 55 ± 14 53 ± 9 0.767T1 51 ± 21 58 ± 19 0.533T2 35 ± 13ϕ 42 ± 15 0.421T3 43 ± 22 38 ± 9ϕ 0.600
Data reported as mean ± standard deviation, 95% confidence interval.� p < 0.05 with regard to basal values within each group.
�� p < 0.01 with regard to basal values within each group.��� p < 0.001 with regard to basal values within each group.
ssInDdtsHr
r
S
Source: authors.
Following reperfusion (T3), both groups showed decreasedystemic vascular resistance. The group treated with HSShowed a drop in the SVRI values approaching the baseline.n the case of the control group, the drop in SVRI reached sig-ificantly lower values as compared to the baseline (p = 0.049).uring reperfusion, the left ventricular stroke work volumeropped significantly (p = 0.019 GH, p = 0.002 CG) as comparedo the baseline values in both groups. During this time, theystolic index (SI) as a contractility variable, increased in theSS-treated group. In the control group (CG) the SI decreased,
eaching significantly lower levels (p = 0.015) versus the baseline.Blood gasometry analyses indicated arterial pH variations
esulting in significant differences following reperfusion
A Arterial pH values at each point intime per group
B Sper
Control Group hyperto
Times
Note: Comparative significance between group**p≤0.01
7.2
7.4
7.6
pH
T0 T1 T2 T3
*
0
2
4
6
Lact
ato'
(mm
ol/L
)
Fig. 2 – Behavior of pH (A) and lactatource: authors.
between the two groups (T3), and at that time the controlgroup presented acidosis with a significant drop in the arterialpH (Fig. 2A).
With regards to the other blood gasometry parameters,both groups behaved similarly.
In particular, the serum lactate levels decreased withthe intravenous fluid infusion (hypertonic solution – GH- ornormal saline solution – CG-) in T1 in both groups, leadingthen to a sustained increase with significantly higher valuesas compared to T1. (T2: p = 0.006 GH, p = 0.001 CG, T3: p = 0.002
GH, p = 0.003 CG) (Fig. 2B).In terms of the serum electrolyte behavior, the baselinevalues (T0) were similar in both groups (Fig. 3).
erum lactate value at each point in time group
nic group
Times
s
T0 T1 T2 T3
e (B) measured in blood gases.
286 r e v c o l o m b a n e s t e s i o l . 2 0 1 7;4 5(4):280–290
A Serum sodium levels at each point in time per group
Times Significant difference between groups*p<0.05, **p<0.01, ***p<0.001
B Serum potassium level at each point in time per group
Times
C Serum calcium level at each point in time per group
Control group Hypertonic group
T0
1.2
1.1
1.0
0.9
T1 T2 T3
Significant difference between groups*p<0.05, **p <0.01 , *** p<0.001
160
150
Na+
2 (m
eqs/
L)K
+ (
meq
s/L)
Ca+
2 (m
g/dL
)
140
130T0 T1 T2 T3
6.0
5.5
5.0
4.5
4.0
3.5
3.0
T1T0 T2 T3
Fig. 3 – Changes in serum electrolyte levels. (A) Sodium. (B)Potassium. (C) Calcium.Source: authors.
AS
T s
erum
val
ue IU
/L
Control group Hypertonic group
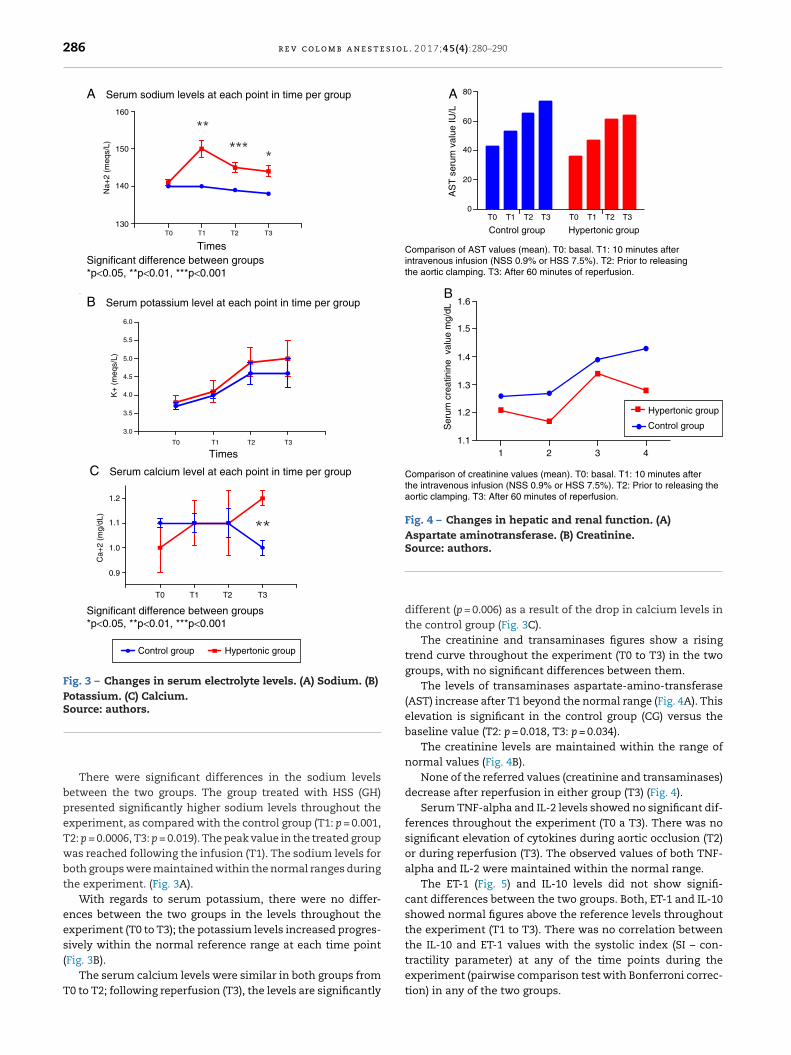
Comparison of AST values (mean). T0: basal. T1: 10 minutes afterintravenous infusion (NSS 0.9% or HSS 7.5%). T2: Prior to releasingthe aortic clamping. T3: After 60 minutes of reperfusion.
Ser
um c
reat
inin
e v
alue
mg/
dL
Hypertonic grou p
Control group
Comparison of creatinine values (mean). T0: basal. T1: 10 minutes afterthe intravenous infusion (NSS 0.9% or HSS 7.5%). T2: Prior to releasing theaortic cl ampi ng. T3: After 60 minutes of reperfusion.
80A
B
60
40
20
0T0
1
1.6
1.5
1.4
1.3
1.2
1.12 3 4
T1 T2 T3 T0 T1 T2 T3
Fig. 4 – Changes in hepatic and renal function. (A)Aspartate aminotransferase. (B) Creatinine.Source: authors.
tractility parameter) at any of the time points during the
There were significant differences in the sodium levelsbetween the two groups. The group treated with HSS (GH)presented significantly higher sodium levels throughout theexperiment, as compared with the control group (T1: p = 0.001,T2: p = 0.0006, T3: p = 0.019). The peak value in the treated groupwas reached following the infusion (T1). The sodium levels forboth groups were maintained within the normal ranges duringthe experiment. (Fig. 3A).
With regards to serum potassium, there were no differ-ences between the two groups in the levels throughout theexperiment (T0 to T3); the potassium levels increased progres-sively within the normal reference range at each time point(Fig. 3B).
The serum calcium levels were similar in both groups fromT0 to T2; following reperfusion (T3), the levels are significantly
different (p = 0.006) as a result of the drop in calcium levels inthe control group (Fig. 3C).
The creatinine and transaminases figures show a risingtrend curve throughout the experiment (T0 to T3) in the twogroups, with no significant differences between them.
The levels of transaminases aspartate-amino-transferase(AST) increase after T1 beyond the normal range (Fig. 4A). Thiselevation is significant in the control group (CG) versus thebaseline value (T2: p = 0.018, T3: p = 0.034).
The creatinine levels are maintained within the range ofnormal values (Fig. 4B).
None of the referred values (creatinine and transaminases)decrease after reperfusion in either group (T3) (Fig. 4).
Serum TNF-alpha and IL-2 levels showed no significant dif-ferences throughout the experiment (T0 a T3). There was nosignificant elevation of cytokines during aortic occlusion (T2)or during reperfusion (T3). The observed values of both TNF-alpha and IL-2 were maintained within the normal range.
The ET-1 (Fig. 5) and IL-10 levels did not show signifi-cant differences between the two groups. Both, ET-1 and IL-10showed normal figures above the reference levels throughoutthe experiment (T1 to T3). There was no correlation betweenthe IL-10 and ET-1 values with the systolic index (SI – con-
experiment (pairwise comparison test with Bonferroni correc-tion) in any of the two groups.

r e v c o l o m b a n e s t e s i o l . 2
Control group Hypertonic group
Times
Variation in serum endotheline-1 levels (ET-1)
0
0.5
1
1.5
2
2.5
3
3.5
T0 T1 T2 T3
pg/m
L
Fig. 5 – Change in serum concentration of ET-1.S
enpez(hgahm
agt(bas(
D
Tdalcala
ource: authors.
With regards to the histopathology changes, five param-ters were used for their interpretation (edema, infiltrates,ecrosis, apoptosis, and deposit substances), interpreted asresent (P = 1) or absent (A = 0), to determine a score forach organ (liver, kidney, intestine). A general characteri-ation was also evaluated as normal (N = 0) or abnormalA = 1). The results of the pathological examination withematoxylin/eosin showed no differences between the tworoups. There was no evidence of necrosis or apoptosis inny of the samples. The general characterization of theistopathology slides was normal (N = 0). Those with an abnor-al pattern presented edema with no other alterations (Fig. 6).The tissue immunohistochemistry analysis for TNF-alpha
nd IL-10, did not report any differences between the tworoups. In order to standardize the analysis and its interpre-ation, three parameters were scored: mild immune-reactivity1), moderate (2), or severe (3). There were no differencesetween the two groups when comparing the scores for TNF-lpha and IL-10. The tissue expression of TNF-alpha and IL-10,howed no significant differences between the two groupsFig. 6).
iscussion
he abnormal decrease in blood flow (hemorrhage, car-iac arrest, vascular obstruction, etc.) results in hypoxiand as a consequence in the development of intracellu-ar acidosis, alterations in sodium and calcium intracellularoncentration, degradation of sarcoplasmic phospholipids
nd of the cytoskeletal proteins, mitochondrial edema, andoss of the transmembrane potential, decreased glutathionend alpha-tocopherol, secretion of preconditioning trigger0 1 7;4 5(4):280–290 287
substances (adenosine, bradykinin, angiotensin, opioids, etc.)and expression of adhesion molecules, cytokines (i.e. TNF-alpha) and vasoactive agents (i.e. endothelin).23,24 Reperfusionresults in vasoreactivity changes (endothelium dependentand non-dependent) with a subsequent imbalance betweenvasodilatation and vasoconstriction in all beds, endothe-lial dysfunction, and disruption of the expression andreactivity of substances such as ET-1 and NO.23,25 Furthermore,reperfusion promotes an initially local inflammatory responseleading to the systemic release of cytokines, chemokines,complement and neutrophil activation, release of free oxy-gen radicals, necrosis and apoptosis.26,27 The severity of thelesion depends on the extension (one or more organs involve-ment) and the duration of hypoxia, as proven by Flores et al.28
several decades ago; they published a renal ischemia modelshowing that a blood flow occlusion beyond one hour wasassociated with areas of vascular obstruction due to cellularedema, despite reestablishing the blood flow. These authorsalso described how to reverse the “non-flow” using hypertonicsolutions (mannitol, in this particular paper) that decreasedthe cellular edema and relieved the obstruction of the micro-circulation.
Hypertonic saline solution (HSS) generates an osmotic gra-dient through the cell membranes that displaces fluid initiallyfrom the interstitial space, and then from the cells into theintravascular space.29 The movement of fluid from the cellscontributes to reduce the capillary endothelial edema whichimproves microcirculation, particularly in case of shock.30
In models of isolated cardiac muscle, positive inotropic andlusitropic effects of the HSS, mediated by hyperosmolar-ity and the action of sodium on the Na+–Ca2+ exchangerhave also been shown, maintaining the intracellular cal-cium homeostasis and its release from the sarcoplasmicreticulum.31 Moreover, the HSS modulates the reperfusion-associated inflammatory response, thanks to the attenuationof the PMNs activation, the decrease of the TNF-alpha serumlevels, and the increase in the anti-inflammatory cytokinesexpression (IL-1, IL-10).25,32 The use of low volumes of HNNfor resuscitation in hemorrhagic and septic shock, has charac-terized its role in attenuating the ischemia/reperfusion injury.Several papers have explored the mechanisms involved in theHSS effects, using HSS both prior to the ischemic insult andbefore reperfusion.33–35
In the experiment herein discussed, the HSS was infusedprior to ischemia, in order to evaluate its role in the expressionof cytokines, of vasoactive substances, and in the hemo-dynamic behavior following the recovery of the blood flow.This study showed that HSS does not change the inflamma-tory response resulting from 15 min of ischemia, followed by60 min of reperfusion. Neither does it affect the hemodynamicresponse to aortic occlusion and to reperfusion. However, thegroup treated with hypertonic solution evidenced the impactof HSS on myocardial performance due to the significantincrease of the systolic index one hour after reinitiating theaortic flow, to levels close to the baseline conditions. Theimpact of HSS on hemodynamic behavior was also associatedwith decreased vasodilatation, as shown by the changes in
systemic vascular resistance.The work by Li et al.6 and Gourdin et al.9 has shown thatthe occurrence of histological changes and inflammatory and

288 r e v c o l o m b a n e s t e s i o l . 2 0 1 7;4 5(4):280–290
Hematoxylin & Eosin (H&E), 4x
Liver Intestine Kidney
Con
trol
Hyp
erto
nic
Immunohistochemistry for TNFα, 20x
Con
trol
Hyp
erto
nic
Liver Intestine Kidney
Immunohistochemistry for IL0, 20x
Con
trol
Hyp
erto
nic
Liver Intestine Kidney
Negative controls of the IHQ technique, 20x
TN
Fα
IL10
Liver Intestine Kidney
Control Group PIG 12, 434Hypertonic Group PIG 11, 433
Pos
itive
Con
trol
TN
Fα,
20x
Pos
itive
Con
trol
IL-1
0, 2
0x
Fig. 6 – Histopathological characteristics and immunohistochemistry.
Conflicts of interest
Source: authors.
anti-inflammatory serum cytokines are subject to the dura-tion of ischemia and reperfusion. This experiment used shortischemia and reperfusion times (15 min and 1 h, respectively).The authors believe that this ischemia time was insufficientto give rise to any histological or serum changes in TNF-alphaand inflammatory interleukins; however, the finding of ele-vation in serum levels of ET-1 from time 1 (T1) in consistentwith the analysis by Sánchez-Etayo et al.36 Changes in ET-1may be observed from the first few minutes after the decreasein blood flow. In this experiment, ET-1 increased followingischemia in both groups. There are no differences between thetwo groups, probably because of the number of subjects. ET-1levels increased permanently in a significant manner from T0to T3 in the control group.
In an interesting clinical paper, Rizoli et al. showed the anti-inflammatory properties of HSS measuring other cytokinesbesides TNF-alpha.37 The trial includes blunt trauma patientswith varying times between the lesion and admission of44–255 min, with at least one recorded episode of hypotension.The authors did a follow-up for the next 24 h following resus-citation in the ER. Their findings show significant increases inanti-inflammatory cytokines with rising levels after the thirdhour of the infusion.
The limitations of this study on aortic occlusion and pre-
treatment with HSS are the short ischemia and reperfusiontimes. Consequently, it was only possible to evidence changesin contractility, with no impact whatsoever on the modulationof inflammation.
In conclusion, pre-treatment with HSS within 15 min priorto ischemia in the aortic flow suppression model does notchange the expression of serum or tissue inflammation andanti-inflammation markers. HSS increases ventricular con-tractility after reperfusion.
Funding
This review is part of the joint effort within the frameworkof the Inter-Institutional Cooperation Agreement betweenS.C.A.R.E. and the Universidad Nacional de Colombia. Bothinstitutions funded the research project entitled “Establishingthe value of using hypertonic saline solution to modify thetissue ischemia/reperfusion injury: aortic occlusion porcinemodel”.
The authors have no conflicts of interest to declare.

o l . 2
r
1
1
1
1
1
1
1
1
1
1
2
2
2
2
2
2
2
2
2
2
3
3
3
3
3
r e v c o l o m b a n e s t e s i
e f e r e n c e s
1. Adams JA. Endothelium and cardiopulmonary resuscitation.Crit Care Med. 2006;34:S458–65.
2. Festjens N, Berghe TV, Vandenabeele P. Necrosis, awell-orchestrated form of cell demise: signalling cascades,important mediators and concomitant immune response.Biochim Biophys Acta. 2006;1757:1371–87.
3. Heino A, Hartikainen J, Merasto ME, Koski EM, Tenhunen J,Alhava E, et al. Effects of dobutamine on splanchnic tissueperfusion during partial superior mesenteric artery occlusion.Crit Care Med. 2000;28:3484–90.
4. Souza DG, Teixeira MM. The balance between the productionof tumor necrosis factor-alpha and interleukin-10 determinestissue injury and lethality during intestinal ischemia andreperfusion. Mem Inst Oswaldo Cruz. 2005;100 Suppl:59–66.
5. Porta F, Takala J, Weikert C, Bracht H, Kolarova A, LauterburgBH, et al. Effects of prolonged endotoxemia on liver, skeletalmuscle and kidney mitochondrial function. Crit Care.2006;10:R118.
6. Li R, Zijlstra JG, Kamps JAAM, van Meurs M, Molema G. Abruptreflow enhances cytokine-induced proinflammatoryactivation of endothelial cells during simulated shock andresuscitation. Shock. 2014;42:356–64.
7. Peralta C, Jiménez-Castro MB, Gracia-Sancho J. Hepaticischemia and reperfusion injury: effects on the liversinusoidal milieu. J Hepatol. 2013;59:1094–106.
8. Resnick N, Yahav H, Shay-Salit A, Shushy M, Schubert S,Zilberman LCM, et al. Fluid shear stress and the vascularendothelium: for better and for worse. Prog Biophys Mol Biol.2003;81:177–99.
9. Gourdin MJ, Bree B, Kock MD. The impact of ischaemia –reperfusion on the blood vessel. Eur J Anaesthesiol.2009;26:537–47.
0. Gracia-Sancho J, Casillas-Ramirez A, Peralta C. Molecularpathways in protecting the liver from ischaemia/reperfusioninjury: a 2015 update. Clin Sci (Lond). 2015;129:345–62.
1. Sasaki M, Joh T. Oxidative stress and ischemia-reperfusioninjury in gastrointestinal tract and antioxidant, protectiveagents. J Clin Biochem Nutr. 2007;40:1–12.
2. Romanenko VG, Davies PF, Levitan I. Dual effect of fluid shearstress on volume-regulated anion current in bovine aorticendothelial cells. Am J Physiol Cell Physiol. 2002;282:C708–18.
3. Huang Y, Rabb H, Womer KL. Ischemia-reperfusion andimmediate T cell responses. Cell Immunol. 2007;248:4–11.
4. Vardanian AJ, Busuttil RW, Kupiec-Weglinski JW. Molecularmediators of liver ischemia and reperfusion injury: a briefreview. Mol Med. 2008;14:337–45.
5. Webster K. Mitochondrial membrane permeabilization andcell death during myocardial infarction: roles of calcium andreactive oxygen species. Future Cardiol. 2012;8:863–84.
6. Orogo AM, Gustafsson ÅB. Cell death in the myocardium: myheart won’t go on. IUBMB Life. 2013;65:651–6.
7. Attuwaybi B1, Kozar RA, Gates KS, Moore-Olufemi S, Sato N,Weisbrodt NWMF. Hypertonic saline prevents inflammation,injury, and impaired intestinal transit after gutischemia/reperfusion by inducing heme oxygenase 1 enzyme.J Trauma Acute Care Surg. 2004;56:749–59.
8. Braz JRC, do Nascimento PJ, Paiva Filho O, Braz LG, Vane LA,
Vianna PTG, et al. The early systemic and gastrointestinaloxygenation effects of hemorrhagic shock resuscitation withhypertonic saline and hypertonic saline 6% dextran-70: a3
0 1 7;4 5(4):280–290 289
comparative study in dogs. Anesth Analg. 2004;99:536–46.
9. Gurfinkel V, Poggetti RS, Fontes B, da Costa Ferreira Novo F,Birolini D. Hypertonic saline improves tissue oxygenation andreduces systemic and pulmonary inflammatory responsecaused by hemorrhagic shock. J Trauma. 2003;54:1137–45.
0. Moore FA, McKinley BA, Moore EE. The next generation inshock resuscitation. Lancet. 2004;363:1988–96.
1. Victorino GP, Newton CR, Curran B. Effect of hypertonic salineon microvascular permeability in the activated endothelium.J Surg Res. 2003;112:79–83.
2. Zani BG, Bohlen HG. Sodium channels are required duringin vivo sodium chloride hyperosmolarity to stimulateincrease in intestinal endothelial nitric oxide production. AmJ Physiol Heart Circ Physiol. 2005;288:H89–95.
3. Lu Y, Cai X, Gu L, Mu H, Huang W. Hypertonic salineresuscitation maintains a more balanced profile ofT-lymphocyte subpopulations in a rat model of hemorrhagicshock. J Zhejiang Univ Sci B. 2007;8:70–5.
4. Oreopoulos GD, Wu H, Szaszi K, Fan J, Marshall JC, KhadarooRG, et al. Hypertonic preconditioning prevents hepatocellularinjury following ischemia/reperfusion in mice: a role forinterleukin 10. Hepatology. 2004;40:211–20.
5. Ke Q-H, Zheng S-S, Liang T-B, Xie H-Y, Xia W-L. Pretreatmentof hypertonic saline can increase endogenous interleukin 10release to attenuate hepatic ischemia reperfusion injury. DigDis Sci. 2006;51:2257–63.
6. Gonzalez E, Kozar R, Suliburk JW, Weisbrodt NW, Mercer DW,Moore F. Conventional dose hypertonic saline providesoptimal gut protection and limits remote organ injury aftergut ischemia reperfusion. J Trauma Inj Infect Crit Care.2006;61:66–73.
7. Taurà P, Ibarzabal A, Vendrell M, Adelsdorfer C, Delitala A, DeLacy B, et al. Pretreatment with endothelium-derived nitricoxide synthesis modulators on gastrointestinalmicrocirculation during NOTES: an experimental study. SurgEndosc. 2016, March 23. Epub ahead of print.
8. Flores J, DiBona DR, Beck CH, Leaf A. The role of cell swellingin ischemic renal damage and the protective effect ofhypertonic solute. J Clin Invest. 1972;51:118–26.
9. Schertel ER, Valentine AK, Rademakers AM, Muir WW.Influence of 7% NaCl on the mechanical properties of thesystemic circulation in the hypovolemic dog. Circ Shock.1990;31:203–14.
0. Kreimeier U, Bruckner UB, Niemczyk S, Messmer K.Hyperosmotic saline dextran for resuscitation fromtraumatic-hemorrhagic hypotension: effect on regional bloodflow. Cic Shock. 1990;32:83–99.
1. Mouren S, Delayance S, Mion G, Souktani R, Fellahi JL,Arthaud M, et al. Mechanisms of increased myocardialcontractility with hypertonic saline solutions in isolatedblood-perfused rabbit hearts. Anesth Analg. 1995;81:777–82.
2. Wang Y-L, Lam K-K, Cheng P-Y, Kung C-W, Chen S-Y, ChaoC-C, et al. The cardioprotective effect of hypertonic saline isassociated with inhibitory effect on macrophage migrationinhibitory factor in sepsis. Biomed Res Int. 2013;2013:1–10.
3. Oliveira RP, Velasco I, Soriano FG, Friedman G. Clinical review:hypertonic saline resuscitation in sepsis. Crit Care.2002;6:418–23.
4. Han J, Ren H-Q, Zhao Q-B, Wu Y-L, Qiao Z-Y. Comparison of3% and 7.5% hypertonic saline in resuscitation aftertraumatic hypovolemic shock. Shock. 2015;43:244–9.
5. Sidi A, Muehlschlegel JD, Kirby DS, Kirby RR, Lobato EB.Treating ischemic left ventricular dysfunction with

s i o l
3
3The immunomodulatory effects of hypertonic saline
290 r e v c o l o m b a n e s t e
hypertonic saline administered after coronary occlusion inpigs. J Cardiothorac Vasc Anesth. 2007;21:400–5.
6. Sánchez-Etayo G, Borrat X, Escobar B, Hessheimer A,Rodriguez-Laiz G, Taurá P. Effect of intra-abdominal pressureon hepatic microcirculation: implications of the endothelin-1receptor. J Dig Dis. 2012;13:478–85.
. 2 0 1 7;4 5(4):280–290
7. Rizoli SB, Rhind SG, Shek PN, Inaba K, Filips D, Tien H, et al.
resuscitation in patients sustaining traumatic hemorrhagicshock: a randomized, controlled, doubled-blinded trial. AnnSurg. 2006;243:47–57.