revised ctuir renewable energy feasibility study/67531/metadc783039/... · revised ctuir renewable...
TRANSCRIPT
Revised CTUIR RENEWABLE ENERGY
FEASIBILITY STUDY
FINAL REPORT June 20,2005
Rev.October 31,2005
United States Government Department of Energy
National Renewable Energy Laboratory DE-FC36-02GO-12106
Compiled under the direction of:
Stuart G. Harris, Director Department of Science & Engineering
Confederated Tribes of the Umatilla Indian Reservation P.O. Box 638
Pendleton, Oregon 97801

2

Table of Contents
I. Acknowledgement Page No.
5
11. Summary 6
111. Introduction 12
111-1. CTUIR Energy Uses and Needs 111- 1- 1. Residential Population - UIR 111-1-2. Residential Energy Use - UIR 111-1-3. Commercial and Industrial Energy Use - UIR 111-1-4. Comparison of Energy Cost on UIR with National Average 111- 1-5. Petroleum and Transportation Energy Usage 111-1-6. Electrical Power Needs - UIR 111- 1-7. State of Oregon Energy Consumption Statistics 111-1-8 National Energy Outlook
111-2. Energy Infrastructure on Umatilla Indian Reservation 111-2- 1. Electrical 111-2-2. Natural Gas 111-2-3. Biomass Fuels 111-2-4. Transportation Fuels 111-2-5. Other Energy Sources
111-3. Renewable Energy Economics 111-3- 1. Financial Figures of Merit 111-3-2. Financial Structures 111-3-3. Calculating Levelized Cost of Energy (COE) 111-3-4. Financial Model and Results
IV. Renewable Energy Resources, Technologies and Economics - In-and-Near the UIR IV- 1 Biomass Resources
IV- 1-1. Resource Availability IV-1-1-1. Forest Residues IV-1-1-2. Forest Mill Residues IV-1-1-3. Agriculture Residues IV-1-1-4. Dedicated Energy Crops IV-1-1-5. Urban Wood Waste
IV-1-2. Summary IV- 1-3. References
IV-2. Bio-Pellet Fuel IV-2-1. Background IV-2-2. Resource Assessment
IV-2-2- 1. Agriculture Crops, Residues and Byproducts IV-2-2-2. Forest Crops, Byproducts and Residues
14 14 14 15 16 16 17 17 17
19 20 21 21 21 21
21 21 22 23 25
27 27 27 27 28 30 32 33 35 36
38 38 39 39 40
3
Table of Contents - Continued
IV-2-3. Pellet Fuel Technology - Manufacture and Uses IV-2-3-1. Pellet Fuel Manufacture IV-2-3-2. Fuel Pellet Properties and Specifications IV-2-3-3. Pellet Fuel Use and Appliances
IV-2-4. Pellet Fuel Economics IV-2-5. Regulatory and Environmental Issues IV-2-6. References
IV-3. Bio -Diesel Fuel IV-3-1 Conversion Process IV-3-2. Bio-Diesel Fuel Production IV-3-3. Bio-Diesel Fuel Economics IV-3-4. Environmental Issues IV-3-5. Bio-Diesel Market IV-3-6. Bio-Diesel Incentive Programs and Tax Credits IV-3-7. References
IV-4. Bio-Ethanol Fuel IV-4- 1. Technology Overview IV-4-2. Economics of Bio-Ethanol Production IV-4-3. Bio -Ethanol Production Potential IV-4-4. Bio-Ethanol Incentive Programs and Tax Credits
IV-5. Solar Energy IV-5-1. Solar Resource IV-5-2. Solar Technologies IV-5-3. Solar Economics IV-5-4. Solar Recommendations
IV-6. Wind Energy IV-6-1. Introduction IV-6-2. Wind Development - National, Regional and Local
IV-6-2- 1. National Wind Development IV-6-2-2. Regional Wind Development IV-6-2-3. Federal Government IV-6-2-4. Oregon State IV-6-2-6. Energy Trust of Oregon IV-6-2-5. Washington State IV-6-2-7. Utilities
IV-6-3. Wind Energy Economics and Incentives IV-6-4. Environmental Attribute Value
IV-6-4- 1. Power Purchase IV-6-4-2. Commercial Generation IV-6-4-3. Distributed Generation
Page No. 40 41 42 47 57 62 64
67 67 72 75 80 81 82 83
87 87 89 89 90
91 91 93 102 110
111 111 113 113 114 115 116 117 118 119 120 121 122 122 123
4

Table of Contents - Continued
Page No. IV-6-4-4. Developing Wind Power on the UIR
IV-6-5-1. Preliminary Wind Assessment on the UIR IV-6-5-2. Anemometer Siting Criteria IV-6-5-3. Infrastructure
IV-6-6-1. Study Areas IV-6-6-2. Wind Monitoring Strategy
V-6-5. Wind Resources
IV-6-6. Wind Monitoring Feasibility
IV-6-7. Conclusions and Recommendations IV-6-8 References
IV-6-9. PNNL Report Transmission System Access for Wind-generated Electricity
V. Draft Renewable Energy Vision
VI. Business Developmeit Planning VI-1 Wind Energy Business Plan VI-2 Bio-Pellet Fuel Business Plan VI-3 Bio-Diesel Fuel Development Plan VI-4 Bio-Ethanol Fuel Development Plan VI-5 Solar Energy Development Plan
IV-2-8. Pellet Fuel Appendices
IV-2-8-3. Pellet Appliance Manufactures IV-2-8- 1. Pellet Fuel Manufactures
IV-2-8-4. Miscellaneous Information
IV-3-8. Bio-diesel Appendices IV-3-8- 1. Current and Proposed Bio-Diesel Production Plants IV-3-8-2. NBB Member Fuel ProducersMarketers IV-3-8-3. Bio-Diesel Distributors in OR, WA, NV, CA and ID
124 124 124 126 128 129 129 134 136 137 139
143
147 147 148 149 152 152
154 154 158 159
161 161 163 165
5

I. Acknowledgement
The financial support for the work contained in this report has been provided by the U. S. Department of Energy with contribution by Pacific Northwest National Laboratory, Office of Small Business Programs and the Confederated Tribes of the Umatilla Indian Reservation.
The CTUIR, the preparer’s of this feasibility study wish to acknowledge and thank those individuals of the Department of Energy (DOE) National Renewable Energy Laboratory (NREL), the DOE Pacific Northwest National Laboratory, the Bonneville Power Administration and the Oregon Office of Energy. These entities are tirelessly promoting better energy policy for everyone. In addition the preparers would also thank the many, many other people the Department of Science and Engineering consulted from the public an private sectors dedicated to incorporating sustainability, conservation, and renewable energy into practice and their willingness to share their knowledge.
Feasibility Report Prepared by:
Dr. John Cox Dr. Rico Cruz
Ted Repasky, MS Lisa Breckenridge, MBA
Thomas Bailor, BA
6

II. Summary
Energy is an essential resource in this 21st century and energy resources are essential to ensure survival in this modern era. As such, energy from a Tribal perspective is an issue of sovereignty, sustainability, and self sufficiency. Achieving energy independence is essential to achieving self determination. The environmental impacts of past energy production and the shrinking supply of fossil fuels is forcing the emergence of a new energy economy. The CTUIR must adapt to this changing global environment to survive. Although energy development and production has impacted many resources significant to the CTUIR, energy itself, is also a very significant cultural resource that must be properly managed to help the CTUIR sustain their community.
This preliminary assessment of renewable energy resources on the Umatilla Indian Reservation (UIR) has been performed by CTUIR Department of Science and Engineering (DOSE). This analysis focused primarily identifying renewable resources that may be applied on or near the Umatilla Indian Reservation. In addition preliminary technical and economic feasibility of developing renewable energy resources have been prepared and initial land use planning issues identified. Renewable energies examined in the course of the investigation included solar thermal, solar photovoltaic, wind, bio - ethanol, bio-diesel and bio-pellet fuel. All xnewable energy options studied were found to have some potential for the CTUIR. These renewable energy options are environmentally friendly, sustainable, and compliment many of the policy goals of the CTUIR.
Energy is a priority of the CTUIR BOT. The CTUIR tribal government is developing an energy policy that includes policy direction on energy diversity and sustainability and investigating options and opportunities to realize their goals of energy independence. Due in part to this effort, more planning time and effort has now been spent looking at and understanding energy efficiency and conservation issues on the UIR. The tribe has now participated in several energy efficiency initiatives and investigations of major facilities and assets. Conservation and efficiency are often a pre requisite for renewable implementation.
This report seeks to provide an overall review of renewable energy technologies and applications. It tries to identify existing projects near to the CTUIR and the efforts of the federal government, state government and the private sector in the renewable energy arena. It seeks to provide an understanding of the CTUIR as an energy entity. This report intends to provide general information to assist tribal leadership in making decisions related to energy, specifically renewable energy development. The authors recognize that in a general sense the information contained within provides that overview but in many cases falls short. This stems from the fact that the reservation is in a sense a contained universe where many details about energy use in the community is not readily available or easily accessible. As such it is extremely important that the CTUIR seek to gather and organize its energy information.
7

In many cases the results of research in this project have been incorporated into ongoing efforts. The CTUIR now has a better data set available on the major utilities both transmission and distribution for incorporation into planning and the CTUIR is now further along in the planning phase of several renewable energy projects. Energy efficiency and conservation efforts are being undertaken, and the data provided by this research has already moved the CTUIR into the next phase of wind, biomass, and bio- fuel development.
Wind Wind energy development is commensurate with CTUIR’s effort to diversify its economy that recognizes energy as an essential natural resource and renewable energies as a sustainable and practical substitute and alternative to fossil fuels with a lower environmental impact. In addition wind may ease the pressure on hydro electric generation assisting in fisheries, natural and cultural resources management. As such the CTUIR has become a partner in the 105 MW Arlington Wind Project located at the upper end of the Columbia River Gorge in Easter Oregon.
There is an estimated 150 MW of commercial wind electric capacity on the UIR. Within the CTUIR homelands and beyond even greater capacity of high quality wind may be accessible to the Confederated Tribes of the Umatilla Indian Reservation (CTUIR). This would require land acquisition and exchange, economic partnerships or by other design through the Tribes existing partnerships and alliances. The economics of commercial wind development on the UIR looks favorable enough for the CTUIR to pursue the next phase of data gathering.
The CTUIR DOSE has begun undertaking a two year wind energy mapping and data collection effort on the Umatilla Indian Reservation in order to prove the preliminarily modeled wind resource. It is hoped that findings reported during this next effort identify specific sites for wind generators as well as address, political, technical and market issues and barriers to a staged commercial wind power development. Conceivably over the next ten years self-sufficient generation capacity of about 7 MW to 20-fold increase could be envisioned. The most direct plan for wind development would consist of partnering with commercial wind developers.
Solar Solar energy on the UIR does not appear to hold the same potential of wind for commercial development. Solar energy resources are most appropriate for remote residential, solar thermal and other specific applications. Solar energy can also play an essential role in reducing the consumption of electricity at small loads throughout the reservation Climate and weather conditions are such that during the winter months much of the UIR, including areas where there is the greatest concentration of residential and commercial buildings, is cloud and fog covered from temperature inversions. Nevertheless, reliable solar energy technologies do exist that may be economically and esthetically preferable to some residents, particularly for those in remote locations without access to the electrical power distribution system.
8
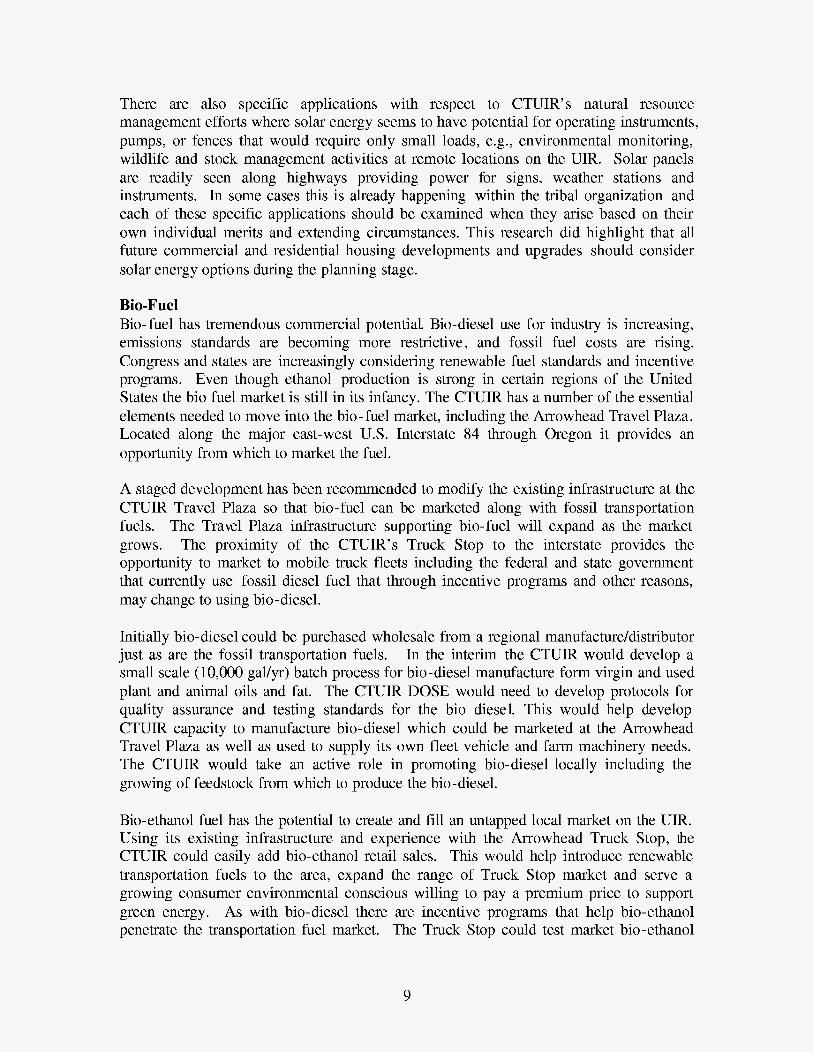
There are also specific applications with respect to CTUIR’ s natural resource management efforts where solar energy seems to have potential for operating instruments, pumps, or fences that would require only small loads, e.g., environmental monitoring, wildlife and stock management activities at remote locations on the UIR. Solar panels are readily seen along highways providing power for signs, weather stations and instruments. In some cases this is already happening within the tribal organization and each of these specific applications should be examined when they arise based on their own individual merits and extending circumstances. This research did highlight that all future commercial and residential housing developments and upgrades should consider solar energy options during the planning stage.
Bio-Fuel Bio- fuel has tremendous commercial potential. Bio-diesel use for industry is increasing, emissions standards are becoming more restrictive, and fossil fuel costs are rising. Congress and states are increasingly considering renewable fuel standards and incentive programs. Even though ethanol production is strong in certain regions of the United States the bio fuel market is still in its infancy. The CTUIR has a number of the essential elements needed to move into the bio-fuel market, including the Arrowhead Travel Plaza. Located along the major east-west U.S. Interstate 84 through Oregon it provides an opportunity from which to market the fuel.
A staged development has been recommended to modify the existing infrastructure at the CTUIR Travel Plaza so that bio-fuel can be marketed along with fossil transportation fuels. The T r a d Plaza infrastructure supporting bio-fuel will expand as the market grows. The proximity of the CTUIR’s Truck Stop to the interstate provides the opportunity to market to mobile truck fleets including the federal and state government that currently use fossil diesel fuel that through incentive programs and other reasons, may change to using bio-diesel.
Initially bio- diesel could be purchased wholesale from a regional manufacture/distributor just as are the fossil transportation fuels. In the interim the CTUIR would develop a small scale (10,000 gal/yr) batch process for bio-diesel manufacture form virgin and used plant and animal oils and fat. The CTUIR DOSE would need to develop protocols for quality assurance and testing standards for the bio diesel. This would help develop CTUIR capacity to manufacture bio-diesel which could be marketed at the Arrowhead Travel Plaza as well as used to supply its own fleet vehicle and farm machinery needs. The CTUIR would take an active role in promoting bio-diesel locally including the growing of feedstock from which to produce the bio-diesel.
Bio-ethanol fuel has the potential to create and fill an untapped local market on the UIR. Using its existing infrastructure and experience with the Arrowhead Truck Stop, the CTUIR could easily add bio-ethanol retail sales. This would help introduce renewable transportation fuels to the area, expand the range of Truck Stop market and serve a growing consumer environmental conscious willing to pay a premium price to support green energy. As with bio-diesel there are incentive programs that help bio-ethanol penetrate the transportation fuel market. The Truck Stop could test market bio-ethanol
9

with little downside risk, since infrastructure for fossil and renewable energy fuels are comparable and transferable. The bio-ethanol would be secured as a blend from a regional supplier. Over the longer term, the CTUIR would promote bio-ethanol in the region including establishing a bio -ethanol manufacturing plant.
Bio-Pellet Bio-pellet fuel manufacturing was found to be economically feasible and consistent with cultural values and tribal goals for local environmental issues. The CTUIR is located near abundant biomass resources that could be incorporated with other tribal efforts. For example he CTUIRs Tribal Environmental Recycling Facility (TERF) must have its municipal waste hauled to an area landfill at considerable expense. A substantial portion of this waste is biomass suitable for pellet fuel manufacture. A @let manufacturing plant could utilize this waste to reduce the cost to the CTUIR of operating the TERF and in parallel the CTUIR has planned a light industrial park adjacent to the existing facility.
In addition, the use of pellet fuel provides an opportunity to upgrade the residential wood burning stoves on the UIR to current standards that in turn addresses one of the principal air quality issues (Le. particulate matter) in and near the UIR. The close proximity of the CTUIR to national forests could provide the biomass resources for expanding the capacity of a bio -pellet fuel manufacturing operation to meet market demands. Although it will take time converting the community on the Umatilla Indian Reservation to bio pellet fuel for heat, it would have an immense benefit to the quality of the community’s air shed.
Other renewable energy resources available in and near to the UIR, in particular hydropower, geothermal, and bio-fuel power plants, were not included in this study. While conservation and efficiency studies were not conducted as part of this feasibility analysis they are recognized as an important component of the CTUIR’s renewable energy plans and supplemental investigations have been initiated. Although many different insights administrative and technical details and recommendations can be gleaned from the body of information contained in the report the following are recommended :
1. That the CTUIR develop or formalize an energy policy that that provides policy makers, tribal member, and technical staff direction and goals in pursuing energy independence, the policy must assists in coordinating information and efforts related to energy production, conservation, efficiency and finances related to energy.
2. That the CTUIR DOSE continues to complete a conditional use permit for the installation of instruments to monitor environmental factors related to wind energy development.
3. That in planning all future projects, that the CTUIR seek incorporate solar passive, thermal and other application where applicable.
4. That the CTUIR DOSE move forward with in house expertise on education initiatives and efforts to produce bio-diesel and that the CTUIR seek to develop bio diesel and ethanol distribution at the Arrowhead travel plaza.
10

5. That bio-pellet efforts be initiated at the Tribal Environmental Recovery Facility and opportunities surrounding light industrial park be pursued and finally that bio pellet technologies be incorporated into air quality initiatives of the CTUIR.
11
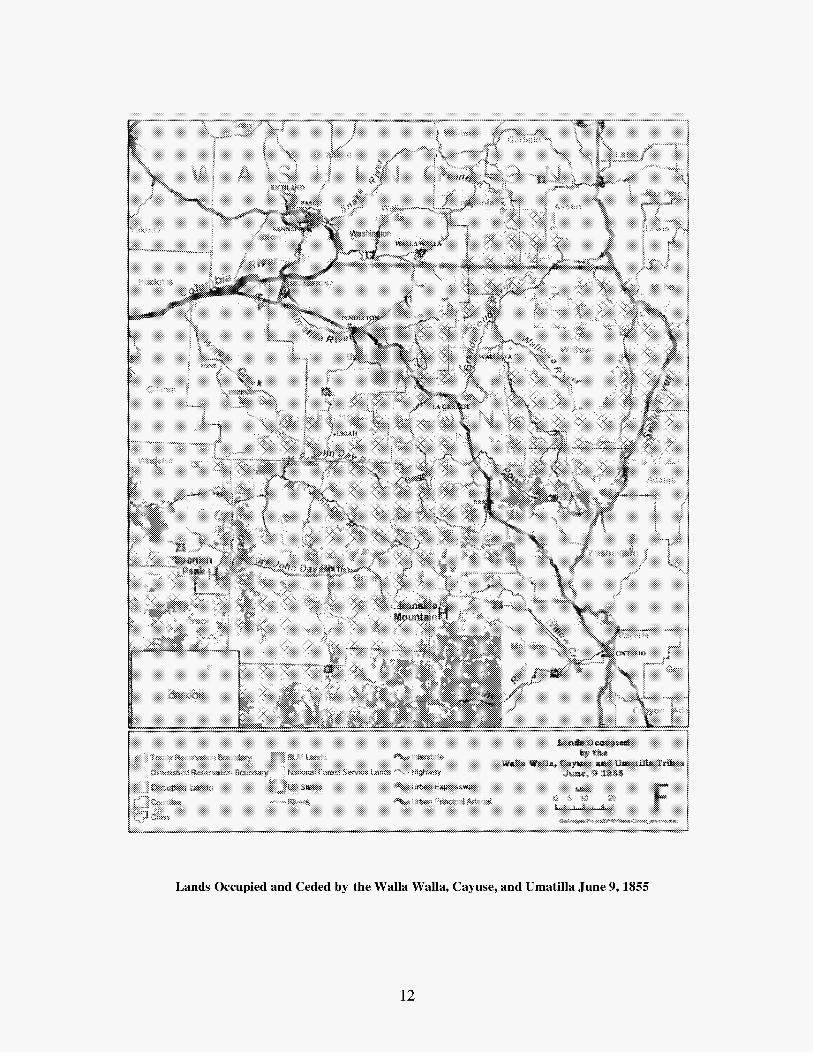
Lands Occupied and Ceded by the Walla Walla, Cayuse, and Umatilla June 9,1855
12

111. Introduction
The Cayuse, Umatilla, and Walla Walla Tribes make up the Confederated Tribes of the Umatilla Indian Reservation (CTUIR). Since time immemorial, members of the CTUIR have lived on the Columbia River Plateau and traveled between the Great Plains and the Northwest Coast. Our three Tribes were brought together on the Umatilla Indian Reservation, established by a Treaty with the US Government on June 9, 1855. At that time the CTUIR ceded 6.4 million acres of what is known now known as northeastern Oregon and southeastern Washington. In 1949 our leaders adopted a Constitution and By-laws that established a Board of Trustees and ushered in the era of modern tribal governance. Currently the CTUIR has over 2,446 enrolled tribal members. (www.umatilla.msn.us)
At the time of the treaty the tribal representatives reserved rights to aboriginal resources and exchanged exclusive title of land for a reservation located along the Blue Mountains. Natural Resources were the basis of the CTUIR traditional economy. The traditional way of life was based upon a seasonal round attuned to the seasonal availability to procure resources that had ensured survival since time immemorial. This reliance on natural resources including but certainly not limited to Salmon have been devastated by the development of the regions infrastructure that includes the Columbia River Hydro System, agriculture and the extraction of timber and minerals. The change in the environment severely threatens the membership of the CTUIR. Adapting to the changing environment and adopting new strategies to survive in this modern world of globalization is paramount.
Our world has been facing major energy-related problems: fossil fuel is running out; a reduction in fossil fuel would harm world economy; fossil fuel is one of the central aspects to wars and rebellions, and the earth is getting warmer due mainly to the increase of carbon dioxide in our atmosphere. Conservation, energy efficiency, renewable energy adoption and new energy technologies must emerge to meet the world's demands. The CTUIR must adapt in this changing time and work to participate in the new emerging energy economy. Indian nations represent less than one percent of the US. population and energy self sufficiency for Indian people would be a positive demonstration of U.S. governments fiduciary responsibility to Tribes.
The extraction of and demand for oil increased exponentially as new uses for oil were found. It will take only 200 years to conwme the oil that took 300 million years to create naturally (Cruz, 2004). At the current global consumption rate of 24 billion barreldyr, we will run out of fossil fuel by 2040. In 1997, worldwide reserves were at 997 billion barrels. By 2010, fossil fuel could become unaffordable for most people (Campbell, 1998). Dependence on fossil fuels harms every nation's economy, as for example the US, since we import a high percentage of the fossil fuel we consume, plus sending military troops, jobs and infrastructure. The aging United States infrastructure that relies on coal, natural gas, and hydroelectricity is having a devastating impact on the atmosphere, natural resources, and human health.
13
Planet Earth is currently undergoing a period of global warming due to the greenhouse effect of emissions from engines. Common symptoms of global warming as currently experienced includes: adaptive capacity of humans is decreasing with vulnerability increasing; food security diminishes as grain yields decrease; major rivers is becoming highly sensitive; increasing range of spread of infectious diseases and allergy-related disorders (e.g., asthma, hay fever, chronic bronchitis); desertification would be exacerbated; increase in droughts, floods and major events contributing to human and ecological stresses; more species extinction and ecological imbalance; and coastal human settlements would be adversely impacted by sea level fluctuations (Consumer Reports, 1996). Carbon dioxide levels in the atmosphere alone increased from 280 parts per billion in 1750 to approximately 360 ppb in 2000 (Gordon, 1991). While C02 does not directly affect health, synergistic effects are obvious, and lowering C02 emissions from fossil fuels would reduce air pollutants Tke smog-producing ozone and particulate matter. It is time now to explore other option for producing energy that does not exacerbate an already precarious situation.
The CTUIR as a sovereign has responsibility to address these changes and prepare future generations for survival in an energy uncertainly future. The CTUIR has the responsibility to understand itself as an energy entity in terms of what it consumes and produces. As such energy self sufficiency is a part of homeland security, it is an essential building block of sovereignty in the 2lrst century.
14

111-1. CTUIR Energy Uses and Needs
111-1-1. Residential Population - Umatilla Indian Reservation
The Reservation was home to nearly 3,000 people in 2000, almost evenly divided between Indian and norr Indian residents. The total Reservation population grew by 17% during the last decade, after a decline between 1980 and 1990, while total Indian population on the Reservation grew by 43% over this time period. The Indian population grew even faster off-Reservation than orrReservation, due in part to the lack of housing and employment opportunities on the Reservation.
Table 111-1-1. Umatilla Indian Reservation Population, 1980-2000
*Based on 17% increase per decade.
111-1-2. Residential Energy Use - Umatilla Indian Reservation (UIR)
As of 2000, there are 1,013 occupied homes and 52 vacant homes on the UIR. Most homes are heated by electricity, followed by utility (natural) gas and wood. Table 111-1-2 shows the current and projected residential energy use based on a 5% per decade increase in housing. The solar energy projection in Table 111-1-2 assumes that 10% of home’s electricity in 2010 and 20 % in 2020 will be supplied by norrhydro solar, primarily wind. Wood is a traditional energy source for the people of the UIR, and many still prefer wood heat to other means of heating their homes. The UIR is in close proximity to the Umatilla, Wallowa-Whitman, and Malheur National forests, and many of the tribal members gather their wood supply form these forests.
Table 111-1-2. Residential Energy Consumption, Umatilla Indian Reservation
15

Other fuel
Totals Source: US Census Bureau, Census 2000. T, Therm = 100,000 Btu Wood assumes 2 cord/home/y with heating value of 17.1 MM Btu/cord LPG, liquefied petroleum gas
7 2,394 7 2,514 8 2,640
1,013 633,138 1,064 667,587 1,117 701,117 40
Residential electrical power needs on the UIR is estimated by utility providers at 5 6 megawatts, 1-2 for households and 3-4 for CTUIR operations. Peak demand for CTUIR is reported to be 3 megawatts, reached in both January and August.
Facility Tamhtslikt Cultural Institute
Umatilla Indian Reservation 2000 Residential Heating Sources
S Fuel Oil 8%
0 Natural Gas
0 Electricity 37% 23%
H LPG 10%
Comments Largest energy user among CTUIR enterprises due to
H Other fuel 1 Yo
Wildhorse Resort
Tribal Government Complex
Figure 111-1 -1 Umatilla Indian Reservation 2000 Heating Sources
need for climate control for archival holdings. Has undergone energy efficiency study through Energy Trust of Oregon. Electric load has been reduced although NA for report and 23,000 therms. natural gas.
Second largest energy user among CTUIR enterprises. Includes golf course, casino, and hotel. Uses over 4 million kw over 100,000 natural gas therms. Preliminary Design includes energy efficiency and conservation. Site located near substation. May provide distributed generation potential.
111-1-3. Commercial and Industrial Energy Use - Umatilla Indian Reservation
Electrical power service is provided by Umatilla Electrical Cooperative and Pacific Power. Electrical distribution and transmission infrastructure maps are shown in Figure 111-2- 1. Natural gas service is provided by Cascade Natural Gas distribution system that includes ?h -4" lines.
Table 111-1-3. Commercial and Industrial Energy Consumers on UIR CY 2000
16

Mission Market I Located in a sheltered river valley. Excellent solar potential
Tribal Environmental Recovery Minimal power usage. Located near proposed Coyote Facility Light industrial park.
Arrowhead Travel Plaza Power usage unknown. Altho ugh uses approximately 2400 natural gas therms.
No load at present. Coyote Business Park
Proposed new tribal government complex Nictyoway Charter School and CayUmaWa headstart.
Charter School located in refurbished community center. CayUmaWa built circa 1975 and has been remodeled several times. Load unknown
Built 1977-78. New AC installed 2002. Natural Gas stoves and hot water heaters. Load unknown. Excellent Solar Potential
Longhouse
111.-1-4. Comparison of Energy Cost on CTUIR with National Average Cost
National Average Cost (Rural Utility Service 2004) Electricity Natural Gas
$0.085 per kWh ($85.00 per MWh) $6.96 per thousand cubic feet or $0.696/therm
Umatilla Indian Reservation Cost Electricity (Umatilla Electrical Cooperative) $0.065 per kWh Natural Gas (Cascade Natural Gas) $0.904/therm
111-1-5. Petroleum and Transportation Energy Usage
Total petroleum usage per person per day in Oregon is estimated at 2.27 gallons (DOEEIA-0383,2003). If the same purchasing trends hold true locally, CTUIR residents consume approximately 2,425,166 gallons of petroleum collectively per year based on 365 days per year and a 2000 population of 2927.
Average gasoline consumption per person per day in Oregon is about 0.85 gallons. Applying this State consumption figure to the UIR produces a consumption rate of 904,940 gallons per year for Reservation residents. Since this usage per day is based on an average of rural and urban areas, with a greater population density in urban areas, it is likely that rural gasoline consumption is higher.
Arrowhead sales (2003): 4,359,767 gal diesel; 1,585,283 gal of gasoline;
17

Located on U.S. Interstate 84 at the western base of the Blue Mountains and provides fuel for both travelers commercial and private as well as providing fuel for local consumption. The CTUIR’s GSA fleet includes 128 vehicles. None of these vehicles use hybrid technology and all of them run on gasoline. The CTUIR’s golf course has a fleet of electric golf carts.
111-1-6. Electrical Power Needs - Umatilla Indian Reservation
Table 111- 1-4 contains estimates of current and projected residential, commercial and industrial electrical power needs on the Umatilla Indian Reservation for 2003, 2010, 2015 and 2025. The out years assume modest annual growth rates of 1.9% for residential, 1.6% for commercial and 1.3% for industrial.
Table 111-1-4. Current and Projected Electrical Power (MW) Needs - Umatilla Indian Reservation
Source: 2005 Annual Energy Outlook, U.S. Department of Energy
111-1-7. State of Oregon Energy Consumption Statistics
Population: 3,472,867 Per Capita Income: $28,000 Total Energy Consumption: 1.1 quadrillion Btu Per Capita Energy Consumption: 316 million Btu Total Petroleum Consumption: 7.9 million gallons per day Gasoline Consumption: 4.1 million gallons per day Distillate Fuel Consumption: 1.8 million gallons per day Liquefied Petroleum Gas Consumption: 0.2 million gallons per day Jet Fuel Consumption: 0.7 million gallons per day
Source: Sources and notes: Energy Information Administration, Bureau of Census, and National Petroleum News “Market Facts 2001 ”
111-1-8. National Energy Outlook - 2003 through 2025 (Source: DOE/EIA-0383,2003,2005 Annual energy Outlook)
Total energy consumption is projected to increase from 97.3 to 130.1 quadrillion British thermal units (Btu) between 2001 and 2020, an average annual increase of 1.5 percent.
18

Residential energy consumption is projected to grow at an average rate of 1.0 percent per year between 2001 and 2025, with the most rapid growth expected for computers, electronic equipment, and appliances.
Transportation energy demand is projected to grow at an average annual rate of 2.0 percent between 2001 and 2025, reaching 40.4 quadrillion Btu in 2020 and 44.0 quadrillion Btu by 2025. The higher l e d of consumption in the transportation sector results from a higher forecast of vehicle miles traveled and a lower level of vehicle efficiency.
Total electricity demand is projected to grow by 1.9 percent per year from 2001 through 2020 and 1.8 percent per year from 2001 to 2025. Rapid growth in electricity use for computers, office equipment, and a variety of electrical appliances in the residential and commercial sectors is only partially offset by improved efficiency in these and other more traditional electrical applications; however, demand growth is expected to slow as regional and national market saturation is reached for air conditioning and some other applications.
Total petroleum demand is projected to grow at an average annual rate of 1.7 percent through 2025 (reaching 29.17 million barrels per day), led by growth in the transportation sector, which is expected to account for about 74 percent of petroleum demand in 2025.
Total renewable fuel consumption, including ethanol for gasoline blending, is projected to grow at an average rate of 2.2 percent per year through 2025, primarily due to State mandates for renewable electricity generation. About 55 percent of the projected demand for renewable energy in 2025 is for electricity generation and the rest for dispersed heating and cooling, industrial uses (including CHP), and fuel blending.
Energy use per person generally declined from 1970 through the mid-1980s but began to increase as energy prices declined in the late 1980s and 1990s. Per capita energy use is projected to increase in the forecast, with growth in demand for energy services only partially offset by efficiency gains. Per capita energy use increases by 0.7 percent per year between 2001 and 2025.
Renewable technologies are projected to grow slowly because of the relatively low costs of fossil- fired generation (and high cost of renewable energy) and because competitive electricity markets favor less capital- intensive natural gas technologies over coal and base load renewable energy in the competition for new capacity.
111-1-9 References
1. Rural Utility Service, 2004.doc
2. DOE/EIA - 0383,2003 3. 4. 5.
2005 Annual Energy Outlook, U.S. Department of Energy. U.S. Bureau of Census, 2002 National Petroleum News, 2001 Market Facts.
19

111-2. Energy Infrastructure on Umatilla Indian Reservation
111-2-1. Electrical
The electrical energy on the reservation is provided by two suppliers, Umatilla Electrical Cooperative and Pacific Power a subsidiary of PacifiCorp who work with the regional power agency, the Bonneville Power Administration (BPA), to provide electricity on the Umatilla Indian Reservation and surrounding area. Figure 111-2- 1 display the electrical infrastructure on the UIR. Any three-phase electrical service could handle distribution (not transmission) of a new renewable load of a few megawatts as might be produced from wind energy.
Figure 111-2 :ion
20

BPA has a 35 Mile 230 kV line crossing the Reservation in a 100 foot wide right of way. This line is a regional transmission line that runs roughly east-west through the UIR. A long term agreement between the CTUIR and BPA has been established to accommodate this line.
The Umatilla Electric Cooperative (UEC) is a small, nonprofit rural electric cooperative. As a preferred customer of the Bonneville Power Administration, Umatilla Electric Cooperative retains first right to federally owned hydroelectric resources. UEC serves approximately ?h the area of the UIR and has approximately 226 miles of line on the Reservation. UEC has a substation located at Mission. UEC primarily serves residents in the outlying areas of the Reservation. Umatilla Electrical Cooperative purchases most of the electricity they supply to the UIR and other local markets in Umatilla Co. from the northwest hydropower system.
Pacific Power is a subsidiary of PacifiCorp, a large investor owned integrated electrical power company. Pacific Power serves customers with ?h the distribution lines on the Reservation. Pacific Power serves customers from the Round Up Substation that ties into the Bonneville 230 kV line. Pacific Power serves the primary commercial load on the Reservation including the Wildhorse Resort and Casino, RV Park, Arrowhead Travel Plaza, Gulf Course and Tamhtslikt Culture Institute as well as many of the more densely populated residential areas.
PacifiCorp reports the following electric energy mix it provides its customers while Table IV-2-5 shows a summary of PacifiCorp’s 8,364 MW generation capacity.
12.89% from hydropower 85.71 % energy nonrenewables (coal and natural gas)
1.40 % from wind, geothermal and solar
Table 111-2-5. PacifiCorp Energy Generation Summary
Thermal units (power plants, primarily coal and natural gas): Operator of 10 plants plus part owner of 6 more in Wyoming, Utah, Arizona, Colorado, Montana and Oregon. Capacity: nearly 7,169 megawatts
Hydropower: 53 facilities (dams) in Washington, Oregon, Idaho, Utah and Montana Capacity: 1,078 megawatts
Wind: 2 facilities in Wyoming (Wyoming Wind Energy Project and Rock River I) Capacity: 91 megawatts
Geothermal: 1 facility (Blundell) Capacity: 26 megawatts
Solar: 1 facility (California) Capacity: unknown
Source: www.pacificorp.com I
21

111-2-2. Natural Gas
Cascade Natural Gas (CNG) is the sole provider of natural gas service on the UIR. CNG is headquartered out of Seattle, Washington with a district office in Pendleton, Oregon. Major natural gas transmission lines run across the UIR in roughly a north south direction. The natural gas transmission lines are owned and operated by Williams of Tulsa Oklahoma. There are three Williams owned natural gas transmission lines of 30,22, and 6 inches that cross the Umatilla Indian Reservation, the latter a lateral to Walla Walla. Chevron provides liquid petroleum products through two liquid fuel transmission lines of 6 and 8 inch and still owns a tank facility on the reservation that is currently not used due to environmental concerns.
111-2-3. Biomass Fuels
Wood is the only biomass used at this time on the UIR. Use is confined primarily to traditional activities such as but not limited to residential heating and cooking, camping, lodging material (teepee), fishing scaffolds, fish drying sheds, smokehouses, poles (fence, corrals), traditional art, and sweat lodge. The wood comes primarily from three National Forests that are in close proximity to the UIR, the Wallowa-Whitman National Forest, Malheur National Forest and the Umatilla National Forest. The CTUIR retain rights to public lands throughout their usual and accustomed territories including near fishing stations that would require use of other public lands. Some fire wood is also obtained from private lands. While there are a number of commercial suppliers of wood, many residents that use wood go to the forest and harvest their own.
111-2-4. Transportation Fuels
There is only one commercial transportation fuel station on the UIR, the Arrowhead Travel Plaza. The truck stop is owned by the CTUIR and is located along interstate 1-82. The plaza provides gasoline, diesel and LPG service and is diversifying to serve all travelers. There are no biofuels currently provided by the station.
111-2-5. Other Energy Sources
There is one 1kW privately owned wind energy system on the UIR. The LPG and fuel oil that are used as residential energy and back up fuel for generators on the UIR are supplied by commercial vendors off the reservation in the nearby cities of Pendleton, Hermiston and La Grande. There are some small biodiesel efforts in the surrounding community.
111-3. Renewable Energy Economics
111-3-1. Financial Figures of Merit
An investor, energy policy analyst, or developer may use a variety of figures of merit to evaluate the financial attractiveness of a power project. The choice often depends on the
22
purpose of the analysis. However, most begin with estimates of the project’s capital cost, projected power output, and annual revenues, expenses, and deductions. A proforma earnings statement, debt redemption schedule, and statement of after-tax cash flows are typically also prepared. Annual after-tax cash flows are then compared to initial equity investment to determine available return. For another perspective, before- tax, no- debt cash flows may also be calculated and compared to the project’s total cost. The four primary figures of merit are:
Net Present Value: Net Present Value (NPV) is the sum of all years’ discounted after-tax cash flows. The NPV method is a valuable indicator because it recognizes the time value of money. Projects whose returns show positive NPVs are attractive.
Internal Rate of Return: Internal rate of return (IRR) is defined as the discount rate at which the after-tax NPV is zero. The calculated IRR is examined to determine if it exceeds a minimally acceptable return, often called the hurdle rate. The advantage of IRR is that, unlike NPV, its percentage results allow projects of vastly different sizes to be easily compared.
Cost of Energy: To calculate a levelized cost of energy (COE), the revenue stream of an energy project is discounted using a standard rate (or possibly the project’s IRR) to yield an NPV. This NPV is levelized to an annual payment and then divided by the project’s annual energy output to yield a value in cents per kWh. The COE is often used by energy policy analysts and project evaluators to develop first- order assessments of a project’s attractiveness. The levelized COE defines the stream of revenues that minimally meets the requirements for equity return and minimum debt coverage ratio. Traditional utility revenue requirement analyses are cost-based, ie., allowed costs, expenses, and returns are added to find a stream of revenues that meet the return criteria. Market-based Independent Power Producer (IPP) and Generating Company (GenCo) analyses require trial- and-error testing to find the revenues that meet debt coverage and equity return standards, but their COEs likewise provide useful information.
Payback Period: A payback calculation compares revenues with costs and determines the length of time required to recoup the initial investment. A Simple Payback Period is often calculated without regard to the time value of money. This figure of merit is frequently used to analyze retrofit opportunities offering incremental benefits and end- user applications.
111-3-2. Financial Structures
Four distinct ownership perspectives were identified for this analysis. Each reflects a different financial structure, financing costs, taxes, and desired rates of return. Briefly, the four ownership scenarios are:
23

Generating Company (GenCo): The GenCo takes a market-based rate of return approach to building, owning, and operating a power plant. The company uses balance-sheet or corporate finance, where debt and equity investors hold claim to a diversified pool of corporate assets. For this reason, GenCo debt and equity are less risky than for an IPP (see below) and therefore GenCos pay lower returns. A typical GenCo capital structure consists of 35% debt at a 7.5% annual return (with no debt service reserve or letter of credit required) and 65% equity at 13% return. Although corporate finance might assume the debt to equity ratio remains constant over the project's life and principal is never repaid, it is often informative to explicitly show the effect of the project on a stand-alone financial basis. Therefore, to be conservative, the debt term is estimated as 28 years for a 30- year project, and all the debt is repaid assuming level mortgage-style payments. Flow- through accounting is used so that the corporate GenCo receives maximum benefit from accelerated depreciation and tax credits.
Independent Power Producer (IPP): An IPP's debt and equity investment is secured by only the one project, not by a pool of projects or other corporate assets as is the case for a GenCo. In this project finance approach, a typical capital structure is 70% debt at 8.0% annual return (based on 30-year Treasury Bill return plus a 1.5% spread) and 30% equity at a minimum 17% return. A 6-month Debt Service Reserve is maintained to limit repayment risks. Debt term for an IPP project is generally 15 years, with a level mortgage-style debt repayment schedule. (For solar and geothermal projects that are entitled to take Investment Tax Credits, a capital structure of 60% debt and 40% equity should be considered.) Flow- through accounting is used to allow equity investors to realize maximum benefit from accelerated depreciation and tax credits. IPP projects are required to meet two minimum debt coverage ratios. The first requirement is to have an operating income of no less than 1.5 times the annual debt service for the worst year. The second is to have an operating income of about 1.8 times or better for the average year. Because debt coverage is often the tightest constraint, actual IRR may be well over 17%, to perhaps 20% or more. Likewise, with good debt coverage, negative after-tax cash flows in later years of debt repayment (phantom income) are low.
Regulated Investor- Owned Utility (IOU) : The regulated IOU perspective analyzes a project with a cost-based revenue requirements approach. As described by the EPRI Technical Assessment Guide (TAG ), returns on TM investment are not set by the market, but by the regulatory system. In this calculation, operating expenses, property taxes, insurance, depreciation, and returns are summed to determine the revenue stream necessary to provide the approved return to debt and equity investors. Use of a Fixed Charge Rate is a way to approximate the levelized COE from this perspective. IOU capital structure is estimated as 47% debt at a 7.5% annual return; 6% preferred stock at 7.2%; and 47% common stock at 12.0%. Debt term and project life are both 30 years. Accelerated depreciation is normalized using a deferred tax account to spread the result over the project's lifetime. IOUs are not eligible to take an Investment Tax Credit for either solar or
24

geothermal projects. Municipal Utility (or other tax-exempt utility): The municipal utility uses an analysis approach similar to that of the IOU. Capital structure is, however, assumed to be 100% debt at 5.5% annual return, and the public utility pays neither income tax nor property tax.
111-3-3. Calculating Levelized Cost of Energy (COE)
The technique to be used for calculating levelized COE varies with ownership perspective. Two of the four ownership perspectives (IOU and Muni) employ a cost- based revenue requirements approach, while the other two use a market-based rate of return approach. The revenue requirements approach assumes a utility has a franchised service territory and, its rate of return is set by the state regulatory agency. The plant's annual expenses and cash charges are added to the allowed rate of return on the capital investment to determine revenues.
By contrast, the market-based approach (GenCo and IPP) either estimates a stream of project revenues from projections about electricity sales prices or proposes a stream as part of a competitive bid. Annual project expenses, including financing costs, are calculated and subtracted from revenues and an IRR is then calculated. The process of calculating the achieved IRR differs from the revenue requirements approach where the rate of return is pre-determined.
COEs can be calculated for both revenue requirements and rate of return approaches. When pro forma cash flows in dollars of the day are projected for both approach, the effects of general inflation are captured in debt repayment, income taxes, and other factors. Next, revenues are net present valued in current dollars. The NPV is then levelized to current dollars and/or constant dollars using appropriate discount rates for each. These are then levelized and normalized to one unit of energy production (kWh) to calculate current and constant dollar COEs. This document cites levelized constant dollar COEs in 1997 dollars.
Table 111-3-6 provides an example of the results that may be obtained for the technologies characterized in this document. The table shows levelized COE for the various renewable energy technologies assuming GenCo ownership and balance sheet finance.
25

111-3-4. Financial Model and Results
The FATE2-P (Financial Analysis Tool for Electric Energy Projects) financial analysis model was used to analyze the data provided in the Technology Characterizations. This spreadsheet model was developed by Princeton Economic Research, Inc. and the National Renewable Energy Laboratory for the U.S. Department of Energy. FATE2-P can be used for either the revenue requirements or the discounted rate of return approach. It is used by the DOE renewable energy R&D programs for its planning activities. The model is publicly available, and has been used by a number of nonDOE analysts in recent studies. Other models will produce the same results given the same inputs.
The COEs in Table 111-3-1 were prepared using the FATE2-P model, assuming GenCo ownership. The results reflect a capital structure of 35% debt with a 7.5% return (with no debt service reserve or letter of credit required) and 65% equity at 13%. A 40% tax rate is assumed. Inflation was estimated at 3%, but electricity sales revenues were assumed to increase at inflation less one half percent, or 2.5%, corresponding to a real rate of -0.5%. In similar fashion, the Department of Energy's Annual Energy Outlook 1997 forecasts that retail electricity prices will decline by 0.6% real, assuming inflation of 3.1%. Anecdotal information from IPPs suggests that they also presently escalate their wholesale power prices at less than inflation.
26

By comparison, Table 111-3-7 shows COEs for year 2000 biomass gasification, to show how the financial requirements of the different ownership perspectives affect COE. The GenCo case is interesting to examine because it represents an evolving power plant ownership paradigm. The municipal utility (Muni) case is of interest because the lower cost of capital for Munis, combined with their tax-exempt status, makes them attractive early market opportunities for renewable energy systems.
Table 111-3-7. Costs of Energy for Various Ownership Cases for Biomass Gasification in Year 2000
Levelized Costs of Energy
Financial Structure I(constant 1997 cents/kWh) GenCo I 6.65 IPP I 7.33 IOU I 6.39 MUNI I 5.09
As discussed, calculating a levelized COE in the GenCo and IPP cases requires an iterative process. In this process, the goal is to identify the stream of revenues that is needed to ensure the project some minimally acceptable rate of return. This revenue stream is found by adjusting the assumption about first year energy payment (often termed the bid price) until the resulting total project revenues produce the required rate of return subject to meeting debt coverage requirements and minimizing phantom income for IPPs, and to meeting minimum equity returns for GenCos. In the analyses discussed here, the energy sales revenues are assumed to increase through the entire project life only at the rate of inflation minus one half percent (2.5%).
A few common assumptions underlie all the ownership/financing types. First, COE results are expressed in levelized constant 1997 dollars, consistent with the cost data in each TC, that are also stated in 1997 dollars. Second, general inflation is estimated at 3% per year, so annual expenses like operations and maintenance (O&M) and insurance escalate at 3% per year despite the fact that IPP and GenCo revenues increase at only 2.5%. Inflation also affects the values chosen for interest rates and equity returns. Tax calculations reflect an assumed 40% combined corporate rate (i.e., federal at 35% and state at 7.7%, with state deductible from federal). In addition, depreciation periods and rates are those set by current law. Tax credits were used if set by law as permanent as of November 1997. Thus, the 10% Investment Tax Credit for solar and geothermal is included, but not the production tax credits for wind or closed loop biomass that are not available after mid- 1999.
27
IV. Renewable Energy Resources, Technologies and Economics In-and-Near the UIR
IV-1. Biomass Resources
Biomass, equated with plant matter, is a renewable natural resource produced in a mired of forms all over the earth by the process of photosynthesis. Biomass has many diverse uses, perhaps foremost is as a source of food for many different living species and as a source of oxygen for aerobes. Biomass may also be used as a raw material from which to make refined products with added value, including power, liquid fuels, and chemicals. Before technology became available to perform the conversation of the raw biomass into these refined, higher value products, biomass was largely used as a fuel for combustion Central to determining the potential for energy production from biomass is an understanding of the location, quantities, types, and prices of biomass resources and the state of technology for its conversion into energy. The U.S. Department of Energy has a goal of increasing the use of biomass in supply the U.S. energy needs as expressed in Executive Order 13134 of August 12, 1999 is also available.
IV-1-1. Resource Availability
Biomass feedstocks are classified into five general categories: forest residues, mill residues, agricultural residues, urban wood wastes, and dedicated energy crops. Forestry is a major industry in the United States encompassing nearly 559 million acres in publicly and privately held forest lands in the continental U.S. (USDA, 1997). Nearly 16 million cubic feet of roundwood are harvested and processed annually to produce sawlogs, paper, veneers, composites and other fiber products (USDA, 1998a). The extensive forest acreage and roundwood harvest generate logging residues and provide the potential to harvest nonmerchantable wood for energy. Processing of the wood into fiber products creates substantial quantities of mill residues that could potentially be used for energy. Agriculture is another major industry in the United States. Approximately 337 million acres of cropland are currently in agricultural production (USDA, 1997). Following the harvest of many of the traditional agricultural crops, residues (crop stalks) are left in the field. A portion of these residues could potentially be collected and used for energy. Alternatively, crop acres could be used to grow dedicated energy crops. A final category of biomass feedstocks includes urban wood wastes. These wastes include yard trimmings and other wood materials that are generally disposed of in municipal solid waste (MSW) and construction/demolition (C/D) landfills. Following is a description of the potential availability of these biomass feedstocks in Oregon and in-and-near the UIR.
IV-1-1-1. Forest Residues
Forest wood residues can be grouped into the following categories- logging residues, rough, rotten, and salvable dead wood, excess saplings, and small pole treesm. Table IV- 1 shows the forest wood residue supplies that could potentially be available for energy use in Oregon. They have been estimated by Walsh et al. using an updated version of a model originally developed by McQuillan et al. (1984). The McQuillan model estimates
28

the total quantities of forest wood residues that can be recovered by first classifying the total forest inventory by the above wood categories (for both softwood and hardwood), and by volume, haul distances, and equipment operability constraints. This total inventory is then revised downward to reflect the quantities that can be recovered in each class due to constraints on equipment, retrieval efficiencies, road access to a site, and impact of site slope on harvest equipment choic&.
The costs of obtaining the recoverable forest wood residues include collection, harvesting, chipping, loading, hauling, and unloading costs, a stumpage fee, and a return for profit and risk. Prices are in 1995 dollars. The table includes only logging residues and rough, rotten, and salvable dead wood quantities. The potential annual forest waste residues available in the state of Oregon for three price scenarios are presented in Table IV- 1. Quantities are cumulative quantities at each price (i.e., quantities at $50/dt include all quantities available at $40/dt plus quantities available between $40 and $50/dt).
Polewood, which represent the growing stock of merchantable trees, has not been included in the analysis due to the fact that it could potentially be left to grow and used for higher value fiber products. It is doubtful that these trees will be harvested for energy use due to this value use competition.
Table IV-1. Estimated Annual Cumulative Quantities (dry tons) by Type and Delivered Price in Oregon
< $20/dt < $30/dt < $40/dt < $50/dt delivered delivered delivered delivered
Forest Residues - 1299000 1928000 2515900 Mill Residues 10000 1738000 - 6834000 Ag Residues 0 155855 155855 Dedicated 0 0 0 Energy Crop Urban Wood 182532 304220 304220 304220 Waste
A recent study by the Oregon Department of Energy (ORDOE, 2003) has provided costs for collecting and processing forest biomass from thinning projects and timber harvesting residues. The costs include felling, processing (chipping and grinding), primary transportation (from felling to roadside landing site) and secondary transportation (from roadside landing site to mill/plant/terminal). The average roadside chip cost was estimated to be $38.26 per green ton (GT), with the chipping cost contribution for ponderosa pine amounting to $6.39/GT. Secondary transportation costs are estimated to $5.50/GT plus $O.OSS/mi. Further cost estimates details can be secured from Lynch, (2002 and Klepac, (2002)
29

IV- 1-1-2. Primary Forest Mill Residues
The quantities of mill residues generated at primary wood mills (Le., mills producing lumber, pulp, veneers, other composite wood fiber materials) in Oregon are shown in Table IV-1 from the data compiled by the USDA Forest Service for the 1997 Resource Policy Act (RPA) Assessment (USDA, 1998a). Mill residues are classified by type and include bark; coarse residues (chunks and slabs); and fine residues (shavings and sawdust). Data is available for quantities of residues generated by residue type and on uses of residues by residue type and use category (i.e., not used, fuel, pulp, composite wood materials, etc.). The compiled USDA data (USDA, 1998a) is available at the county, state, sub region, and regional level. In cases where a county has fewer than three mills, data from multiple counties are combined to maintain the confidentiality of the data provided by individual mills. Data represent short run average quantities.
Because primary mill residues are clean, concentrated at one source, and relatively homogeneous, nearly 98 percent of all residues generated in the United States are currently used as fuel or to produce other fiber products. Of the 24.2 million dry tons of bark produced in the U.S., 2.2 percent is not used while 79.4 percent is used for fuel and 18 percent is used for such things as mulch, bedding, and charcoal. Only about 1.4 percent of the 38.7 million dry tons of coarse residues are not used. The remaining materials are used to produce pulp or composite wood products such as particle board, wafer board, and oriented strand board (78 percent) and about 13 percent are used for fuel. Of the 27.5 million dry tons of fine wood residues, approximately 55.6 percent are used for fuel, 23 percent are used to produce pulp or composite wood products, 18.7 percent are used for bedding, mulch and other such uses, and about 2.6 percent are unused.
The residues, while currently used, could potentially be available for energy use if utilities could pay a higher price for the residues than their value in their current uses. Data regarding the value of these residues in their current uses are difficult to obtain. Much of the residues used for fuel are used on site by the residue generator in low efficiency boiler systems to produce heat and steam. Anecdotal evidence suggests that these residues could be purchased for $15-25/dry ton for use in higher efficiency fuel systems. Similar anecdotal evidence suggests that residues used to produce fiber products (pulp, composite wood materials) sell for about $30-40/dry ton. The data in Table IV-1, obtained form Walsh et al. assume that the residues not currently used could potentially be available for energy uses at delivered prices of less than $2O/dry ton (assuming transportation distances of less than 50 miles). For similar transportation distances, we assume that residues currently used for fuel could be available at less than $3O/dry ton delivered and residues currently used for pulp, composite wood materials, mulch, bedding, and other such uses could potentially be available at delivered prices of less than $5O/dry ton.
A recent study by the Oregon Department of Energy (ORDOE,2003) for Umatilla, Union and Wallowa counties characterizes wood products industry residue supply as being currently fully utilized. The wood products supply in the region is really limited to chips
30
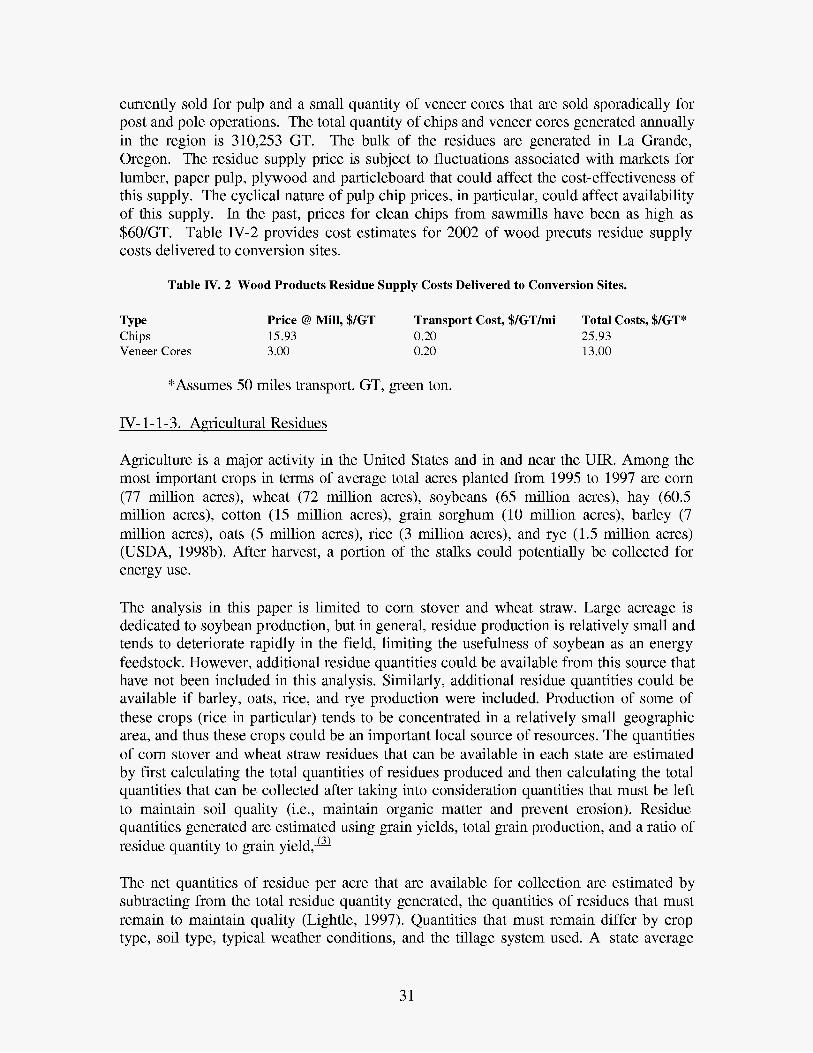
currently sold for pulp and a small quantity of veneer cores that are sold sporadically for post and pole operations. The total quantity of chips and veneer cores generated annually in the region is 310,253 GT. The bulk of the residues are generated in La Grande, Oregon. The residue supply price is subject to fluctuations associated with markets for lumber, paper pulp, plywood and particleboard that could affect the cost-effectiveness of this supply. The cyclical nature of pulp chip prices, in particular, could affect availability of this supply. In the past, prices for clean chips from sawmills have been as high as $60/GT. Table IV-2 provides cost estimates for 2002 of wood precuts residue supply costs delivered to conversion sites.
Table IV. 2 Wood Products Residue Supply Costs Delivered to Conversion Sites.
Type Price @ Mill, $/GT Transport Cost, $/GT/mi Total CostS, $/GT*
Veneer Cores 3.00 0.20 25.93 13.00
Chips 15.93 0.20
"Assumes 50 miles transport. GT, green ton.
IV- 1 - 1 - 3. Agricultural Residues
Agriculture is a major activity in the United States and in and near the UIR. Among the most important crops in terms of average total acres planted from 1995 to 1997 are corn (77 million acres), wheat (72 million acres), soybeans (65 million acres), hay (60.5 million acres), cotton (15 million acres), grain sorghum (10 million acres), barley (7 million acres), oats (5 million acres), rice (3 million acres), and rye (1.5 million acres) (USDA, 1998b). After harvest, a portion of the stalks could potentially be collected for energy use.
The analysis in this paper is limited to corn stover and wheat straw. Large acreage is dedicated to soybean production, but in general, residue production is relatively small and tends to deteriorate rapidly in the field, limiting the usefulness of soybean as an energy feedstock. However, additional residue quantities could be available from this source that have not been included in this analysis. Similarly, additional residue quantities could be available if barley, oats, rice, and rye production were included. Production of some of these crops (rice in particular) tends to be concentrated in a relatively small geographic area, and thus these crops could be an important local source of resources. The quantities of corn stover and wheat straw residues that can be available in each state are estimated by first calculating the total quantities of residues produced and then calculating the total quantities that can be collected after taking into consideration quantities that must be left to maintain soil quality (Le., maintain organic matter and prevent erosion). Residue quantities generated are estimated using grain yields, total grain production, and a ratio of residue quantity to grain yield,a
The net quantities of residue per acre that are available for collection are estimated by subtracting from the total residue quantity generated, the quantities of residues that must remain to maintain quality (Lightle, 1997). Quantities that must remain differ by crop type, soil type, typical weather conditions, and the tillage system used. A state average
31

was used for this analysis. In general, about 30 to 40 percent of the residues can be collected. The estimated prices of corn stover and wheat straw include the cost of collecting the residues, the premium paid to farmers to encourage participation, and transportation costs.
The cost of collecting the agricultural residues are estimated using an engineering approach. For each harvest operation, an equipment complement is defined. Using typical engineering specifications, the time per acre required to complete each operation and the cost per hour of using each piece of equipment is calculated (ASAE, 1995; NADA, 1995; USDA, 1996; Doanes, 1995). For corn stover, the analysis assumes l x mow, l x rake, l x bale with a large round baler, and pickup, transport, and unloading of the bales at the side of the field where they are stored until transport to the user facility. The same operations are assumed for wheat straw minus the mowing. The operations assumed are conservative--mowing is often eliminated and the raking operation is also eliminated in some circumstances. The method used to estimate collection costs is consistent with that used by USDA to estimate the costs of producing agricultural crops (USDA, 1996).
An additional cost of $2O/dry ton is added to account for the premium paid to farmers and the transportation cost from the site of production to the user facility. Currently, several companies purchase corn stover and/or wheat straw to produce bedding, insulating materials, particle board, paper, and chemicals (Gogerty, 1996). These firms typically pay $10 to $15/dry ton to farmers to compensate for any lost nutrient or environmental benefits that result from harvesting residues. The premium paid to farmers depends, in part, on transportation distance with farmers whose fields are at greater distances from the user facility receiving lower premiums. Studies have estimated that the cost of transporting giant round bales of switchgrass are $5 to $10 per dry ton for haul distances of less than 50 miles (Bhat et al, 1992; Graham et al, 1996; Noon et al, 1996). Agricultural residue bales are of similar size, weight, and density as switchgrass bales, and a similar transportation cost is assumed. This cost is similar to the reported transportation costs of facilities that utilize agricultural residues (Schechinger, 1997). Prices are in 1995 dollars. For a more detailed explanation of the methodology used to estimate agricultural residue quantities and prices, see Walsh et al, 1998.
A recent study by tk Oregon Department of Energy (ORDOE,2003) has provided cost and supply estimates for agriculture residues in Northeastern Oregon. The information is presented in field-dry tons, noting that field-dry residues may contain 10-20% moisture. Table IV-3 summarizes these cost estimates. The collection cost is based on swathing costs ($6/fd ton), baling costs ($14-15/f-d ton) and stacking costs ($5-7/f-d ton). While storage costs are not contained in the estimates for rice straw they have been estimated to be from zero for uncovered filed storage to $7-25/d-f ton for covered and storage barn. The transport costs are based on a fixed cost of $5.50/f-d ton plus $O.OSS/mi.
32

Table IV-3. Agriculture Residue Cost Estimates*
County Total Collection Cost, Total Transport Cost, Total Cost, $If-d ton
Union 27.18 6.30 33.48 Baker 26.00 6.38 32.38 Wallowa 26.00 6.20 32.20
$If-d ton $If-d ton
"Assumes 8- 12 miles transport. f-d, field dry.
IV- 1 - 1-4. Dedicated Energy Crops
Dedicated energy crops include s h r t rotation woody crops (SRWC) such as hybrid poplar and hybrid willow, and herbaceous crops such as switchgrass (SG). Currently, dedicated energy crops are not produced in the United States, but could be if they could be sold at a price that ensures the producer a profit at least as high as could be earned using the land for alternative uses such as producing traditional agricultural crops. Walsch et al. have used the POLYSYS model to estimate the quantities of energy crops that could potentially be produced at various energy crop prices. POLYSYS is an agricultural sector model that includes all major agricultural crops (wheat, corn, soybeans, cotton, rice, grain sorghum, barley, oats, alfalfa, other hay crops); a livestock sector; and food, feed, industrial, and export demand functions. POLYSYS was developed and is maintained by the Agricultural Policy Analysis Center at the University of Tennessee and is used by the USDA Economic Research Service to conduct economic and policy analysis. Under a joint project between USDA and DOE, POLYSYS is being modified to include dedicated energy crops. A workshop consisting of USDA and DOE experts was held in November, 1997 to review the energy crop data being incorporated into the POLYSYS model.
The analysis includes cropland acres that are presently planted to traditional crops, idled, in pasture, or are in the Conservation Reserve Program. Energy crop production is limited to areas climatically suited for their productiowstates in the Rocky Mountain region and the Western Plains region are excluded. Because the CRP is an environmental program, two management scenarios have been evaluated--one to optimize for biomass yield and one to provide for high wildlife diversity.
Energy crop yields vary within and between states, and are based on field trial data and expert opinion. Energy crop production costs are estimated using the same approach that is used by USDA to estimate the cost of producing conventional crops (USDA, 1996). Recommended management practices (planting density, fertilizer and chemical applications, rotation lengths) are assumed. Additionally, switchgrass stands are assumed to remain in production for 10 years before replanting, are harvested annually, and are delivered as large round bales. Hybrid poplars are planted at a 8 x 10 foot spacing (545 treedacre) and are harvested in the 10th year of production in the northern U.S., after 8 years of production in the southern U.S., and after 6 years of production in the Pacific Northwest. Poplar harvest is by custom operation and the product is delivered as whole tree wood chips. Hybrid willow varieties are suitable for production in the northern U.S. The analysis assumes 6200 treedacre, with first harvest in year 4 and subsequent harvests
33

every three years for a total of 7 harvests before replanting is necessary. Willow is delivered as whole tree chips.
The estimated quantities of energy crops are those that could potentially be produced at a profit at least as great as could be earned producing traditional crops on the same acres, given the assumed energy crop yield and production costs, and the 1999 USDA baseline production costs, yields, and traditional crop prices (USDA, 1999b). In the U.S., switchgrass production dominates hybrid poplar and willow production at the equivalent (on an MBTU basis) market prices. The POLYSYS model estimates the farmgate price; an average transportation cost of $8/dt is added to determine the delivered price. Prices are in $1997. For a more detailed explanation of the methodology used to estimate dedicated energy crop prices and quantities, see Walsh et al, 1998 and de la Torre Ugarte et al, 1999.
IV-1-1-5. Urban Wood Wastes
Urban wood wastes include yard trimmings, site clearing wastes, pallets, wood packaging, and other miscellaneous commercial and household wood wastes that are generally disposed of at municipal solid waste (MSW) landfills and demolition and construction wastes that are generally disposed of in construction/demolition (C/D) landfills. Data regarding quantities of these wood wastes is difficult to find and price information is even rarer. Additionally, definitions differ by states. Some states collect data on total wastes deposited at each MSW and C/D landfill in their states, and in some states, the quantities are further categorized by type (Le., wood, paper and cardboard, plastics, etc.). However, not all states collect this data. Therefore, the quantities presented are crude estimates based on survey data (Glenn, 1998; Bush et al, 1997; Araman et al, 1997).
For municipal solid wastes (MSW) a survey by Glenn, 1998 is used to estimate total MSW generated by state. These quantities are adjusted slightly to correspond to regional MSW quantities that are land-filled as estimated by a survey conducted by Araman et al, 1997. Using the Araman survey, the total amount of wood contained in land-filled MSW is estimated. According to this survey, about 6 percent of municipal solid waste in the Midwest is wood, with 8 percent of the MSW being wood in the South, 6.6 percent being wood in the Northeast and 7.3 percent being wood in the West. Estimated quantities were in wet tons; they were corrected to dry tons by assuming 15 percent moisture content by weight.
To estimate construction and demolition wastes (C/D), t k Glenn study and the Bush et al, 1997 survey were used. The Glenn study provided the number of C/D landfills by state, and the Bush et al survey provided the average quantity of waste received per C/D landfill by region as well as the regional percent of the waste that was wood. According to the Bush et a1 survey, C/D landfills in the Midwest receive an average 25,700 tons of waste per year with 46 percent of that quantity being wood. In the South, C/D landfills receive an average 36,500 tons of waste/yr with 39 percent being wood. Northeastern C/D landfills receive an average 13,700 tons of waste/yr with 21 percent being wood and Western C/D landfills receive an average 28,800 tons of waste/yr with 18 percent being
34
wood. Estimated quantities were in wet tons; they were corrected to dry tons by assuming 15 percent moisture content by weight.
Yard trimmings taken directly to a compost facility rather than land-filled, were estimated from the Glenn study. This estimate was made by multiplying the number of compost facilities in each state by the national average tons of material received by site (2750 tons). The total compost material was then corrected for the percent that is yard trimmings (assumed to be 80 percent) and for the quantity that is wood (assumed to be 90 percent). Quantities were corrected to dry tons by assuming 40 percent moisture by weight.
In an effort to reduce the quantities of waste materials that are land-filled, most states actively encourage the recycling of wastes. Quantities and prices of recycled wood wastes are not readily available. However, the Araman and Bush surveys report limited data on the recycling of wood wastes at MSW and C/D sites. They report that in the South, approximately 36 percent of C/D landfills and 50 percent of MSW landfills operate a wood/yard waste recycling facility and that about 34 percent of the wood at C/D landfills and 39 percent of the wood at MSW landfills is recycled. In the Midwest, about 31 percent of the MSW and 25 percent of the C/D landfills operate wood recycling facilities with 16 percent of the MSW wood and 1 percent of the C/D wood is recycled. In the West, 27 percent of the MSW and C/D landfills operate wood recycling facilities and recycle 25 percent each of their wood. In the Northeast, 39 percent of the MSW and 28 percent of the C/D landfills operate wood recycling facilities and recycle 39 percent of the MSW wood and 28 percent of the C/D wastes.
The surveys do not report the use of total recycled wood, but do report the uses of recycled pallets which represent about 7 percent of the total wood and 4 percent of the recycled wood at C/D landfills and about 24 percent of the total wood and about 13 percent of the recycled wood at MSW landfills. At C/D landfills, about 14 percent of the recycled pallets are re-used as pallets, about 39 percent are used as fuel, and the remainder is used for other purposes such as mulch and composting. About 69 percent of the recyclers reported that they gave away the pallet material. Of those selling the material, the mean sale price was $ll.Ol/ton and the median sale price was $10.50/ton. At MSW landfills, about 3 percent of the recycled pallets are re-used as pallets, about 41 percent are used as fuel, and the remainder is used for other purposes such as mulchand composting. About 58 percent of the C/D recyclers reported that they gave away the pallet material. Of those selling the material, the mean sale price was $13.17/ton and the median sale price was $10.67/ton. Transportation costs must still be added to the sale price. Given the lack of information regarding prices, we assumed that of the total quantity available, 60 percent could be available at less than $20/dry ton and that the remaining quantities could be available at less than $3O/dry ton. Table 5 presents the estimated annual cumulative quantities of urban wood wastes for the state of Oregon.
35

IV-1-2. Summary
Table IV-1 summarizes estimates by Walsch et al. on the total annual cumulative quantities of biomass resources available in the state of Oregon at a specific delivered price. It is estimated that substantial quantities of biomass (10 million dry tons) could be available annually at prices of less that $50/dt delivered. However, several caveats should be noted. There is a great deal of uncertainty surrounding some of the estimates. For example, while there is substantial confidence in the estimated quantities of mill residues available by state, there is a great deal of uncertainty about the estimated prices of these residues. The value of these feedstocks in their current uses is speculative and based solely on anecdotal discussions. Given that the feedstock is already being used--much of it under contract or in-house by the generator of the waste--energy facilities may need to pay a higher price than assumed to obtain the feedstock. Additionally, both the quantity and price of urban wastes are highly speculative. The analysis is based solely on one national study and regional averages taken from two additional surveys. There is no indication of the quality of the material present (i.e., whether the wood is contaminated with chemicals, etc.). Because of the ways in which the surveys were conducted, there may be double counting of some quantities (Le., MSW may contain yard trimmings and C/D wastes as well).
Additionally, the analysis assumes that the majority of this urban wood is available for a minimal fee, with much of the cost resulting from transportation. Other industries have discovered that once a market is established, these "waste materials" become more valuable and are no longer available at minimal price. This situation could also happen with urban wastes used for energy if a steady customer becomes available. It should also be noted however, that some studies indicate that greater quantities of urban wastes are available, and are available at lower prices, than are assumed in this analysis (Wiltsee, 1998). Given the high level of uncertainty surrounding the quantity and price estimates of urban wastes and mill residues, and the fact that these wastes are estimated to be the least cost feedstocks available, they should be viewed with caution until a more detailed analysis is completed.
The estimates by Walsch et al. has assumed that substantial quantities of dead forest wood could be harvested. The harvest of deadwood is a particularly dangerous activity and not one relished by most foresters. Additionally, large polewood trees represent the growing stock of trees, that if left for sufficient time, could be harvested for higher value uses. These opportunity costs have not been considered. And, the sustainability of removing these forest resources has not been thoroughly analyzed.
The price of agricultural residues are high largely because of the small quantities that can be sustained and removed on a per acre basis. Improvements in the collectionhransport technologies and the ability to sustain larger quantities (due to a shift in no-till site preparation practices for example) could increase quantities and decrease prices over time. Also, the inclusion of some of the minor grain crops (i.e., barley, oats, rye, rice) and soybeans could increase the total quantities of agricultural residues available by state.
36
However, further elucidation of quantities that can sustainably be removed might lower available quantities.
Dedicated energy crops (Le., switchgrass and short rotation wood crops) are not currently produced--the estimates by Walsch et al. are based on estimates of yield, production costs, and profitability of alternative crops that auld be produced on the same land. Improving yields and decreasing production costs through improved harvest and transport technologies could increase available quantities at lower costs.
The estimates have assumed a transportation cost of $8/dry ton for m s t feedstocks. This cost is based on a typical cost of transporting materials (i.e., switchgrass bales and wood chips) for less than 50 miles (Graham et al, 1996; Bhat et al, 1992; Noon et al, 1996). Finally, the analysis is conducted at a state level and the distribution of biomass resources within the state is not specifically considered. We have simply assumed that the feedstock is available within 50 miles of a user facility. This may not be the case which would result either in the cost of the feedstock being higher to a user facility due to increased transportation costs, or the quantities of available feedstock being lower to a user facility if the material is simply too far away from the end-user site to be practical to obtain. Biomass resource assessments are needed at a lower aggregation level than the state.
IV-1-3. References
1.
2.
3.
4.
5.
6.
7. 8.
9.
10.
11.
American Society of Agricultural Engineers, Standards 1995Standards, Engineering Practices, and Data, 1995. P.A. Araman, R.J. Bush, and V.S. Reddy, Municipal Solid Waste Landfills and Wood Pallets--What’s Happening in the U.S., Pallet Enterprise, March 1997, pp. 50-56. M.B. Bhat, B.C. English, and M. Ojo, Regional Costs of Transporting Biomass Feedstocks, Liquid Fuels From Renewable Resources, John S. Cundiff (ed.), American Society of Agricultural Engineers, St. Joseph, MI, December 1992. R.J. Bush, V.S. Reddy, and P.A. Araman, Construction and Demolition Landfills and Wood Pallets-- What’s Happening in the U.S., Pallet Enterprise, March 1997, pp. 27-31. D.G. de la Torre Ugarte, S.P. Slinsky, and D.E. Ray, The Economic Impacts of Biomass Crop Production on the U.S. Agriculture Sector, University of Tennessee Agricultural Policy Analysis Center, Knoxville, TN, July 1999, Draft Document. Doane’s Agricultural Report, Estimated Machinery Operating Costs, 1995, Vol. 58, No. 15-5, April 14, 1995. J. Glenn, The State of Garbage, BioCycle, April 1998, pp. 3243. R. Gogerty, Crop Leftovers: More Uses, More Value, Resource: Engineering and Technology fo r a Sustainable World, VoL 3, No. 7, July 1996. R.L. Graham, W. Liu, H.I. Jager, B.C. English, C.E. Noon, and M.J. Daly, A Regional-Scale GIS- Based Modeling System for Evaluating the Potential Costs and Supplies of Biomass From Biomass Crops, in Proceedings of Bioenergy ‘96 - The Seventh National Bioenergy Conference, Nashville, TN, September 15-20, 1996, southeastern Regional Biomass Energy Program, pp. 444-450, 1996. W.G. Heid, Jr., Turning Great Plains Crop Residues and Other Products into Energy, U.S. Department of Agriculture, Economic Research Service, Agricultural Economic Report No. 523, Washington, DC, November 1984. D.T. Lightle, A Soil Conditioning Index fo r Cropland Management Systems (Draft), U.S. Department of Aericulture. Natural Resources Conservation Service. National Soil Survev Center. Ami1 1997.
37

12. A. McQuillan, K. Skog, T. Nagle, and R. Loveless, Marginal Cost Supply Curves for Utilizing Forest Waste Wood in the United States, Unpublished Manuscript, University of Montana, Missoula, February 1984.
13. NEOS Corporation, Non-synthetic Cellulosic Textile Feedstock Resource Assessment, Southeastern Regional Biomass Energy Program, Muscle Shoals, AL, July 1998.
14. C.E. Noon, M.J. Daly, R.L. Graham, and F.B. Zahn, Transportation and Site Location Analysis for Regional Integrated Biomass Assessment (RIBA), in Proceedings of Bioenergy ‘96 - The Seventh National Bioenergy Conference, Nashville, TN, September 15 -20, 1996, Southeastern Regional Biomass Energy Program, pp. 487-493, 1996.
15. North American Dealers Association, OfSicial Guide--Tractors and Farm Equipment, 1995. 16. T. Schechinger, Great Lakes Chemical Corporation, personal communication, 1997. 17. U.S. Department of Agricultural, National Agricultural Statistics Service, World Agricultural Outlook
Board, USDA Agricultural Baseline Projections to 2009, WAOB-99- 1, Washington, DC, February 1999.
18. U.S. Department of Agriculture, Forest Service, Forest Inventory and Analysis Timber Product Output Database Retrieval System, (http://srsfia.usfs.msstate.edu/rpa/tpo), 1998a.
19. U.S. Department of Agriculture, National Agricultural Statistical Service, Crop Production Summary, Washington, DC, January 1998b.
20. U.S. Department of Agriculture, Economic Research Service, Agricultural Resources and Environmental Indicators, 1996-1997, Agricultural Handbook No. 7 12, Washington, DC, July 1997.
21. U.S. Department of Agriculture, Economic Research Service, Economic Indicators of the Farm Sector: Costs of Production--Major Field Crops, 1995, Washington, DC, 1996.
22. M.E. Walsh, R.L. Perlack, D.A. Becker, A. Turhollow, and R.L. Graham, Evolution of the Fuel Ethanol Industry: Feedstock Availability and Price, Oak Ridge National Laboratory, Oak Ridge, TN, April 21, 1998, Draft Document.
Valencia, CA, 1998.
Restoration Projects in Colorado, Fort Collins, Colorado: Department of Forest Sciences, Colorado State University, 2002.
Chicago, Illinois: ASAE International Meeting July 28-31, 2002, Paper No.1 025007.
23. G. Wiltsee, Urban Wood Waste Resources in 30 US Metropolitan Areas, Appel Consultants, Inc.,
24. Lynch, D.L. and K. H. Mackes, “Evaluating Costs Associated with Fuel Hazard Reduction and Forest
25. Klepac, J.G. and R.B. Rummer, Smallwood Logging Production and Costs: Mechanized vs. Manual,
38

IV-2-1. Background
Biomass is a form of the sun's energy. Biomass is one of the oldest harnessed forms of energy by mankind. For the most part and still to a large extent today, the utilization of this source of energy depends upon burning the biomass and utilizing the heat released in the combustion process. This heat can be used as is or converted into electricity or mechanical energy.
Recognizing that biomass is a solid as is the pellet fuels made from it, one must ask why the bother with making pellets. Convenience and practicality stand- out as the principal reasons for pellets although one can make some arguments that there is value added to the biomass through tailoring the composition and physical properties of the pellet. Some forms of biomass (e.g., large trees, brier bushes, tree bark, grass, and fine sawdust) are difficult to transport and handle as well as feed to a combustion device. The shape, size as well as physical and chemical properties of the pellet may also be controlled and/or alter in the process of pellet manufacture such that it adds value to the product, enhancing its burning and handling characteristics.
A brief history of the pellet fuel industry in North America is as follows:
In the 1970s the first pellet plant in North America was built in Brownsville, Oregon, to supply wood pellet fuel for commercial and industrial purposes. In 1983 the first residential wood pellet stoves were sold in North America. In the 1990's Sweden began producing and using wood pellets for fuel. By 1993-94, 350,000 pellet stoves are being used. By 1996 there are more than 20 pellet stove manufacturers and 80 pellet mills manufacturing high quality fuel. Approximately one million tons of wood pellets are heating residential homes throughout North America. Internationally- Sweden's annual consumption of pellet fuel surpasses that of the United States. 1997 - Nearly 500,000 pellet stoves are heating homes throughout North America.
Pellet fuels from biomass are a renewable sources of energy as is wood, hydroelectric power, and solar. The non-renewable sources of energy are the fossil fuels such as oil, coal, natural gas and electricity. For the most part electricity is a non-renewable energy source since over 73% is produced from non-renewable fuels such as coal, oil, gas and nuclear materials. The burning of fossil fuels produces high quantities of carbon dioxide gas that contributes to the "greenhouse effect". While the decay or combustion of
39

"biomass" (primarily trees and other plants) also produces carbon dioxide, it has always been a part of a natural cycle. In that cycle the released carbon dioxide gas is reabsorbed by the growing biomass. In the study "Power Surge: the Status and Near-Term Potential of Renewable Energy Technologies" they found that if biomass (wood burning) is used as a supplement to the fossil fuels, the atmospheric effect is essentially zero. In fact, they claim it may actually result in a slight improvement, a much better situation than if additional fossil fuels are burned.
While woodstoves of the past produced considerable smoke and particulate matter, the new EPA Phase I1 stoves produce almost no smoke. The old conventional woodstoves emitted between 30 and 80 grams of particulate matter (smoke) per hour, while the new certified wood stoves have reduced emissions to between 3 to 6 grams per hour, a reduction of over 90%. The EPA concludes that control of the greenhouse effect could be helped if more homes reduced their use of fossil fuels and relied more on wood and biomass for heat and energy sources.
IV-2-2. Resource Assessment
The biomass resource assessment has undertaken the effort to as accurately as possible, within the limits of resources available under this project, to identify the different types and amounts of biomass that are in and near to the UIR and the availability and suitability of these materials as a feedstock from which to prepare pellet fuel. The different sources of biomass that have been identified include 1) agriculture crops, residues and byproducts, 2) forest, forest byproducts and residues, 3) residential and municipal waste, and 4) other.
IV-2-2- 1. Agriculture crops, residues and byproducts
Table IV-4 shows the estimated quantity of agriculture crop as biomass that can be produced within and near the Umatilla Indian Reservation. The estimate is based on tillable land and agriculture practices used in the area and distinguish between a crop being raised primarily for biomass usage or a crop being produced primarily for another use that has biomass byproduct that could be used as a fuel.
Table IV-4. Estimated Available from Agriculture Crop Residues for Pellet Fuel Manufacture (2002)
Locat ion
UIR UIR UIR UIR UIR Urn. County Urn. County Urn. County Urn. County Urn. County
Tillable Area acres
0 29,974
0 0 0
2,295 264,260
9,402 0
48,577
Primary Crop
corn wheat rape seed mustard perrenial corn wheat barley rape seed
hay
Byproduct Crop
stover straw residue residue residue stover straw straw residue none
Yeild AcNr Total Yield
0 0 2 59,948 2 0 2 0 0 0 5 11,475 2 528,520 2 18,800 2 0 0 0
40
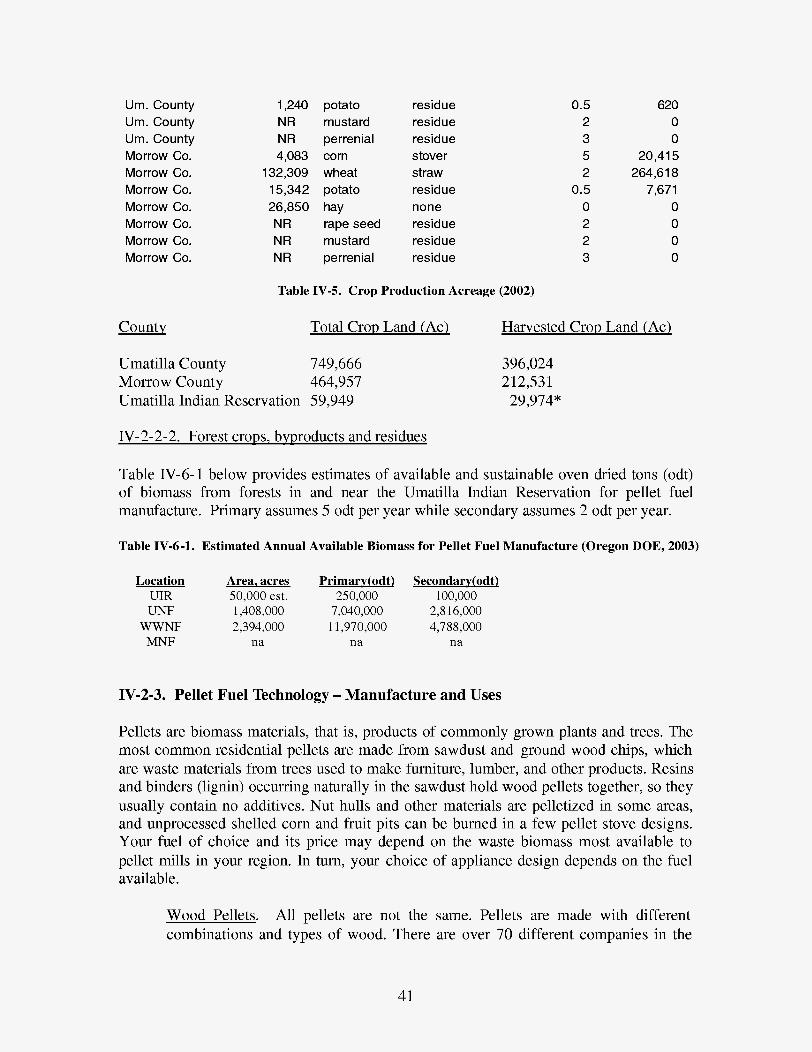
Urn. County Urn. County Urn. County Morrow Co. Morrow Co. Morrow Co. Morrow Co. Morrow Co. Morrow Co. Morrow Co.
County
1,240 NR NR 4,083
132,309 15,342 26,850 NR NR NR
potato mustard perrenial corn wheat potato
rape seed mustard perrenial
hay
residue residue residue stover straw residue none residue residue residue
Table IV-5. Crop Production Acreage (2002)
Total Crop Land (Ac)
Umatilla County 749,666 Morrow County 464,957 Umatilla Indian Reservation 59,949
0.5 2 3 5 2
0.5 0 2 2 3
620 0 0
20,415 264,618
7,671 0 0 0 0
Harvested Crop Land (Ac)
3 96,024 212,531 29,974"
IV-2-2-2. Forest crops, byproducts and residues
Table IV-6- 1 below provides estimates of available and sustainable oven dried tons (odt) of biomass from forests in and near the Umatilla Indian Reservation for pellet fuel manufacture. Primary assumes 5 odt per year while secondary assumes 2 odt per year.
Table IV-6 -1. Estimated Annual Available Biomass for Pellet Fuel Manufacture (Oregon DOE, 2003)
Location UIR UNF
WWNF MNF
Area, acres Primarv(odt) Secondarv(odt) 50,000 est. 250,000 100,000 1,408,000 7,040,000 2,8 16,000 2,394,000 11,970,000 4,788,000
na na na
IV-2-3. Pellet Fuel Technology - Manufacture and Uses
Pellets are biomass materials, that is, products of commonly grown plants and trees. The most common residential pellets are made from sawdust and ground wood chips, which are waste materials from trees used to make furniture, lumber, and other products. Resins and binders (lignin) occurring naturally in the sawdust hold wood pellets together, so they usually contain no additives. Nut hulls and other materials are pelletized in some areas, and unprocessed shelled corn and fruit pits can be burned in a few pellet stove designs. Your fuel of choice and its price may depend on the waste biomass most available to pellet mills in your region. In turn, your choice of appliance design depends on the fuel available.
Wood Pellets. All pellets are not the same. Pellets are made with different combinations and types of wood. There are over 70 different companies in the
41
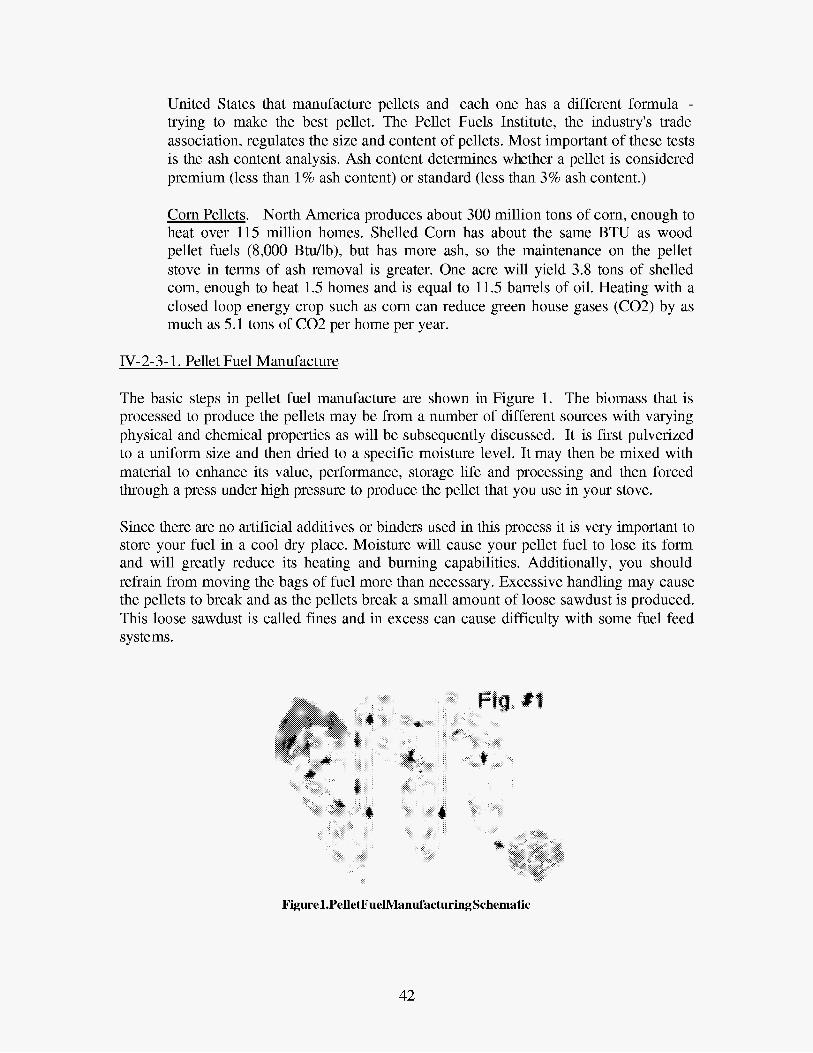
United States that manufacture pellets and each one has a different formula -
trying to make the best pellet. The Pellet Fuels Institute, the industry's trade association, regulates the size and content of pellets. Most important of these tests is the ash content analysis. Ash content determines whether a pellet is considered premium (less than 1% ash content) or standard (less than 3% ash content.)
Corn Pellets. North America produces about 300 million tons of corn, enough to heat over 115 million homes. Shelled Corn has about the same BTU as wood pellet fuels (8,000 Btdlb), but has more ash, so the maintenance on the pellet stove in terms of ash removal is greater. One acre will yield 3.8 tons of shelled corn, enough to heat 1.5 homes and is equal to 11.5 barrels of oil. Heating with a closed loop energy crop such as corn can reduce green house gases (C02) by as much as 5.1 tons of C 0 2 per home per year.
IV-2-3- 1. Pellet Fuel Manufacture
The basic steps in pellet fuel manufacture are shown in Figure 1. The biomass that is processed to produce the pellets may be from a number of different sources with varying physical and chemical properties as will be subsequently discussed. It is first pulverized to a uniform size and then dried to a specific moisture level. It may then be mixed with material to enhance its value, performance, storage life and processing and then forced through a press under high pressure to produce the pellet that you use in your stove.
Since there are no artificial additives or binders used in this process it is very important to store your fuel in a cool dry place. Moisture will cause your pellet fuel to lose its form and will greatly reduce its heating and burning capabilities. Additionally, you should refrain from moving the bags of fuel more than necessary. Excessive handling may cause the pellets to break and as the pellets break a small amount of loose sawdust is produced. This loose sawdust is called fines and in excess can cause difficulty with some fuel feed systems.
Figure1,PelletFuelManufacturing Schematic
42
IV-2-3-2. Fuel Pellet Properties and Specifications
Common Characteristics : Although the chemical constituents and moisture content of different biomass materials vary, the Pellet Fuel Institute (PFI) has identified common characteristics and developed fuel standards. These voluntary industry standards assure as much uniformity in the final product as is possible for naturally grown materials that become processed, but not refined fuel. PFI graded fuel must meet tests for:
Density; consistent hardness and energy content (minimum 40 pounds/ cubic foot) Dimensions; length (1 1/2" maximum) and diameter (1/4"or 5/16") to assure" predictable fuel amounts and to prevent fuel jamming Fines; limited amount of sawdust from pellet breakdown to avoid dust while loading and problems with pellet flow during operation (amount of fines passing through 1/8" screen no more than 0.5% by weight) Chlorides; limited salt content (no more than 300 parts per million) to avoid stove or vent rusting Ash content; important factor in maintenance frequency; premium (less than 1% ash content) or standard (less than 3% ash content)
Standard versus premium grade : All of the measurable characteristics defined by PFI standards are the same for both fuel grades except ash content. Standard grade pellet fuel (up to 3% ash content) is usually derived from materials which result in more residual ash, such as sawdust containing tree bark (which contains more impurities) or agricultural residues like nut hulls. Standard pellets should only be used in stoves designated for their use. Premium grade pellet fuel (less than 1% ash content) is usually produced from hardwood or softwood sawdust containing no tree bark. Ash content varies in premium fuels from about 0.3% in some western softwoods to about 0.7% in eastern hardwoods. Premium pellets, which make up over 95% of current pellet production, can generally be burned in stoves calling for either standard or premium fuel. Increased availability of standard fuel is anticipated as stove designs continue to improve ash tolerance. Ash content determines fuel grade because of its role in maintenance frequency. It is the prime factor that determines maintenance frequency of ash removal from the appliance and venting system. In early pellet stove designs, fuel compatibility was the critical factor that determined whether a stove worked well or not. Fuel grade and specific ash content within a fuel grade are still to be considered, but advances in pellet stove technology are making fuel choice wider and easier. The size of the ash drawer, fuel feed and grate design, proper venting, correct operation and maintenance all play a part in maintenance frequency. The experienced pellet stove professional is the best source of information about stove and fuel compatibility.
Other differences between fuel types and brands : There are a number of variations in pellet fuels that are not included in PFI standards. For example, Btu (heat) content may range from just under 8,000 to almost 9,000 Btu/lb, depending upon species and region of the country. Other characteristics like trace minerals in pellet raw materials vary not only from region to region, but even in close by growing areas. Some trace minerals promote
43

clinkering, the formation of clumps of fused ash that can block air inlets in the burn pot. A fuel's tendency to form clinkers in a stove cannot be predicted by laboratory analysis both because of variations in the raw materials and the different burning conditions that affect the process. Clinkering can increase routine maintenance, but professional recommendations for matching available fuels to stove design can minimize the problem. Pellet mills strive for consistency despite the nature of the raw material. Slight variations in fuel even from bag to bag are inevitable, but the differences are usually insignificant and much smaller than found in the original raw material before processing.
Ash Content Ash content in pellet fuel can be measured by weight and by volume using several methods. The most common measurement is ash content by weight. This is the measurement that the Pellet Fuels Institute uses in determining the ash content of the various pellet fuels currently manufactured. This measurement is the total weight of all non-combustibles in a sample of pellets, expressed as a percentage of weight of the total sample, before it is burned. This is an effective measurement, but it does not allow for variances in ash characteristics (i.e., composition and physical properties) of the different species of wood used in manufacturing pellet fuel.
Some wood species have ash characteristics with light, flake-like shapes. This type of ash, while lighter, will have considerably more volume and will not stay in the burn pot and ash containment system as easily. This fly-ash means larger ash deposits throughout the stove, (heat exchanger, ash traps, blowers, exhaust system, etc.) requiring more frequent cleaning of the burn pot and the entire exhaust system.
Simply stated, if we burn equal amounts of two different species of wood pellet fuel, the fuel with a grainy type of ash could fill a quart jar one-quarter full and the fuel with a fluffy type of ash could fill a quart jar completely full. The two samples could still weigh the same or nearly so, whereas, if samples were measured by weight alone, the weight comparisons might indicate both fuels were low ash content fuels. However, we all know that high ash will have a greater impact on the efficiency of the burn in the burn pot by reducing air flow, and require more extensive maintenance than a pellet with a low volume of ash. Additionally, ash collection on the heat exchanger tubes will dramatically reduce the ability of the heat exchanger to transfer the heat from the bu-ning pellets into useable BTUs to heat your home. This difference in ash content measured by volume instead of weight can account for dramatic differences in pellet quality, even though their comparative Pellet Fuel Institute ratings are similar.
Clinkels This term refers to the formation of lava-like pieces of rock in the burn pot of your pellet stove. Clinkers can look like small or large pieces of lava rock. Clinkers can take the shape of the burn pot and actually form air passageways that cause the clinker to look like a honeycomb- type rock formation.
Minerals and salts are absorbed from the soil through the trees root system. When wood waste from the processing of trees into lumber is turned into pellet fuel, these inert minerals and salts remain entrenched in the wood fiber. When these norrcombustibles are
44

exposed to the high burning temperatures of the pellet burning appliance, they melt and form together. This process is also known as ash fusion.
The temperature at which norrcombustibles liquefy and form together is referred to as the ash fusion temperature. Depending on the type of minerals and salts contained in wood fibers, this temperature can range from 1100 degrees to 2400 degrees Fahrenheit. Recently the industry has observed that several brands of pellet fuel have a salt and mineral composition that enables ash fusion to occur at lower temperatures, causing severe clinkering. High alkali metal content in the pellet lowers the ash fusion temperature. Another side effect of fuels that have higher salt content is the creation of a corrosive atmosphere in the burn chamber, reducing the life expectancy and effectiveness of pellet stoves. If you are dealing strictly with ash fusion, the greatest problem is that you must remove the clinker from the burn pot with a pair of tongs to prevent a reduction in burn efficiency.
Some people relate ash fusion to pellet fuel being "dirty" or containing "dirt." Nothing could be closer, yet further from the truth! Yes, minerals and salts are commonly called dirt, but these are inside the wood fiber itself and no fuel manufacturer is capable of removing silicates (minerals and salts) from inside the wood fibers. This should not be confused with scooping up dirt along with raw materials in the manufacturing process, which if allowed to occur will cause massive clinkering.
Fuel Additives. The use of additives in pellet fuel has drawn attention and criticism. Some manufacturers of pellet fuel use additives in their pellet manufacturing process. Of the many additives used, polyethylene plastic and harsh industrial chemicals are the most common. Polyethylene plastic additives are used by some manufacturers for several reasons. The most important reason plastic additives are used in the pellet manufacturing process is b give additional lubrication to pellet dies. This additional lubrication can improve the production capacity of each pellet mill die by allowing raw material to pass through with less friction and heat. Additionally, polyethylene plastic additives are used to seal the pellet surface and reduce the fines content of the fuel.
Harsh industrial chemical additives are also used by some manufacturers as die lubricants and to reduce fines content by sealing the pellet. An additional reason these additives are used is to control the ash fusion temperature (clinkering) experienced in burning most pellet fuels. The chemical additives raise the ash fusion temperature in an attempt to reduce the amount of clinkering. These chemicals are sometimes used in large industrial facilities to enhance the performance of large steam boilers.
Regarding additives, some manufactures contend that high quality, low dust content pellets can be produced safely in an environmentally friendly manner without the use of polyethylene or ckmical additives. The use of additives will draw negative attention to our industry and destroy the confidence our customers place in our industry to keep products safe, natural and environmentally friendly, especially if we have deceived them and not disclosed the use of additives in our pellet products.
45

Fines Content. Fines are a byproduct of the pellet manufacturing process. Each bag of pellet fuel contains residual wood fibers (commonly called dust, fines or partial pellets). We refer to this as fines content. The standard set by the PFI (Pellet Fuels Institute) for fines content in a premium pellet fuel is less than 1 percent by weight. This means for each 40 pounds of pellets, you should receive no more than 0.4 pounds (6.4 ounces) of fines.
Fines n pellet fuel can occur several ways. Fines are generated in the handling and shipping process. There are two ends to each pellet. The ends of the pellet are the most vulnerable to flaking or breaking up, which will create fines in the bag of pellets. Handling of pellets during the stacking and un-stacking process may create fines due to pellet ends rubbing together and breaking up. Shipping, binding pallets of pellets with straps to the truck or trailer, walking down the load to tarp and un-tarp each load of pellets and the bumping, bouncing and shifting that occur during the transportation of pellet fuel can cause pellets to break up, resulting in greater fines content in a bag of pellets. Additionally, fines can occur from moisture entering the bag.
Excessive fines can be controlled through proper cleaning of pellets before they are packaged. Pellet manufacturers have their own systems for fines removal before the pellets are sealed in bags. Fines content can be minimized by changing the raw material blends in the manufacturing process. Using aged raw material can give the pellets a deeper brown color and a minimal content of fines. Polyethylene plastic additives can be used as a binding agent to reduce fines. However, various governmental agencies and customers object strongly to burning polyethylene plastic and other harsh chemical additives in a stove designed to clean up the air we breathe and improve our environment.
Residential Pellet Fuel Standards (Source PFI, 1995) The Pellet Fuels Institute (PFI) has established national standards for residential pellet fuel. The fuel quality certification is the responsibility of the pellet manufacturer. Two fuel grades have been established, premium and standard. Five fuel characteristics are prescribed in the grades as shown in the table below. The only difference between the two grades is in the inorganic ash content, with the premium grade grade requires less than 3%.
Property 1. Bulk Density/Cubic Ft.
2. Dimensions
3. Fines
4. Inorganic Ash
5. Length
requiring the ash to be less than
Premium Grade
Not less than 40 lbs.
Diameter ?A inch to 5/16 inch
Not more than 0.5% by weight shall pass a 1/8 screen Less than 1%
None longer than 1.5 inches
1% while the standard
Standard Grade
Not less than 40 lbs.
Diameter ?A inch to 5/16 inch Not more than 0.5% by weight shall pass a 1/8 screen Less than 3% None longer than 1.5 inches
Sodium (salt) may cause unacceptable corrosion if present in elevated levels. Natural wood uncontaminated with salt will have less than 300 ppm of water soluble sodium.
46

Certain fuel made from plywood, particleboard, some agriculture residues, some paper and other materials, and wood contaminated with salt may have elevated sodium levels. Producers should identify sodium level in their guaranteed analysis.
It is recommended that PFI member manufacturers label their product as meeting PFI Standard or Premium Grade. They are asked to disclose the type of material (e.g. wood, paper, agricultural residues). It is also recommended that manufacturers include on their bags the membership logo and in a printed block a guaranteed analysis with at least the following parameters:
Fuel Certification and Testing (source: PFI, 1995)
The pellet fuel industry, through its trade association, Pellet Fuels Institute (PFI) has determined that it shall be the individual fuel producer's responsibility to test and certify their product.
It is recommended that the manufacturers conduct both in-plant and independent laboratory tests of pellet fuel on a regular basis. Independent testing labs operate in most parts of the U.S. and Canada. Some laboratories that have experience in testing pellets are listed below.
Testing labs perform standardized tests according to ASTM procedures. Pellet test descriptions are as follows:
Property Bulk Density Dimensions Fines Sodium Inorganic Ash
Method ASTM E-873-82 Sample and measure Pass over a 118 inch screen ASTM E-776 ASTM D- 1 102 (short proximate analysis)
It is recommended that all pellet producers test their fuel regularly by an independent lab for the characteristics covered in the pellet grades. Producers should conduct routine daily in-plant tests for bulk density, fines and pellet dimensions.
TESTING LABS American Interplex Corp. Laboratories 8600 Kanis Road Little Rock, AR 72204
Fax: 50 11224-5072 Fax: 7011258-9724
MVTL Laboratories PO Box 1873 Bismark, ND 58502
Ph: 5011224-5060 Ph: 7011258-9720
PSI (formally Braun Intertech Northwest, Inc.) PO Box 17126 Portland, OR 97217
Fax: 5031289- 19 18 Ph: 5031289- 1778
RADCO 3220 East 596 Street Long Beach, CA 90805
Fax: 5621529-7513 Ph: 5621272-7231
47