uvm comprehensive campus renewable energy feasibility study
DESCRIPTION
How significant a role can campus-based renewable energy play in UVM’s progress towards carbon neutrality? UVM's Clean Energy Fund funded a study to help answer this question and generate scenarios to aid in renewable energy planning at UVM. This study was conducted over the summer of 2012 by CHA (Clough Harbour & Associates), and examined opportunities for solar PV, solar thermal, geothermal, fuel cells, biomass, and wind across UVM's campus. It has the potential to lay the groundwork for future decisions about resource allocation to renewable energy installation projects on campus. The deliverable analysis of this study and renewable energy campus map will serve as foundational knowledge for both the CEF Committee and key campus stakeholders including UVM’s Campus Planning, Physical Plant, Facilities, Design, and Construction and senior administration.TRANSCRIPT
Comprehensive Campus Renewable Energy Feasibility Study
2012
Prepared by CHA Consulting Inc.
3 Winners Circle Albany, NY 12205

UVM Campus Renewable Energy Feasibility Study
Table of Contents
Table of Contents
Section: Page No:
Executive Summary 3-17
Cogeneration/CHP 17-37
Wind 38-79
Fuel Cells 80-90
Solar PV 91-123
Anaerobic Digestion 124-133
Biomass/Biofuels 134-140
Geothermal 141-155
Solar Thermal 156-164
Appendix: Solar PV 165-430
Appendix: Solar Thermal 431-457

UVM Campus Renewable Energy Feasibility Study
Executive Summary
1
Executive Summary
From the RFP: “The University of Vermont requested consultant services to develop a
comprehensive plan to recommend installation locations of renewable energy technologies on both its
main and south campuses. Technologies included Solar PV, Combined Heat & Power, Solar Thermal,
Geothermal, Fuel Cells, Anaerobic Digestion, Biomass, and Wind energy.
The CHA findings indicate a multitude of good opportunities to economically install renewable
energy on campus. The following report highlights initial conclusions. Detailed analyses are provided in
the attached comprehensive report and appendices.
1. SOLAR PHOTOVOLTAIC
The investigation of solar photovoltaic (solar PV) opportunities at the University of Vermont
focused on three main topics: current technology & installation best practices, locations for installation,
and costs & incentives. CHA found many good candidate sites, researched state and utility incentive
programs, analyzed decreasing market costs, and reviewed numerous opportunities for the University to
implement solar PV successfully.
Three (3) categories of solar PV installations were considered: building/roof mounted, ground-
mount, and parking lot carports. A total of 66 buildings, 3 ground mount sites, and 29 parking lots were
identified as good candidate sites for solar PV installations. The chart below summarizes the
opportunities that were identified.
Aggregate Summary of UVM Solar PV Opportunities
Total Installable Capacity (kW) 6,525
Total Annual Output (MWh) 7,861
2011 Campus Electrical Usage (MWh) 63,809
Percent Offset 12.04 %
Full detailed descriptions, including cost estimates of each proposed solar PV system, can be
found in the Solar PV section and appendix.

UVM Campus Renewable Energy Feasibility Study
Executive Summary
2
Ground-mount sites were limited to the UVM Miller Research Farm (MRF) and Bio Research
Facility sites based on space requirements and land use considerations (both current and planned). Two
ground-mount sites are identified for the Miller Farm, and one site is identified at the Bio Research
Facility.
Buildings were considered based on a number of conditions, including roof characteristics,
historical significance, building orientation, shading, and building size. The top three building sites based
on potential generation capability are the Patrick-Forbush-Gutterson Complex (1.07MW), the
Living/Learning Complex (427kW) and the Bailey-Howe Library (256kW).
Parking lots were considered based on proximity to existing buildings, shading, available space,
and current and planned usage. The top three parking lot sites ranked by generation capability are
Athletic Complex Parking (497kW), the Harris-Millis east parking lot (124kW), and the parking lot at
Waterman (115kW).
The State of Vermont and local utilities offer a number of financial incentives for solar PV
installations for residential and commercial scale installations. The State program, the Vermont Small-
Scale Renewable Energy Incentive Program, funds a maximum of 60 kW of a given PV installation. Larger
projects can still be eligible for funding, but only 60 kW of the installation would be incentivized. For
UVM, the maximum incentive through this program would be $97,500 or up to 50% of the project costs,
whichever is lower.
The Burlington Electric Department (BED), which services all UVM facilities within the city limits
of Burlington, has a newly implemented program that offers the outright purchase of PV generated
power that is fed directly into the grid at a rate of $0.20/kW-hour. On average, UVM pays at a rate of
$0.137/kW-hour so this incentive offers a significant improvement over current electric costs. With the
exception of the Athletic Complex parking lot (due to size), all projects recommended could take
advantage of this program. Certain permitting provisions apply to this program, the details of which are
provided in the Solar PV report.
While BED serves the majority of campus, there are extensive areas of the southeastern portion
of University property, including parts of the athletic complex, the Miller Research Farm, and the
Bioresearch Complex, that are in Green Mountain Power (GMP) domain. Under GMP’s program, solar

UVM Campus Renewable Energy Feasibility Study
Executive Summary
3
energy systems are connected directly to buildings’ electrical systems and are ‘net metered,’ which
provides the opportunity to sell excess generation (if any) back to the utility company. GMP’s incentive
is $0.06 /kW-hour in addition to the avoided-cost value from solar-generated electricity consumed on
site. The maximum size for this incentive program is 500kW or 100% of the building’s annual electricity
usage.
Solar PV systems can either be UVM-owned or financed via a power purchase agreement (PPA).
These are just two common options for purchasing a solar PV system; there are many variations and
nuances to PPAs, including lease options, fixed term PPAs and buyout provisions. Under an ownership
arrangement, UVM would purchase the PV system and be responsible for operations and maintenance.
Cost estimates and financial analysis can be found in the appendix. Payback terms in the report have
been calculated based on current market conditions, and vary from 15 to 20 years, based on site
conditions, incentives, and system size.
Under a PPA scenario, a third-party developer would own, operate, and maintain the system,
and UVM would agree to install the system on its roof or property. Through this financial arrangement,
UVM could receive more stable and lower cost electricity, while the solar service provider or financer
acquires financial benefits such as tax credits and depreciation, which would be passed on to the
University via lower electricity rates. The PPA scenario has the advantage of requiring little to no up-
front capital investment, and is often cash-flow positive in year one.
CHA recommends implementation of solar PV systems across UVM’s campus. Opportunities to
take advantage of PPA options should be considered as projects develop. Many candidate locations have
been identified for further consideration. The most appealing projects in terms of cost and payback
would be the larger rooftop sites on campus, provided the roof and understructure are suitable.
2. ANAEROBIC DIGESTION
It is currently estimated that approximately 1,000 tons of degradable organic wastes are
generated at UVM each year. These wastes include food waste and landscaping wastes from campus
operations and mixed manures from farm operations at the MRF site. Due to this large quantity of
decomposable materials, anaerobic digestion could be a helpful tool to recycle and reuse the otherwise
discarded debris.

UVM Campus Renewable Energy Feasibility Study
Executive Summary
4
The decomposition of organic matter in an anaerobic environment produces methane, a
valuable fuel gas. The potential to treat UVM’s organic wastes in an anaerobic digester and produce
electric energy for grid sale by combusting the methane produced by digestion in engine-generators was
studied in 2010 by Forcier, Aldrich & Associates. That study was based upon a larger farm herd than
exists today, but it concluded that anaerobic waste digestion with grid electric sale would only produce a
return on investment if external sources of waste were found to help source the digester and increase
gas generation.
In this report, CHA examined anaerobic digestion of UVM’s organic wastes, but at a smaller scale
proportional to the now reduced farm herd. However, instead of using the excess methane for electric
generation (as previously studied), this report considered the conversion of the excess methane into a
Renewable Natural Gas (RNG) fuel for vehicle use. This use has both environmental and economic
benefits, and it would allow UVM to capture the full avoided cost of fuel purchases for every equivalent
gallon of gasoline or diesel produced.
On a simple economic basis, the cost of installing a process to anaerobically digest the campus
and MRF organic wastes and converting the resulting excess biogas to RNG is difficult to justify. The
digester needed to produce biogas for RNG production would cost approximately $820,000, and fuel
preparation, storage, and dispensing facilities would cost another $800,000 ($1.62 million in total
excluding vehicle conversion costs.) Calculations indicate annual savings derived from using RNG versus
gasoline or diesel would approximately equal the annual costs for system operation, and thus there
would be little chance for return on the initial capital investment.
In a broader context, digestion of the campus and farm organic wastes, and the production of
RNG for use as a fuel in UVM fleet vehicles, would produce both economic and environmental benefits
that are difficult to quantify at this point in time. An anaerobic digestion project for campus and farm
organic wastes would yield measurable positive economic and environmental benefits if the negative
externalities of fossil fuel production and environmental harm caused by GHG emissions could be better
quantified.

UVM Campus Renewable Energy Feasibility Study
Executive Summary
5
3. BIOMASS ENERGY
Biomass energy is the utilization of a renewable fuel source (e.g. wood chips, agricultural waste,
yard clippings, municipal solid wastes, etc.) for the production of thermal energy or the production of
both electricity and thermal energy (i.e. CHP/cogeneration).
At UVM, several existing and emerging biomass technologies could be employed, including (but not
limited to): biomass combustion to produce hot water; the production of steam for heating, with
potential utilization in a steam turbine generator to make electricity; synthetic gas production for use in
reciprocating engine or gas turbine generators (electricity) with heat recovery for the production of
thermal energy; and stacked technologies including biomass combustors and an Organic Rankine Cycle
(ORC) system producing electricity and thermal energy.
In this study, two potential biomass plant locations were examined: the Trinity Campus and the
Cage Heating Plant. At Trinity Campus, two cases were considered: an economic update of a previous
UVM Physical Plant intern study that looked at heating only; and a new cogeneration scenario that
would provide both heating and electricity to buildings that are currently electrically heated. At the Cage
Heating Plant, a biomass cogeneration plant was examined that would produce electrical power to off-
set electricity that UVM purchases, and that would pre-heat condensate to the existing heating plant
deaerator, which would slightly improve heating plant efficiency.
A simplified economic analysis of the cases, considering a range of future energy prices
(wood/biomass, gas, electricity) reveals that the nominal payback period of the heating-only biomass
plant at Trinity has the best potential payback of cases examined. CHA recommends that when the
opportunity is appropriate, the Trinity biomass heating-only case should be compared to gas-fired boiler
options, geothermal options, and should consider/include the cost of district-heating system
infrastructure and conversion of the Trinity buildings from electric heat to hot-water heating coils (which
is required whether the Trinity district heating system is gas or biomass fired). The cogeneration cases at
Trinity and at the Cage have much longer payback periods, in comparison to the biomass heating-only
case.

UVM Campus Renewable Energy Feasibility Study
Executive Summary
6
4. CHP / COGENERATION
Combined-Heat-and Power / Cogeneration
Combined-Heat-and-Power (CHP) or Cogeneration, is defined as the simultaneous production of
two or more useful forms of energy from a single fuel source, with the resultant combined energy
production accomplished at a high overall efficiency. For the UVM campus, the energy products from a
cogeneration facility would be electricity and steam or hot-water for heating.
Each potential cogeneration opportunity is unique and may require a different technical
solution, depending on factors including the magnitude and variability of the electrical and thermal
loads that can be serviced; future load growth or even load contraction; physical space available for a
plant; suitable access to an adequate fuel supply, and to electrical and thermal interconnections; the
type and sometimes the age or condition of existing thermal energy and/or electrical generating and
distribution assets (i.e. avoided costs, as applicable); existing infrastructure; and frequently public
perception (e.g. environmental) and/or external stakeholder concerns (including those of existing gas or
electrical utilities).
UVM Energy Information
UVM energy operations staff provided basic campus energy technical information including
recent electrical energy consumption on a monthly-per-building basis; a description of the annual steam
production profile at the existing Cage Heating Plant and an explanation of the steam distribution
system; descriptions and graphical representations of the existing Burlington Electrical Department
(BED) electrical interconnections to UVM buildings; Vermont Gas natural gas fuel supply information;
ongoing energy efficiency and conservation measures; and a basic tour of the campus and potential
locations for a cogeneration facility.
This technical information, plus a copy of a year-2006 Cogeneration Feasibility Study (by WMG
Group) that examined cogeneration opportunities on the campus as it was configured at the time, were
used to examine the opportunity for cogeneration in the near future at UVM.
UVM Cogeneration Locations
Accordingly, based on the information provided, two (2) locations were identified for further
examination in this Renewable Energy Feasibility Study: a) a nominal 3.5 MW cogeneration plant at the

UVM Campus Renewable Energy Feasibility Study
Executive Summary
7
Cage Heating Plant that would provide electricity to eleven (11) large electrical-load buildings located
relatively near to the Cage, and would provide steam to the Cage (displacing gas-fired boiler steam); b) a
nominal 250 kW cogeneration plant at University Heights, that would provide electricity and hot-water
(displacing Cage steam from the steam distribution system during winter-heating months).
Cage Cogeneration Plant
Based on the information provided, a Cage Cogeneration Plant would include a nominal 3.5 MW
gas turbine generator (GTG) with a low-emissions combustion system, and a duct-fired single-pressure
heat recovery steam generator (HRSG) capable of producing about 19,000 lb/hr of steam unfired, and
up to about 50,000 lb/hr when duct-firing the HRSG when needed. In practice, based on the UVM
annual steam load profile, the HRSG would be duct-fired almost all year-round.
The gas supply to the Cage would require improvements (by Vermont Gas) to ensure sufficient
volumes of natural gas were available to serve the GTG, the HRSG and the existing Cage boilers. Ideally,
the gas supply to the GTG itself would be at as high a supply pressure possible to minimize cogeneration
plant auxiliary power losses associated with the electric-motor driven natural gas compressor required
for supplying fuel to the GTG at high enough pressure.
The electrical interconnections to the existing 11 buildings would utilize the 13.8 kV distribution
feeders that UVM has recently commenced installing, plus additional UVM-installed feeders and system
upgrades to ensure a robust electrical system. A capacity upgrade to the existing BED 13.8 kV feeder to
the Cage 13.8 kV system will most likely be required, to ensure that the 11 buildings can continue to be
served electrically via BED supply when the cogeneration plant is shut down for maintenance.
The estimated cost for year-2013 for the above-discussed Cage Cogeneration system and UVM-
internal electrical system upgrades (but not Vermont Gas or BED upgrades) is in the order of $18.65
million. A new gas-fired boiler system (roughly $2.9 million) is under consideration in lieu of the
cogeneration system. Installing cogeneration would avoid this boiler upgrade cost, resulting in a net
cogeneration plant cost in the order of $15.7 million.
A 1st-year annual-savings / simple-payback analysis similar to that used for the other renewable
energy opportunities in this study was conducted, for a range of fuel gas prices ($5.00, $7.50, $10.00
and $12.85/mmbtu) and electricity prices (12.1 and 15.0 c/kW.hr), as follows.

UVM Campus Renewable Energy Feasibility Study
Executive Summary
8
1st-Year Annual Savings; Simple Payback Analysis Gas Price $/mmbtu 5.00 5.00 7.50 7.50 10.00 10.00 12.85 12.85 Avoided Electricity Price c/kW.hr 12.1 15.0 12.1 15.0 12.1 15.0 12.1 15.0 Net Installed Cost $mm 15.7 15.7 15.7 15.7 15.7 15.7 15.7 15.7 Savings $mm
Electrical Cost Savings $mm 3.6 4.4 3.6 4.4 3.6 4.4 3.6 4.4 Thermal (Boiler) Fuel
Savings $mm 2.8 2.8 4.1 4.1 5.5 5.5 7.1 7.1
Total Savings $mm 6.3 7.2 7.7 8.6 9.1 10.0 10.7 11.5 Costs $mm
Fuel Cost $mm 3.5 3.5 5.3 5.3 7.0 7.0 9.0 9.0 O&M Cost $mm - GTG/HRSG/GComp $mm 0.2 0.2 0.2 0.2 0.2 0.2 0.2 0.2 - Add'tl Staffing $mm 0.10 0.10 0.10 0.10 0.10 0.10 0.10 0.10 - Consumables $mm 0.13 0.13 0.13 0.13 0.13 0.13 0.13 0.13 BED Standby Charges $mm 0.2 0.2 0.2 0.2 0.2 0.2 0.2 0.2
Total Costs $mm 4.2 4.2 5.9 5.9 7.7 7.7 9.7 9.7 Annual Savings $mm 2.2 3.0 1.8 2.7 1.4 2.3 1.0 1.9 Simple Payback Years 7 5 9 6 11 7 15 8
In addition, A 20-year present-worth and break-even point analysis, similar to that presented in
the 2006 WMG study was conducted based on the net cogeneration project cost, performance and fuel
consumption; electrical cost savings; Cage fuel gas savings; and nominal O&M costs; for the same range
of natural gas prices and electricity prices, using the same discount and escalation factors as that study.
Present-Worth; Break-Even Point Analysis (similar to WMG 2006 Cogeneration Study)
Gas Price $/mmbtu 5.00 5.00 7.50 7.50 10.00 10.00 12.85 12.85
Electricity Price c/kW.hr 12.1 15.0 12.1 15.0 12.1 15.0 12.1 15.0
1st-Year Annual Savings $mm 2.18 3.04 1.81 2.67 1.44 2.30 1.02 1.88
20-Year Present Worth $mm 15.5 30.6 9.0 24.1 2.5 17.6 -4.9 10.2
Break-Even Point Years 10 7 13 8 17 9 N/A 12

UVM Campus Renewable Energy Feasibility Study
Executive Summary
9
Either method of economic analysis reveals that despite the smaller cogeneration plant size
(compared to the WMG-2006 study) and despite the increase in costs over the past 7 years, the
potential payback and present worth of a Cage 3.5 MW cogeneration plant appears to be favorable for
those scenarios where gas prices are in the $5.00 to $10.00/mmbtu range and where BED electricity
prices are near to or higher than current pricing. Further examination of this cogeneration opportunity
may be warranted.
University Heights Cogeneration
The 250 kW University Heights electrical load is quite modest compared to the above Cage
cogeneration configuration, however it appears to be relatively steady year-round. Installing a complex
and expensive steam plant based on heat recovery from a 250 kW electrical generator at this location is
impractical, so instead, hot-water heating was selected as the thermal energy output.
Several equipment configurations were examined, including 65 and 200 kW gas-fired Capstone
microturbine generators with hot-water heat recovery; a 250 kW gas reciprocating engine generator
with hot-water heat recovery; and for interest and comparisons sake, a 400 kW (too big) UTC 400 Fuel
Cell system with hot-water heat recovery and Bloom Energy 100 kW and 200 kW fuel cell systems
without heat recovery. Capital cost estimates range from about $0.43 million for the smallest Capstone
C65 system to $2.0 million for the UTC 400 fuel cell system.
A simple 1st-year annual savings economic analysis (payback period) was conducted based on
the equipment cost, performance and fuel consumption; electrical cost savings; thermal fuel savings (i.e.
fuel saved at the Cage plant); and nominal O&M costs, for a range of fuel gas prices and electricity
prices.
The general conclusions of the University Heights preliminary cogeneration plant analysis indicate
that only for the scenario with a low gas price and high avoided electricity cost:
• Small microturbines (65 or 200 kW) with heat recovery are a good candidate (nominal 8 year
payback) to offset the electrical loads and a good portion of the hot-water heating loads during
the heating season.
• On paper, the Bloom Energy 100 or 200 kW fuel cells are reasonable candidates (9~13 year

UVM Campus Renewable Energy Feasibility Study
Executive Summary
10
payback), but they cannot provide hot-water (heat recovery) and thus are not really
cogeneration units and do not offset Cage fuel costs. On paper, the 400 kW UTC fuel cells with
hot-water heat recovery have a better payback, but in reality they are too big for the University
Heights electrical load.
• A reciprocating engine generator with hot-water heat recovery is a good candidate (nominal 6
year payback) but it would be much larger and nosier than the small microturbine installations.
For the high-gas price / current electricity price cost scenario, none of the above-discussed University
Heights cogeneration and alternate configurations indicate a good payback potential (i.e. dozens of
years).
5. FUEL CELLS
CHA investigated the potential installation and utilization of fuel cells around the UVM campus.
The study looked at two different types of fuel cells: solid-oxide fuel cells (SOFC) and proton exchange
membrane (PEM) fuel cells. Detailed descriptions of these cell types, and the specific units that were
examined, can be found in the Fuel Cell section of the report. After a simplified economic analysis, CHA
concluded that on the UVM campus there is not a beneficial opportunity for fuel cell installation.
Out of the two fuel cell types, CHA found that, theoretically, the UTC 400 model would be more
beneficial for UVM. Its lower installed cost and combined heat and power (CHP) benefits are appealing.
Under ideal economic conditions (5.00 gas and 15.0 c/kW.hr), the UTC 400 Fuel Cell cogeneration (with
CHP) unit would be reasonable. However, since the heating plant already produces and distributes
steam to provide heat, there is no need for CHP, rendering the cells’ heat-recovering ability nearly
financially neutral at most high electrical load sites. Therefore, the payback period would be longer
without the recovery of the heat byproduct of the fuel cell unit.
In conclusion, CHA found that, unless under ideal conditions, including future grants and
funding, installing either type of fuel cell is not a viable option at the present time. Since there are
currently no grants available to fund fuel cell installation costs, the payback period is too long to make
utilizing fuel cells financially reasonable. However, if there were funding available, UVM would be a
great candidate to participate in a fuel cell pilot program.

UVM Campus Renewable Energy Feasibility Study
Executive Summary
11
6. GEOTHERMAL
CHA research on the addition of geothermal energy to UVM’s campus identified a number of
good opportunities to implement ground source heat pumps to augment heating and cooling of UVM
buildings. Due to the lack of available data on site specific heating and cooling infrastructure,
conclusions and economic feasibility were limited to a conceptual level.
Feasibility study analysis for geothermal energy focused on hybrid ground-source heat pumps with
vertical wells augmenting natural gas hydronic heating systems with cooling. This was for two primary
reasons: this is generally the most cost-effective way to add geothermal to a building, and for the UVM
sites considered, it required less modification to existing building systems.
Sites were considered based on their existing heating and cooling setup, and available space for
geothermal wells. First, sites within the central heating & cooling system were eliminated. Secondly, a
survey was completed for area suitable for wells. Prior to project development, test wells should be
drilled and analyzed to ensure proper geothermal design.
The survey yielded the following sites as good candidates:
On Trinity Campus: the “Back Five” residence halls, Mercy Hall, McAuley Hall, and Mann Hall.
Additionally, the Blundell House, 284 East Avenue (UVM Rescue/Police Services/Physical Plant), and
Waterman Building. Of the eleven sites evaluated, the “Back Five”, Mercy Hall, and McAuley Hall were
the most appealing due to their impending HVAC upgrade/replacement needs. The “Back Five” are
currently served by electric baseboard heat, which is inefficient and now a much more expensive
method for space heating. Mercy Hall and McAuley Hall are heated by two hydronic natural gas boilers
which are slated for replacement in the near future.
The recommended geothermal setup for each site is a high efficiency hydronic natural gas
boiler, augmented by geothermal ground-source heat pumps and ground source cooling. Conceptual
estimates put installed costs for geothermal heating and cooling at $10-$15/sq.ft. more than traditional
heating and cooling for large residential buildings. Savings are typically in the 10-30% range with
paybacks often being achieved in the 15 to 20 year range.
In conclusion, CHA recommends further investigation into geothermal heating and cooling at the
eleven sites mentioned above. In particular, we identify the “Back Five” as an excellent candidate.

UVM Campus Renewable Energy Feasibility Study
Executive Summary
12
Greater savings and shorter payback terms are realized with the “Back Five” since they currently utilize
electric heat.
7. SOLAR THERMAL
Solar thermal feasibility investigation for UVM focused on opportunities to add solar heating to
domestic hot water systems on campus. CHA found excellent state incentive programs, a handful of
good candidate sites, and a number of challenges to overcome when developing solar thermal on
campus.
For the purposes of this study, CHA focused on buildings that have demand for hot-water year
round. These buildings were then cross referenced with the solar PV sites to ensure solar potential and
roof space. Those identified to be best candidates were Marsh, Austin, and Tupper Halls, Living/Learning
D, University Heights, and both the Harris/Millis Commons and Simpson Hall dining facilities. Of those
buildings, the University Heights residential complex is one of the most favorable given the overall size
of the facility and its comparatively large energy consumption. Additional information is needed on each
building’s existing hot water setup in order to confirm cost estimates and savings.
Two technologies for solar thermal collectors are common for domestic hot water applications,
evacuated tubes and flat plate collectors. An evaluation of each technology yielded flat plate collectors
as the better choice for domestic water heating in Vermont. Flat plate collectors are less expensive and
more durable and on average perform better than evacuated tubes at lower average ambient
temperatures (such as Vermont’s climate.)
The State of Vermont offers a number of incentive programs for solar thermal hot water
installations. The ‘Vermont Small-Scale Renewable Energy Incentive Program’ funds a maximum of
$45,000 or 50% of the total project costs, whichever is less. The state offers a number of other
incentives for solar water projects, however these are generally geared towards residential installations
via tax incentives and are therefore not likely applicable to the University, unless the savings are passed
along through a local vendor who is eligible to receive the credits.
The domestic water heating for many of the buildings at UVM is provided by a central steam
plant. A hybrid domestic water heating system which combines the available steam with the renewable
aspect of solar collectors is mechanically possible but economically less appealing. With a steam/solar
hybrid system, this water heating setup will consume less steam from the central plan than an all-steam
UVM Campus Renewable Energy Feasibility Study
Executive Summary
13
system. This amount of steam can be estimated, and it would likely result in very small decrease in
overall amount of steam produced by the central plant. Compared to a solar thermal setup where solar
is augmented by a natural gas or electrical water heater, the steam/solar hybrid system is around 25%
more expensive due to the additional costs of the storage tank, heat exchangers and controls required
and the resulting increased labor and engineering costs. Furthermore, the cost of producing hot water
via the central steam system is less expensive than heating hot water via gas or electricity. So in
conclusion, the system would be more costly and result in lower bottom line savings and increase
payback term. We would recommend focusing any solar thermal projects to buildings that do not get
their hot water via central steam system.
Implementing solar thermal for domestic water heating is a worthwhile pursuit for UVM,
provided the following are considered. It is essential that projects be selected at sites that have hot
water demand in the summer. We have identified buildings that in 2012 have summer hot water
demand, but future demand could change and should be re-evaluated prior to developing a project.
Furthermore, projects which add solar thermal to buildings which do not get their hot water from the
central steam system will present more appealing project economics.
8. WIND ENERGY
CHA researched the installation of wind turbine generators (WTG) on UVM campus. The study
focused on two types of WTG: “small” and “micro” wind turbines. The sites considered were fields
surrounding the MRF and Bio-Research Complexes, the area west of Living and Learning, west of Bailey-
Howe and in Centennial Woods Nature Area. Our research identified small wind turbines to be feasible
in a few locations, but concluded that micro turbines were not feasible.
For small turbines, the basis of this study was the 100 kW Northwind 100 Turbine manufactured
by Northern Power Systems in Vermont. The turbine stands approximately 130’ tall at hub height with a
rotor of 75’. For micro turbines, a number of models were compared in order to select the best of
technologies. While some of the turbines were promising, the project payback of micro turbines was
found to be excessive. The payback periods for micro turbines are rarely less than 20 years in class 2 and
3 wind speeds (higher than those at UVM). Installation of micro turbines on buildings was considered
not feasible based on structural concerns in addition to long payback periods.

UVM Campus Renewable Energy Feasibility Study
Executive Summary
14
Sites for small turbines were selected based on open space. In order to take into consideration
the proper precautions, all WTG’s should be sited so that in the event of a tower fall there would be no
buildings or critical infrastructure damaged. Potential sites were identified around MRF and the Bio
Research Complexes and in Centennial Woods Natural Area. For micro turbines, any open space on
campus was considered, and would be narrowed down after completion of wind mapping. Wind reports
were run at nine locations around campus to account for any potential wind differences between
locations.
Nine locations were mapped for wind speed. All nine locations were found to be category 1
wind at 30m height. In category 1, the average wind speed is below 11.6 mph. The location south of the
Miller Farm had the highest average wind speed of 10.9 mph and Centennial Woods had the lowest at
9.8 mph. Low average wind speeds would result in energy output of the turbine being very low and the
project economics being unfavorable.
There are several incentives for installing small wind turbines in the State of Vermont. The Small
Scale Renewable Energy Incentive Program grants $1.20 per kWh produced by the wind turbine with a
maximum incentive of $455,000. Under this program, a Northwind 100 Turbine would be feasible to
install near the Miller Farm. Based on CHA experience designing projects with this turbine, an economic
analysis was performed. The overall project cost would be around $640,000 with a payback period of
around 18 years. The turbine would be interconnected and net metered at the Farm’s main service and
offset 25-35% of the site’s power needs.
CONCLUSIONS
In summary, CHA identified a number of good opportunities for renewable energy
development on UVM campus. Some technologies exhibited better feasibility conditions than others
due to siting conditions, economies of scale, incentives, commodity prices, and other factors. Detailed
analyses and recommendations are provided in the attached comprehensive report and appendices.
UVM Campus Renewable Energy Feasibility Study CHP / Cogeneration
1
CHP / COGENERATION
1.0 CHP / Cogeneration
1.1 A General Introduction to CHP/Cogeneration
Combined-Heat-and-Power (CHP) or Cogeneration, is defined as the simultaneous production of
two or more useful forms of energy from a single fuel source, with the resultant combined
energy production accomplished at a high overall efficiency. Strictly speaking, CHP/Cogeneration
is not “renewable energy”, but is “sustainable energy” in that it improves the end-utilization of a
specific fuel’s energy, thus saving our society’s available fuel resources for future needs (similar
to how solar, wind or hydro power production saves central powerplant fossil fuel utilization).
Each potential cogeneration opportunity is unique and may require a different technical
solution, depending on factors including the magnitude and variability of the electrical and
thermal loads that can be serviced; future load growth or even load contraction; physical space
available for a plant; suitable access to an adequate fuel supply, and to electrical and thermal
interconnections; the type and sometimes the age or condition of existing thermal energy
and/or electrical generating or distribution assets (i.e. avoided costs, as applicable); economic
and financial factors; funding, grants and subsidies; and frequently public perception (e.g.
environmental) and/or external stakeholder concerns (including those of existing gas or
electrical utilities).
A typical CHP application for smaller-scale institutional and industrial applications is the
installation of one or more gas turbine generators which produce electricity from natural gas
and/or liquid fuel, and heat-recovery boilers / steam generators which produce thermal energy
(usually steam) from the hot exhaust gases of the gas turbine.
In certain smaller-load cases, reciprocating engine generators are used in lieu of gas turbines,
and steam and/or hot-water can be produced from the engine exhaust gases and from the
engines cooling water systems. In other cases, gas-fired micro-turbine generators or fuel cells
with heat recovery producing hot-water may be the best solution for a given smaller-load
application. In cases where the application’s thermal energy requirements are greater than the

UVM Campus Renewable Energy Feasibility Study CHP / Cogeneration
2
electrical energy requirements, then boilers and steam turbine generators may be the best
solution.
1.2 Configuration of Major Energy Consumers at UVM
From the perspective of a potential cogeneration plant, it is important to understand how
energy is connected, distributed and consumed at the UMV campus.
Electrical Energy
The UVM campus is served electrically by the Burlington Electric Department (BED). The service
consists of four (4) underground primary feeders and five (5) BED 13.8 kV aerial drops. BED
service to individual buildings or group of buildings is provided by BED-owned individual feeders
and (with a few exceptions) step down transformers, with over 130 separate metering points
(i.e. each a separate invoice).
The current method of interconnection presents a challenge for cogeneration, since a group of
buildings would have to be unified into one electrical loop to which the cogeneration plant
would connect electrically. In addition, either the building electrical supplies would have to be
modified to eliminate/bypass the current BED connection, and/or a BED feeder of substantial
capacity would have to be connected into where the cogeneration plant electrical output (to the
buildings) was installed.
Thermal / Steam Energy
Steam is used at UVM for space heating and domestic water heating, plus for two (2) steam
absorption chillers at HSRF during the summer cooling season.
The Cage Heating Plant includes five (5) gas/oil-fired steam boilers with a total firm net-
generating capacity of 160,000 lb/hr at 225 psig, saturated conditions. The Cage is the hub for
the majority of the steam generation and distribution for the campus.
1.3 CHP / Cogeneration Opportunity at UVM
In year-2006, the University of Vermont and the WMG Group studied a cogeneration plant for

UVM Campus Renewable Energy Feasibility Study CHP / Cogeneration
3
the campus in considerable detail. The work included an assessment of the electrical and
thermal loads that could be connected to a cogeneration plant located adjacent to the Cage
Heating Plant; the initial development of a cogeneration plant design basis and configuration;
the technical performance, capital cost and economic performance of the proposed facility; and
discussions and negotiations with the local electrical company – Burlington Electric Department
(BED).
The WMG study was made available to Renewable Energy Feasibility Study authors in order to
assess the original design basis of the cogeneration plant. Subsequent interviews with UVM
physical plant staff; monthly electrical energy utilization information from UVM’s SchoolDude
system; a description of the new thermal load profile of the campus; and a tour of the campus
major energy assets allowed the authors to understand the basics of how the campus energy
picture had changed in the intervening years and how that might affect a potential cogeneration
plant in the near future.
Upon review of the available material, two (2) potential locations / sizes of cogeneration plants
were selected for further initial study, including:
a) Cage Heating Plant Cogeneration – an update to the WMG 2006 study, which would
include the potential addition of a gas-fired gas turbine generator and heat recovery
steam generator based cogeneration plant adjacent to and connected to the Cage Heating
Plant.
b) University Heights Cogeneration – the potential addition of a small CHP plant producing
electricity and hot-water at the new university student housing, to offset electricity
purchases and steam distributed to there from the Cage Heating Plant.
These opportunities are discussed in more detail in the sections below.
2.0 UVM Campus Major Energy Parameters
2.1 Summary Basis of Year-2006 UVM-WMG Cogeneration Study
The 2006 WMG study and report was a fairly comprehensive technical, performance and

UVM Campus Renewable Energy Feasibility Study CHP / Cogeneration
4
economic examination of the viability of installing a gas turbine based cogeneration system at
the Cage Heating Plant that would provide electricity to at least nine (9) nearby UVM buildings,
and would provide steam to the UVM steam distribution system that originates at the Cage
central heating boiler plant.
To understand the current cogeneration opportunities, it is important to re-iterate the major
elements of the WMG study, as per below.
WMG 2006 Study – Electrical Requirements and Connection
To displace BED purchased power, electrical output from a UVM-owned cogeneration plant
would have to be distributed to nearby buildings by a new UVM-owned localized electrical
distribution, feeder and transformer network.
Due to the cost of such a network WMG advised it should be dedicated to serving the highest
UVM metered loads / buildings, which they determined to include: Medical Complex (Given
Bldg.); Marsh Life Science; Votey Engineering Building; Cook Physical Science; Stafford Building;
Cage Heating Plant; Arts / Science (Old Mill / Lafayette); Waterman Building; Health and
Sciences (HSRF Building), for an approximate average demand (peak load) of 4.0 MW, and an
annual-average load of about 3.7 MW.
WMG 2006 Study – Steam Load
In the WMG study, the UVM campus steam load was projected to future-peak at about 150,000
lb/hr in the winter months, and to run (in the future, after the addition of absorption chillers) at
about 70~80,000 lb/hr in the summer months.
WMG 2006 Study – Cogeneration Plant Design Basis
The WMG study proposed the installation of a nominal 4.6 MW dual-fuel (natural gas and No. 2
fuel oil) Solar Centaur 50 gas turbine generator (GTG) with a duct-fired heat recovery steam
generator (HRSG) providing about 19,900 lb/hr of steam at 225 psig, saturated at the unfired
operating condition and approximately 46,300 lb/hr of steam when duct-fired to 1600 deg F
(which requires additional natural gas fuel to HRSG duct-burners).

UVM Campus Renewable Energy Feasibility Study CHP / Cogeneration
5
The GTG would be electrically connected into a new 13.8 kV system (“switchboard”) at the Cage,
and then connected at 13.8 kV to the above-mentioned 9-buildings via a new UVM-owned
electrical distribution, feeder and step-down transformer(s) system.
The WMG study proposed that the GTG would electrically load-follow the 9 connected buildings,
i.e. would only make enough power to supply them and would not export power to BED. In fact,
BED required UVM to operate the unit so that 300 kW was always drawn from the BED system.
This resulted in the 4.6 MW rated GTG usually running inefficiently at part-load, since it would
be oversized for the 9-building average electrical loads minus 300 kW.
The HRSG systems would be interconnected to the existing Cage steam, feedwater and
blowdown systems, and the HRSG exhaust would be interconnected to the existing exhaust
breeching / single-stack serving the other 5 existing boilers. The existing boilers would continue
to operate at much reduced loads, in parallel to the HRSG, for load following and reliability.
WMG 2006 Study – Cost and Economic Aspects
WMG estimated the cost of the cogeneration plant equipment and installation, relocations and
the required electrical distribution, at $16.2 million. In their subsequent economic-model
analysis, WMG included a $2.5 million new-boiler project offset, for a “net cogeneration plant
cost” of $13.7 million.
The WMG study’s economic-model included for the net project capital cost, cogeneration fuel
costs (based on $10.40/mmbtu gas price), GTG-HRSG-Gas Compressor O&M (0.5 c/kW.hr),
additional staffing and consumables ($120,000 per annum) and BED standby charges (varying
from 0.7 to 1.0 c/kW.hr).
The calculated base-model annual energy savings of cogeneration v.s. a case without
cogeneration was $1.63 million (1st year of operation). The 20-year life-cycle cost savings (i.e.
NPW-2006 dollars) of the project was $8.87 million, and the breakeven point was determined to
be 11.6 years.
UVM Campus Renewable Energy Feasibility Study CHP / Cogeneration
6
2.2 Changes to UVM Campus Since the WMG 2006 Study
Since the original WMG Study, there have been changes in UVM campus building configuration,
campus utility distribution (infrastructure) and operations, and campus energy efficiency
measures have been enacted, all of which would affect the conceptual design basis of a
potential near-future CHP/cogeneration plant.
New Campus Buildings and Infrastructure
Since 2006, the Dudley H. Davis Center (Davis) and James M. Jeffords Hall (Jeffords) buildings
have been constructed. Both buildings are located relatively close to the Cage Heating Plant and
the other 9 large-load buildings already identified in the WMG study, and are substantial annual-
average electrical loads themselves, making them additional potential cogeneration electrical
hosts under the right circumstances.
In addition, UVM have been upgrading their campus buried steam and chilled water distribution
systems, and have been simultaneously installing high-voltage cabling systems in the same open
trenching systems, i.e. portions of the future-potential UVM-owned cogeneration electrical
distribution network are being constructed.
Since 2006, construction of the University Heights project has been completed, comprised of six
(6) student housing buildings with a modest annual-average electrical load, and a modest
thermal load comprised of hot-water heating and absorption chilling.
New Electrical Load Profiles
UVM provided the authors with SchoolDude monthly electricity energy consumption
information for all campus buildings for years 2005-2006 to 2011/Jan-2012. This data was mined
to determine the current annual-average electrical load for the original 9-buildings, with the
addition of the 2 new buildings – Davis and Jeffords.
The mined data showed that the annual-average electrical loads for the 11-buildings is relatively
the same as the year-2006 9-building WMG study, most likely due to the ongoing campus /
building energy efficiency measures enacted by UVM in the recent years.

UVM Campus Renewable Energy Feasibility Study CHP / Cogeneration
7
New Steam Load Profile
Due to campus energy efficiency measures and utility system improvements enacted by UVM
and additional various steam-turbine drive / absorption chillers, the steam load profile has also
changed significantly since the 2006 WMG study period.
UVM staff advised that the campus winter steam load now peaks much lower at about
115~120,000 lb/hr (in lieu of ~150,000 lb/hr), and that summer loads now run higher at about
80~90,000 lb/hr (in lieu of 40~60,000 lb/hr). The shoulder-season steam loads (which have little
need for either heating or chilling) are now in the ~30,000 lb/hr region during occupied-
classroom periods.
3.0 Cage Heating Plant Cogeneration Opportunity
3.1 Impact of Campus Electrical and Steam Load Changes
The monthly-average Heat-to-Power Ratios (i.e. campus steam demand divided by the average
11-building electrical requirements) of the above-discussed new electrical and steam loads
varies from 11:1 to 7:1, which continues to make the UVM campus a candidate for a small GTG-
HRSG configuration with an HRSG with supplementary firing capability.
However, based on the updated electrical load-profile of the 11-buildings (which in year-2011
peaked at about 3.9~4.0 MW, and averaged about 3.4 MW), the authors would not recommend
a 4.6 MW gas turbine generator (as per the 2006 WMG study), but instead a smaller 3.5 MW
(nominal) gas turbine generator.
3.2 GTG Package and GTG-HRSG Performance
The number of vendors offering 3.5 MW GTG packages is limited. Solar Turbines offers a unit
rated at 3.5 MW. Kawasaki Gas Turbines offers a smaller unit rated at 2.9 MW. Rolls-Royce,
Hitachi and others are packagers offering a variant of the Allison 501-KB5 in the larger 3.9 MW
range.
For convenience, the remainder of this discussion centers on the 3.5 MW Solar Turbines Centaur

UVM Campus Renewable Energy Feasibility Study CHP / Cogeneration
8
40-4700S package (a smaller version of the Centaur 50 employed in the WMG study) with a low-
emissions combustion system. The Centaur 40 has the following nominal new & clean operating
characteristics at the UVM campus site elevation, at 60 deg F ambient temperature:
Nominal Output (generator terminals): 3.3 MW Nominal Heat Rate: 14,065 btu/kW.hr (HHV) Nominal Fuel Consumption: 46.5 mmbtu/hr (HHV)
Steam Generation (unfired): 18.6 klb/hr at 225 psig, saturated Steam Generation (fired to ~1600 deg F): 50 klb/hr with 31.5 mmbtu/hr of supplementary
firing (HHV)
Generator Output: 13.8 kV, 60 Hz
Required Gas Pressure: 180 psig at the GTG package, thus 185~190 at gas compressor discharge
The Solar Centaur 40 and a fired HRSG fitted to the exhaust of the unit, has the following new &
clean monthly-average net performance profile:
Jan Feb Mar Apr May Jun
GTG Gross Output kW 3,878 3,853 3,701 3,524 3,361 3,247 Est'd Aux. Power kW 140 140 140 140 140 140 Net GTG Output kW 3,738 3,713 3,561 3,384 3,221 3,107 GTG Fuel Consumption - HHV mmbtu/hr 52.5 52.3 50.6 48.8 47.1 46.0 GTG Net Heat Rate - HHV btu/kW.hr 14,055 14,076 14,213 14,420 14,614 14,799 Unfired Steam Flow lb/hr 19,304 19,292 19,098 18,928 18,726 18,611 HRSG Fuel Consumption - HHV mmbtu/hr 31.0 31.0 31.1 31.3 31.5 31.6 Fired Boiler Fuel Input Saved mmbtu/hr 63.0 63.0 63.0 63.0 63.0 63.0 Fired Steam Flow lb/hr 50,000 50,000 50,000 50,000 50,000 50,000 Fired Net Fuel-Chargeable-to-Power (FCP) Heat Rate(HHV) btu/kW.hr 5,480 5,447 5,263 5,046 4,822 4,679
Jul Aug Sep Oct Nov Dec GTG Gross Output kW 3,178 3,211 3,330 3,473 3,620 3,796 Est'd Aux. Power kW 140 140 140 140 140 140 Net GTG Output kW 3,038 3,071 3,190 3,333 3,480 3,656 GTG Fuel Consumption - HHV mmbtu/hr 45.4 45.7 46.7 48.3 49.8 51.6 GTG Net Heat Rate - HHV btu/kW.hr 14,930 14,867 14,653 14,480 14,307 14,127 Unfired Steam Flow lb/hr 18,543 18,596 18,674 18,875 19,014 19,196 HRSG Fuel Consumption - HHV mmbtu/hr 31.6 31.6 31.5 31.3 31.2 31.1 Fired Boiler Fuel Input Saved mmbtu/hr 63.0 63.0 63.0 63.0 63.0 63.0 Fired Steam Flow lb/hr 50,000 50,000 50,000 50,000 50,000 50,000 Fired Net Fuel-Chargeable-to-Power (FCP) Heat Rate (HHV) btu/kW.hr 4,598 4,632 4,779 4,976 5,171 5,386

UVM Campus Renewable Energy Feasibility Study CHP / Cogeneration
9
3.3 Other Cogeneration Plant Considerations
Cage Heating Plant
The authors toured and generally reviewed the Cage Heating Plant facility with UVM physical
plant staff, and agree with the WMG Group study that a small cogeneration plant, including a
gas turbine generator package, a fired single-pressure heat recovery steam generator and duct-
burner skid, a gas compressor system, corresponding electrical auxiliaries, and a new
cogeneration switchboard can be installed in and to the north of the existing plant.
The “relocations” noted in the WMG study were not specifically re-evaluated, nor was the HRSG
discharge into the existing boiler breeching, but we assume they can be accomplished, based on
the more-detailed previous WMG work.
Gas Supply and Pressure
Based on recent data provided by UVM/Vermont Gas, the gas pressure available in the gas
pipeline at the Cage Heating Plant before the existing regulation station is 30 psig guarantee,
and frequently between 50~90 psig. However, the current “delivered” pressure downstream of
the Vermont Gas metering / regulation station is 5~10 psig.
Gas turbines need a high gas supply pressure, and when only low pressure gas is available,
require gas compressors to raise the operating pressure (e.g. 180~190 psig for a Solar Centaur
40). To minimize gas compression auxiliary power (electrical) losses, a re-configuration of the
Vermont Gas supply system / metering station at the Cage would be suggested in order to
deliver an adequate volume of natural gas fuel at as high a pressure as possible to the
cogeneration plant’s gas compressor system.
The gas supply for the HRSG duct burners could most likely be taken from the existing boiler
supply (existing lower-pressure gas) system, assuming this will be acceptable from a Vermont
Gas viewpoint.

UVM Campus Renewable Energy Feasibility Study CHP / Cogeneration
10
Electrical Connection to the Cage Heating Plant
A capacity upgrade to the existing BED feeder to the Cage 13.8 kV system will most likely be
required, to ensure that the 11 buildings can continue to be served electrically via BED supply
when the cogeneration plant is shut down for maintenance. Such a new 13.8 kV feeder would
have to be sized in the ~5 MW range.
3.4 Cage Cogeneration Plant – Estimated Year-2013 Cost
The Solar Centaur 40 GTG and an HRSG capable of firing to 50,000 lb/hr are today priced higher
than the larger Centaur 50 gas turbine / HRSG combination used in the 2006 WMG study, i.e.
total roughly $4.0 mm v.s. $3.39 mm then (shipping, commissioning, startup and testing
allowances included).
UVM have been installing some of the 13.8 kV feeders that were indicated and costed in the
WMG study, however the authors feel that additional upgrades will be required to the system in
order to provide a robust distribution network design including Davis and Jeffords. Accordingly,
even though some of the high-voltage distribution network has been installed, the WMG cost
estimate may have been low in this area.
The authors estimate the current cost of construction for Centaur 40 based cogeneration plant
in the order of $18.65 mm (v.s. $16.2 mm in 2006). In the revised cost, no account has been
made for a financial contribution to a Vermont Gas upgrade to the gas supply / metering
system, nor for a financial contribution to a ~5 MW BED feeder upgrade to a Cage 13.8 kV
switchboard, since these would be negotiated items.
With a current boiler installation (offset) cost in the order of $2.9 mm v.s. $2.5 mm in 2006
study, the “net cogeneration plant cost” is in the order of $15.7 mm (2013).
3.5 Preliminary Economic Evaluation
The potential economic performance of a 3.5 MW cogeneration plant at the Cage Heating Plant
was evaluated for a range of natural gas prices ($5.00, $7.50, $10.00 and $12.85/mmbtu) and
electricity prices (12.1 and 15.0 c/kW.hr).

UVM Campus Renewable Energy Feasibility Study CHP / Cogeneration
11
This provides a range of scenarios ranging from that similar to current pricing levels, to that
which may result from decreasing natural gas prices (due to the potential impact of shale gas
discoveries and development).
Present-Worth; Break-Even Point Analysis (similar to WMG 2006 Study)
A simplified economic evaluation model was set up that is similar to, but not as sophisticated as
that developed by the WMG group in their more-extensive 2006 cogeneration study.
The simplified model includes for the net cogeneration plant cost, the power / steam generated
by the GTG / fired-HRSG, cogeneration fuel utilized, boiler fuel/cost saved, UVM purchased
electricity amount/cost saved, nominal BED standby charges, additional staffing and
consumables and GTG-HRSG-gas compressor O&M. For ease of direct comparison, the same
labor, escalation and discount factors were used as in the WMG study (reference the table at
the top of page 31 of WMG study report).
For various gas prices and various annual avoided BED electricity costs, the approximate 1st-year
savings due to cogeneration at the Cage Heating Plant; the 20-year Present Worth and the
Break-Even Point are summarized in the table below:
Gas Price $/mmbtu 5.00 5.00 7.50 7.50 10.00 10.00 12.85 12.85 Electricity Price c/kW.hr 12.1 15.0 12.1 15.0 12.1 15.0 12.1 15.0 1st-Year Annual Savings $mm 2.18 3.04 1.81 2.67 1.44 2.30 1.02 1.88
20-Year Present Worth $mm 15.52 30.58 9.02 24.08 2.53 17.58 -4.88 10.17
Break-Even Point Years 10 7 13 8 17 9 N/A 12

UVM Campus Renewable Energy Feasibility Study CHP / Cogeneration
12
1st-Year Annual Savings; Simple Payback Analysis
In addition, a Simplified 1st-Year Annual Savings Economic Analysis (simple payback) similar to
that used in other parts of this Renewable Energy Feasibility Study was performed, as follows:
Gas Price $/mmbtu 5.00 5.00 7.50 7.50 10.00 10.00 12.85 12.85 Avoided Electricity Price
c/kW.hr 12.1 15.0 12.1 15.0 12.1 15.0 12.1 15.0
Net Installed Cost
$mm 15.7 15.7 15.7 15.7 15.7 15.7 15.7 15.7
Savings - Electrical
Cost Savings $mm 3.6 4.4 3.6 4.4 3.6 4.4 3.6 4.4
- Thermal (Boiler) Fuel Savings
$mm 2.8 2.8 4.1 4.1 5.5 5.5 7.1 7.1
Total Savings $mm 6.3 7.2 7.7 8.6 9.1 10.0 10.7 11.5 Costs Fuel Cost $mm 3.5 3.5 5.3 5.3 7.0 7.0 9.0 9.0 O&M Cost $mm 0.0 0.0 0.0 0.0 0.0 0.0 0.0 0.0 - GTG / HRSG $mm 0.2 0.2 0.2 0.2 0.2 0.2 0.2 0.2 - Add'tl Staffing
$mm 0.10 0.10 0.10 0.10 0.10 0.10 0.10 0.10
- Consumables $mm 0.13 0.13 0.13 0.13 0.13 0.13 0.13 0.13 BED Standby Charges
$mm 0.2 0.2 0.2 0.2 0.2 0.2 0.2 0.2
Total Costs $mm 4.2 4.2 5.9 5.9 7.7 7.7 9.7 9.7 Annual Savings $mm 2.2 3.0 1.8 2.7 1.4 2.3 1.0 1.9 Simple Payback
Years 7 5 9 6 11 7 15 8
Potential Economic Performance
The above two tables demonstrate that there could be a fairly good payback for a 3.5 MW
cogeneration plant at the Cage Heating Plant for scenarios where gas prices reduce over time
and for a range of electricity prices. With natural gas prices and electricity prices near their
current levels, the payback period is longer, but could be still be deemed to be favorable.
A more detailed technical analysis of the potential cogeneration project; and commercial
discussions with BED and Vermont Gas regarding costs and offsets would undoubtedly refine
these preliminary conclusions. Further examination of the Cage Cogeneration opportunity may
UVM Campus Renewable Energy Feasibility Study CHP / Cogeneration
13
be warranted.
It should be noted that if the full cost of the cogeneration plant is used in the economic analysis
(instead of the cost net of an avoided new-boiler project), the economic performance of the 3.5
MW cogeneration facility would be less favorable.
4.0 University Heights Cogeneration Opportunity
4.1 University Heights Energy Parameters
The six (6) new University Heights buildings (student housing) have an average electrical load of
250 kW (based on monthly SchoolDude electrical energy consumption data) and are served
thermally with an internal hot-water heating loop in the winter, and by a steam-absorption
chiller for cooling in the summer – both of which are provided with steam from the Cage steam
distribution network.
According to UVM physical plant staff, the student housing is occupied almost year-round and
the above loads are fairly constant. Based upon these energy loads, in theory the University
Heights could potentially become a “cogeneration island”. Ideally the system should be “quiet”,
and would provide electricity and steam to replace the winter-summer draw from the steam
distribution loop.
4.2 Potential CHP / Cogeneration Thermal Considerations
A cogeneration plant at University Heights that produced steam could potentially offset steam
supplied from the Cage steam distribution system both in the winter and the summer.
However in practice, steam production requires the installation of a number of large and
complex systems similar to that at the Cage Heating Plant, including water treatment / storage
systems, condensate and boiler feedwater pumps, deaerator, and so on. Such a large physical
plant is not really practical at the University Heights location.
Thus the cogeneration alternative would be to locally produce hot-water only, for direct
injection into the building hot-water loop in winter, and then to leave the steam absorption

UVM Campus Renewable Energy Feasibility Study CHP / Cogeneration
14
chiller supplied from the Cage steam distribution network.
4.3 Potential CHP / Cogeneration Plant Type
Because a cogeneration plant making only hot-water is the best choice for the University
Heights location, a small gas turbine generator and heat recovery steam generator and a
corresponding steam plant are not practical for this location.
Accordingly, packaged micro-turbine generators with integrated gas compressors such as the
Capstone C65 ICHP (with an integrated hot-water heat recovery system) or larger C200 units
(w/o an integrated CHP) are commercially available and may be a better fit. A small 250 kW gas-
fired reciprocating engine generator producing hot-water from exhaust gas heat recovery and
jacket water is a possible candidate. A suitable fuel cell producing electricity and hot-water
could also be a candidate.
Each of these configurations was briefly examined for their technical and economic
performance. Because these cogeneration systems are relatively small, each will suffer from
high-cost due to their poor economy of scale.
4.4 University Heights Cogeneration Plant Technical and Economic Summary
The following is a simplified technical performance summary and a simplified economic
performance (payback) summary of the application of micro-turbines, fuel cells and a
reciprocating engine generator for the University Heights location, for various avoided
electricity charges and gas prices. Since BED standby charges would have to be negotiated, they
were ignored in this evaluation.

UVM Campus Renewable Energy Feasibility Study CHP / Cogeneration
15
Micro-Turbine Generators
Description Units
Capstone C65 ICHP
Micro Turbine
Capstone C200 Micro
Turbine Equipment/Project Capital Cost $ 425,000 1,250,000 Gross Power kW 65 200 Aux Power (engine & auxiliaries) kW 5 20 Net Power kW 60 180 Fuel Consumption (HHV) (long-term average) mmbtu/hr 0.84 2.28
Thermal Heat (recovery) mmbtu/hr 0.41 0.95 CHP Comments (this analysis assumes all available thermal heat can be utilized, which is not proven yet)
integrated CHP
CHP is not integrated
and requires
an external system
Simple Economic Summary - with $12.85 gas and 12.1 c/kW.hr
Electrical Cost Savings $ 61,054 183,161 Thermal Fuel Savings $ 55,112 127,650 Fuel Cost $ -90,989 -246,384 O&M Cost (staffing ignored) $ -10,092 -18,922 Annual Savings $ 15,085 45,505 Payback years 28 27
Simple Economic Summary - with $5.00 gas and 15.0 c/kW.hr
Electrical Cost Savings $ 75,686 227,059 Thermal Fuel Savings $ 21,444 49,669 Fuel Cost $ -35,404 -95,869 O&M Cost (staffing ignored) $ -10,092 -18,922 Annual Savings $ 51,635 161,937 Payback years 8 8
The above payback analysis shows that with low fuel prices and high electricity prices, there
could be a fairly good payback for a micro-turbine generator based CHP plant at University
Heights. With gas prices and electricity prices near their current levels, the payback period could
be deemed too long.

UVM Campus Renewable Energy Feasibility Study CHP / Cogeneration
16
Fuel Cells – with and without CHP
Description Units
Bloom Energy
ES-5400 Fuel Cell
Bloom Energy
ES-5700 Fuel Cell
UTC 400 Fuel Cell (too big)
UTC 400 Fuel Cell (too big)
Equipment/Project Capital Cost $ 1,000,000 1,300,000 2,000,000 1,950,000 Gross Power kW 100 200 400 400 Aux Power (engine & auxiliaries) kW 2 4 12 12 Net Power kW 98 196 388 388 Fuel Consumption (HHV) (long-term average) mmbtu/hr 0.73 1.47 3.80 3.80
Thermal Heat (recovery) mmbtu/hr 0.00 0.00 1.55 0.96 CHP Comments (this analysis assumes all available thermal heat can be utilized, which is not proven yet)
NOT CHP no heat recovery available
NOT CHP no heat recovery available
high and low grade
heat
high grade heat only
Simple Economic Summary - with $12.85 gas and 12.1 c/kW.hr
Electrical Cost Savings $ 99,721 199,442 394,814 394,814 Thermal Fuel Savings $ 0 0 209,373 129,676 Fuel Cost $ -79,287 -158,334 -410,641 -410,641 O&M Cost (staffing ignored) $ -16,483 -32,966 -65,258 -65,258 Annual Savings $ 3,951 8,142 128,287 48,591 Payback years 253 160 16 40
Simple Economic Summary - with $5.00 gas and 15.0 c/kW.hr
Electrical Cost Savings $ 123,621 247,242 489,439 489,439 Thermal Fuel Savings $ 0 0 81,468 50,458 Fuel Cost $ -30,851 -61,609 -159,782 -159,782 O&M Cost (staffing ignored) $ -16,483 -32,966 -65,258 -65,258 Annual Savings $ 76,287 152,668 345,866 314,855 Payback years 13 9 6 6
The above payback analysis shows that with low fuel prices and high electricity prices, the larger
Bloom Energy unit could potentially have a fairly good payback, however, this unit does not
offer hot-water production (i.e. it is not cogeneration). With gas prices and electricity prices
near their current levels, and without construction subsidies, the payback period for any of
these fuel cells alternatives are too long.

UVM Campus Renewable Energy Feasibility Study CHP / Cogeneration
17
Please note that information for the UTC400 fuel cell with hot-water heat recovery is shown for
illustration only. It is too large (i.e. too much electrical output) for the University Heights
location.
Gas-Fired Reciprocating Engine Generator
Description Units
Typical Gas-Fired
Recip Engine
Equipment/Project Capital Cost $ 1,250,000 Gross Power kW 250 Aux Power (engine & auxiliaries) kW 25 Net Power kW 225 Fuel Consumption (HHV) (long-term average) mmbtu/hr 1.89
Thermal Heat (recovery) mmbtu/hr 0.67 CHP Comments (this analysis assumes all available thermal heat can be utilized, which is not proven yet)
external CHP
system
Simple Economic Summary - with $12.85 gas and 12.1 c/kW.hr
Electrical Cost Savings $ 228,951 Thermal Fuel Savings $ 90,503 Fuel Cost $ -204,240 O&M Cost (staffing ignored) $ -22,706 Annual Savings $ 92,509 Payback years 14
Simple Economic Summary - with $5.00 gas and 15.0 c/kW.hr
Electrical Cost Savings $ 283,824 Thermal Fuel Savings $ 35,215 Fuel Cost $ -79,471 O&M Cost (staffing ignored) $ -22,706 Annual Savings $ 216,863 Payback years 6

UVM Campus Renewable Energy Feasibility Study CHP / Cogeneration
18
The above payback analysis shows that with low fuel prices and high electricity prices, a
reciprocating engine generator with hot-water heat recovery could have a fairly good payback.
With gas prices and electricity prices near their current levels, the payback period for an engine-
generator CHP package could be deemed too long.
5.0 Summary
Two potential opportunities for CHP/Cogeneration on the UVM Campus have been identified
and examined in this Renewable Energy Feasibility Study, the Cage Heating Plant and University
Heights:
5.1 Cage Heating Plant Cogeneration Opportunity
A new 4.6 MW CHP/Cogeneration plant at the Cage Heating Plant, providing electricity to nine
UVM large-load buildings, and displacing a good percentage of the heating plant steam
production, was examined in considerable detail by WMG in year-2006.
Even though two new buildings (for a total of eleven buildings) have been added to the potential
electrical distribution system, an initial year-2012 review of the energy parameters leading to
the WMG size decision indicates that a smaller plant with a nominal 3.5 MW gas-fired GTG with
a gas-fired HRSG may be a better choice for the present campus, considering the building and
steam distribution energy efficiency improvements that have been made by UVM in the past
decade.
The authors confirm the WMG 2006 technical opinion that such a cogeneration plant could be
constructed and interconnected at the Cage Heating Plant, subject to some technical details to
be worked out (e.g. BED ability to provide a ~5 MW feed to a 13.8 kV switchboard; gas supply
modifications by Vermont Gas; various equipment relocations; an appropriate design of an
electrical distribution network; exhaust breeching interconnection, controls integration, etc.).
Based upon UVM staff comments, there remain significant commercial hurdles that affect the
economics of such a cogeneration project, including BED standby charges; BED requirement for
a minimum 300 kW draw from their system; and/or BED acceptance of connecting Davis and
Jeffords to cogeneration. In addition there could be a potential need for UVM to contribute

UVM Campus Renewable Energy Feasibility Study CHP / Cogeneration
19
financially to Vermont Gas and/or BED for gas and/or electrical feeder upgrades.
The total-installed cost of the smaller 3.5 MW cogeneration system discussed herein is more
expensive than that derived in the WMG 2006 study, as would be expected due to labor,
material and construction cost escalation since then.
Based on a preliminary economic analysis similar to that in the WMG 2006 cogeneration study,
or based on a 1st-year annual savings / payback analysis, the economics of a 3.5 MW
cogeneration plant shows that with low fuel prices and high electricity prices, there could be a
fairly good payback. With natural gas prices and electricity prices near their current levels, the
payback period is longer, but could still be deemed to be favorable.
A more detailed technical analysis of the potential cogeneration project; and commercial
discussions with BED and Vermont Gas regarding costs and offsets would undoubtedly refine
this preliminary conclusion. Further examination may be warranted.
5.2 University Heights Cogeneration Opportunity
The six new student housing buildings at University Heights represent an annual average
electrical load of about 250 kW, and they utilize steam for hot-water heating and absorption
chilling.
In this relatively-small size range, hot-water generation CHP configurations alternatives,
including micro-turbines with integrated or non-integrated CHP; fuel cells with and without CHP;
and a reciprocating engine generator with hot-water heat recovery were examined.
The preliminary performance and economic analysis necessarily assumed at this stage that the
thermal output from the alternatives could be utilized all year-round (which will most likely not
be the case), and that there were no additional staffing costs and BED standby charges (neither
of which are expected to be the case).
The preliminary analysis indicates that for scenarios where the gas price was relatively low and
the avoided electricity costs are high:

UVM Campus Renewable Energy Feasibility Study CHP / Cogeneration
20
• Small micro-turbine generator packages in the 65 to 200 kW range, with CHP (i.e.
hot-water heat recovery) are a possible candidate to off-set some portion of the
electrical load, and to offset a good portion of the hot-water heating load (but not
the absorption chilling load).
• Fuel cells with CHP (i.e. hot-water heat recovery) are a potential candidate.
However, the SOFC fuel cell used in the analysis was too big (400 kW) for the
University Heights location (discussed further in the Fuel Cells section of this
Renewable Energy Feasibility Study report).
• A gas-fired nominal 250 kW reciprocating engine generator with hot-water heat
recovery may be a good alternative. These systems are inherently “noisier” and will
take up more space than a micro-turbine or fuel cell.
• Fuel cells without heat recovery are not a viable candidate, as they do not have CHP
and thus do not offset boiler plant fuel costs.
For scenarios where gas price was high and avoided electricity cost was similar to today, micro-
turbines, fuel cells or gas-fired reciprocating engines do not appear to be good candidates at
University Heights, as their payback periods could be deemed too long.

UVM Campus Renewable Energy Feasibility Study
Wind
Wind
1.0 Introduction to Wind Turbines
1.1 Power from the Wind The energy of the wind can be converted to electrical power by several means. In most cases
mechanical energy caused by the wind spinning the turbine is converted into electrical energy. These
systems either use drag or lift to generate power. Drag based systems, such as the Savonius style wind
turbines, are generally simpler. They are designed to be pushed by the wind, which means they can
never spin faster than the speed of the wind. This limits their maximum speed and power generation.
Lift systems use aerodynamic principles, similar to the wing of an airplane, to generate motion. They
have the ability to spin much faster than the speed of the wind. The tip speed ratio (TSR) is the ratio
between the speed of the tip of the turbine blades and the relative velocity of the wind flowing through
the blades. For most lift based systems, a bigger TSR results in a greater power coefficient. The power
coefficient is the ratio between the energy produced by the turbine and the energy in the wind. All wind
turbines are limited to a maximum power coefficient called the Betz limit, which is approximately
59.26%. Figure 1 compares the power coefficient and TSR of several common models of lift wind
turbines.

2
Figure 1: Power Coefficient versus TSR for various types of wind turbines (Bitsch et al. 2)
1.2 Types of Lift Wind Turbines
There are two main types of lift generating wind turbines, those which rotate around a
horizontal axis (HAWT), and those which rotate around a vertical axis (VAWT). For large commercial
installations, HAWTs have been found to be more efficient, with bigger power coefficients at higher
TSRs. For small wind turbines with a TSR less than six, VAWTs are often found to be equally efficient.
This study will compare five VAWTs and five HAWTs so that both types of technology can be explored.
Turbines come in many shapes and sizes, so determining which turbine is the best is often decided by
where the turbine is being installed, not the overall efficiency. Certain turbines are designed for specific
wind characteristics or locations, and this will directly affect their electricity output.

3
1.3 Wind Turbine Components The design of wind turbines vary widely depending on axis orientation, number of blades, and
size. However the main components of a turbine remain the same. Turbines are always mounted on a
tall pole called a tower. Attached to the top of the tower is the nacelle, which houses the electricity
generating system that is either a generator or an alternator. Some VAWTs have their nacelle at the
base of the tower to allow for easier maintenance. The nacelle connects to the rotor which holds the
blades that harness the power of the wind. On horizontal axis units there is either a tail or a yawing
mechanism attached to the nacelle to ensure that the blades are facing directly into the wind. Vertical
axis turbines do not need this because they can always capture wind from all directions. Figure 2 shows
a comparison of a standard HAWT and a Darrieus VAWT.
Figure 2: Main components of wind turbines (Colonize 1)
1.4 Determining the Optimal Installation Location
Proper placement of wind turbines is the most important factor to ensure maximum energy
production. Most wind turbines are designed for ideal performance when the wind approaching them is
of great quantity and quality. Quantity of the wind is the wind speed. Ideal wind speeds are those that
are consistently between the wind turbine’s cut-in and cut-out speed. The quality of the wind describes
the flow. If the wind is unidirectional and has a constant velocity profile, then is of very high quality.
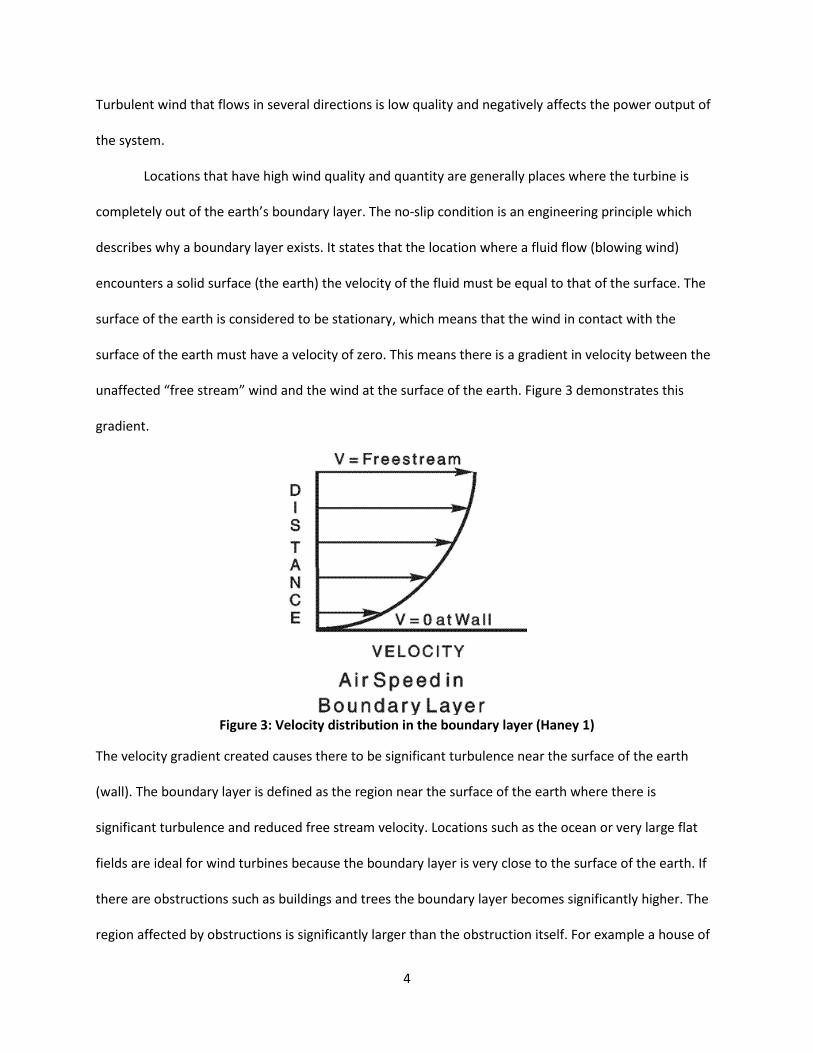
4
Turbulent wind that flows in several directions is low quality and negatively affects the power output of
the system.
Locations that have high wind quality and quantity are generally places where the turbine is
completely out of the earth’s boundary layer. The no-slip condition is an engineering principle which
describes why a boundary layer exists. It states that the location where a fluid flow (blowing wind)
encounters a solid surface (the earth) the velocity of the fluid must be equal to that of the surface. The
surface of the earth is considered to be stationary, which means that the wind in contact with the
surface of the earth must have a velocity of zero. This means there is a gradient in velocity between the
unaffected “free stream” wind and the wind at the surface of the earth. Figure 3 demonstrates this
gradient.
Figure 3: Velocity distribution in the boundary layer (Haney 1)
The velocity gradient created causes there to be significant turbulence near the surface of the earth
(wall). The boundary layer is defined as the region near the surface of the earth where there is
significant turbulence and reduced free stream velocity. Locations such as the ocean or very large flat
fields are ideal for wind turbines because the boundary layer is very close to the surface of the earth. If
there are obstructions such as buildings and trees the boundary layer becomes significantly higher. The
region affected by obstructions is significantly larger than the obstruction itself. For example a house of

5
height H, is alone in a very large windy field with no other buildings. The region affected by the house is
approximately 2H upwind of the building and 20H downwind of the house. The affected region is also at
least 2H high as shown in figure 4. Therefore it is best to place turbines far away from obstructions
otherwise they will need to be significantly taller in order to not affected by the obstruction
Figure 4: Disturbance in wind caused by obstructions (Wind(3) 1)
1.5 Wind Mapping Wind mapping is the best strategy to determine a location’s feasibility for a wind turbine. To
obtain accurate wind speed and direction data, a wind measurement tower must be installed for a
substantial period of time. A longer time period is better since it will yield a more accurate wind pattern.
Even if a location has minimal obstructions it still needs to have significantly fast average wind speeds in
order to be a viable location for wind turbines. Mapping to determine if wind is consistently strong is
paramount. Strong gusts of wind do not produce very much power, compared to a steady flow. Wind
mapping tools also determine the dominant wind direction which can be important for siting turbines
that will best avoid downwind obstructions. A turbine can be sited closer to an obstruction when the
obstruction is downwind of the turbine. A less accurate method to determine a location’s wind pattern
is to generate a computer model using geographic and meteorological data. This method is much
cheaper and takes significantly less time than installing anemometers on a wind tower. These results can
be used to determine if further investigation into a site’s wind potential is worthwhile.

6
1.6 Power versus Energy The difference between power and energy is very important when analyzing any energy system.
Power is a rate, it describes how much energy is consumed or produced over time. Energy is a quantity;
it can describe the amount of power consumed. The units for power are Watts whereas energy is
Joules, or the more commonly used Watt hour. A Watt hour is one Watt of power produced or
consumed for one hour. For example a light bulb with a power rating of 60 Watts that is turned on for
10 hours will consume 600 Watt hours or .6 Kilowatt hours (kWh).
1.7 Power Output The energy a wind turbine can produce is related to the power in the wind based on the power
coefficient. The power of the wind is based on three variables; air density, swept area and wind speed.
The equation for power in the wind is:
𝑃𝑜𝑤𝑒𝑟𝑤𝑖𝑛𝑑 = .5 ∗ 𝐴𝑟𝑒𝑎𝑠𝑤𝑒𝑝𝑡 ∗ 𝐷𝑒𝑛𝑠𝑖𝑡𝑦𝑎𝑖𝑟 ∗ 𝑉𝑒𝑙𝑜𝑐𝑖𝑡𝑦𝑤𝑖𝑛𝑑3
Velocity being a cubic function is the most important factor ensuring significant energy
production. Doubling the average wind speed, will yield eight times more energy production. Air density
can be assumed approximately constant unless the turbine is installed at very high elevation or the wind
speed is very high. Having such a high average wind speed will yield a significantly larger velocity factor
which will outweigh the drop in density. The swept area for a HAWT is a circle, so doubling the radius
will quadruple the area. This is why large scale turbines have such long blades. VAWTs have a
rectangular swept area with sides of the radius and height of the turbine. Doubling either the radius or
the height of a VAWT will only double the swept area. This is one of many reasons why only HAWTs are
constructed on a large scale.
A high average wind speed is the most important aspect of turbine placement because it scales
so dramatically. The power of the wind equation does not take wind quality into account. Wind quality is
a scalar that can be described as a percentage, and can be included when calculating energy production.

7
Since energy production is a quantity, it is normalized to one year to compare various energy systems.
The wind quality scalar can be included in the equation that calculates the annual output.
The Weibull distribution curve is a very important factor when calculating the power output
based on average wind speed. A Weibull distribution is a standard probability distribution that describes
the likeliness of an occurrence based on the average. It describes the shape of the distribution curve for
wind speeds. This is the likeliness that the wind will be at a given wind speed compared to the average.
Comparing the Weibull distribution of wind speed with the turbine’s power curve will help determine
the annual energy generation. Generally it is assumed that a standard Weibull distribution can be
applied.
1.8 Wind Turbine Power Curves All wind turbines have a unique power curve that demonstrates the turbine’s power output at a
given wind speed. The wind speed at which a turbine begins to generate power is called the ‘cut-in wind
speed’. As the wind speed increases the curve follows an exponential increase until the turbine’s rated
wind speed. The rated wind speed is the point at which the turbine is extracting the most power from
the wind. The amount of power that the turbine can extract at this wind speed is the listed power that
turbine manufacturers use to compare turbines. For example the Northern Power Systems 100 is rated
at 100 kW. This number means very little other than as a reference, to frame the turbine’s size
compared to other models. Figure 5 highlights the important characteristics of a wind turbine power
curve.
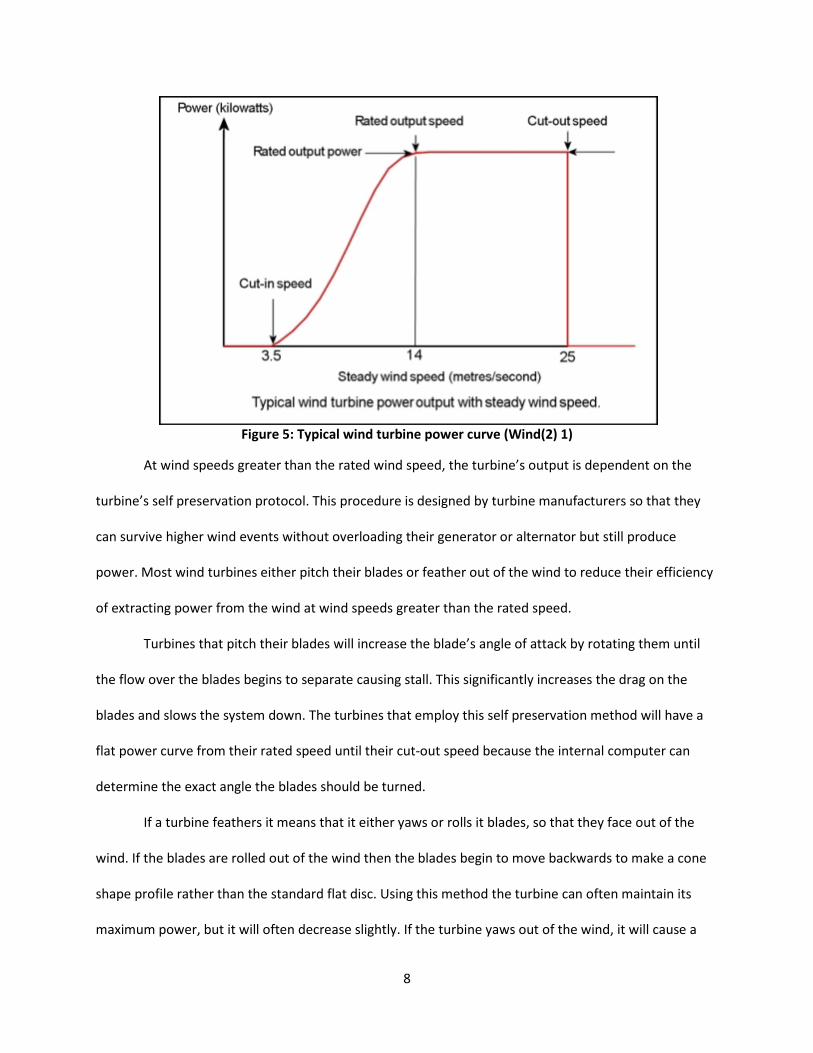
8
Figure 5: Typical wind turbine power curve (Wind(2) 1)
At wind speeds greater than the rated wind speed, the turbine’s output is dependent on the
turbine’s self preservation protocol. This procedure is designed by turbine manufacturers so that they
can survive higher wind events without overloading their generator or alternator but still produce
power. Most wind turbines either pitch their blades or feather out of the wind to reduce their efficiency
of extracting power from the wind at wind speeds greater than the rated speed.
Turbines that pitch their blades will increase the blade’s angle of attack by rotating them until
the flow over the blades begins to separate causing stall. This significantly increases the drag on the
blades and slows the system down. The turbines that employ this self preservation method will have a
flat power curve from their rated speed until their cut-out speed because the internal computer can
determine the exact angle the blades should be turned.
If a turbine feathers it means that it either yaws or rolls it blades, so that they face out of the
wind. If the blades are rolled out of the wind then the blades begin to move backwards to make a cone
shape profile rather than the standard flat disc. Using this method the turbine can often maintain its
maximum power, but it will often decrease slightly. If the turbine yaws out of the wind, it will cause a

9
significant decrease in power output until the cut-out power speed. This is because the turbine is forced
to face a direction other than directly upwind.
Turbine manufacturers will use one or all three of these methods to control the turbine at
speeds above their rated wind speed. Yawing the blades is the simplest method, but has the worst
power output. Most current commercial turbines use a combination of rolling and pitching their blades
to slow down, but maintain maximum power. Many blades naturally flex backwards due to their design
for significant stress deformation without permanent strain on the blades. This means that they can roll
out of the wind without needing any additional mechanical functionality. If a turbine is not regulated
above its rated wind speed it can spin out of control and cause serious damage to its internal power
generation systems.
The cut-out speed is when wind is so strong that the turbine must apply its emergency braking
system. At this wind speed, even the methods for controlling the turbine output cannot fully protect the
unit so it automatically initiates the brake. At this wind speed the turbine no longer generates any
power. Instead it consumes power to use its dynamic braking system. This system sends electricity into
the magnets that normally generate power to create two repulsive electric fields causing the turbine to
slow down and eventually stop. Additionally the turbine will often yaw so that the blades are parallel to
the wind in order to minimize the stress on the tower. Most turbines will not return to power
generation until the wind speed lowers to a safe level below the rated speed. The survival wind speed is
the maximum wind speed that a turbine can sustain before it will likely experience a critical structural
failure. If a turbine fails to brake itself in a high wind event, then it is called a runaway turbine. These
events are very rare on larger turbines, but they generally result in the turbine destroying itself.

10
2.0 Wind Feasibility at the University of Vermont
2.1 Preliminary Wind Mapping Wind Analytics was hired to complete a study of the wind potential on UVM’s campus. Nine
locations around campus were chosen to have this study completed. Six of these were in the fields
surrounding the Miller and Bio-Research Complexes. Studies were also completed for the area west of
Living and Learning, west of Bailey Howe and in Centennial Woods. All nine locations were found to be
category 1 wind at 30m above the surface of the earth. This means the average wind speed was below
11.6 mph. The location south of the Miller farm had the highest average wind speed of 10.9 mph and
Centennial Woods had the lowest at 9.8 mph. Having such low average wind speeds means wind
turbines are likely not feasible anywhere on campus. Low wind speed means that the energy output of
the turbine will be very low, which means the payback period will be very high. The report below will
complete analysis of one larger wind turbine and ten smaller turbines. All analysis will assume a 5 m/s
average wind speed which is approximately 11.2 mph.
2.2 Reasons for Low Average Wind Speed Based on topography of the university’s campus, low wind speeds were expected. Despite
residing on a hill overlooking a lake, most of campus is either highly developed with buildings or heavily
forested. The few locations that are open clear spaces which lower the boundary layers are the fields
surrounding the Miller and Bio-Research Complexes. They are the locations with the highest average
wind speeds. Unfortunately most of these fields are surrounded on all sides by tall trees. Therefore all of
these fields are locations with very high boundary layers due to those trees. In order to bring the turbine
outside of the boundary layer the tower would require a hub height that is greater than 50 meters.
Another reason campus has a low average wind speed is that Vermont is not a very windy place.
Compared to places in the Midwest or along the coast of the US, Vermont is relatively calm. Figure 6
shows a wind resource map of the entire United States. This map outlines the approximate average
wind speed at 50m above the surface of the earth.

11
Figure 6: Wind resource map of the US
3.0 Incentives for Wind Turbine Installations in Vermont There are several incentives for installing wind turbines in the state of Vermont. UVM is a non-
profit so the state and federal tax rebates do not apply and purchasing a wind turbine in Vermont is tax
free as part of the State Sales Tax Incentive. UVM does, however, qualifie for the special category in the
Vermont Small Scale Renewable Energy Incentive Program. This is the major incentive that will make a
significant contribution to the payback period. This means that the University could receive $1.20 per
kWh produced by the wind turbine with a maximum incentive of $455,000. This money would be paid in
two batches. Initially the university would receive 60% of the presumed total payment; for example if a
turbine is supposed to yield 10,000 kWh per year the program would pay . 6 ∗ 10,000 ∗ $1.20 or $7,200
the first year. In the second year the University would receive the remaining 40%, if the turbine

12
produces the amount of power it is calculated to produce. If instead it produced only 9000 kWh, then
the university would receive (9,000 ∗ $1.20) − $7,200 or $3,600. If the turbine produced the full
10,000 kWh then the University would receive $4,800.
Vermont has community net metering, which means that the turbine could produce power that
is net metered with any building on campus, provided they are using the same power utility and in the
same electric district. This means that when the turbine is producing power it spins the buildings meter
backwards and when the turbine is not producing power the meter runs normally. There are currently
no Renewable Energy Credits for wind power in Vermont.
4.0 Larger Wind Turbine Feasibility analysis was completed for a Northern Power Systems 100-24 wind turbine. This
turbine has a hub height of 37 meters and a 24 meter rotor diameter. It is rated at 100 kW at a wind
speed of 14 m/s. The turbine has a cut-in wind speed of 3.0 m/s, cut-out wind speed of 25 m/s and a
survival wind speed of 52.5 m/s. Compared to the slightly smaller Northern Power Systems 100-21 it has
a 31% increase in swept area. Based on results from CHA’s New York State Thruway project, the 24
meter turbine yields about a 15% increase in energy output compared to the 21 meter turbine. This
means at 5 m/s average wind speed the turbine should yield approximately 170 MWh per year. Figure 7
shows the Northern Power Systems 100-21 wind turbine that was installed above the Vista Quad Lift at
Bolton Valley Ski Area in 2009.

13
Figure 7: Northern Power Systems 100 kW turbine at Bolton Valley Ski Area (Darlow)
Attached to this report is a cost estimate and cash flow analysis for the turbine. The total project
cost would be approximately $640,000. It would be able to generate about 25% of the demand for the
entire Miller Research Complex. Based on the cash flow analysis, the project will have an 18 year
payback period. This payback is extremely dependent on the output. Unlike some solar PV systems in
which incentives are based on installed capacity, wind power incentives are completely dependent on
the output. This is why only 60% of the small scale renewable energy incentive is paid out in the first
year. It is possible to receive the full value of the remaining 40% only if the turbine produces the amount
of power that it was supposedly rated to produce.

14
5.0 Small Scale Wind Turbines There are many designs of small scale horizontal and vertical wind turbines. Below is a
comparison of five models of HAWT and five models of VAWT . These various models range in size,
price, and power output greatly; however analysis will be very holistic. The HAWT models are:
Architectural Wind, Swift Wind, Honeywell WT 6500, Skystream 3.7, and Ampair 6000. The VAWT
models are: Wind Smile, Twister 1000, Windspire, Turby, and Quiet Revolution 5. The tables below
show some fundamental specifications of the various models, The turbines are ordered from smallest to
largest in terms of rated power as can be seen in the first row. Cells that are highlighted green show the
models that are best in their class, and red cells are worst in their class.
Table 1: Small Scale Horizontal Axis Wind Turbine Comparison
HAWT
Architectural
Wind Swift Wind Honeywell WT
6500 Skystream 3.7 Ampair 6000 Max Power 1000 W 1500 W 2200 W 2400 W 6000 W
AEP 800 kWh 1200 kWh 800 kWh 3500 kWh 8500 kWh Cut In Speed 2.2 m/s 3.58 m/s .9 m/s 3.0 m/s 3.5 m/s Rated Speed - 12.5 m/s 17m/s 13 m/s 11 m/s
Survival Speed 54 m/s 64.8 m/s 62.6 m/s 63 m/s 63 m/s Rotor
Diameter - 2.13 m 1.8 m 3.72 m 5.5 m Swept Area 2.6 m^2 3.56 m^2 2.53 m^2 10.87 m^2 23.76 m^2 Noise Level Low Very Low Very Low Low Medium Low Mounting Bldg Bldg/Grnd Bldg/Grnd Grnd Grnd UL 1741 Yes Yes Yes Yes Yes
SWCC No No No Yes No Country of
Origin USA USA USA USA UK Unit Cost $14,400.00 $8,500.00 $7,500.00 $14,000.00 $21,000.00 Total Cost $26,100.00 $20,100.00 $19,100.00 $25,700.00 $32,800.00
Payback Years 216.6 107.1 155.9 42.3 18.4

15
Table 2: Small Scale Vertical Axis Wind Turbine Comparison
VAWT Wind Smile Twister 1000 Windspire Turby Quiet Revolution 5
Max Power 1000 W 1200 W 1200 W 2500 W 6500 W AEP 800 kWh 1200 kWh 1500 kWh 4000 kWh 4200 kWh
Cut In Speed 2.5 m/s 3.5 m/s 3.8 m/s 3 m/s 5 m/s Rated Speed 13 m/s 12 m/s 11 m/s 14 m/s 16 m/s
Survival Speed 60 m/s 50 m/s 47 m/s 55 m/s 47 m/s Rotor Diameter 1.5 m 1.9 m 1.2 m 2.65m 3.1 m
Swept Area 3.75 m^2 3.61 m^2 7.32 m^2 7.95 m^2 15.5 m^2 Noise Level Very Low Very Low Low Very Low Very Low Mounting Bldg/Grnd Bldg/Grnd Grnd Bldg/Grnd Bldg/Grnd UL 1741 Unknown Unknown Yes Unknown Yes SWCC No No No No No
Country of Origin Japan Germany USA Netherlands UK
Unit Cost $18,750.00 $11,000.00 $5,000.00 $15,000.00 $38,800.00 Total Cost $30,500.00 $22,600.00 $16,500.00 $26,700.00 $51,000.00
Payback Years 254.9 121.7 67.6 37.8 75.4
In general it appears that the larger models, while more expensive yield the most energy per
dollar spent. This is a trend that scales up to commercial sized wind turbines. As discussed with the
Northern Power turbine, the annual energy production (AEP) of a wind turbine is the most important
factor in ensuring a minimal payback period. The payback analysis for these units uses the AEP that the
turbine manufacturers provided for 5 m/s average wind speed. The total cost includes the approximate
cost for engineering and installation for a single unit. Constructing multiple units will reduce the
installation cost per unit greatly. The unit cost will decrease for many of the models only if five or more
are purchased. The turbines that are manufactured outside of the United States may have additional
shipping charges and taxes associated with them that are not included. They may also require installer
training to be properly installed. The prices listed for turbines manufactured abroad are also based on
the exchange rates on July 5, 2012.

16
6.0 Suggested Installation Locations As stated before the best location for the larger Northern Power Systems 100 kW turbine is the
fields to the south of the Miller Research Farm. The smaller turbines are also most likely best suited for
this location as well. They will need to be mounted on top of towers that should be at least 30 meters
tall. Many of the turbine manufacturers produce towers that are only 10 meters tall in addition to taller
20 and 30 meter towers. This may be appropriate for the ocean where the boundary layer can be as low
as a meter off the surface, but on land generally the shortest a tower can be to be completely above the
boundary layer is 15 meters. On UVM’s campus with all the trees and buildings a 30 meter tower is
probably the minimum height that the tower should be, and if possible a taller tower would be better.
Mounting small turbines on buildings is also a possibility. UVM’s campus has many tall buildings
that could be suitable for a turbine. There are many important considerations when mounting a turbine
on a building that are not necessary for a tower mounted on the ground. As stated before the turbine
can cause vibrations that can be disturbing to the building occupants. Therefore it is not recommended
to install a turbine on a building where people are sleeping such as a residence hall. Academic buildings
make for a much better option since they are seldom used at night when the wind is often strongest.
Additionally these buildings should be tested for acoustic effects of that the turbine may cause, so as to
not disturb the occupants. Many building roofs are not designed for the stress caused by a wind turbine.
A structural engineer must be consulted to determine if the roof can withstand the loading from the
turbine and if not the roof may need to be reinforced. As with the ground mounted turbines, the tower
must be tall enough that the turbine is above the boundary layer. Installing a turbine on a tall roof but
not placing it on a tall enough tower will mean that the building is shielding the turbine from the wind.
Some turbine manufacturers such as AeroVironment Inc, claim that the building creates an up
draft that their turbines take advantage of to generate higher than average wind speeds. This theory has
yet to be proven, so it is important to make sure turbine manufacturer’s claims are validated by either
third party testing organizations or other installations. Other theories claim that turbines can take

17
advantage of the “corridor effect” caused by wind flowing in between tall buildings. This wind is highly
turbulent which means it is low quality and not good for energy generation. Additionally UVM’s campus
has few buildings that are large enough or close enough together to make a significant corridor.
The buildings on campus which may have suitable roof spaces are: Waterman Building, Jeanne
Mance Hall, Mann Hall, Jeffords Hall, and Coolidge Hall. These buildings all have large flat roof spaces
that are taller than all obstacles around them. Further analysis will require the generation of a wind rose
for each location. A wind rose shows the probability of strong wind coming from a particular direction. It
is important that wind from that direction has a minimal amount of obstructions. Waterman also can
take advantage of being situated on a hill and it is very tall compared to adjacent buildings. It does have
very limited flat roof space which could be a problem. Jeffords Hall is near the existing turbine so the
local wind strength it likely known. It is shielded by the Davis Center to the west which may reduce its
potential. Mann Hall is far removed from the hill so it likely does not benefit from terrain but instead is
in the deceleration zone behind the hill. There are some potential locations for building mounted wind,
however further analysis is required for all locations.
7.0 Certifications When considering small turbine models there are a few certifications that should be met by the
design. In order to connect the turbine to the grid and net-meter the electricity the inverters must be UL
1741 approved. This means that the inverter has gone through third party testing at the Underwriters
Laboratory and passed the necessary tests. Some small wind turbine models use proprietary technology
to optimize their power output. Without the certification the electricity that a non- approved inverter
generates cannot be net-metered and the incentives associated cannot be used. Two other important
certifications are the American Wind Energy Association (AWEA) and the Small Wind Council
Certification (SWCC). These organizations provide standards that the turbines must meet in ordered to
receive certifications. The SWCC is a fairly new certification, so many of the manufacturers are currently

18
pursuing this standard. Of the turbine’s outlines only Southwest Windpower’s Skystream 3.7 has the
SWCC. In order to receive the SWCC the turbine must also meet AWEA standards. Having this
certification ensures a higher degree of confidence that the turbine is designed to perform as the
manufacturer claims.
8.0 Important Considerations The turbines listed above vary from the highly theoretical Architectural Wind or Windspire, to
the well documented like the Skystream 3.7. There is an important distinction to be made from the
turbine spinning to generating power. The Velco Twister starts to spin at 1.5 m/s but does not start
generating power until a wind speed of 3.5 m/s. The Honeywell turbine is the epitome of this marketing
strategy. It starts spinning at .5 mph but it does not generate its peak power of 2.2 kW until a wind
speed of 38 mph. Since power and wind speed has a cubic relationship, a 19 mph wind speed yields only
275 W, and a 9.5 mph wind speed yields a measly 34.4W. If this is extrapolated down to the wind speed
at which it starts to turn, it is producing less than .007W. Swift Wind makes far more conservative
claims. It has a relatively high cut-in speed and at an average wind speed of 5 m/s a relatively low AEP.
Additionally it has examples of installations on their website such as on top of the Corning Building in
Ithaca, New York. If there is further interest in the Swift wind turbine it would be easy to gather results
from a currently operational building mounted wind turbine study. Windspire makes similar claims, and
has pictures of installations on the Adobe Building in San Jose, however they do not offer results to
reinforce their claims.
Large electricity generating VAWTS were first constructed in the 1920s several years before
HAWTs. The new concepts that companies are marketing are often old designs made with newer, better
materials. This is the primary reason why urban wind farms do not exist. The lack of VAWTs is not due to
a new concept, but instead it is because they have time and again failed to yield the same output of
HAWTs at a commercial scale. VAWTs often have trouble with self starting, and do now work as well

19
when mounted on tall towers, which are required to bring them above the boundary layer. It is possible
in the near future that a revolutionary change in design can yield the answer to more efficient VAWTs,
but it is best to remain conservative with decisions about wind turbine installation.
All turbines should be inspected at least once a year by a professional. Many turbines are
designed to last 20-25 years without needing to replace any critical parts. It is still a good idea to make
sure that all the bearings are well lubricated and the electronic components are in proper working
order. This servicing is a preventative maintenance so that a critical failure does not happen and that the
turbines last as long as their manufacturer’s claim. The wear on a productive turbine’s bearings and
rotors in a year is the equivalent to a car driving approximately 200,000 miles. Cars are barely expected
to last that long, and in that time they require being serviced many times.
9.0 Conclusion and Next Steps There are many types of wind turbines on the market that are designed for a wide variety of
applications. UVM does not have a very high wind potential, which severely limits turbine output. This
creates a very long payback period, 18 years for both the Ampair 6000 and the Northern Power Systems
100-24. It is paramount that the turbine be on a tower tall enough that the turbine is above the
boundary layer. This will be most easily done in one of the fields surrounding the Miller and Bio
Research Complexes. The field with the best potential is the one directly south of the Miller Research
Complex. There may be potential for small building mounted wind turbines to be installed on one of the
University's buildings, but this would require significant structural engineering to ensure that the
building could support the loading, and that the turbine would be able to be installed in good wind
regime.
If wind power is something that the University wishes to pursue, the next step is to have a more
in-depth wind analysis of the location(s) that wind turbines are desired. The first step would be a more
advanced report from Wind Analytics that includes a wind rose including Weibull distribution, and a map

20
with the best wind resources. For more accurate information, a wind anemometer tower can be
purchased from a company like NRG. NRG makes towers ranging in height from 34-80 meters tall that
can be stacked with anemometers and other measuring devices to give real time wind data. These
towers are a guaranteed way to determine the wind resource at a specific location.

21
Appendix
Wind Turbine Fact Sheet
Horizontal Axis Wind Turbines
Architectural Wind Manufacturer: AeroVironment Website: http://www.avinc.com/engineering/architecturalwind1/ Country: USA Blade Diameter: 1.83 m Number of Blades: 3 Cut in speed: 2.2 m/s Rated Speed: Cut out speed: Survival Speed: 54 m/s Voltage: Max Power: 1 kW per turbine (Sold as an array of 12 units = 12 kW total) Annual Energy Production (AEP): 800 kWh UL 1741 Approved: Yes Small Wind Council Certification: No Noise Level: very low Price with Canopies: $172,800 Price without Canopies: $134,400 Mounting System: Building

22

23
Swift Wind Manufacturer: Cascade Engineering Inc. Website: http://www.swiftwindturbine.com/ Country: USA Blade Diameter: 2.13 m Number of Blades: 5 Cut in speed: 3.58 m/s Rated Speed: Cut out speed: 20.1 m/s Survival Speed: 64.8 m/s Voltage: 240 VAC Max Power: 1500 W Annual Energy Production (AEP): 1200 kWh UL 1741 Approved: Yes Small Wind Council Certification: No Noise Level: very low Price: $8500 Mounting System: Building, Ground

24
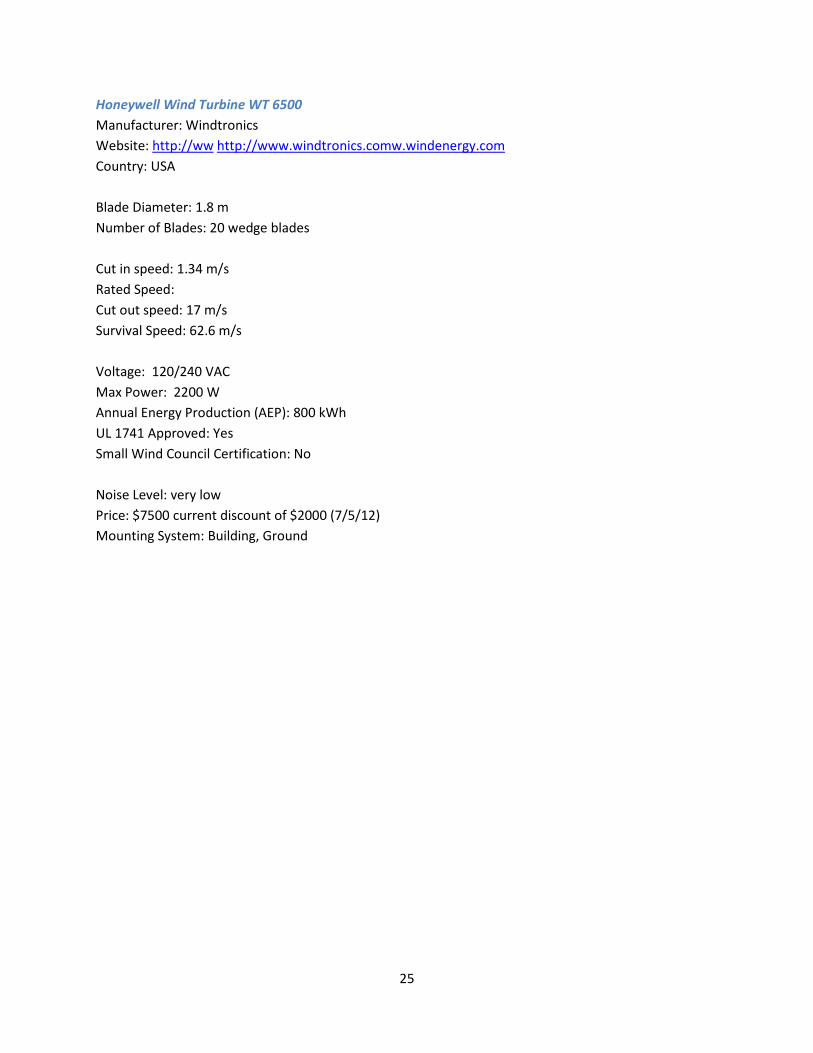
25
Honeywell Wind Turbine WT 6500 Manufacturer: Windtronics Website: http://ww http://www.windtronics.comw.windenergy.com Country: USA Blade Diameter: 1.8 m Number of Blades: 20 wedge blades Cut in speed: 1.34 m/s Rated Speed: Cut out speed: 17 m/s Survival Speed: 62.6 m/s Voltage: 120/240 VAC Max Power: 2200 W Annual Energy Production (AEP): 800 kWh UL 1741 Approved: Yes Small Wind Council Certification: No Noise Level: very low Price: $7500 current discount of $2000 (7/5/12) Mounting System: Building, Ground

26

27
Skystream 3.7 Manufacturer: Southwest Wind Power Website: http://www.windenergy.com Country: USA/Germany Blade Diameter: 3.72 m Number of Blades: 3 J blades Cut in speed: 3.0 m/s Rated Speed 13 m/s Cut out speed: Survival Speed: 63 m/s Voltage: 120/240 VAC Max Power: 2400 W Annual Energy Production (AEP): 3500 kWh UL 1741 Approved: Yes Small Wind Council Certification: Yes Noise Level: low Price $13,000-14,000 Discount if buying five or more Mounting System: Ground

28

29
Ampair 6000 Manufacturer: Ampair Energy Inc Website: http://www.ampair.com/ Country: United Kingdom Blade Diameter: 5.5 m Number of Blades: 3 blades Cut in speed: 3.5 m/s Rated Speed: 11 m/s Cut out speed: 25 m/s Survival Speed: 63 m/s Voltage: 48 DC or 230 VAC Max Power: 6000 W Annual Energy Production (AEP): 8500 kWh UL 1741 Approved: Yes Small Wind Council Certification: No Noise Level: medium-low Price: $21,000 Plus VAT (based on exchange rate 7/5/12) Mounting System: Ground

30

31
Vertical Axis Wind Turbines
Wind Smile 1kW Generator Manufacturer: Wind Smile Website: http://www.wind-smile.com Country: Japan Height: 2.5 m Blade Diameter: 1.5 m Number of Blades: 4 Straight, with J profile Cut in speed: 2.5 m/s Rated Speed: 13 m/s Cut out speed: Survival Speed: 60 m/s Voltage: 12/24/48 VDC Max Power: 1000 W Annual Energy Production (AEP): 800 kWh UL 1741 Approved: Unknown Small Wind Council Certification: No Noise Level: very low Price: $18,750 (based on exchange rate 7/5/12) Mounting System: Building, Ground

32

33
Venco Twister 1000-T Manufacturer: Venco Power Website: Country: Germany Height: 1.9 m Blade Diameter: 1.9 m Number of Blades: 3 Helical Cut in speed: 3.5 m/s Rated Speed: 12 m/s Cut out speed: 20 m/s Survival Speed: 50 m/s Voltage: Max Power: 1200 W Annual Energy Production (AEP): 1200 kWh UL 1741 Approved: Unknown Small Wind Council Certification: No Noise Level: very low Price: $11,000 Mounting System: Building, Ground

34

35
Windspire Standard Model (Also have a high wind speed model) Manufacturer: Windspire Energy Inc Website: http://www.windspireenergy.com Country: USA Height: 6.1 m Blade Diameter: 1.2 m Number of Blades: 3 Straight Cut in speed: 3.8 m/s Rated Speed: 11 m/s Cut out speed: 12.5 m/s Survival Speed: 47 m/s Voltage: 120 VAC Max Power: 1200 W Annual Energy Production (AEP): 1500 kWh UL 1741 Approved: Yes Small Wind Council Certification: No Noise Level: low Price: $5000 Mounting System: Ground

36

37
Turby Manufacturer: Turby B. V. Website: www.turby.nl (not working right now) Country: Netherlands Height: 2.89m Blade Diameter: 2.5 m Number of Blades: 3 Helical Cut in speed: 4 m/s Rated Speed: 14 m/s Cut out speed: 14 m/s Survival Speed: 55 m/s Voltage: 240 VAC Max Power: 2500 W Annual Energy Production (AEP): 4000 kWh UL 1741 Approved: Unknown Small Wind Council Certification: No Noise Level: very low Price: $10,000-$15,000 Mounting System: Building, Ground

38
Video: http://www.youtube.com/watch?feature=player_embedded&v=Hzz609KMtvE

39
Quiet Revolution 5 Manufacturer: Quiet Revolution Ltd Website: http://www.quietrevolution.com/ Country: United Kingdom Height: 5 m Blade Diameter: 3.1 m Number of Blades: 3 Helical Cut in speed: 5 m/s Rated Speed: 16 m/s Cut out speed: 26 m/s Survival Speed: 47 m/s Voltage: 230 VAC Max Power: 6500 W Annual Energy Production (AEP): 4200 kWh UL 1741 Approved: Yes Small Wind Council Certification: No Noise Level: very low Price: $38,800 (based on exchange rate 7/5/12) Mounting System: Building, Ground
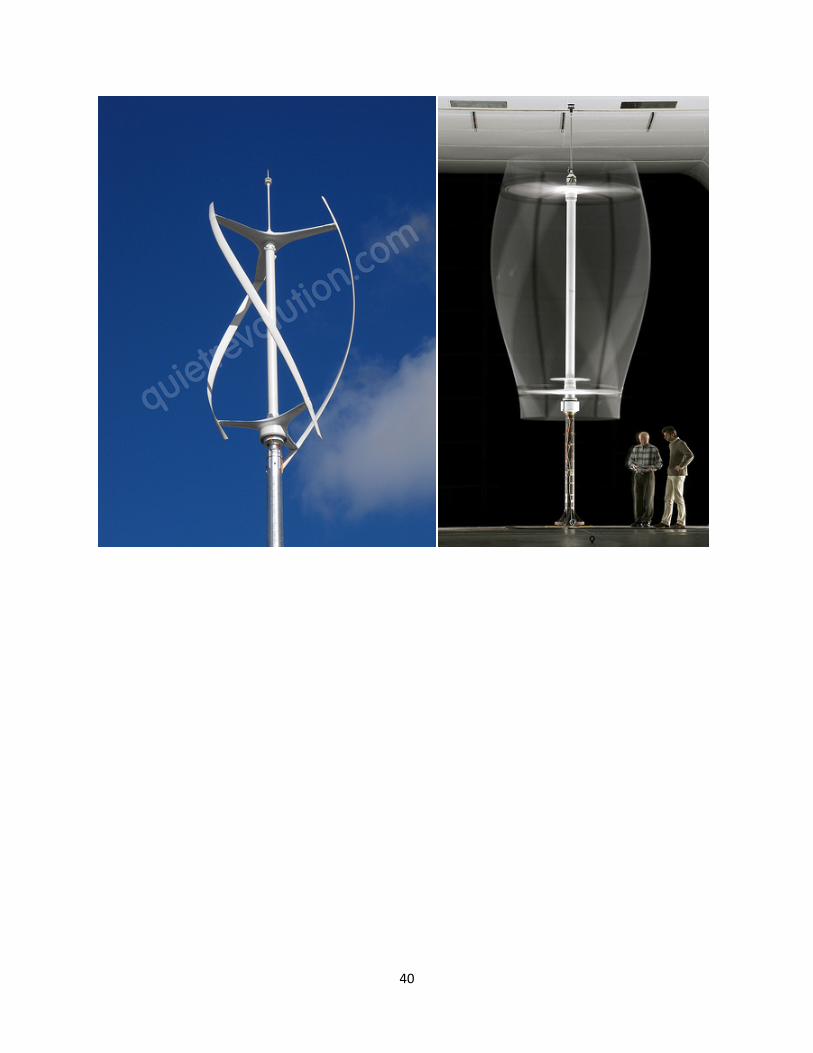
40

41
Works Cited Bitsch, Jens, Ryan Darlow , Jess Grotum Nielsen, Cyril Quéméneur, and Sandro Savino. “Modeling of a Vertical Axis Wind Turbine with Respect to Pitching Angle and Wind Profiles.” BS thesis. Aalborg University, 2011. Print. Bulter, Roy. Personal Interview. 21 July 2012. Caliebe, R. “VENCO-Twister-1000-T.” Venco Power. 14 October 2011. Web. 29 June 2012.
http://sunnysantos.files.wordpress.com/2011/11/venco-twister-1000-t.pdf
Colonize Antarctica. “Vertical Axis Wind Turbines.” Blogger.12 January 2008. Web. 26 July 2012. Darlow, Ryan. “Bolton Valley Wind Turbine.” Photograph. Facebook.com. 27 August 2011. Web. 24 July 2012. “Engineering Services: Architectural Wind.” AeroVironment Inc. n.p. 2012 Web. 26 June 2012.
www.avinc.com/wind/
“Grid Connected Wind Turbines.”Ampair Energy Ltd. n.p. 2011 Web. 29 June 2012. http://www.ampair.com/
Haney, Paul. “Boundary Layer.” Inside Racing Technology. n.p. 2001 Web. 24 July 2012. http://insideracingtechnology.com/tech107bndrylayer.htm “The Honeywell Wind Turbine- Model WT6500.” Windtronics Inc. n.p. June 2011. Web 29 June
2012. http://www.windtronics.com/honeywell-wind-turbine
“The Original Skystream Personal Wind Turbine.” Southwest Windpower. n.p. 2012. Web. 26 June 2012. http://www.windenergy.com/products/skystream/skystream-3.7 “qr5.” Quiet Revolution Ltd. n.p. 2011. Web. 26 June 2012.
http://www.quietrevolution.com/qr5-turbine.htm
“Swift Wind Turbine.” Cascade Engineeing Inc. n.p. 2012. Web. 29 June 2012. http://www.swiftwindturbine.com/pdf/Cascade_SwiftTurbineBrochure.pdf
“Turby VAWT Wind Turbine.” Better Generation Group Ltd. n.p. 2012. Web. 26 June 2012.
http://www.bettergeneration.co.uk/wind-turbine-reviews/turby-vawt-wind-turbine.html “U.S. Wind Resource Map.” United States Department of Energy: Energy Efficiency and Renewable Energy. n.p. 19 October 2011. Web. http://www.windpoweringamerica.gov/wind_maps_none.asp “Vermont: Incentives/Polices for Renewables and Efficiency.”dsireusa.org. n.p. 2012. Web. 23
June 2012. http://dsireusa.org/incentives/index.cfm?re=0&ee=0&spv=0&st=0&srp=1&state=VT

42
“Wind Smile Generator 1kW – 1kW VAWT.” Wind Smile Co. Ltd. n.p. 2012. Web. 26 June 2012. http://www.wind-smile.com/ “Wind turbine power output variation with steady wind speed.”WindPower Program. n.p. n.d. Web. 25 July 2012. http://www.wind-power-program.com/turbine_characteristics.htm “Wind Turbine Site Selections.” Solacity Inc. n.p. 2011. Web 23 July 2012.
http://www.solacity.com/SiteSelection.htm “The Windspire.” Windspire Energy Inc. n.p. 2010. Web. 26 June 2012.
http://www.windspireenergy.com/windspire/

UVM Campus Renewable Energy Feasibility Study
Fuel Cells
1
Fuel Cells
1.0 Fuel Cell Electro-Chemical Process
Fuel cells are power generating devices that convert suitable fuels directly to electricity without fuel
combustion, using an electro-chemical process similar to batteries. The process is much “simpler” than
conventional fossil/renewable fuel fired generation since no rotating equipment is required (gas
turbines, boilers and steam turbines, reciprocating engines, etc.) nor large auxiliary systems such as
steam, condensate, feedwater, water treatment, condenser/cooling water, and so on.
A fuel cell consists of three basic parts: an anode, cathode and electrolyte, and the only byproducts of
the process consist of water, carbon dioxide and heat.
All fuel cells operate on the same basic chemical reaction, for a pure hydrogen fuel:
2H2 + O2 2H2O + 2e-
Hydrogen + Oxygen Water + Electricity (+ Heat)
In a typical installation the hydrogen for the process is provided by a fossil fuel or renewable fuel gas
source. Most typically, a utility natural gas supply is used to provide adequate hydrogen fuel to the fuel
cell. The gas enters the fuel cell at the anode (positive pole) which strips the fuel gas hydrogen atoms of
their electrons, producing positively charged hydrogen ions. The stripped electrons are now available to
produce the DC power output. At this point the air, containing oxygen, enters the fuel cell at the
cathode (negative pole). The oxygen atoms, combining with the electrons returning from the load circuit
and the hydrogen ions passing through the electrolyte, produce water and heat. The electrolyte is vital
to the process since it must have the ability to only allow the hydrogen ions to pass through. If other
elements or free electrons were to pass they would disrupt the reaction.

UVM Campus Renewable Energy Feasibility Study
Fuel Cells
2
In reality, an individual fuel cell produces only a small amount of power, and thus in practice many fuel
cells are combined in a “stack” configuration in order to produce real usable power.
As in a battery, the electrical power generated is direct current (DC) and to make the power more
conventional and commercially viable, the output of the fuel cell stack is routed to a power inverter that
electronically converts DC power to an alternating current (AC) power that is matched to the local utility
grid power.
2.0 Types of Fuel Cells
There are various types of fuel cells, all with similar operating qualities. The two most common and
commercially-available types are proton exchange membrane (PEM) and solid oxide fuel cell (SOFC).
This Fuel Cell discussion and analysis will focus on two commercially available fuel cell packages that use
these two different technologies to achieve power output.
There are other fuel cell technologies available and/or under development, using different electrolytes,
stacking and packaging methods, operating at various temperatures and pressures.
In general, sizes range from the 1 kW to the 400 kW, and the ultimate fuel cell “plant” size can be

UVM Campus Renewable Energy Feasibility Study
Fuel Cells
3
increased by increasing the number of fuel cell packages.
Most, but not all fuel cells have high temperature exhaust gases that result in a heat recovery capability
for CHP / cogeneration opportunities. In some cases, the fuel cell manufacturers have integrated the
necessary hot-water heat exchangers, valves, piping and sometimes a base-option pump into the
package itself. However, in some cases, only the heat exchanger is provided and the distribution and
pumping system is supplied by the owner.
2.1 Solid-Oxide Fuel Cells (SOFC)
The first fuel cell examined is a solid-oxide ceramic electrolyte type, specifically those products /
packages offered by Bloom Energy.
Bloom Energy manufactures two products, a 100 kW ES-5400 package and a 200 kW ES-5700 package.
These units can be electrically connected in any combination to create adequate power for practically
any load. The product literature for both of the Bloom Energy devices is attached as Exhibit A.
The Bloom Energy SOFC, utilizing a standard utility natural gas as its fuel (which consists primarily of
methane / CH4), operates with the following reaction;
CH4 + 2O2 CO2 + 2H2O + 2e-
Methane + Oxygen Carbon Dioxide + Water + Electricity
The Bloom Energy units do not have usable “heat” available for connection to an external process for
CHP/cogeneration or hot-water heating processes because the heat generated by the fuel cell is needed
to sustain the chemical process. Since the core is a ceramic solid oxide electrolyte for the reaction to
work the air has to be heated to high temperatures and the fuel has to be mixed (reformed) with steam
in order for the fuel cell to function. Since the heat produced by the high-temperature electro-chemical
process within the solid oxide is used wholly internally to then pre-heat the oxygen (air) entering the
cell, and to produce steam that is combined with the fuel, there is little excess heat available for other
uses. Accordingly, since there is no useful heat output to improve the efficiency the electrical power
from Bloom Energy fuel cells have to compete price-wise directly against traditional electricity sources
(coal, gas, nuclear, hydro, etc.) and/or renewable energy generation without cogeneration.

UVM Campus Renewable Energy Feasibility Study
Fuel Cells
4
The Bloom Energy ES-5400 unit produces 100 kW of electricity at 480 VAC while consuming 0.661
MMBtu/hr (650 cubic feet/hr) of natural gas, for a nominal efficiency of about 46.5%. Although no
specific quote for the purchase price of the Bloom Energy ES-5400 product is available, research
indicates it costs between $700,000 and $800,000 to purchase the unit. Assuming installation, and
permitting are relatively simple, an installed cost is reasonably estimated at $900,000 to $1 Million.
The Bloom Energy ES-5700 unit produces 200 kW of electricity at 480 VAC while consuming 1.32
MMBtu/hr (1,300 cubic feet/hr) of natural gas, for a nominal efficiency of 46.5%. Research indicates the
unit costs between $1.0 Million and $1.2 Million. Assuming installation, and permitting are relatively
simple, an installed cost is reasonably estimated between $1.1 Million and $1.3 Million.
It appears that in practice, most Bloom Energy fuel cell sales are made directly to an affiliate company,
who then leases the equipment and executes/manages subsequent O&M / warranty contracts. From
our limited research, most Bloom Energy fuel cell installation projects appear to be heavily subsidized
with tax credits, ratepayer rebates, incentive bonuses, etc.
The Bloom Energy units are rated to operate continuously, aisde from short outages for regular
inspections and filter change-outs. As noted above, operation and maintenance contracts are available
for purchase from the Bloom Energy affiliated company. An extended warranty can also be purchased
but the terms are limited to a 3-year maximum. The historical information for reliability on this
equipment is not available. Anecdotal evidence indicates that costly, multiple fuel cell stack and seal
replacements are required over the claimed 10-year to 20-year life span.
For comparison purposes in the economic analysis below, we have assumed that O&M costs of the
Bloom Energy units are in the $0.02/kWh range, typical of other fuel cell technologies. The actual
maintenance costs for the Bloom Energy units are not available until confidential equipment-purchase /
lease negotiations commence, since there is no typical data available from our research.
2.2 Proton Exchange Membrane (PEM) Fuel Cells
The second type of commercially available fuel cell considered in this study is the United Technologies
UTC Power PureCell® System Model 400. A typical vendor brochure is attached in Exhibit B.
This unit utilizes a proton exchange membrane (PEM) technology for its operation, and operates under

UVM Campus Renewable Energy Feasibility Study
Fuel Cells
5
the same electro-chemical process (gas in, water carbon dioxide and power out) as the Bloom Energy
unit. However, with an electric efficiency in the order of 37.8%, it does create a usable amount of
exhaust heat energy for CHP / cogeneration, and/or hot-water heating purposes.
The UTC power fuel cell is rated at 400 kW electric (new & clean) at 480 VAC, and utilizes 3.61~3.79
MMBtu/hr (3,540 cubic feet/hr) of natural gas (we have assumed 3.80 for a long-term average). It also
makes available about 1.7 MMBtu/hr thermal output, consisting of about 0.80~0.96 MMBtu/hr at 250
degrees F (high-grade heat), and 0.59~0.90 MMBtu/hr at 140 degrees F (low grade heat).
The unit cost is approximately $1.2 Million. With the additional equipment and installation required for
cogeneration, the installed cost can vary widely. A reasonable estimate, depending on the specific
application, could run from $1.6 Million to $2.0 Million.
The UTC unit is another high-temperature electro-chemical process requiring significant maintenance to
ensure a suitable life-span. Research reveals that approximate unit maintenance O&M costs for the UTC
PureCell 400 unit are in $0.02/kWh range.
3.0 Simplified Economic Analysis – Fuel Cells
A simplified economic analysis has been conducted of the Bloom Energy ES-5400 and 5700 fuel cells,
and the UTC Pure 400 fuel cell – first with both low-grade/high-grade heat utilization, and secondly with
only high-grade heat utilization.
In the analysis, we have used bulk-average avoided electricity pricing of $0.121/kWh and $0.150/kWh,
and natural gas delivered pricing of $5.00 and $12.85/MMBtu, thus giving simple paybacks for both a
high gas price / low avoided electricity price scenario and a low gas price / high avoided electricity price
scenario.
The O&M costs identified above are included in the analysis, although additional staffing costs and BED
standby charges are ignored. Also, it is presumed that the application selection will made such that all of
the heat energy from the UTC unit can be usefully employed all year-round.

UVM Campus Renewable Energy Feasibility Study
Fuel Cells
6
Description Units
Bloom Energy
ES-5400 Fuel Cell
Bloom Energy
ES-5700 Fuel Cell
UTC 400 Fuel Cell
UTC 400 Fuel Cell
Equipment/Project Capital Cost $ 1,000,000
1,300,000
2,000,000
1,950,000
Gross Power kW 100 200 400 400 Aux Power (engine & auxiliaries) kW 2 4 12 12 Net Power kW 98 196 388 388 Fuel Consumption (HHV) (long-term average) mmbtu/hr 0.73 1.47 3.80 3.80
Thermal Heat (recovery) mmbtu/h
r 0.00 0.00 1.55 0.96
CHP Comments (this analysis assumes all available thermal heat can be utilized, which is not proven yet)
NOT CHP no heat recovery available
NOT CHP no heat recovery available
high and low grade
heat
high grade
heat only
Simple Economic Summary with 12.85 gas and 12.1 c/kW.hr
Electrical Cost Savings $ 99,721 199,442 394,814 394,814 Thermal Fuel Savings $ 0 0 209,373 129,676 Fuel Cost $ -79,287 -158,334 -410,641 -410,641 O&M Cost (staffing ignored) $ -16,483 -32,966 -65,258 -65,258 Annual Savings $ 3,951 8,142 128,287 48,591 Payback years 253 160 16 40 Simple Economic Summary with 5.00 gas and 15.0 c/kW.hr
Electrical Cost Savings $ 123,621 247,242 489,439 489,439 Thermal Fuel Savings $ 0 0 81,468 50,458 Fuel Cost $ -30,851 -61,609 -159,782 -159,782 O&M Cost (staffing ignored) $ -16,483 -32,966 -65,258 -65,258 Annual Savings $ 76,287 152,668 345,866 314,855 Payback years 13 9 6 6
The table demonstrates that with expensive gas and current BED electricity pricing, the payback period
of fuel cells is unrealistically long. With current gas prices and high electricity prices, the payback period
of the UTC / cogeneration unit can approach reasonable periods, while the non-cogeneration Bloom
Energy is significantly longer.
4.0 Final Discussion – Fuel Cells
Fuel cells are a proven technology that is still developing as a commercial and economically feasible

UVM Campus Renewable Energy Feasibility Study
Fuel Cells
7
alternative. It is faced with challenges related to high initial cost, variable maintenance cost, and
uncertain component life-span issues contributing to making consumer-comfortable, commercially-
viable projects difficult without significant front-end or back-end subsidization.
Since fuel cells are relatively small and self-contained, relatively quiet, have “zero emissions”, and in the
right circumstances are potentially a high-efficiency technology, government / investor funded
development by a variety of large and small company fuel cell developers continues on the various types
of technologies that could be employed.
At this time CHA does not see a significant opportunity for a 100~400 kW fuel cell installation at the
UVM campus. As discussed elsewhere in this study:
• The Cage Heating Plant Complex produces and distributes steam not hot-water, so this would not be a viable location for a major CHP fuel cell installation.
• The UTC PureCell 400 unit with CHP, has too high an output for the approximately 250 kW University Heights location.
• The smaller Bloom Energy units appear to be better fit for University Heights, but it does not have CHP capability, so they would have to compete directly against BED pricing or Cage Cogeneration electricity pricing.
• UVM advised that the Trinity Campus may convert from electric building heating to a local district heating system in the future.
At that time, the remote Trinity Campus could become a potential location for a fuel cell(s) under the right circumstances. It would then have to compete against micro-turbines, reciprocating engines or potentially a biomass boiler / steam turbine / organic Rankine cycle system.
Under the right circumstances (e.g. funding, incentives, grants, BED considerations, etc.), it may make
sense for UVM to consider participating as a pilot fuel cell / CHP project for a government research
agency or one of the developers that are conducting proprietary research, perhaps on a smaller scale
than that discussed above and at a particular building(s) with a adequate gas supply, and a steady
electrical, and thermal load.

UVM Campus Renewable Energy Feasibility Study
Fuel Cells
8

UVM Campus Renewable Energy Feasibility Study
Fuel Cells
9
Attachment A: Bloom Energy Fuel Cells

UVM Campus Renewable Energy Feasibility Study
Fuel Cells
10

UVM Campus Renewable Energy Feasibility Study
Fuel Cells
11
Attachment B: UTC Fuel Cell

UVM Campus Renewable Energy Feasibility Study
Solar Photovoltaic
Solar Photovoltaic (Solar PV)
The University of Vermont (UVM) has many locations that provide excellent opportunities for the
implementation of Solar PV systems. The following relates current technologies, project development life cycle,
available incentives, and specific PV opportunities at UVM.
1.0 Technology Overview
Solar Photovoltaic Systems (Solar PV Systems) are comprised of four main components:
⋅ Solar PV Modules or “Panels” ⋅ Solar PV Inverters ⋅ Electrical BOS or “Balance of System” ⋅ Racking or mounting systems
Solar PV Systems convert the energy from sunlight into electricity. The Solar PV Modules instantly
convert the solar energy that strikes them into low-voltage direct current (DC) electricity. That DC electricity
travels to Solar PV Inverter, where it is converted into 208-volt, 240-volt or 480-volt alternating current (AC)
electricity. From the inverter, the AC electricity either feeds the building’s electrical panel, where it is distributed
through the building as needed, or feeds directly into the grid where the electricity produced is credited by the
utility.
1.1 Solar PV Modules:
Solar PV Modules can be made of a number of different materials, and can come in a variety of shapes
and sizes. Materials presently used for photovoltaic cells include monocrystalline silicon, polycrystalline silicon,
amorphous silicon, cadmium telluride, and copper indium gallium selenide/sulfide. For commercial and
residential applications in the United States, solar PV modules tend to be either monocrystalline silicon or
polycrystalline silicon and are a very homogenous product. Although there may appear to be differences
between manufacturers, models are usually nearly identical.
Based on observed market conditions and survey of current CHA clients (primarily Vanguard Energy
Partners, a large commercial solar developer/installer operating in NJ, PA, and MA), modules being installed in
2012 range from 220-255 Watts DC. The 240-250 Watt module size is particularly popular. Watts DC is a
standard industry measurement derived by testing the solar modules at ‘STC’ or standard test conditions.
Standard test conditions are 1,000 watts per square meter solar irradiance, 1.5 Air Mass, and a 25° Celsius cell

UVM Campus Renewable Energy Feasibility Study
Solar Photovoltaic
temperature. While STC is the industry standard for rating modules, it should be noted that a more in-depth
equations are used when solving for solar PV system output.
Crystalline silicon modules rated 220-255 watts DC tend to be around 40” wide, 65” tall and 1.5” thick.
They weigh around 45lbs each. They are composed of either 60 or 72 “cells” wired together in series, which are
adhered to tempered glass and attached to an aluminum frame. A junction box measuring approximately 4” by
4” is attached to the back of the module, which connects to the terminals of a positive and negative no.12 wire.
These wires are commonly called the “leads.” The leads have quick-connect attachments at the ends for easy
connection to each other. Modules are typically tested for a maximum load of 50 -75 pounds per square foot
(psf). Design should verify that the ground snow load does not exceed this amount.
Groups of solar PV modules are connected together to form “strings.” Strings are made by connecting
the positive lead from one panel to the negative lead on the next and so forth. When a string is made, there will
be one unconnected positive lead and one unconnected negative lead. These leads are connected to the
inverter. If the system is large enough, several strings will be connected to one another in a combiner box. From
the combiner box another wire will run to the inverter. Strings are sized based on a maximum system voltage of
600 volts as dictated in the National Electric Code (NEC). This results in strings that are typically 11, 12, or 13
modules long.
Modules typically carry either a 5-year or a 10-year manufacturer’s warranty. This would cover defects
in manufacturing, the module frame, wiring, glass or other physical defects. Modules also hold what is called a
“power production warranty” which insures the module’s level of power output. This warranty is typically 90%
over 10 years and 80% over 25 years. There are some other options and variations for power production
warranties but this is the general approach. Modules useful life span is expected to be in the 30-40 year range
with top tier Chinese, Asian, European and American Manufacturers. For lesser manufacturers the estimated life
is in the 25-30 year range.

UVM Campus Renewable Energy Feasibility Study
Solar Photovoltaic
1
1.2 Solar PV Inverters:
A solar inverter, or PV inverter, converts the variable direct current (DC) output of a PV solar module
into a utility frequency alternating current. This allows that electricity to be fed into a commercial electrical grid
or used by a local, off-grid electrical network. Inverters come in many sizes and voltages, and can have special
features such as string level monitoring or maximum power point tracking (MPPT) but all serve the same
purpose. For applications at the University of Vermont, grid tied inverters will be used to deliver electricity to
the grid. In order to receive incentives from either selling the electricity to the grid or net-metering, the inverters
must be certified UL 1741. United Laboratories (UL) is a third party testing organization whose certifications are
a standard which utilities require connecting with them. Inverters generally carry a 10-20 year warranty and
their useful operating life is estimated to be in the 20-30 year range. Depending on the system size there are
several inverter models listed in the solar reports created during this study. These inverters are the SMA ‘Sunny
Boy’ inverters Models 3000-80002, models 9000-12000 TL (transformer-less), and Advanced Energy PV Powered
Models 35kW, 75kW, 100kW, 250kW and 500kW3. These larger inverters were compared with the Enphase
Energy Microinverters4. Microinverters can be used on some smaller projects, but generally the SMA and PV
1 www.sharpusa.com/SolarElectricity 2 www.sma-america.com 3 www.advancedenergy.com 4 www.enphaseenergy.com
Sharp 250 Watt Monocrystalline Silicon Solar Panel

UVM Campus Renewable Energy Feasibility Study
Solar Photovoltaic
Powered inverters are more cost effective at a commercial scale. During development of any project, inverter
choice should be re-evaluated.
Solar PV inverters for our applications range greatly in size:
Inverter Model Dimensions(X/Y/Z) Inches Weight (LB)
SMA 5000-8000 18 / 24 / 9 141
SMA 9000-11000 18 / 24 / 9.5 78
PVP 35,50 44/59/27 , 44/63/32 1200 , 1600
PVP 75,100 59 / 91 / 27 2750 , 3000
PVP 250 104 / 93 / 41 5000
PVP 500 119 / 87 / 48 8750
The above inverters can be mounted both inside and outside. The SMA models are NEMA 3R rated and the PV
Powered models are NEMA 4 rated. NEMA is the National Electrical Manufacturer’s Association and NEMA 3R
and 4 are as follows:
3R Outdoor use primarily to provide a degree of protection against rain, sleet, and damage from external ice
formation.
4 Indoor or outdoor use primarily to provide a degree of protection against windblown dust and rain, splashing
water, hose-directed water and damage from external ice formation.
SMA inverters must be wall mounted or pole mounted and requires installing a separate DC disconnect.
The DC disconnect is included with purchase but is a separate part. Disconnects are required by NEC (both AC
and DC) and it is for convenience that inverter manufacturers include this in their product. DC disconnects are
integrated into the PV Powered models. The PV Powered inverters are mounted either directly on the floor or
on a poured concrete pad. Structural engineer should be consulted to ensure floor can support additional
weight of the inverter. Designing and constructing a concrete pad is generally an inexpensive procedure
compared to the overall project cost. Due to their size, it is often easier to place the inverters outside. For safety
and security, the inverters should be surrounded by a fence, concrete-filled metal bollards or both.

UVM Campus Renewable Energy Feasibility Study
Solar Photovoltaic
1.3 Solar PV Balance of System (BOS)
The Balance of System of a Solar PV System generally consists of the following, listed in direction from
Modules to Interconnect:
1. DC Conductors 2. DC Junction Boxes 3. Conduit 4. DC Combiner Boxes 5. Disconnects 6. Interconnection Equipment
Four (4) PVP-75kW Inverters
Three (3) SMA 7000US Inverters with disconnect & combiner box

UVM Campus Renewable Energy Feasibility Study
Solar Photovoltaic
7. Monitoring & Metering
There are many reputable manufacturers for each component. Rather than list one particular
manufacturer, it is a good exercise to discuss the best practices in the industry, what to look for and applicable
codes and standards.
1.31 DC Conductors
DC Conductors for Solar PV Systems should be copper and rated 90 degrees. When there is the potential
for being exposed to sunlight, wire must be USE-2 which is UV resistant. For wire that will be enclosed in
conduit, THWN or THHN is suitable. In almost all cases, string wire is sized No. 10. After the combiner box, wire
is sized based on the National Electric Code which takes into account temperatures and a 25% correction factor
for DC conductors. There are many reputable manufacturers out there but one should be cautioned that
‘traditional’ electric suppliers do not often carry high volumes of USE-2 wire.
1.32 DC Junction Boxes
DC Junction boxes, often called ‘pass through boxes’, are used to take multiple string wires and bring
them into a conduit. They are necessary when there are strings which need to be run a long distance from the
arrays to the combined box since wire cannot touch the roof at any time. These are generally made of PVC and
one should look for NEMA 3R rating, at a minimum, and waterproof wire entry points. Junction boxes are
generally a homogenous product. There are a few solar specialty products available such as those manufactured
by Wiley Electronics, LLC5 which make mounting junction boxes to racking systems easier and save some time
and effort during installation.
1.33 Conduit
Conduit is generally required in the following places in a PV system:
1. From arrays (or Junction boxes) to combiner boxes 2. From combiner boxes to inverters 3. From inverter to interconnection
Conduit run from arrays or junction boxes to combiner boxes can be PVC schedule 40 conduit when
located on a roof. Conduit must be sized per NEC. The conduit’s only function is to keep wires from touching the
5 www.we-llc.com/

UVM Campus Renewable Energy Feasibility Study
Solar Photovoltaic
roof. In instances of ground mount arrays, since conduit will be buried, Rigid Galvanized Steel (RGS) is
recommended.
Conduit from combiner boxes to inverter and from inverter to interconnection falls into two groups:
inside and outside. Conduit located inside can be EMT conduit, sized per NEC. Conduit located outside can be
EMT with rain tight fittings according to NEC but it is highly recommended that RGS be used. RGS conduit’s
useful life is closer to the useful life of the PV system, when compared to EMT conduit. Replacing conduit is a
very labor-intensive and expensive undertaking. It is common for Solar PV contractors to use EMT in outdoors
applications unless otherwise specified. It’s a worthwhile addition the PV system to have RGS conduit.
Conduit for ground mount systems must always be RGS conduit and should be sized and buried
according to NEC.
1.34 DC Combiner Boxes
DC Combiner boxes combine multiple strings into one wire. The advantage is decreased cost for wire
and conduit and decreased voltage drop/loss. DC combiners can be PVC, steel or fiberglass. We usually
recommend NEMA 4X rated which is fiberglass and resists ice, dust, water and corrosion. The fiberglass
combiner boxes are lighter and therefore easier to mount which saves labor and materials. Combiner boxes
typically combine anywhere from 4 to 24 strings, with models available even up to 50 strings from some
manufacturers. Combiner boxes should be wall mounted or rack-mounted and on flat roofs, not permanently
affixed. When systems utilize a large (250-1MW) inverter, sometimes re-combiners are required. These are large
combiner boxes which will combine multiple combiner boxes. This is necessary when the number of combiners
exceeds the number of inputs on the DC bus of the inverter. This is something that is new in NEC 2011 for some
installations.
1.35 Disconnects
Solar PV Systems require a visible, accessible AC disconnect. This would be located between the inverter
and the interconnection point. It is best practice to have fused disconnects and in some cases utility rated
disconnects. Additionally, nearly all inverters have a DC disconnect. This is usually a switch located on the
inverter. It is also recommended that disconnecting combiners be used. This allows the installer and O&M
provided to disconnect single arrays instead of the entire system. It allows additional flexibility with
maintenance operations and repairs, when necessary.

UVM Campus Renewable Energy Feasibility Study
Solar Photovoltaic
1.36 Interconnection Equipment
To interconnect the PV system in a net metering situation, one can either install a new breaker to feed
through the existing main service or perform a ‘line side tap’ in which the main service is tapped and PV power is
fed into the main service via the bus. The main concern is to not exceed the ratings of the bus and the service.
This should be evaluated prior to installation because if the service is not adequate, a new service can often be
cost prohibitive.
Interconnecting the PV system under BED’s new program would be via a new, utility-installed service.
This service would be installed to match the inverters and in most cases would be 480/277V. There may be
cost(s) associated with installing this new service for new meters.
1.37 Monitoring & Metering:
Metering of the solar PV system could be accomplished with either a new net-meter installed by the
utility or a one-way production meter installed by the utility. New net-meters cost around $300 to install in both
BED and GMP. It is also recommended that a monitoring system be installed which is capable of inverter-level
monitoring, data logging, alerts and web-based output.
What to look for in a monitoring system:
⋅ Real-time information at 1 min intervals on renewable energy production, facility energy consumption, greenhouse gas generation
⋅ Web based data storage with access to data from any web browser, anywhere, anytime ⋅ Renewable energy credits (RECs) tracking and reporting ⋅ Normalized system performance reports ⋅ Automated billing information for power purchase agreement (PPA) providers ⋅ In-depth data analytics with full export capability ⋅ Data available from each inverter or the total system ⋅ String level monitoring ⋅ Remote fault diagnosis and remote reset capabilities, which minimize O&M costs ⋅ Customizable alerts and alarms ⋅ Warranties
There are a number of reputable manufacturers that offer solar PV monitoring including Noveda Technologies,
Deck Monitoring, Fat Spaniel, WattMetrics, Ontility, and Draker Labs.
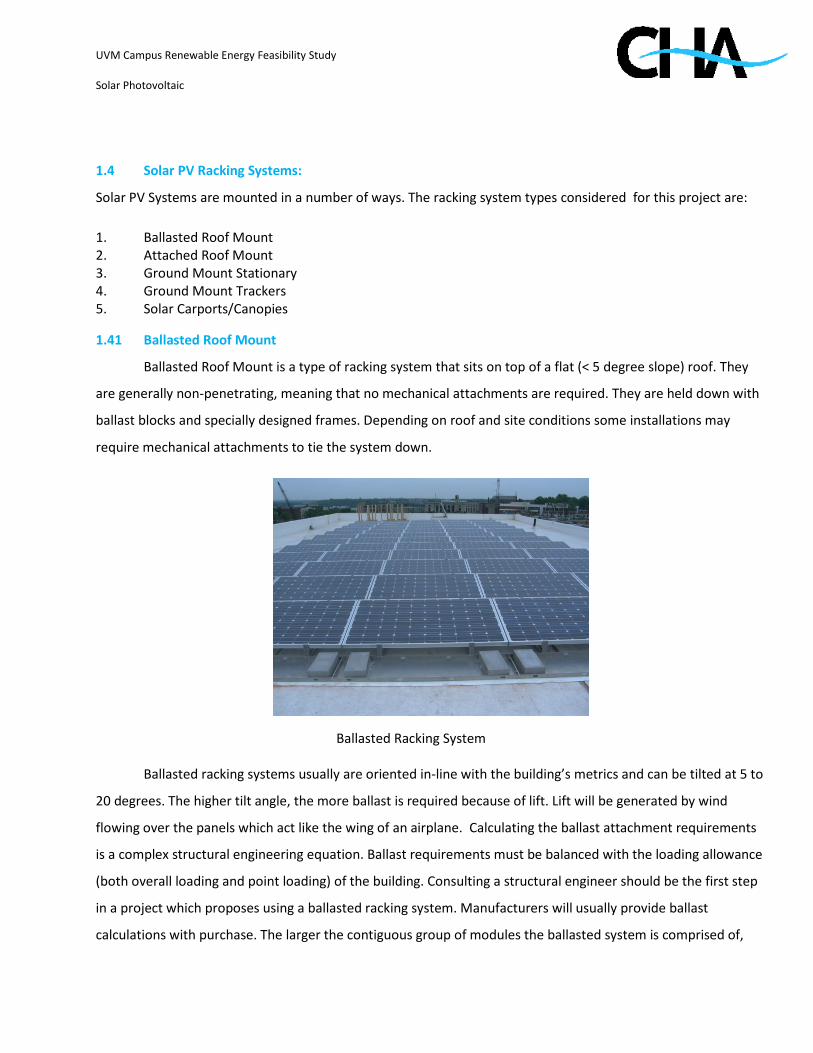
UVM Campus Renewable Energy Feasibility Study
Solar Photovoltaic
1.4 Solar PV Racking Systems:
Solar PV Systems are mounted in a number of ways. The racking system types considered for this project are:
1. Ballasted Roof Mount 2. Attached Roof Mount 3. Ground Mount Stationary 4. Ground Mount Trackers 5. Solar Carports/Canopies
1.41 Ballasted Roof Mount
Ballasted Roof Mount is a type of racking system that sits on top of a flat (< 5 degree slope) roof. They
are generally non-penetrating, meaning that no mechanical attachments are required. They are held down with
ballast blocks and specially designed frames. Depending on roof and site conditions some installations may
require mechanical attachments to tie the system down.
Ballasted racking systems usually are oriented in-line with the building’s metrics and can be tilted at 5 to
20 degrees. The higher tilt angle, the more ballast is required because of lift. Lift will be generated by wind
flowing over the panels which act like the wing of an airplane. Calculating the ballast attachment requirements
is a complex structural engineering equation. Ballast requirements must be balanced with the loading allowance
(both overall loading and point loading) of the building. Consulting a structural engineer should be the first step
in a project which proposes using a ballasted racking system. Manufacturers will usually provide ballast
calculations with purchase. The larger the contiguous group of modules the ballasted system is comprised of,
Ballasted Racking System

UVM Campus Renewable Energy Feasibility Study
Solar Photovoltaic
the less ballast required. Weights for ballasted systems range from around 5psf to 15psf, with an average for a
100kW installation in the northeast US around 8psf.
One major benefit of using a ballasted racking system is maintaining the roof warranty. During design
and installation additional caution should be given to preserving said warranty. Most major roofing
manufacturers have a set process for maintaining the warranty when adding a Solar PV system. Typical safety
measures include placing extra rubber pads beneath the
ballast trays, having a certified roofer perform all cutting
and patching, and installing walk pads. This type of
racking system has been proposed for many buildings in
this study. It is recommended that the roof manufacturer
be consulted prior to making any final decisions on a
project.
1.42 Attached Roof Mount
Attached roof mount racking systems, are also
“traditional” racking systems. For the purposes of this study, we looked at Unirac Solar Mount. Unirac is an
industry leader in Solar PV racking systems and
has a number of products. Solar Mount is as close
as it comes to an industry standard for attached
racking systems.
Attached racking systems are comprised
of 1) Rails, 2) Brackets or Feet 3) Flashings 4)
Module Clips. Rails are attached to the roof via lag
screws and brackets, and are covered with
specialty flashings. The flashing varies by the
application.
Rails generally run perpendicular to the existing
roof joists and then modules are attached
Unirac SolarMount Rail, “L Bracket” and flashing for architectural shingles. Beneath the flashing are another bracket and a lag screw which attaches to the roof joists. Number and spacing of the attachments varies but is generally every 4-8 feet.

UVM Campus Renewable Energy Feasibility Study
Solar Photovoltaic
perpendicular to the rails via clips. Modules can either be clipped from the top or from the bottom of the frame.
Aesthetics are the primary reason to choose one over the other. Most racking systems offer both options. One
row of modules requires two rails in most situations. In some cases, three rails may be required to spread the
load or account for unusual site conditions.
If the roof substrate is not shingles, then the racking system will attach in a different fashion. Corrugated
metal roofs use the same process as shingles, but require a special flashing and sealant to ensure the roof does
not leak. It is a good idea to have a professional roofer perform these tasks, or require the PV installer
subcontract roof-related items to a professional roofer.
If the roof substrate is standing seam metal, then the use special clips are required. S-5 clips are the
industry standard for attaching to standing seam roofs. There are a dozen or so designs of S-5 clips depending on
standing seam style. S-5 clips can either act as the base for a rail-based racking system such as the Unirac Solar
Mount or can used in conjunction with the S-5 PV Kit and mounted without rails. Generally, rails offer more
flexibility with module positioning and also allow more air to pass beneath the modules as they are mounted
approximately 3” higher off the roof. Both options get the job done though.
1.43 Ground Mount Stationary
Ground mount stationary racking systems are utilized in areas where you have a large open space for
ground mounted PV. Advantages to ground mounted arrays versus building mounted are orientation and tilt
S-5 PV Kit with Top Clamps

UVM Campus Renewable Energy Feasibility Study
Solar Photovoltaic
angle. With additional space and no constrictions from building characteristics, ground mounted solar PV can be
arranged to be at optimal orientation and tilt angle for maximum output.
Within the realm of ground mounted stationary racking systems, there are a few different types.
• Traditional Ground mount • Ground mount single pole • Ballasted Ground mount
1.44 Traditional Ground Mount:
Traditional ground mount utilizes base poles or beams made of steel and then rails attach to these
beams. The rails used in traditional ground mount applications are often the same as the roof-mount rails. One
great product on the market today is Unirac’s Isys Ground mount. Isys is made up of pre-formed beams which
are installed on foundation beams. Foundations can either be driven post, helical pile, precast concrete or
poured concrete. The components are then assembled with no field fabrication required. Many other ground
mount systems require field fabrication of steel which is a big expense and time constraint.
6
The Isys ground mount shown above utilizes a tilt angle of around 30 degrees. For applications at the
University of Vermont, the tilt angle would be set around 40-45 degrees depending on tilt angle options for the
chosen racking system. The system would then be oriented at 180 degrees south or as close to that angle as
possible given site conditions. The terrain should be relatively flat, however, the system will tolerate 5% grade
and height can be increased to accommodate for terrain conditions, as necessary.
6 www.unirac.com

UVM Campus Renewable Energy Feasibility Study
Solar Photovoltaic
For inverters and the electrical balance of system for ground mounted arrays, there are two options. The
first is to have large central inverters receiving DC power from multiple arrays. In this arrangement, combiner
boxes would be mounted to the back of arrays or field mounted which would receive power from the DC strings
and then feed the central inverter (s). From the central inverter(s), underground conduit would then be run to
the interconnection point. The second arrangement would either utilize microinverters or one small inverter per
array. Small inverters can easily be mounted to the underside of the ground mount steel. From these inverters,
home run cables would be run to field mounted load panels which would accept AC feeds from multiple arrays
and then run back to the interconnection point.
There are advantages and disadvantages to each arrangement. Large central inverters have a single
point of failure and can be difficult to replace. However, central inverters have a lower per watt installed cost
and provide slightly higher efficiencies. Microinverters and smaller inverters provide multiple points of failure so
if one fails; the rest of the system can still operate. They are also very easy to replace. Smaller inverters have
slightly lower efficiencies (around 1-lower) and the AC distribution system associated with using multiple small
inverters also yields slightly lower efficiencies. However, it is less expensive to install. As one can see, there are
pro’s and con’s to each side and it’s important to work with your developer or installer to understand the
options available, costs and output implications associated with each. We recommend investigating traditional
ground mount and solar trackers for areas at UVM. It is our opinion, however, that solar trackers would be a
better option. More detail is given in the latter parts of this report.
1.45 Ground Mount Single Pole:
Ground Mount single pole is just a variation on traditional ground mount. Each single pole supports one
array of modules. Common sizes include 9, 12 and 16 module arrangements.
ww.rbisolar.com

UVM Campus Renewable Energy Feasibility Study
Solar Photovoltaic
The single poles can either be attached via a plate & bolts to a poured foundation, pre-cast foundation
or can be cast into a foundation. The pole is usually 6” to 8” schedule 40 steel. The terrain does not have to be
flat for single pole ground mount. They can tolerate roughly 20 degrees grade. The most cost-effective way to
mount single poles is often with helical pile poles by ‘techno metal post’ or other company. This installation
method saves a massive amount of labor and time. One should consult with a structural and geotechnical
engineer prior to making decisions on foundations.
As with traditional ground mount installations, inverters in this type of installation can either be large
central or distributed smaller inverters. With arrays that are 12 modules per pole, a design we often see is one
SMA 3000 inverter per pole-mount. It is less common to see a large central inverter with single pole ground
mounts. This is primarily because since single pole ground mounts are more expensive and don’t exhibit as
significant economies of scale in larger installations versus traditional ground mounts. This leads to most single
pole installations to be in the “small” range, primarily residential and small commercial. Single pole mounted
arrays are aesthetically pleasing, but tend to be more expensive than traditional ground mounts. We
recommend thorough investigation to choose the right type of racking for each site.
1.46 Ballasted Ground Mount:
Ballasted ground mount is similar to traditional ground mount installations except that the arrays are
ballasted. In order to make the ballast system work, the arrays are also low profile. The arrays are only one (1)
module high, oriented in portrait. One good example of a ballasted ground mount product is Sunlink’s GMS.
Ballasted ground mount systems are easy to install. There is no field fabrication required and the
ballasts can come pre-cast with bolts to add ease to installation. Civil/site work will be required, however, as
ballasted ground mounts require level terrain, sloping no more than 5 degrees. Additionally, as one can see in
www.sunlink.com

UVM Campus Renewable Energy Feasibility Study
Solar Photovoltaic
the picture above, the site is usually required to be filled in with crushed stone to ensure proper drainage.
Requirements vary by site and local permitting authorities.
1.5 Solar Trackers
Solar Trackers consist of tracking panels that move in one or more directions in order to maximize the
amount of time that they are directly facing the sun. Taking advantage of this direct sunlight maximizes the solar
panels’ output. While fixed tilt panels are generally cheaper to install and maintain due to a lack of moving parts
or a need for electricity to move the panels, tracking panels will produce more electricity per installed Watt
because they are always optimizing their angle of incidence with the sun.
There are several different varieties of solar trackers. Trackers are generally divided into categories
based on how many axes they can move around. Uniaxial trackers pivot around one axis, and multiaxial trackers
move around two or more axes. Increasing the tracker’s range of motion increases the cost, but the electrical
output also grows. Like fixed ground-mount systems, uniaxial trackers can be arranged in rows. They will often
be oriented east to west instead of south so they follow the sun as it moves across the sky. Multiaxial trackers
often pivot around a central point or a tower such as the AllSun Tracker, manufactured by All Earth Renewables
and further discussed in the next section. These trackers need to be installed farther apart compared to uniaxial
or fixed-mount panels in order to minimize shading. However, their ability to always face directly into the sun
significantly increases their output.
1.51 AllSun Tracker
The AllSun Tracker, produced by All Earth Renewables7 based in Williston, Vermont, is one of many
models of multiaxial solar trackers. There are two varieties of these trackers: the 20 series, (which has 20 solar
panels (5kW)), and the 24 series, (which has 24 solar panels (6kW)). For large-scale or commercial production,
the 24 series is the better design since it is slightly larger and has 20% more capacity. These trackers pivot
around a single tower, which allows them to rotate 360° horizontally and 90° vertically, meaning they can be
oriented at any angle tangent to the top half of a sphere. Also, these trackers are equipped with a GPS system to
help them track the sun. When they are installed, the GPS delivers exact coordinates to a tracker to define its
precise location. The tracker then calculates the exact angles it will need to be at to always directly face the sun.
Using a hydraulic motor and actuator to move, they have a parasitic load of about 1% annually. Despite this loss,
7 www.allearthrenewables.com
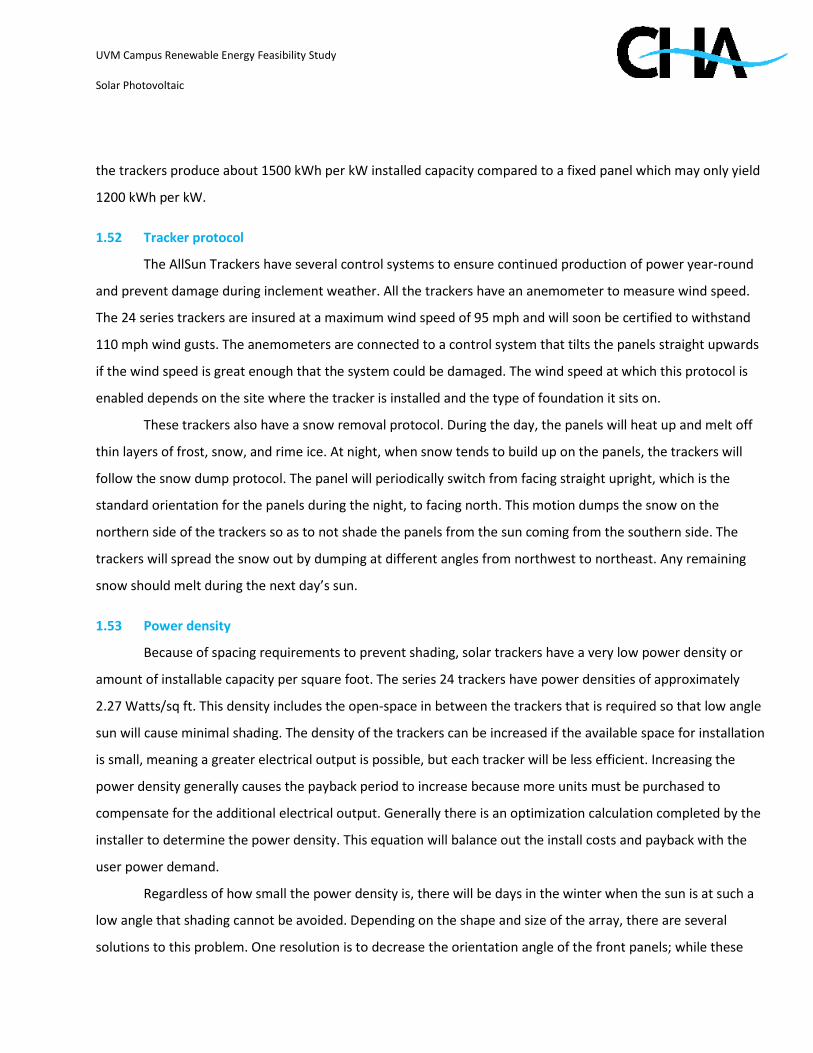
UVM Campus Renewable Energy Feasibility Study
Solar Photovoltaic
the trackers produce about 1500 kWh per kW installed capacity compared to a fixed panel which may only yield
1200 kWh per kW.
1.52 Tracker protocol
The AllSun Trackers have several control systems to ensure continued production of power year-round
and prevent damage during inclement weather. All the trackers have an anemometer to measure wind speed.
The 24 series trackers are insured at a maximum wind speed of 95 mph and will soon be certified to withstand
110 mph wind gusts. The anemometers are connected to a control system that tilts the panels straight upwards
if the wind speed is great enough that the system could be damaged. The wind speed at which this protocol is
enabled depends on the site where the tracker is installed and the type of foundation it sits on.
These trackers also have a snow removal protocol. During the day, the panels will heat up and melt off
thin layers of frost, snow, and rime ice. At night, when snow tends to build up on the panels, the trackers will
follow the snow dump protocol. The panel will periodically switch from facing straight upright, which is the
standard orientation for the panels during the night, to facing north. This motion dumps the snow on the
northern side of the trackers so as to not shade the panels from the sun coming from the southern side. The
trackers will spread the snow out by dumping at different angles from northwest to northeast. Any remaining
snow should melt during the next day’s sun.
1.53 Power density
Because of spacing requirements to prevent shading, solar trackers have a very low power density or
amount of installable capacity per square foot. The series 24 trackers have power densities of approximately
2.27 Watts/sq ft. This density includes the open-space in between the trackers that is required so that low angle
sun will cause minimal shading. The density of the trackers can be increased if the available space for installation
is small, meaning a greater electrical output is possible, but each tracker will be less efficient. Increasing the
power density generally causes the payback period to increase because more units must be purchased to
compensate for the additional electrical output. Generally there is an optimization calculation completed by the
installer to determine the power density. This equation will balance out the install costs and payback with the
user power demand.
Regardless of how small the power density is, there will be days in the winter when the sun is at such a
low angle that shading cannot be avoided. Depending on the shape and size of the array, there are several
solutions to this problem. One resolution is to decrease the orientation angle of the front panels; while these

UVM Campus Renewable Energy Feasibility Study
Solar Photovoltaic
panels will not generate the greatest possible amount of power, they will be closer to the ground, and the
panels behind them will be shaded less and will generate more power. Again, this is an optimization calculation
that is specific to the demands of the user and the shape of the solar farm. The 2.13 MW solar farm installed in
South Burlington has trackers that are oriented in a grid facing southeast to southwest in an effort to minimize
shading from the south, the most prominent direction of the sun. The tracker towers are spaced 55 feet apart
north to south and 45 feet apart east to west.
In addition to appropriate spacing between trackers, they should also be installed away from other
obstacles that cause shading, such as buildings and trees. A standard rule used in spacing the trackers from
other obstacles is to ensure they are a distance apart that is comparable to three times the height of the
obstacle’s tallest point. Fields containing trackers should be cleared and relatively level. Trackers are several feet
off the ground, so these fields generally do not have to be mowed. If the brush on the field grows too tall, the
trackers can be oriented facing straight up to allow a brush cutter to clear the field.
1.54 Maintenance
Like all power-generating systems, solar trackers require maintenance. This mechanical care may be
more extensive than that for fixed solar panels since the trackers have additional moving parts. Annual service
plans can often be negotiated with installers as part of the purchase price. Due to the modular design of the
AllSun tracker, maintenance and repairs are simplified; each tracker has its own motor and inverter which
increases the initial cost slightly. However, if one tracker breaks, the remaining trackers will continue to produce
power and be completely unaffected. The inverter used is the SMA 6000 Sunny Boy, which is smaller, lighter and
easier to fix than a central larger inverter. Generally, they are a readily stocked and available compared to a
larger unit which could have a significant lead time. The modular design of the trackers also allows for easy
installation. Each inverter sends out grid-ready AC power, so they can be combined by simple circuit breaker
boxes. The breaker boxes can be combined in a transformer that increases the power to grid level and sends the
power away from the farm. Due to the GPS link to each of the trackers, All Earth Renewables can determine
remotely if one of the panels is not operating properly and inform the owner of this problem. The owner of the
tracker will also have access to some of this data and can possibly detect if a tracker is producing less than
expected as well. This may be more difficult on a larger system if it was not for the modular design of the
trackers. The GPS system also allows All Earth Renewables to send out revised version of the computer coding
that the systems use to update their various protocols. All Earth Renewables manufacturers all of its electronics
UVM Campus Renewable Energy Feasibility Study
Solar Photovoltaic
in house to ensure the highest level of quality. Like many competitors the AllSun trackers are rated to last at
least 20 years with minimal drops in output.
1.6 Solar Carports and Canopies
Solar Carports are basically a modified stationary ground mount racking system which features extra
height for cars to park under. One particularly good product available on the market is by Solaire Generation8.
This product is comprised of steel beams which support “traditional” PV rails. The structure can either
be purchased from a company such as Solaire Generation or it can be custom designed by an engineer and built
with readily available pieces of steel. The wiring from the modules then travels under the rails and beams to
underground conduit which feeds an inverter or inverters. In this picture you’ll see one central inverter. For
solar carports, Enphase Microinverters would certainly aid in installation ease. This is one application where we
expect the lower installation cost to balance out the higher cost for the microinverters. Additional challenges
with solar carports would be the installation of the foundations and the additional height of the structure. This
causes solar carports to be marginally more expensive to install.
One particular application we identified for solar carports was carports for charging electric cars. It is
understood that the university currently uses ‘GEM’ electric cars and we thought a charging station combined
with a solar carport would be a very cool project.
8 www.solarairegeneration.com

UVM Campus Renewable Energy Feasibility Study
Solar Photovoltaic
1.7 GEM Charging Station
What is a GEM? GEM battery-electric vehicles9 are multipurpose low-speed neighborhood electric
vehicles. They are 100% electric and are engineered to comply with federal safety requirements for street-legal
operation as low-speed vehicles (LSVs). GEM models are electronically limited to a top speed of 25 mph to meet
Federal Low-Speed Vehicle requirements.
It takes approximately six to eight hours to recharge a GEM car from a completely discharged state. The
ideal time to charge is at night when the demand for electric power is at its lowest, although the GEM car can be
plugged in virtually anywhere, at any time, to top off the charge or to completely charge the vehicle. To fully
charge a GEM car from a completely discharged state, it takes approximately 5 kwH of power.
UVM has 6 GEM cars which by using the information presented above are estimated to annually use
6,640 kWh of electricity. A carport solar PV system above the six parking spacing where the GEM's are parked
would provide this amount of electricity and then some. Since the GEM doesn't require any unique charging
system or station, the PV system will feed the adjacent building, 282 East Ave. A basic station where the cars can
be plugged into can be fabricated by running underground conduit and cable from existing building service to a
new outdoor rated subpanel and then to weather proof outlets. In this way the carport solar PV system will
offset the building in general and the GEM charging will become another load associated with the building. In 9 www.polaris.com/en-us/gem-electric-car

UVM Campus Renewable Energy Feasibility Study
Solar Photovoltaic
the winter when the cars are not used as frequently the building will be offset more by the solar PV system.
2.0 Incentive Programs:
The state of Vermont offers a number of financial incentives that aid in the construction of photovoltaic
arrays as well as other renewable installations for both residential and commercial locations. Of these, the
University is eligible for a number of rebates, the most relevant of which is a small-scale renewable energy
incentive program that funds a maximum of 60 kW of a given PV installation. Larger projects can still be eligible
for funding but only 60 kW of the installation will be incentivized. For UVM, which falls under the “special
category” (schools, hospitals, government and other non-profits), the maximum incentive through this program
would be $97,500 or up to 50% of the project costs, whichever is lower. This is a substantial grant and would be
applicable to any installation, large or small, anywhere on university property. In order to be eligible for this
incentive, the installation must be net metered, comprised of components that are UL listed (particularly UL
1703 and UL 1741 for modules and inverters, respectively) and must be installed by a registered Vermont
installer. Additionally, the system must receive a ‘Certificate of Public Good’ which has additional requirements
and in general must be in line with the AHJ’s (Authority Having Jurisdiction) planning and zoning requirements.
In addition to the state incentives, the local utility companies offer various benefits for PV generated
power. The Burlington Electric Department (BED), which services all UVM facilities within the city limits of
Burlington, has a newly implemented program that offers the outright purchase of PV generated power that is
fed directly into the grid at a rate of $0.20/kW-hour. The certificate of public good (CPG) provisions applies to
this program too, even though the system is not net metered. On average, UVM pays for power from BED at a
rate of $0.137/kW-hour so this incentive would offer a significant improvement over the standard power costs.
The solar energy installation on the Ellen Hardacre Equine Center at the Miller Research Farm is funded in part
through this program.
One of the more favorable incentives local to the Burlington area are the rebates offered by the Green
Mountain Power (GMP) electric utility company. While Burlington Electric serves the majority of campus, there
are extensive areas of the southeastern portion of university owned property including parts of the gym, the
Miller Research Farm, and the Bioresearch Complex that are in South Burlington, and consequently, the GMP
service area. This land is far less developed than the rest of campus and the area is sparsely wooded making a
ground mount PV array favorable. GMP offers $0.06 /kW-hour in addition to the avoided-cost value from net

UVM Campus Renewable Energy Feasibility Study
Solar Photovoltaic
metering for excess energy generated by solar installations making PV projects profitable on any land served by
GMP. It should also be noted that for solar installations up to 10kW, a 10-day permitting process has been
employed by the Vermont Public Service Commission, making permitting for smaller installations easier.
3.0 Interconnection & Permitting:
Net Metering:
Vermont requires electric utilities to offer net metering to all customers with Solar PV systems until the
cumulative generating capacity of net-metered systems equals 4% of a utility's peak demand. The maximum
system capacity for net metered systems is 500 kW. Interconnection of net-metered systems rated 150 kW or
less are subject to less stringent requirements.
Net-metered PV systems must conform to applicable electrical safety, power-quality and
interconnection requirements established by the National Electrical Code (NEC), the Institute of Electrical and
Electronic Engineers (IEEE) and Underwriters Laboratories (UL). A utility may not charge additional standby,
capacity or interconnection fees, or fees or charges other than the customary minimum monthly fee. However,
the customer could be required to pay for new net meters at a cost of around $300.
BED and GMP require the following for an interconnection application:
1. Renewable system layout. 2. Renewable system power source short circuit current rating. 3. Conductor size, type, locations and lengths of runs. 4. Grounding points. 5. Inverter data and locations. 6. A main lockable and load break rated disconnect information and location. 7. Service disconnect information and location(s). 8. Point of connection to the existing electrical system. Include the existing service size and number of
meters.
The Solar installation contractor is also responsible for:
1. Discussing with customer the optimal location for the equipment, inverters, piping, etc. 2. Discussing with customer how and when the generation unit will be activated. 3. Contacting BED’s Metering Services Area to schedule the installation of the net meter after Burlington’s
Electrical Inspector’s final approval of the system. BED will not install any meter until the Electrical Inspector has approved the project.

UVM Campus Renewable Energy Feasibility Study
Solar Photovoltaic
Additionally, the following key provisions apply to all net-metered, interconnected systems 150 kW or less:
1. All systems must have a utility-accessible, lockable disconnect switch, unless the system is inverter based and the utility has waived the requirement in writing.
2. Systems will be tested initially upon installation and once every two years to determine that anti-islanding controls are functioning correctly.
3. System owners must carry a minimum of $100,000 in general liability insurance for residential systems and $300,000 for non-residential sites.
4. Net metered systems must first complete an application for a "Certificate of Public Good for Interconnected Net Metered Power Systems," or register as a "Photovoltaic Systems that Are 10 kW (AC) or Less in Capacity," both of which are available on the Public Service Board's website.
3.1 Certificate of Public Good:
For projects under 10kW, Vermont has established an expedited permitting process for solar PV systems
that are 10 kW-AC or less. In order to interconnect and net meter, electric customers in Vermont must obtain a
CPG from the Vermont Public Service Board (PSB). Solar net metered systems that are 10 kW or less follow an
expedited process for the CPG. To receive a CPG, the customer must register the system with the PSB. The
customer must inform the PSB about the project and comply with the electric utility's interconnection
requirements (noted above). If there are any issues with the system's compliance with interconnection
requirements, the utility must raise these issues in a letter within 10 business days. If the utility does not raise
any issues within 10 business days, a CPG is automatically "deemed issued," and the customer may proceed with
installation. The interconnection requirements are listed above in the net metering rules. For projects 10kW to
150kW, CPG’s can be obtained from the PSB via the same process but there is no 10-day time limit.
For projects above 150kW up to 500kW, interconnection applications must be filed according to Vermont PSB
Rule 550. The Solar PV Systems we’ve recommended should fall under the fast track screening process provided
the inverters are UL 1741 listed (of which 99% of Solar PV inverters are.) Full electrical plans will be required to
be submitted with the application. Provided that the fast track screening process application requirements and
submittals are met, applications are processed in 15 days with the option to schedule a scoping meeting to take
place within 10 days after that. Upon review, interconnection agreements are issued within 5 days. Upon
receiving interconnection agreement, one could either apply for a certificate of public good or proceed through
the AHJ’s standard zoning process.

UVM Campus Renewable Energy Feasibility Study
Solar Photovoltaic
3.2 Burlington Electric’s New Program:
The bulk of our proposed PV systems are located in Burlington Electric. The dividing line between BED
and GMP is somewhere just south of the athletic fields. Burlington Electric service area is now offering an
interconnection procedure whereby the customer will feed their PV System directly to the grid via a new service
and are paid $0.20 per kWh via credits applied to any meter. This is the basis of all our analysis for buildings in
BED territory. It is anticipated that GMP will be offering a similar program but it is not online yet.
For BED’s new interconnection procedure, the requirements of the solar PV system are the same.
Instead of a net meter, the utility will install a new service dedicated to receiving the power generated by the PV
system and feed it straight to the grid.
3.3 Green Mountain Power
The Miller Farm and Bio-Research center are located in Green Mountain Power. In GMP, systems will be
net metered whereby the installation must follow the rules discussed above. A new net-meter will be installed
at a cost of around $300. In addition to the avoided cost of the electricity produced by the system, the customer
also receives a net-metering ‘bonus’ in the amount of $0.06 per kilowatt-hour. Net metered systems are limited
to 500kW.
4.0 Additional Permits:
The City of Burlington requires a number of permits for Solar PV Systems. Building permits are required
for each trade and stamped drawings will likely be required for each.
Building Permits:
Solar PV Systems will require the following building permits:
Building/Structural permit: $8.50 per $1,000 construction cost plus $20 for documents, plans…etc as a recording
fee. Stamped drawings required for “larger” projects. (We have reached out to the building inspector to
determine if they’re required by the city. It is the opinion of CHA that stamped drawings and structural
calculations should be included on all projects.)
Electrical Permit: $8.50 per $1,000 construction cost plus $20 for documents, plans…etc as a recording fee.
Stamped drawings required for “larger” projects.

UVM Campus Renewable Energy Feasibility Study
Solar Photovoltaic
Zoning Permits:
The City of Burlington requires zoning permits for Solar PV Systems since they would be considered an addition
to the building and would change the appearance. Zoning permits are also required for any extrusions through
the building. Even if the PV System is not visible (i.e. ballasted roof mount), the zoning permit would be required
because the conduit would penetrate the building and there may have inverters outside. The basic zoning
permit fee is $80 with a review time of 3-4 weeks. It is important to note, however, that projects receiving a
CPG are exempt from this process. It is estimated that all the Solar PV projects could receive this certificate.
Although projects 150kW to 500kW are not required to.
5.0 Financing Options
5.1 Solar Power Purchase Agreements:
A solar Power Purchase Agreement (PPA) is a financial arrangement in which a third-party developer
owns, operates, and maintains the system, and a host customer agrees to site the system on its roof or
elsewhere on its property and purchases the system’s power from the developer or financer for a
predetermined period. Through this financial arrangement, customers receive stable and sometimes lower cost
electricity, while the solar service provider or financer acquires valuable financial benefits such as tax credits and
income generated from the sale of electricity.
With this business model, the host customer buys the services produced by the PV system rather than
the PV system itself. This framework is referred to as the “solar services” model, and the developers who offer
SPPAs are known as solar services providers. SPPA arrangements enable the host customer to avoid many of the
traditional barriers to adoption for organizations looking to install solar systems: high up-front capital costs;
system performance risk; and complex design and permitting processes, and ineligibility for incentives and tax
credits. In addition, SPPA arrangements can be cash flow positive for the host customer from the day the system
is installed. The SPPA is beneficial to the developer because they achieve financial gain through tax credits,
depreciation and the sale of future cash flows, often to a financial partner.

UVM Campus Renewable Energy Feasibility Study
Solar Photovoltaic
10
A customer agrees to have solar panels installed on their property, typically its roof, and signs a long-
term contract with the solar services provider to purchase the power. The host property can be either owned or
leased. PPA’s are particularly difficult to set up on leased properties because of legal problems which arise
between the developer and owner and the long lifetime of the PV system compared to the lease terms. The
purchase price of the generated electricity is typically set at or slightly below the retail electric rate the host
customer would pay its utility service provider. SPPA rates can be fixed, but they often contain an annual price
escalator in the range of one to five percent to account for system efficiency decreases as the system ages and
inflation-related costs increases for system operation, monitoring, maintenance, and anticipated increases in the
price of grid-delivered electricity. An SPPA is a performance-based arrangement in which the host customer pays
10 http://www.epa.gov/greenpower/buygp/solarpower

UVM Campus Renewable Energy Feasibility Study
Solar Photovoltaic
only for what the system produces. The term length of most SPPAs can range from five years (i.e., the time by
which available tax benefits are fully realized) to as long as 25 years. In the Northeast USA and Vermont, we
typically see 10, 15 and 20 year PPA’s.
An investor provides equity financing and receives the federal and state tax benefits for which the
system is eligible. Under certain circumstances, the investor and the solar services provider may together form a
special purpose entity for the project to function as the legal entity that receives and distributes to the investor
payments from the sale of the systems kWh output and tax benefits.
The utility serving the host customer provides an interconnection from the PV system to the grid, and
continues its electric service with the host customer to cover the periods during which the system is producing
less than the site’s electric demand. All the same interconnection requirements and net metering requirements
will still apply.
The system is installed by either the developer or a 3rd party installer. The developer is also responsible
for all O&M activities. In this way, it is important to choose a PPA provider who is established and well-rooted so
they may continue the O&M support. Although the PPA may only last 10-20 years, the operating life of the
system is 20-30 years for inverters and 30-40 years for modules. After the PPA is complete, the solar PV system
is a cash-flow positive asset for the owner and thus it’s imperative that the system is well maintained during the
first half of its life.
The University of Vermont has entered into a PPA for the solar trackers that feed George D Aiken Center
remotely. Given the current incentive structure and electricity prices, we find that PPAs provide better project
economics over the short to medium term planning horizon, but owning the system provides larger cash flows in
the long-term planning horizon. Consider the following example:
Cumulative Cash Flow - 200kW Sample PV Project
Year 1 Year 10 Year 20 Year 30
Own $ (655,000.00) $(227,500.00) $ 190,275.58 $ 703,074.63
PPA $ 624.00 $ 36,463.92 $ 149,239.50 $ 659,538.55

UVM Campus Renewable Energy Feasibility Study
Solar Photovoltaic
The above example compares a 20-year PPA @ 0.13 cents (which we calculated to be feasible in
Vermont considering the current incentive structure and existing market conditions) to owning a system. The
system size is assumed to be 200kW and installed at $4.00 per watt. For owning the system, the BED $0.20 per
watt payment is assumed to be for 10 years with net metering available after. For the PPA, net metering is
assumed. A conservative estimate of electricity price inflation was included at 2% per year. The State of Vermont
averaged 2.63% increase from 2000-2010 per the US Energy Information Administration.
PPAs allow positive cash flow from year one since they require little-to-no up front capital and can be
set up at a rate below the retail electricity rate. Owning the system requires a large up front capital outlay, but
creates higher cash flows throughout the system’s operational life span. The decision between them comes
down to available capital. Considering other long-term investments, owning a PV system has a very appealing
rate of return. On the other hand, the advantage of little to no upfront capital is significant. Due to the ever-
changing market for PPAs, the incentives in VT and the cost of installations, PPA terms are constantly changing.
There are also many flexible options for PPA’s such as varied terms, buyback conditions and lease arrangements.
UVM should consult with a PPA provider or developer to get more information prior to making any decisions.
6.0 Conclusions:
The following sites on UVM’s Campus were identified as feasible for Solar PV:
Building Name Installable
Capacity (kW) Percent Offset
Athletic Campus
Austin & Marsh Hall 42.71 13.00%
Gucciardi Recreation and Fitness Center 39.36 1.29%
Harris Millis Commons 32 10.97%
Harris Hall 41.6 14.26%
Johnson House 8.97 38.78%
Living and Learning Complex 427.2 30.76%
Millis Hall 41.6 14.26%

UVM Campus Renewable Energy Feasibility Study
Solar Photovoltaic
Building Name Installable
Capacity (kW) Percent Offset
Patrick-Forbush Gutterson Complex 1,073.25 35.22%
Track and Field Building 28.5 -
Tupper Hall 12 7.30%
University Heights North 1 69 12.94%
University Heights North 2&3 100.63 18.11%
University Heights South 1 71.3 17.22%
University Heights South 2&3 112.7 36.06%
Bio-Research Complex
657 Spear St 8.18 103.90%
Bio- Research Lab-ungulate Facility 142.6 100.66%
Environmental Safety Facility 25.42 28.01%
Ground Mount Trackers – South Fields 2,286 n/a
Centennial Campus
Visitor Fieldhouse 4.9 159.75%
Central Campus
70 S. Williams St 9.2 93.85%
280 East Ave/ 282 East Ave/ Library Research Annex
Instrumentation and Modeling Facility
96.7 33.78%
284 East Ave/ Police Services/ Physical Plant/
UVM Rescue
69.04 40.94%
Admissions Visitor Center 4.5 11.43%
Aiken Center 39.2 18.48%
Angell Lecture Center 35.8 28.64%
Bailey Howe Library 256
Benedict House 5.2 31.66%
Billings Lecture Hall 60.72 14.20%

UVM Campus Renewable Energy Feasibility Study
Solar Photovoltaic
Building Name Installable
Capacity (kW) Percent Offset
Buckham & Chittenden Hall 105.6 26.13%
Fleming Museum 8 2.02%
Jeanne Mance Hall 18.24 13.01%
Jeffords Hall 25.6 1.30%
Kalkin Building 81.96 13.70%
Marsh Life Sciences 34.42 2.05%
Rowell Hall 105.15 2.29%
Royall Tyler Theater/ Central Heating Plant 100.74 31.61%
Votey Hall 116 9.88%
Wadhams House 2.9 16.41%
Wills Hall 13.04 5.88%
Miller Research Complex
Animal Care Facility 10.12 1.82%
Cow Canopies 27.6 4.97%
CREAM Barn 82.8 14.92%
Fitzsimmons Arena 26.45 4.77%
Free-Stall Facility 54.45 9.81%
Hardacre Equine Center 80.5 14.51%
Maternity / Nutrition / Hay and Commodities 85.32 4.81%
South Fields Solar Tracker 1760 n/a
North Fields Solar Tracker 748 174%
Redstone Campus
Blundell House 14.4 53.43%
Christie Hall 16 2.02%
Coolidge Hall 21.2 14.30%
Davis Hall 34.4 15.46%

UVM Campus Renewable Energy Feasibility Study
Solar Photovoltaic
Building Name Installable
Capacity (kW) Percent Offset
Hamilton Hall 20.8 3.91%
Mason Hall 20 3.76%
Music Building 15.8 10.85%
Patterson Hall 26 3.29%
Simpson Hall 69 12.96%
Wilks Hall 35.2 15.82%
Wing Hall 35.2 15.82%
Wright Hall 31 3.92%
Trinity Campus
Cottages-256 6.33 57.71%
Farrell Hall 99 52.86%
Hunt Hall 16 14.91%
Ira Allen School 44.4 51.75%
Mann Hall 31.42 7.76%
McAuley Hall 63.2 12.17%
McCann Hall 16 14.88%
Mercy Hall 22.4 5.99%
Ready Hall 36.56 34.01%
Total Installable Capacity (kW) 4,511.48
Total Annual Output (MWh) 5,413.776
2011 Electrical Usage (MWh) 63,809.276
Total Percent Offset 8.48%

UVM Campus Renewable Energy Feasibility Study
Solar Photovoltaic
A total of 66 buildings and 3 ground mount tracker sites were designated as good candidates for solar
PV installation. Buildings located in the athletic campus area have the greatest combined installable capacity of
2,100.82 kW. The Bio-Research complex buildings combine for an installable capacity of 176.2 kW. The one
building of the Centennial campus area has a total installable capacity of 4.9 kW. Central campus has the second
highest installable capacity (1,188.01 kW). Miller Research complex, Redstone campus, and Trinity campus all
have similar installable capacities: 367.24 kW, 339 kW, and 335.31 kW, respectively. The buildings of each
campus area combine to give a total percent offset of 8.48%. It is important to note that the ground mount
tracker options were to show the solar PV installation potential of the available field and ground areas on UVM
land. In actuality, an agreement with GMP would be needed to interconnect that much power to their
distribution lines. Community net metering could be utilized, but the maximum size is 500kW.
The following parking lots were also identified as feasible for Solar PV.
Parking Lot Name Installable
Capacity (kW)
Adjacent Building
Offset
Athletic Complex 497 14.14%
East of 70 S. Williams St 31 202.19%
East of Blundell House 36 122.45%
East of Chittenden 85 12.86%
East of Fleming Museum 14 3.31%
East of Harris Millis 124 12.94%
East of Health Sciences 25 0.72%
East of Redstone Apartments 87 11.91%
East of Tupper 95 17.69%
South of Water Tower 72 3.51%
East of Wing Davis Wilks 93 13.89%
North & South of Admissions 100 97.43%
North of Delehanty 49 9.60%
North of Jacobs House 6 18.48%
North of Police Services 16 9.49%

UVM Campus Renewable Energy Feasibility Study
Solar Photovoltaic
Parking Lot Name Installable
Capacity (kW)
Adjacent Building
Offset
North of University Heights 51 9.16%
Northeast of Mercy 76 19.42%
South of Aiken 14 6.32%
South of Catholic Center 16 39.11%
South of Johnson 55 35.50%
South of Police Services 30 16.31%
South of Southwick 82 25.30%
Southwest of Mann 7 1.66%
Southwest of University Heights 17 5.21%
West of Ira Allen Building 10 11.17%
West of Mann Hall 45 10.64%
West of University Heights 65 19.93%
West of Waterman 115 8.74%
Wheeler/ Pierce Spaulding 101 220.46%
Total Installable Capacity (k 2,014
Total Annual Output (MWh 2,268.5
2011 Electrical Usage (MW 63,809.276
Total Percent Offset 3.56%
We identified multiple parking lots that are conducive to solar PV installation and utilization. Overall, 29 lots
were chosen as good candidates, and they result in a total installable capacity of 2,014 kW. Combined, they
produce a total offset of 3.56% (using 2011 electrical usage values).

UVM Campus Renewable Energy Feasibility Study
Solar Photovoltaic
7.0 Recommendations:
CHA recommends widespread installation of PV systems across UVM’s campus. The most appealing projects
would be the larger rooftop projects on campus. We would also recommend the use of PPA financing
mechanisms. Pricing of PPA’s in BED versus GMP should be investigated, considering their incentive program
variations. Additionally, the University should balance the appeal of little-to-no upfront capital requirements of
PPA’s with the greater lifetime savings achieved from owning the system. System purchase options are not black
and white and there may be PPA’s which fall in-between these two scenarios such as a PPA with a buyout
provision.
CHA also recommends bulk purchases of PV systems. If a PPA contract can be made (for example) on a block of
2MW of projects on various buildings, UVM would see an economy of scale on materials and equipment and be
able to spread out the financing cost. Additionally, a larger block of projects would attract a larger set of
developers and PPA providers. It would be the expectation that overall cost would fall as well. The potential for
PV investment on UVM’s campus is ample, and given the local, state, and federal incentives, right now is a great
time to explore possible installation projects.

UVM Campus Renewable Energy Feasibility Study
Anaerobic Digestion
1
Anaerobic Digestion
1.0 Introduction
Anaerobic digestion is the biological conversion of degradable organic materials to carbon dioxide (CO2)
and methane (CH4) in the absence of oxygen. The process is carried out by a consortium of bacteria in a
series of sequential bio-chemical reactions that have been likened to a bucket brigade. Methane
production from hydrogen or acetate is the last step in the process, but each step in the process must
occur in lockstep for the overall process to work.
Anaerobic digestion is typically carried out in closed reactors (devoid of oxygen) and though the process
has long been employed in wastewater treatment to treat sludge and high strength organic wastes, and
on farms to stabilize manure, public interest in the use of anaerobic digestion has grown in recent years
because the process has low energy requirements and the methane produced in the process has a
recoverable energy value. One cubic foot of biogas produced from anaerobic digestion the of organic
waste typically has an energy content of 600-650 BTU.
UVM now generates a number of wastes that that are candidates for anaerobic digestion and several
studies have previously been commissioned and completed to explore the opportunities for the
anaerobic digestion and recovery of energy from these wastes. This section reviews the findings from
the past studies and it explores current opportunities for anaerobic digestion as a part of UVM’s efforts
to identify and develop renewable energy sources and adopt more sustainable energy practices.
2.0 Anaerobic Digestion of Campus Organic Wastes
UVM has a student population of approximately 12,500 with approximately 1,500 full- and part-time
faculty. The campus dining and residence halls generate an estimated 225-268 tons/year of food wastes
and grounds maintenance operations are projected to produce another 45-100 tons/year of organic
material suitable for composting or digestion (2009, Highfields Center for Composting).
UVM also operates a Dairy Science center at the Miller Farm site approximately one mile from the main
campus. In 2009, estimates of the digestible organics (mixed horse and cow manures) generated at this
site ranged from 1,068 to 2,465 tons per year (2009, Highfields Center for Composting). The large
difference between estimates may have been the result of confusion over the units used to report waste
quantities (units of m3/year and ton/year were alternately reported in different studies with the same

UVM Campus Renewable Energy Feasibility Study
Anaerobic Digestion
2
numeric values), differences in estimated herd size, composition, or retention time, differences in
manure generation rates, or errors in the conversions between weights and volumes. Although the
cause of the large difference between the previous estimates is still not certain, if the herd size of 200
that was reported in 2009 was correct, and an average manure production of 75 lb/head/day (Ohio
State University) is assumed, a value for manure production in the range of 2,000 tons/year would have
been a reasonable estimate. Thus total campus and Farm organic waste production in 2009 was
approximately 2,400 tons/year, or roughly 6.5 tons/day. Significant daily fluctuations in this waste
volume would have been expected over the course of a year as student populations varied and farm and
campus landscaping operations progressed thru the seasons. Waste storage would normally be
employed to reduce the impact of these variations on an anaerobic digestion process.
In 2009 two separate studies were completed that examined the feasibility of either composting the
campus and Miller Farm organic wastes or digesting them in a high solids digester at the Miller Farm site
(2009, Highfields Center for Composting; 2009, Forcier, Aldrich & Associates). A second study looking at
a reduced scale digestion option with a reduced herd size of 34 milking cows and 157 young stock at the
Miller farm site was completed in 2010 (2010, Forcier, Aldrich & Associates). Although a portion of the
campus organic wastes are presently being composted at a site on Spear Street approximately one-
quarter of a mile from the Miller Farm site, neither full scale composting or digestion of the campus and
Miller Farm organic wastes has yet been implemented. As a result, the energy potential of the campus
and Farm organic wastes has not been realized.
The potential to produce energy from the digestion of the campus and Farm organic wastes was first
identified in 2010 (2010, Forcier, Aldrich & Associates). At that time it was estimated that digestion of
organic wastes from the campus and the Miller Farm would produce enough biogas to support the
process and operation of a 40 to 100 kW engine-generator. The energy output was noted to be
dependent on the length of digestion employed in the process (longer detention times yield higher
biogas production) and the availability of external sources of manure or other compatible organic
wastes (e.g., cheese or yoghurt whey, alcohols or glycols, bakery wastes, apple processing wastes,
restaurant oil and grease) to help source the digester.
The digestion concept recommended in the 2010 is presented in Figure 1 below. It was based upon a
single complete mixed digester using technology developed by Genesys/CHFour, but there are other US

UVM Campus Renewable Energy Feasibility Study
Anaerobic Digestion
3
and European manufacturers of similar systems that have been successfully employed in this type of
application.
Figure 1 – Genesys/CHFour Digestion Concept (2010, Forcier, Aldrich & Associates)
The estimate for the actual installation of this system was $1,089,000 with a simple payback of 5.4 years
assuming that the digester was augmented with wastes from external sources to allow continuous
energy production at 100 kW. There was no capital payback for the option of system operation without
external wastes at 40 kW. The projected annual revenues and expenses at this lower energy production
rate were approximately equal.
Operations at the Miller Farm were scaled back significantly after the 2010 study was completed. Scott
Shumway, the farm manager, now reports that the current herd consists of 34 milking cows,
approximately 30 dry cows and replacement heifers, and 22-24 horses. The sawdust and horse manure
from horse stalls is used as a moisture adsorbent in the cow barn and thus the horse manure is captured
together with the cow manure and available for digestion. Although there are future plans that would

UVM Campus Renewable Energy Feasibility Study
Anaerobic Digestion
4
double the size of the milking herd (with a proportional increase in the number of dry cows and
replacement heifers), a new cow barn with a milking parlor would be required to support this increase
and no funding is currently available for the new barn. Without this funding it is safe to assume that the
herd size will not change from current levels.
The scale back in operations at the Miller Farm has significantly reduced the organic waste mass now
available for anaerobic digestion. With the current herd size, total farm and campus organic waste
production is approximately 1,000 tons per year and this would halve the size of the digester proposed
in the 2010 study. Although anaerobic digestion at this scale is still technically feasible, and construction
costs would be substantially less (approximately 75% of the original estimates), the payback assuming
gas conversion to electric would still be non-existent because the sale price of electric is low. The price
of electric reflects the economies of scale associated with large scale generation using fossil fuels and
small scale electric generation can rarely compete on a price basis. Other uses of the biogas that might
produce a better economic return and/or yield other desirable non-monetary attributes should now be
considered to determine if anaerobic digestion of the campus and Farm organic wastes at a reduced
scale might be justifiable. These are considered below.
3.0 Biogas Production from Anaerobic Digestion
Estimates of biogas production were never directly identified in any of the earlier digestion studies, but
assuming an engine-generator efficiency of 28% the rate of biogas production necessary to support
generator operation at 40 to 100 kW would range from approximately 20,000 to 50,000 ft3/day. These
estimates are reasonable based upon the projected quantities and types of wastes that would have
been available for digestion. Approximately half of this biogas, or 10,000 to 25,000 ft3/day, could now be
produced by anaerobic digestion of the campus and Farm wastes given the reduction in herd size. As
before, greater quantities of biogas might be produced if external sources of compatible wastes could
be found to augment the digester feed. In all cases, the biogas would have a composition of
approximately 60 to 65 percent methane (CH4) and 35 percent carbon dioxide (CO2). The balance would
be comprised of water vapor and trace quantities of hydrogen gas (H2), nitrogen gas (N2), and hydrogen
sulfide (H2S). A portion (approximately 30 percent) of the biogas produced during digestion would be
required for digester heating. Heat would be produced by firing the gas in a boiler, by recovering the
exhaust gas and engine jacket heat from an engine-generator, or some combination of each. The heat

UVM Campus Renewable Energy Feasibility Study
Anaerobic Digestion
5
would typically be transferred into the digester via a sludge-to-water heat exchanger. The remaining
gas, or approximately 7,000 to 17,500 ft3/day of biogas, would now be available for recovery and use.
3.1 Biogas Utilization Options
There are number possible uses for the excess biogas that might be generated from the digestion of the
campus and Farm organic wastes including:
• heat and electricity production for Farm use;
• sale of excess electric to the grid;
• cleanup for pipeline sale or transport to the campus as a substitute for natural gas, and;
• conversion of the biogas for vehicle fuel use (clean and compress to produce a substitute form
of compressed natural gas).
In the prior studies all but the first two options were discounted, but those same studies demonstrated
that the production of electric at the original scale of digestion was not feasible if external sources of
waste were not used to augment the digester feed and a payback on the initial capital investment was a
required outcome. The economics of electric production and sale would be even less attractive today at
the reduced scale of digestion now possible given the reduction in herd size.
The option of biogas conversion to fuel now warrants further consideration. The use of the biogas for
vehicle fuel (originally cited as not feasible) is gaining in popularity because it is a sustainable practice
and the technology to clean biogas has substantially evolved over the last several years. At least two
manufacturers (Pioneer Air and BioCNG) now produce small scale systems to clean and compress biogas
to produce vehicle fuel and there are significant economic and environmental benefits that may be
derived from using the biogas produced from organic waste digestion to produce vehicle fuel. There are
also incentives available that may help to defray the initial capital costs and improve the return on
investment.
3.2 Biogas as a Vehicle Fuel
Renewable Natural Gas (RNG) is a term used to describe natural gas produced from unconventional
sources where biological processes (like anaerobic digestion) produce methane from organic matter.
Biogas, digester gas, and landfill gas are all terms used to describe sources that may be used to produce
RNG. Natural gas derived from these sources is considered a renewable fuel because the original source
of the carbon in the decomposed waste can be traced back to the organic source that replenished it.

UVM Campus Renewable Energy Feasibility Study
Anaerobic Digestion
6
Until recently, RNG was often vented to the atmosphere or burned off in a flare. After treatment to
remove CO2, moisture, and other contaminants, RNG is chemically identical to fossil natural gas, yet it
produces far fewer Greenhouse Gas (GHG) emissions, and thus the direct use or blending of RNG with
fossil natural gas can provide significant life-cycle GHG benefits. In a 2011 study of RNG production
pathways, the Argonne National Laboratory concluded that all RNG pathways show significantly less
GHG emissions and fossil fuel consumption than conventional fossil fuel natural gas and gasoline.
Vehicle emissions should be a source of concern to all Americans because they impact the air we
breathe. They should also be a source of concern to UVM. The conversion of the UVM vehicle fleet to
RNG or a mixture of RNG and Compressed Natural Gas (CNG) would have significant environmental
benefits. Natural gas (either from RNG or CNG) burns cleaner than conventional gasoline or diesel due
to its lower carbon content. When used as a vehicle fuel, it can offer life-cycle GHG emissions benefits
over conventional fuels, depending on vehicle type, drive cycle, and engine calibration. In addition,
using natural gas (RNG or CNG) may reduce some types of tailpipe emissions.
The biogas that would be produced from the anaerobic digestion of UVM’s organic wastes would have a
Gasoline Gallon Equivalent (GGE) of approximately 190 ft3/GGE. With the current Farm herd size the
anaerobic digestion of campus and Farm organic wastes could produce as much as 17,500 ft3 of excess
biogas each day, or about 92 GGE/day. On an annual basis this would equate to 33,600 GGE; a
substantial amount of substitute vehicle fuel. The approximate value of this substitute fuel at an avoided
cost for gasoline (1 GGE) of $3.50 would be approximately $117,600. Production downtime for
production equipment maintenance and lack of compressed gas storage receivers to balance supply and
demand would reduce this value, but nominally it should be possible to produce compressed RNG with
an equivalent fuel value of $85,000/year (assumes 75% production efficiency) from the organic wastes
now available on the campus and at the Farm. Additional income might be possible because the fuel
would qualify for Renewable Identification Numbers (RINS) under the federal Renewable Fuels Standard.
To place the numbers above in perspective, the UVM vehicle fleet consumes an estimated **** gallons
of gasoline and **** gallons of diesel, or approximately **** Gasoline Gallon Equivalents (GGE) each
year. At an estimated average price of $3.50 per GGE, this amounts an annual expenditure of
approximately $****** for vehicle fuel. Although the production of RNG from organic waste digestion
cannot meet the entire UVM vehicle fleet needs, blending pipeline natural gas with the RNG prior to

UVM Campus Renewable Energy Feasibility Study
Anaerobic Digestion
7
compression to form a RNG/CNG compressed gas mixture could satisfy fleet energy needs and help our
environment.
If anaerobic digestion of the campus organic wastes were implemented with a goal to produce RNG, the
portion of the biogas not used for digester heating could be cleaned to remove moisture, H2S, CO2, and
siloxanes in a temperature swing adsorption process and/or by the use of membrane separation. The
cleaned RNG could be used alone or blended with pipeline natural gas and then compressed to
approximately 5,500 psig using a multi-stage compressor before it is was stored in pressurized gas
storage vessels that could be transported over the road to a filling station on the campus property.
Typical CNG tube trailers (Figure 2) contain anywhere from 200-400 GGE; enough capacity to hold 2-4
days of RNG production from a digester sized to handle current campus and Farm organic waste
production.
Figure 2 – Typical CNG/RNG Tube Trailer (FIBA Technologies)
For vehicle fueling, UVM would need to purchase and install a self- contained CNG fueling station similar
to the Galileo NANOBOX (Figure 3). The RNG/CNG filling station could be installed beneath a simple
canopy and should be sized to provide a nominal filling rate of at least 3-5 GGE per minute (fast-fill)
based upon the use of stored and pressurized RNG delivered by trailer from the Miller farm site. An
alternative would be to sell the RNG to the existing vehicle CNG supplier in Burlington. Though travel

UVM Campus Renewable Energy Feasibility Study
Anaerobic Digestion
8
times for UVM fleet vehicles might be greater, the capital cost savings for filling station construction
might offset the added travel costs.
Figure 3 – CNG/RNG Filling Station (Galileo)
3.3 RNG Production Costs & Vehicle Fleet Conversion Costs
Our estimate of the costs to install a RNG production system with the capacity to process 36,000 ft/3 day
of biogas is approximately $800,000. This cost includes the gas cleanup system, storage of the
compressed RNG in a tube trailer, and a single RNG filling station with automated dispensing system and
card control for fuel use tracking and accounting. Operating costs for gas cleanup and compression are
estimated to be approximately $30,000/year.
The use of RNG for vehicle fueling would also require the conversion of the UVM vehicle fleet to
CNG/RNG use. This would likely occur over a period of years. As vehicles were scheduled for
replacement, the replacement vehicles would be equipped with CNG/RNG fuel systems.
The overall cost of fleet vehicle conversion (the added cost above the cost of traditional gasoline or
diesel vehicles) can be estimated from the values in the table below:

UVM Campus Renewable Energy Feasibility Study
Anaerobic Digestion
9
Table 1 – Estimated Costs for Vehicle Conversion to RNG/CNG Use
Item Description Unit Quantity Unit Price
4 to 6 Cylinder Gasoline Engines EA 20 $8,000.00 8 Cylinder Gasoline Engines EA 6 $12,000.00 10 Cylinder Gasoline Engines EA 7 $18,000.00 8 Cylinder Diesel EA 2 $40,000.00 10 Cylinder Diesel Truck EA 8 $50,000.00
4.0 Environmental and Economic Outlook
On a simple economic basis the cost of installing a process to anaerobically digest the campus and Farm
organic wastes and convert the excess biogas produced by digestion to RNG is difficult to justify. The
digester needed to produce biogas for RNG production would cost approximately $820,000 and fuel
preparation, storage, and dispensing facilities would cost another $800,000 ($1.62 million in total
excluding vehicle conversion costs). Operating revenues from fuel sale (assumed to be $85,000/year)
would approximately equal the costs for system operation and thus there would be little chance for
return on the initial capital investment.
In a broader context, digestion of the campus and farm organic wastes and the production of RNG for
use as a fuel in UVM fleet vehicles would produce both economic and environmental benefits that are
difficult to quantify. Anaerobic digestion would not reduce the nitrogen and phosphorus content of the
waste and the residuals from digestion (digestate) containing these nutrients would still be applied to
the Farm fields to reduce the need for manufactured fertilizer and its associated environmental and
economic costs; in fact the incorporation of food waste would add to the nutrient value already realized
by directly applying manure to the land. In addition, the use of non-renewable fossil fuels for vehicle
fueling would be reduced and less GHG and other tailpipe emissions would be produced. If the true
costs of fossil fuel production and GHG emissions to our society could be quantified it is all but certain
that anaerobic digestion of the campus and farm organic wastes would yield positive economic and
environmental benefits.

UVM Campus Renewable Energy Feasibility Study
Anaerobic Digestion
10
References
Forcier, Aldrich & Associates. (April 2009). Miller Farm Anaerobic Digestion Study Phase I, for 2009 Dairy
Herd.
Forcier, Aldrich & Associates. (February 2010). Miller Farm Anaerobic Digestion Study Phase II, for
Smaller 2010 herd plus Campus Organics.
Highfields Center for Composting (December 2009). University of Vermont Composting Feasibility
Assessment.
Ohio State University. Bulletin 604-06. Ohio Livestock Manure Management Guide.
UVM Campus Renewable Energy Feasibility Study
Biomass
1
Biomass Energy
1.0 Introduction
Biomass Energy is the utilization of a renewable fuel source (typically wood chips, bark, sawdust,
wood process residues, wood pellets, wood pallets, agricultural waste, yard clippings and even
municipal solid wastes) for the the production of thermal energy (heat); the production of both
electricity and thermal energy (i.e. CHP/cogeneration); and/or the production of a renewable
natural gas (biogas or syngas), which can be further utilized to produce heat and/or electricity
by various means.
Simply burning wood for heating purposes is obviously not new in our society, however, the
continued development of existing technologies and the emergence of new technologies
provides a wide variety of choices for project proponents, including but not limited to:
• Conventional steam (Rankine) cycles, i.e. a biomass boiler supplying steam to a steam
turbine generator, with or without the provision of steam to a thermal host. In very large
plants (e.g. the nearby McNeil Generating Station), the cycle can be enhanced by the use of
high steam temperatures and pressures, multiple pressures, and feedwater heaters. Boilers
can range from large field erected grate type boilers to fluidized bed units.
• Biomass combustors or biomass-fed gasifiers/oxidizers, feeding hot flue gases to heat
recovery steam units, for thermal energy production (steam) and/or steam turbine
generators. Or, simply producing hot-water for distribution in a district energy system.
• Reciprocating engine generators or gas turbine generators fired on synthetic gas
produced by a biomass-fed gasifier. Each of these could have hot-water and/or steam
generation added.
• Stacked technologies employing a biomass combustor, with thermal oil as an
intermediate fluid, an organic Rankine cycle (ORC) as the electricity producer, with a hot-
water system to provide thermal energy.

UVM Campus Renewable Energy Feasibility Study
Biomass
2
1.1 UVM Campus Biomass Location Candidates
There are two (2) primary candidates for a biomass energy system at the University of Vermont
campus that we have examined herein:
• Trinity Campus – this group of buildings on the north end of campus has recently been
integrated into UVM operations and is served electrically by BED feeders. Some of the
buildings are heated by gas-fired boilers and some are heated electrically (this new area of
the campus is not served by the Cage steam system). UVM is considering converting the
electrically heated buildings to gas-fired boiler hot-water boilers, or to a district heating hot-
water system in the future.
This group of buildings is a possible candidate1 for some basic biomass options: a) a biomass
cogeneration system providing both electricity (off-setting BED purchases) and hot-water
production for integration into a new distribution system; or b) hot-water production only
(i.e. no electricity or cogeneration).
In 2010-2011, a group of UVM interns conducted an extensive “Biomass Feasibility Study for
Trinity Campus / Retrofitting Trinity Campus for Woody Biomass”, which was primarily
dedicated to examining heating-only applications (i.e. item b) above).
The intern study concluded that with fuel at $37/ton ($2.30~$4.20/mmbtu, depending on
delivered moisture content), the payback period (ROI) of a Trinity biomass gasifier addition /
modification of one of the existing Trinity hot-water boilers was in the order of 21~22 years,
and that of a direct combustion biomass hot-water heating system at 30~63 years.
The study raised several concerns about wood delivery truck traffic in an urban
environment, and the reliability of obtaining a supply of locally-harvested and sustainable
wood supply. The study also pointed out that the cost of biomass fuel can be unreliable, and
the obvious that natural gas fuel supply is stable and is (currently) relatively inexpensive.
1 As noted elsewhere in this study, any biomass energy option for Trinity Campus would have to compete with
other energy provision means, including: an extension of the UVM steam system across Colchester Avenue to the group of buildings; or small-scale renewable/sustainable technologies such as gas-fired fuel cells, reciprocating engine generators or micro-turbines with CHP heat recovery providing hot-water.

UVM Campus Renewable Energy Feasibility Study
Biomass
3
• Cage Complex – the central heating plant produces and distributes steam into the main
campus distribution system.
If sufficient space could be found nearby, a large or small steam-producing biomass boiler
system could be integrated into the heating plant sub-systems, and into the steam
distribution system. However, after discussion with UVM staff and a review of the local area,
it would appear that a large biomass steam plant would face several hurdles and barriers,
including delivery truck concerns, local stack particulate emission concerns, inadequate
space for fuel handling and storage, and lack of plot plan area.
Alternatively, a small biomass cogeneration system could be integrated into the heating
plant operations, as discussed further below.
As noted in the intern study, a biomass plant(s) could be constructed at the Redstone Campus,
Athletic Campus, or on UVM land around the perimeter of the campus, to supplement the
existing steam distribution system. These were not examined at this point in time.
1.2 Biomass Cases Studied
Trinity Campus Heating by Biomass
The 2010-2011 UVM Intern Trinity Biomass Study is an excellent overall discussion of two
possible methods of heating the buildings already heated by gas-fired boilers (but not the
electrically heated buildings). As noted above, the payback periods are in the order of 20~60
years.
In the economic analysis below, we have simply reviewed and refined some of the project
capital cost parameters and noted the change in payback period with biomass fuel pricing
double that used in the intern study.
Trinity Campus Biomass Cogeneration
For a cogeneration opportunity at Trinity, we have assumed that a relatively-small, proprietary
biomass cogeneration system (discussed in more detail below) would provide hot-water for
about 40% of the year, only to the buildings that are currently electrically heated, and would

UVM Campus Renewable Energy Feasibility Study
Biomass
4
provide electricity to the Trinity buildings.
Accordingly, the hot-water production would off-set expensive electricity purchases, not gas-
fired boiler fuel, potentially resulting in improved payback. We have not allowed for the cost of
the creation of a buried hot-water distribution system or energy transfer stations and hot-water
heaters in the electrically-heated buildings. Estimates should be calculated during the
preliminary stages of project development.
Cage Complex Biomass Cogeneration
For the cogeneration opportunity at the Cage Complex, we have assumed the same relatively-
small proprietary cogeneration system, providing electricity for displacement of purchased in-
plant power consumption, and heat in the form of hot-water to pre-heat condensate to the
deaerator, which will slightly reduce the amount of deaeration steam required for the plant
deaerator, thus improving the boiler plant efficiency.
2.0 AgriPower AG-125 Cogeneration System
For convenience, and considering the “smaller” size / load range discussed above, and the space
available for such a system, we will limit the discussion herein to a “typical” pre-packaged
biomass cogeneration system in the 125 kWE range, as offered by AgriPower, Inc. (AG-125).
Other manufacturers and packagers offer similar systems.
The basic elements of an AgriPower proprietary AG-125 cogeneration system and it’s auxiliaries
includes a pre-packaged wood unloading, bulk storage and feed system; a refractory-lined
biomass combustor complete with combustion fans, fuel feed augers, and ash augers with ash
hopper and removal systems; a flue gas to thermal oil and to hot-water heat exchanger system;
an Organic Rankine Cycle (ORC) module producing electricity at 480 VAC, 60 Hz; a flue gas
emissions control system, including cyclone separators and baghouse; and a hot-water
distribution system to a thermal host.
This equipment, along with controls, electrical services and interconnection to an electrical load,
and interconnection to an existing or new hot-water distribution system, represents the basic
requirements for a small biomass cogeneration system. The approximate space required for the

UVM Campus Renewable Energy Feasibility Study
Biomass
5
system, with major equipment located in a building, is in the order of 75’ x 100’, plus access
around portions of the perimeter.
The nominal performance of the AG-125 cogeneration unit can be summarized as follows:
Gross Electrical Output: 125 kWE Net Electrical Output: 100 kWE
Fuel Consumption: 10 tons/day (dry at 7500 btu/lb): 833 lb/hr
Available / Net Thermal Output: 1.2 mmbtu/hr (for hot-water distribution)
The total installed cost for the system, including site preparation and a building, but not the
interconnected hot-water distribution system, would be in the order of $3.0~3.5 million.
3.0 Simplified Economic Analysis
A simplified economic analysis has been performed including nominal project capital cost;
electricity purchases off-set; gas-fired boiler fuel saved or electricity saved by the production of
heat; and nominal equipment maintenance cost.
In all cases, we assumed that all the energy available from the AG-125 unit could be used
whenever the unit was operated (100% of the time at Cage, 65% of the time at Trinity).
Cases have been provided for $5.00/mmbtu and $12.85/mmbtu gas prices, 12.1 and 15.0
c/kW.hr electricity pricing and $2.50/mmbtu and $5.00/mmbtu wood prices ($2.50 is assumed
in the intern study and we used $5.00 as a worst case).
In the analysis, we have not accounted for BED standby charges or additional staffing costs (all
of these systems will require regular attendance by qualified operators and maintenance staff).
At the Cage, the existing staff may be able to handle the regular operations and fuel / ash
management activities, but at Trinity, additional staff would be required.
The following table summarizes the simplified economic analysis of biomass energy
opportunities – heating and cogeneration – at Trinity and the Cage.

UVM Campus Renewable Energy Feasibility Study
Biomass
6
Description Units
Biomass Heating Update Trinity
AG-125 Biomass Cogen Trinity
AG-125 Biomass Cogen Cage
Equipment/Project Capital Cost $ 2,000,000 3,000,000 3,000,000 O&M Cost $/yr 20,000 25,000 25,000 Gross Power kW 0 125 125 Aux Power (engine & auxiliaries) kW 0 25 25 Net Power kW 0 100 100 Fuel Consumption (HHV) (long-term average) mmbtu/hr 6.25 6.25 6.25 Thermal Heat (recovery) mmbtu/hr 4.7 1.2 1.2 Hrs per year 8,410 8,410 8,410 % of year thermal load exists % 40% 40% 100% Simple Economic Summary with 12.85 gas and 12.1 c/kW.hr and $2.50 wood
Electrical Cost Savings $ 0 169,500 101,756 Thermal Fuel Savings $ 270,158 0 162,095 Fuel Cost $ -52,560 -52,560 -131,400 O&M Cost (staffing ignored) $ -20,000 -25,000 -25,000 Annual Savings $ 197,598 91,940 107,451 Payback years 10 33 28
Simple Economic Summary with 5.00 gas and 15.0 c/kW.hr and $2.50 wood
Electrical Cost Savings $ 0 210,124 126,144 Thermal Fuel Savings $ 105,120 0 63,072 Fuel Cost $ -52,560 -52,560 -131,400 O&M Cost (staffing ignored) $ -20,000 -25,000 -25,000 Annual Savings $ 32,560 132,564 32,816 Payback years 61 23 91 Simple Economic Summary with 12.85 gas and 12.1 c/kW.hr and $5.00 wood
Electrical Cost Savings $ 0 169,500 101,756 Thermal Fuel Savings $ 270,158 0 162,095 Fuel Cost $ -105,120 -105,120 -262,800 O&M Cost (staffing ignored) $ -20,000 -25,000 -25,000 Annual Savings $ 145,038 39,380 -23,949 Payback years 14 76 NA
Simple Economic Summary with 5.00 gas and 15.0 c/kW.hr and $5.00 wood
Electrical Cost Savings $ 0 210,124 126,144 Thermal Fuel Savings $ 105,120 0 63,072 Fuel Cost $ -105,120 -105,120 -262,800 O&M Cost (staffing ignored) $ -20,000 -25,000 -25,000 Annual Savings $ -20,000 80,004 -98,584 Payback years NA 37 NA
UVM Campus Renewable Energy Feasibility Study
Biomass
7
4.0 Final Biomass Discussion
Biomass energy utilization, whether used in a heating / steam production configuration, or in a
cogeneration configuration, faces significant challenges related to initial plant cost; fuel cost /
availability uncertainty; space requirements; operational manpower / staffing; perceived
emissions concerns; delivery truck traffic; appropriate ash disposal; and for cogeneration at
UVM, BED standby charges.
The simplified economic analysis conducted for potential small biomass opportunities at Trinity
or the Cage reveal that for current and potential-future wood fuel, natural gas and electricity
prices, the resultant savings result in long payback periods for each.

UVM Campus Renewable Energy Feasibility Study Geothermal
1
Geothermal
1.0 How It Works:
A geothermal heat pump or ground source heat pump is a central heating and/or cooling system that
pumps heat to or from the ground. It uses the earth as a heat source (in the winter) or a heat sink (in the
summer). This design takes advantage of the moderate temperatures in the ground to boost efficiency and
reduce the operational costs of heating and cooling systems, such as hydronic heating systems. Geothermal
heat pumps are also known by a variety of other names, including geoexchange, earth-coupled, earth energy or
water-source heat pumps. The engineering and scientific communities prefer the terms "geoexchange" or
"ground source heat pumps" to avoid confusion with traditional geothermal power, which uses a high
temperature heat source to generate electricity. Ground source heat pumps harvest a combination of
geothermal power and heat from the sun when heating, but work against these heat sources when used for air
conditioning.
Water stores tremendous quantities of heat. In nature, few substances have a higher specific heat
capacity (one BTU per pound) than water, making it an ideal heat storage substance for both natural and man-
made applications.
Depending on latitude, about 9.8ft of the Earth's surface maintains a nearly constant temperature
between 50 and 60°F. Like a refrigerator or air conditioner, Geothermal systems use a heat pump to aid in the
heat transfer. Geothermal heat pump systems can transfer heat from a cool space to a warm space, against the
natural direction of flow, or they can enhance the natural flow of heat from a warm area to a cool one. The core
of the heat pump is a loop of refrigerant pumped through a vapor-compression refrigeration cycle that moves
heat. Heat pumps are always more efficient at heating than pure electric heaters, even when extracting heat
from cold winter air. Unlike an air-source heat pump, which transfers heat to or from the outside air, a ground
source heat pump exchanges heat with the ground. This is much more energy-efficient because underground
temperatures are more stable than air temperatures through the year. Seasonal variations drop off with depth
and disappear below 20 ft. due to thermal inertia. Like a cave, the shallow ground temperature is warmer than
the air above during the winter and cooler than the air in the summer. A ground source heat pump extracts
ground heat in the winter (for heating) and transfers heat back into the ground in the summer (for cooling).
Some systems are designed to operate in one mode only, heating or cooling, depending on climate. The more
extreme the temperature the more efficient the system. These systems experience about a 4% increase in
efficiency for every degree Celsius difference from the seasonal average ambient temperature. The heat

UVM Campus Renewable Energy Feasibility Study Geothermal
2
exchanger is about 20-50% of the cost of the whole system. The correct sizing of the heat exchanger makes all
the difference between a good system and a great system.
The geothermal pump systems reach fairly high efficiencies (300%-600%) on the coldest of winter
nights, compared to 175%-250% for air-source heat pumps on cool days. Ground source heat pumps are among
the most energy efficient technologies for providing HVAC and water heating.
The setup costs for geothermal systems are higher than conventional air conditions systems, but the difference
is usually returned in energy savings in 3 to 10 years. Geothermal system life is estimated at 25 years for inside
components and 50+ years for the ground loop.
2.0 Loop Options:
2.1 Open loop
1 In an open loop system the secondary loop pumps natural water from a well or body of water into a
heat exchanger inside the heat pump. Heat is either extracted or added by the primary refrigerant loop, and the
water is returned to a separate injection well, irrigation trench, tile field or body of water. The supply and return
lines must be placed far enough apart to ensure thermal recharge of the source. Since the water chemistry is
not controlled, the appliance may need to be protected from corrosion by using different metals in the heat
exchanger and pump. Limescale may disturb the system over time and require periodic acid cleaning. Also, as
the flow of natural water decreases over time in the piping, it becomes difficult for the heat pump to exchange
building heat with the groundwater. If the water contains high levels of salt, minerals, iron bacteria or hydrogen
1 http://geology.com/energy/selecting-a-geothermal-heat-pump.

UVM Campus Renewable Energy Feasibility Study Geothermal
3
sulfide, a closed loop system is usually preferable.
Deep lake water cooling uses a similar process with an open loop for air conditioning and cooling. Open
loop systems using ground water are usually more efficient than closed systems because they are better
coupled with ground temperatures. Closed loop systems, in comparison, have to transfer heat across extra
layers of pipe wall and dirt.
2.2 Closed loop
A closed loop is one in which both ends of the loop's piping are closed. The water or other fluid is
recirculated over and over and no new water is introduced to the loop. The heat is transferred through the
walls of the piping to or from the source, which could be ground, ground water, or surface water. As heat is
extracted from the water in the loop the temperature of the loop falls and the heat from the source flows
toward the loop. In closed loop operation, water quality is not an issue. The wire-to-water efficiencies of
circulators used in closed loop operation are very high and the costs of pumping the water are lower as
compared to open loops. System efficiencies are somewhat lower in closed loop operation, but given the lower
pumping costs, economics favor this approach.
Closed loop tubing can be installed horizontally as a loop field in trenches or vertically as a series of long
U-shapes in wells (see below). The size of the loop field depends on the soil type and moisture content, the
average ground temperature and the heat loss and or gain characteristics of the building being conditioned. A
rough approximation of the initial soil temperature is the average daily temperature for the region.
2.3 Vertical Loop Configuration
In vertical loop installation, deep holes are bored into the ground and pipes with U-bends are inserted

UVM Campus Renewable Energy Feasibility Study Geothermal
4
into the holes; the holes are grouted, the piping loops are fused together, brought into the structure and closed.
The argument for this type of ground-loop heat exchanger is that because the piping is deeper in the ground, it
is unaffected by surface temperatures thus the performance will be better. Generally, installed costs are higher
than with a horizontal loop.
Vertical loop fields are typically used when there is a limited area of land available. Bore holes are
spaced at least 15-18 ft. apart and the depth depends on ground and building characteristics. For illustration, a
house needing 10 kW (3 tons) of heating capacity might need three boreholes 260 to 360 ft deep.
Advantages: Requires less total pipe length than most other closed-loop systems; requires the least amount of
land area; seasonal soil temperature swings are not a concern.
Disadvantages: Cost of drilling is usually higher than cost of horizontal trenching, and vertical-loop designs tend
to be the most costly geoexchange systems; potential for long-term soil temperature changes if boreholes not
spaced far enough apart.
2.4 Horizontal Loop Configuration
In horizontal loop installation, trenches are dug in some form of horizontal arrangement. Various
configurations of piping are installed in the trenches. A larger number of horizontal loop designs have been
tried and utilized successfully by the industry. While install costs are usually lower, horizontal loops have been
thought to be less efficient than vertical loops because of the effect of air temperatures near the surface of the
ground.
Two significant factors need to be considered when designing and sizing a ground-loop: 1) Resistance of
the heat source to heat transfer e.g. ground, pond, lake, etc. and 2) Resistance of the pipe to heat transfer. Of
the two factors, pipe resistance is the dominant one. But, while little control can be exercised over source
resistance, a great deal of influence can be exercised by the designer over the pipe resistance. Plastic pipes are
generally poor conductors as compared with metal. Increasing the ratio of pipe surface area to trench length
yields significant gains in loop performance.
Advantages: Trenching costs for horizontal loops usually are much lower than well-drilling costs for vertical
closed-loops, and there are more contractors with the appropriate equipment; flexible installation options
depending on type of digging equipment (bulldozer, backhoe, or trencher) and number of pipe loops per
trench.
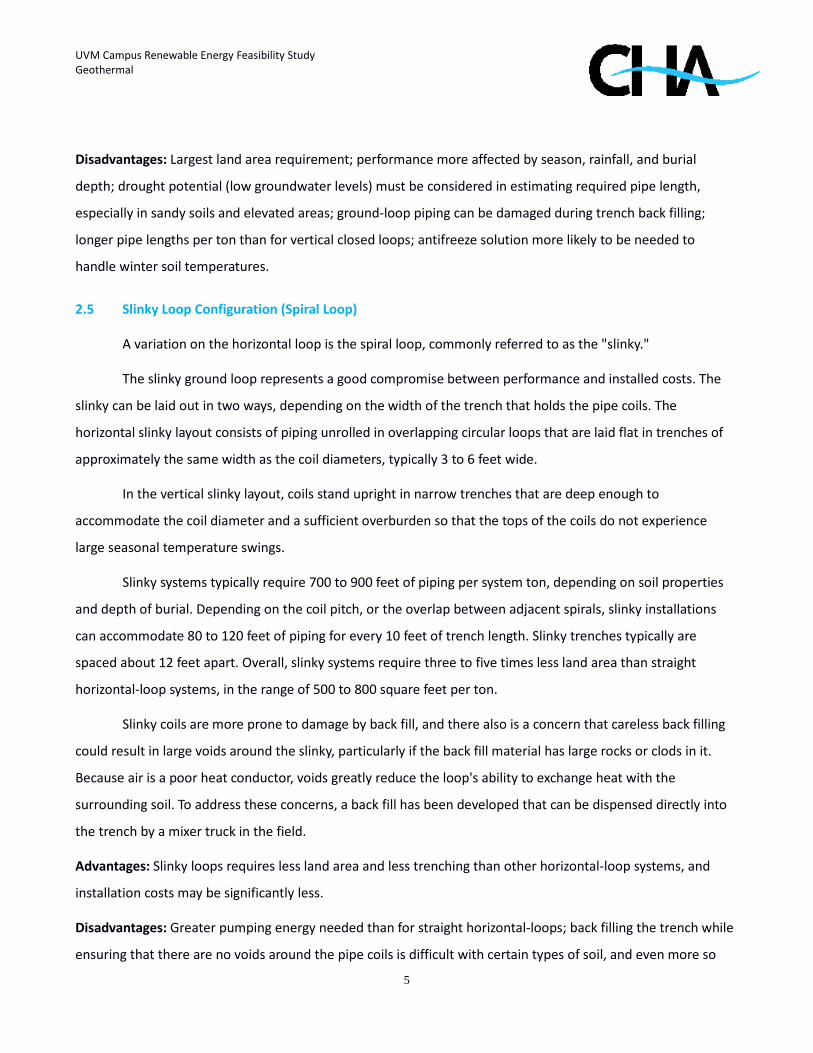
UVM Campus Renewable Energy Feasibility Study Geothermal
5
Disadvantages: Largest land area requirement; performance more affected by season, rainfall, and burial
depth; drought potential (low groundwater levels) must be considered in estimating required pipe length,
especially in sandy soils and elevated areas; ground-loop piping can be damaged during trench back filling;
longer pipe lengths per ton than for vertical closed loops; antifreeze solution more likely to be needed to
handle winter soil temperatures.
2.5 Slinky Loop Configuration (Spiral Loop)
A variation on the horizontal loop is the spiral loop, commonly referred to as the "slinky."
The slinky ground loop represents a good compromise between performance and installed costs. The
slinky can be laid out in two ways, depending on the width of the trench that holds the pipe coils. The
horizontal slinky layout consists of piping unrolled in overlapping circular loops that are laid flat in trenches of
approximately the same width as the coil diameters, typically 3 to 6 feet wide.
In the vertical slinky layout, coils stand upright in narrow trenches that are deep enough to
accommodate the coil diameter and a sufficient overburden so that the tops of the coils do not experience
large seasonal temperature swings.
Slinky systems typically require 700 to 900 feet of piping per system ton, depending on soil properties
and depth of burial. Depending on the coil pitch, or the overlap between adjacent spirals, slinky installations
can accommodate 80 to 120 feet of piping for every 10 feet of trench length. Slinky trenches typically are
spaced about 12 feet apart. Overall, slinky systems require three to five times less land area than straight
horizontal-loop systems, in the range of 500 to 800 square feet per ton.
Slinky coils are more prone to damage by back fill, and there also is a concern that careless back filling
could result in large voids around the slinky, particularly if the back fill material has large rocks or clods in it.
Because air is a poor heat conductor, voids greatly reduce the loop's ability to exchange heat with the
surrounding soil. To address these concerns, a back fill has been developed that can be dispensed directly into
the trench by a mixer truck in the field.
Advantages: Slinky loops requires less land area and less trenching than other horizontal-loop systems, and
installation costs may be significantly less.
Disadvantages: Greater pumping energy needed than for straight horizontal-loops; back filling the trench while
ensuring that there are no voids around the pipe coils is difficult with certain types of soil, and even more so

UVM Campus Renewable Energy Feasibility Study Geothermal
6
with upright coils in narrow trenches than with coils laid flat in wide trenches.
3.0 Hydronic Heating Systems:
In simplest terms, today’s hydronic heating is an energy efficient home heating system that uses tubing
to run a hot liquid beneath the floor, along base board heaters, or through radiators to heat your home. Also
referred to as radiant heating, this type of system has become increasingly popular among families that want
added comfort and control in their heating zones, savings through lower heating bills, and a decrease in their
environmental impact by making smart green building choices.
The hot water, or alternative heated liquid (such as glycol or thermal oil), of the hydronic radiant heat
system is circulated throughout the home through loops of plastic piping. Most often, these tubes are installed
within your homes concrete slab or floor joist system as radiant flooring, and allow the heat to radiate evenly
across the entire floor surface. The ending result is that a consistent, comfortable temperature radiates from
the floor as well as the solid objects around the room.
4.0 Potential Geothermal Application Sites on UVM Campus:
There are seven main application sites on the University of Vermont campus:
Building SQFT Occupancy Type Approx. Age Area for wells (sqft)
The Back Five 53,325 Residential Hall 39 20,100 Mercy 33,138 Residential Hall 50 33,680
McAuley 44,986 Residential Hall 54 130,070 Blundell House 4,870 Office 51 16,075
Mann Hall 35,892 Classrooms 71 17,000 Physical Plant Department,
UVM Rescue, and Police Services
54,565 Police Services and Rescue 55 6,000
Waterman 185,985 Offices and Classrooms 62 44,000 Most available wells on campus have potential depths of 330'-370' according to the Universities Geology
Department.

UVM Campus Renewable Energy Feasibility Study Geothermal
7
The Back Five- The back five is a section of Trinity campus that contains five smaller student residential
buildings. The total area of the buildings is approximately 53,325 sqft and there is 20,100 sqft of surrounding
land available for wells. The buildings currently have electrical heating and cooling systems that can be replaced
geothermal aided hydronic heating and cooling systems.
Figure 1: The Back Five residence halls

UVM Campus Renewable Energy Feasibility Study Geothermal
8
Mercy- Mercy is one of the two main student residential buildings located on Trinity campus. The total area of
the building is approximately 33,138 sqft and there is 33,680 sqft of surrounding land available for wells. The
building is currently heated and cooled by two steam boilers that are in need of replacing. They can be replaced
with new boilers augmented by geothermal.
Figure 2: Mercy residence hall

UVM Campus Renewable Energy Feasibility Study Geothermal
9
McAuley- McAuley is the other main student residential buildings located on Trinity campus. The total area of
the building is approximately 44,986 Sq ft and there is 130,070 Sq ft of surrounding land available for wells. The
building is also currently heated and cooled by two steam boilers that are in need of replacing. They can be
replaced with new boilers augmented by geothermal.
Figure 3: McAuley residence hall

UVM Campus Renewable Energy Feasibility Study Geothermal
10
Mann Hall- Mann Hall is a classroom building located on Trinity campus. The total area of the building is
approximately 35,892 sqft and there is 17,000 sqft of surrounding land available for wells. The buildings current
heating and cooling system can be replaced with a geothermal aided, natural gas hydronic heating and cooling
system.
Figure 4: Mann hall

UVM Campus Renewable Energy Feasibility Study Geothermal
11
UVM Physical Plant Department, UVM Rescue, and Police Services- the Physical Plant Department, UVM
Rescue, and Police Services complex on East Avenue consists of three large buildings. The total area of the
building is approximately 54,565 sqft and there is 6,000 sqft of surrounding land available for wells. The
buildings current heating and cooling system can be replaced with a geothermal aided, Natural Gas hydronic
heating and cooling system.
Figure 5: UVM Physical Plant Department, UVM Rescue, and Police Services

UVM Campus Renewable Energy Feasibility Study Geothermal
12
Waterman Building- The Waterman building is located on central campus and houses the senior administration,
classrooms, deans and department offices, and two food service locations. The total area of the building is
approximately 185,985 sqft and there is 44,000 sqft of surrounding land available for wells. The buildings
current heating and cooling system can be replaced with a geothermal aided, Natural Gas hydronic heating and
cooling system.
Figure 6: Waterman Building

UVM Campus Renewable Energy Feasibility Study Geothermal
13
The Blundell House- The Blundell House is a small residential type building that houses offices. The total area of
the building is approximately 4,870 sqft and there is 16,075 sqft of surrounding land available for wells. The
building currently uses a Natural Gas heating and cooling system can be replaced with a geothermal aided,
Natural Gas hydronic heating and cooling system.
Figure 7: Blundell House

UVM Campus Renewable Energy Feasibility Study Geothermal
14
5.0 Incentives:
5.1 Clean Energy Development Fund (CEDF)
Vermont's Clean Energy Development Fund (CEDF) was established in 2005 to promote the
development and deployment of cost-effective and environmentally sustainable electric power and thermal
energy resources, primarily renewable energy, combined heat and power (CHP), thermal, and geothermal
energy. The CEDF is authorized to support renewable-energy resources and CHP systems. Eligible renewable-
energy systems include solar PV, solar-thermal, wind, geothermal heat pumps, methane recovery, low-
emission, advanced biomass; and CHP systems using biomass fuels such as wood, agricultural or food wastes,
energy crops and organic refuse-derived waste. (Municipal solid waste is not eligible.) CHP systems must have a
design system efficiency of at least 65% and must meet Vermont's air-quality standards in order to qualify. The
CEDF may be used to support projects that sell power in commercial quantities (especially those projects that
sell electricity to Vermont utilities), projects to benefit publicly owned or leased buildings, renewable-energy
projects on farms, small-scale renewable energy for homes and businesses, and effective projects that are not
likely to be established in the absence of funding. Super-efficient buildings were included until 2009. Loan
amounts range from $50,000 - $1 million for no more than 90% of the project’s cost. The CEDF has provided
funding for the Vermont Solar and Small Wind Incentive Program, the CEDF Loan Program, the Business Solar
Energy Tax Credits (since expired), the Grant in Lieu of Business Solar Energy Tax Credits (special provision, 2011
only) and the CEDF Grant Program.
6.0 Conclusions:
CHA research on the addition of geothermal energy to UVM’s campus identified a number of good
opportunities to implement ground source heat pumps to augment heating and cooling of UVM buildings. Due
to the lack of available data on site specific heating and cooling infrastructure, conclusions and economic
feasibility were limited to a conceptual level.
Feasibility study analysis for geothermal energy focused on hybrid ground-source heat pumps with
vertical wells augmenting natural gas hydronic heating systems with cooling. This was for two primary reasons:
this is generally the most cost-effective way to add geothermal to a building, and for the UVM sites considered,
it required less modification to existing building systems. Conceptual estimates put installed costs for
geothermal heating and cooling at $10-$15/sq.ft. more than traditional heating and cooling for large residential
buildings. Savings are typically in the 10-30% range with paybacks often being achieved in the 15 to 20 year

UVM Campus Renewable Energy Feasibility Study Geothermal
15
range.
In conclusion, CHA recommends further investigation into geothermal heating and cooling at the eleven
sites mentioned above. In particular, we identify the “Back Five” as an excellent candidate. Greater savings and
shorter payback terms are realized with the “Back Five” since they currently utilize electric heat.

UVM Campus Renewable Energy Feasibility Study Solar Thermal
1
Solar Thermal
1.0 Introduction
Solar thermal refers to a technology that utilizes the sun’s rays to either store heat directly
or generate power through a heat engine. For our purposes and location, we will focus on solar
thermal applications for heating. Typical heating applications for solar thermal are domestic hot
water, pool heating, radiant floor heating, or process heating. At UVM we found a lot of opportunity
for domestic hot water applications and our study is focused there. The key component in a solar
thermal system is the collector. There are multiple types of solar thermal collectors that can be used
in commercial installations including flat plate and evacuated tube collectors.
1.1 Flat Plate:
Flat plate collectors are made up of a darkly colored solar absorbing plate encased in a
transparent cover that allows for energy transfer with minimal heat loss. These plates are generally
made of either copper or aluminum, copper
being the more expensive of the two, but more
durable and efficient. An insulated back panel
encloses the entire assembly to ensure
maximum heat retention.
A heat absorbing fluid consisting of water,
antifreeze, or a glycol mixture is pumped
through a series of pipes fastened to the surface
of the plate. Heat is then transferred to the
solution via the copper pipes. For applications
in the northeast, a mixture of roughly 50%
water and 50% propylene glycol is used. The temperature rating of the glycol varies with collector
type. Evacuated tubes require a higher temperature rated glycol than flat plate collectors because
they are capable of higher temperature operation. Collector manufacturers will have minimum
standards to meet with regards to glycol ratings. Improper rating will cause a degradation of the
glycol and will cause the system to operate poorly. The heat absorbing fluid is then pumped to a
storage tank with a heat exchanger, which sits adjacent to the building’s existing water tank or the
desired receptacle of the transferred heat. The size of the tanks and scale of the system are
completely dependent on the hot water demand of the given facility. Sizing solar thermal systems is
Figure 1: Flat Plate Collectors (i) Sunmaxx Solar

UVM Campus Renewable Energy Feasibility Study Solar Thermal
2
a very complex process with multiple inputs. For applications at UVM we consulted with a
reputable manufacturer: Heliodyne Inc. A general rule of thumb, though, is a ratio of 0.5-1 ft2 of
collector per gallon of everyday hot water use.
There are multiple piping configurations available
for flat plate collectors, the most common of which are the
harp and serpentine models. The harp design consists of
bottom pipe risers and a top collection pipe, whereas the
serpentine system consists of one continuous pipe that
snakes over the extent of the plate surface. The
serpentine model maximizes temperature, but not total
energy yield, and is restricted to water heating systems
only, as the system is not practical for space heating
installations.
1.2 Evacuated Tubes:
Evacuated tube collectors are a newer
technology and consist of a series of glass
tubes. These tubes are vacuum-sealed and each
contains an absorber plate fused to a heat pipe.
These heat pipes are filled with a transfer fluid,
generally alcohol or purified water with special
additives (such as propylene glycol), which is
heated via solar radiation and undergoes a
phase change as it rises up through the tube.
The heat pipe ends in a capsule at the top of the
array where the heat from the steam collects.
These tubes are connected in series by a manifold heat exchange system that spans across the top
of each heat pipe and utilizes water or glycol to transport the generated heat. There is a slight space
between each tube in the array to allow snow to pass through as well as to capture light from
various angles. It should be noted, however, that snow sticking to the evacuated tubes can
potentially cause inefficiencies especially considering that evacuated tubes will not transfer heat
“out” of the system to melt the snow. The vacuum created inside each tube greatly reduces heat
Figure 3: Evacuated Tube (iii)- SPP Solar
Figure 2: Serpentine Configuration (ii)

UVM Campus Renewable Energy Feasibility Study Solar Thermal
3
convection and subsequently results in a more efficient system that can perform well in low
radiation settings.
2.0 Typical Applications:
While a case can be made for either type of collector, there are generally some advantages for one
over the other depending on the installation. Flat plate systems are generally more cost effective
and work best in situations that require heating water by medium to low amounts. They are perfect
for heating pools or anything that requires year round moderately warm water. Evacuated tube
arrays are slightly more efficient per unit area and lose less heat to the environment due to the
vacuum-sealed tubes. They are capable of heating water to a much higher temperature and can
outperform their flat plate competitors on cloudy days when there is little radiation. The deciding
factor is each system’s overall efficiency within the average temperature range of the given area.
For Vermont, annual temperatures are comparatively low and so the proper system needs to be
considered. The figure below clearly demonstrates the efficiency of each system at a given
temperature and there is a distinct point, around 60 degrees F, where evacuated tubes become
favorable.
The figure was provided by the Solar Rating and Certification Corporation (SRCC); they are a
nonprofit organization that provides authoritative performance ratings for solar thermal products.
Vermont has an average annual temperature of less than 50° F making flat plate collectors the
better choice. Additionally, snow melts much faster on the flat plate system whereas ice buildup can
be a serious issue for evacuated tubes. Solar thermal arrays have been in existence for a number of
years and there are numerous installations of both types of systems in the greater New England

UVM Campus Renewable Energy Feasibility Study Solar Thermal
4
area and Vermont. Various affordable housing developments throughout the state have taken
advantage of the renewable energy incentives over the last three years by installing flat plate
water-heating systems. Three examples are Applegate in Bennington, Highgate in Barre, Salmon
Run in Burlington and Westgate in Brattleboro.
Reknew Energy Systems installed the systems, providing each complex with at least 50% of their
hot water demand. The installation at Salmon Run is of particular interest due to the close
proximity to the University, and the size of the project. At 2,160 kBTU, the installation is one of the
largest solar hot water systems in the state. Senator Bernie Sanders secured a grant of $500,000 to
support these statewide installments providing over 1000 residents with hot water. As the
evacuated tube model is a much newer technology, and because of the benefits of the flat plate
system in colder regions, there are not many large-scale projects in Vermont. However, there are
numerous residential sized installations throughout the state such as the example installed by
House Needs, Inc. shown above.
3.0 University Applications:
In order for a given facility to be considered practical for a solar thermal installation there are a
number of criteria that need to be met. Most importantly, the structure must have a suitable
location for the array with respect to open space, roof angle and orientation, structural capacity,
suitable substrate, and a general lack of obstacles that could cause shading. Additionally, for the
project to be feasible the given building must utilize hot water year round, which is a challenge
during the summer months on a university campus, when students are not living in residence halls.
Hot water usage year-round is the most important consideration for solar thermal. Unlike Solar PV,

UVM Campus Renewable Energy Feasibility Study Solar Thermal
5
net-metering of solar thermal is impossible so any hot water not used is a lost commodity.
Additionally, too much heat in the system can cause damage to the components. For roof mounted
systems the actual height of the building can also be an issue for efficiency as the greater the
distance from the collectors to the water tank, the more heat will ultimately be lost through
convection as the fluid is pumped down the structure.
With these factors in mind, the most favorable buildings on campus for solar thermal
installations include all dining and residence halls that have year round use, including the summer
months. The buildings that meet these requirements, as well as those mentioned above, include
Marsh, Austin, Tupper, Living and Learning D, University Heights, and both the Harris Millis
Commons and Simpson Hall dining facilities. Of those buildings the University Heights complex is
one of the most favorable given the overall size of the facility and its comparatively large energy
consumption. The photo below shows the possible locations for a solar thermal project on just one
of the four facilities that make up the University Heights complex.
In addition to the dining and residence halls mentioned above, the Gucciardi Fitness Center
would be optimal for a solar collector project, as the gym has year-round memberships and a large
pool as well as massive amounts of open space on the roof.
4.0 Incentives:
Figure 4: University Heights

UVM Campus Renewable Energy Feasibility Study Solar Thermal
6
The State of Vermont offers a number of incentivized programs for renewable energy
projects including solar thermal hot water installations. One of the programs available to UVM is
the Vermont Small-Scale Renewable Energy Incentive Program that funds a maximum of $45,000 or
50% of the total project costs, whichever is less. These values are generated by the$3.00/100
Btu/d rate offered by the program, up to 1500 kBtu/d, where the incentive is capped. Additionally,
there is an efficiency adder that offers a possible $0.50/100Btu/day with a maximum of $450.
5.0 Additional Permits:
The City of Burlington requires a number of permits for Solar Thermal Systems. Building permits
are required for each trade and stamped drawings will likely be required for each.
5.1 Building Permits:
Solar Thermal Systems will require the following building permits:
1. Building/Structural permit: $8.50 per $1,000 construction cost plus $20 for documents,
plans…etc as a recording fee. Stamped drawings required for “larger” projects. (We have
reached out to the building inspector to determine if they’re required by the city. It is the
opinion of CHA that stamped drawings and structural calculations should be included on all
projects.)
2. Electrical Permit: $8.50 per $1,000 construction cost plus $20 for documents, plans…etc
as a recording fee. Stamped drawings required for “larger” projects.
3. HVAC/Mechanical Permit: $8.50 per $1,000 construction cost plus $20 for documents,
plans…etc as a recording fee. Stamped drawings required for “larger” projects.
4. Plumbing Permit: $8.50 per $1,000 construction cost plus $20 for documents, plans…etc
as a recording fee. Stamped drawings required for “larger” projects.
5. Zoning Permits: The City of Burlington requires zoning permits for Solar Thermal
Systems since they would be considered an addition to the building, and would change the
appearance. Zoning permits are also required for any extrusions through the building. Even
if the system is not visible (i.e. roof mount), the zoning permit would be required because
the pipes would penetrate the building and there may be outside components. The basic
zoning permit fee is $80 with a review time of 3-4 weeks.
6.0 System Setup:

UVM Campus Renewable Energy Feasibility Study Solar Thermal
7
All of the proposed solar thermal reports assumed the use of Heliodyne systems including
collectors, racking units, storage tanks, pumps and heat exchangers. For the given location and scale
of each product a cool climate system utilizing ‘blue sputtered’ 4’x10’ collector plates was deemed
most appropriate. The blue sputter finish is a special coating designed to absorb more sunlight than
traditional black modules. While the general layout of the system remained constant between
buildings, shown in the figure below, the size of the storage tanks, number of collectors, and flow
rate of the supplied water fluctuated between facilities depending on the hot water demand.
This domestic hot water demand (DHW) was determined by considering both the size of the
given facility along with the number of occupants and the number of meals served daily in the
dining halls. The figure above depicts the path of the water, which is driven by the pumps and
regulated by the heat exchanger, both of which are contained within the HCOM 180 unit. The HCOM
unit heats the water in the solar storage tank, which is fed by the utility, via the glycol solution that
is pumped through the closed loop system and subsequently heated by the collectors. The warmed
water is then fed into the building’s existing storage tank where it can be heated as needed by the
backup water heater before use. This is just one example of how a solar thermal system could be
laid out.
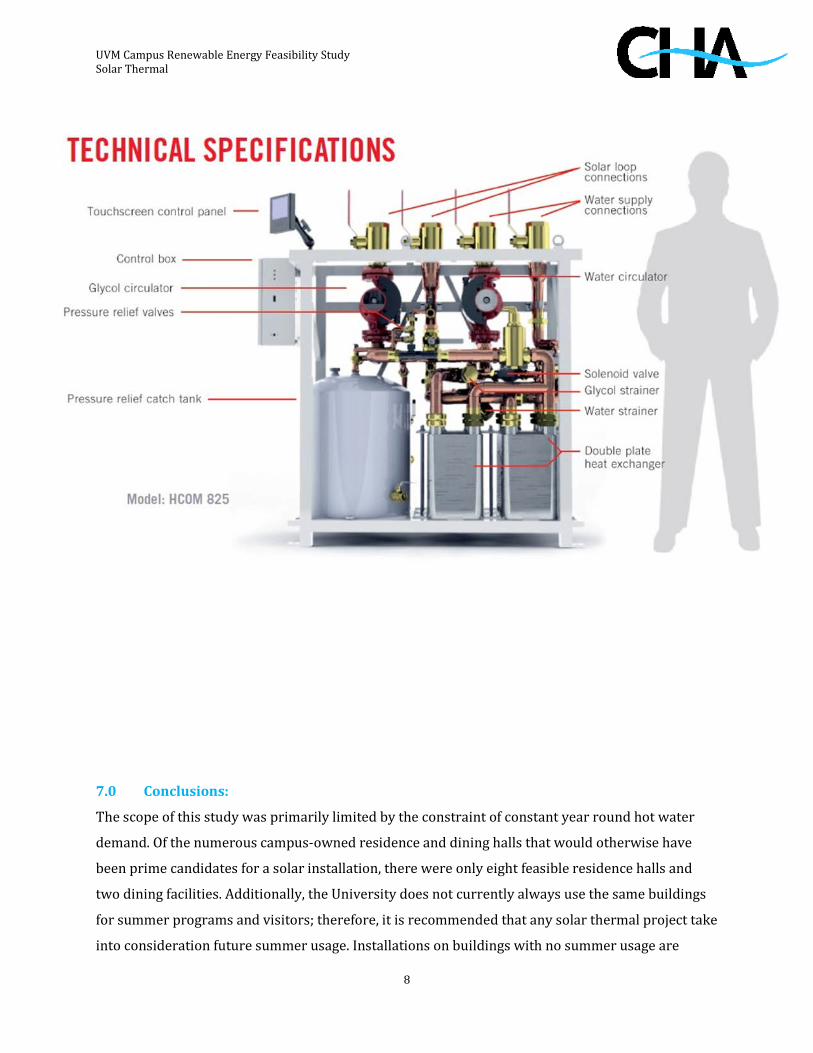
UVM Campus Renewable Energy Feasibility Study Solar Thermal
8
7.0 Conclusions:
The scope of this study was primarily limited by the constraint of constant year round hot water
demand. Of the numerous campus-owned residence and dining halls that would otherwise have
been prime candidates for a solar installation, there were only eight feasible residence halls and
two dining facilities. Additionally, the University does not currently always use the same buildings
for summer programs and visitors; therefore, it is recommended that any solar thermal project take
into consideration future summer usage. Installations on buildings with no summer usage are
Heliodyne HCOM System Diagram

UVM Campus Renewable Energy Feasibility Study Solar Thermal
9
inadvisable. The same holds for the dining halls, one example being Harris Millis Commons, as the
newer Simpson facility shown here could potentially be the main food provider over the summer.
Another challenge with solar
thermal installations at UVM lies
with the central steam plant, which
supplies the majority of campus with
heat and hot water. The issue
involves determining the savings
from the solar thermal system. A
hybrid domestic water heating
system which combines the available
steam with the renewable aspect of
solar collectors is mechanically
possible but economically less appealing. With a steam/solar hybrid system, this water heating
setup will consume less steam from the central plan than an all-steam system. This amount of
steam can be estimated, and it would likely result in very small decrease in overall amount of steam
produced by the central plant. Compared to a solar thermal setup where solar is augmented by a
natural gas or electrical water heater, the steam/solar hybrid system is around 25% more
expensive due to the additional costs of the storage tank, heat exchangers and controls required
and the resulting increased labor and engineering costs. Furthermore, the cost of producing hot
water via the central steam system is less expensive than heating hot water via gas or electricity. So
in conclusion, the system would be more costly and result in lower bottom line savings and increase
payback term. In conclusion, we would recommend focusing any solar thermal projects to buildings
that do not get their hot water via central steam system and that would have constant, year-round
hot water demand.
Figure 5: Simpson Hall

UVM Campus Renewable Energy Feasibility Study Field: Bioresearch Facilities South Visit Date: 7/1/2012 By: Jack Lehrecke
* Measurements are approximate and include all required spacing * Carport calculation requires a minimum of 20 contiguous spots * Flat roof assumes 10’ setbacks per OSHA * Sloped roof assumes 4’ setback per building code (may vary)
Field: Bioresearch Facilities South Fields Address: 659 Spear Street, Burlington VT Aerial Photo:
Total Space: 1,039,400 sqft Installation Type: 3 Number of Trackers: 381 Approximate DC Watts: 2,286,680 Solar PV System Size: 2.286 MW Basis of Design Equipment: Sharp 250W Mono Solar Modules All Earth Series 24 AllSun Trackers
Installation Type DC Watts per
Unit
Ground Mount Trackers 2.2 sqft

UVM Campus Renewable Energy Feasibility Study Field: Miller Farm North SMA 6000kW Powered Solar PV Inverter Market Conditions Total $/watt: $3.87 Estimated Installed Cost: $8,840,000 (rounded to nearest $10,000) Payback (with no incentives): 12.5 years Payback (with incentives): 11 years Building Annual Electrical Usage: 510,000 kWh * Solar System Annual Output: 3,544,354 kWh % offset: 694.97% Applicable Incentives A detailed summary of applicable incentives is included 1.Vermont Small Scale Renewable Energy Incentive Program: $2.25/watt DC up to 10
kW, $1.50/W DC for next 50 kW (up to 60 kW). Maximum incentive $97,500 or up to 50% of project costs (whichever is lower).
2. Green Mountain Power net metering bonus: Allows for an additional payment of $0.06/kWh produced by the system
Notes: 1. Installed cost includes all materials, labor, design, engineering…etc. based on observed
market conditions in Q2 2012. 2. Financial analysis assumes GMP utility 3. Electrical engineering/design of interconnection required (included in est. cost) 4. *Building offset calculation considers the entirety of the Bioresearch Complex 5.Sizing of installation assumes a 100 ft setback from the highway 6.Additional spacing from all surrounding forestry needs to be considered. 7.Utility rate assumes an annual increase of 3% 8.Note that net metering only allows for up to 500kW of Solar PV. This report was
developed to illustrate the full potential of the land near the Miller Farm. If UVM were to install 500kW of Solar Trackers, we estimate that the $/watt price would remain nearly the same with the payback also being constant.

UVM Campus Renewable Energy Feasibility Study Field: Miller Farm North

UVM Campus Renewable Energy Feasibility Study Field: Miller Farm North Visit Date: 7/1/2012 By: Jack Lehrecke
* Measurements are approximate and include all required spacing * Carport calculation requires a minimum of 20 contiguous spots * Flat roof assumes 10’ setbacks per OSHA * Sloped roof assumes 4’ setback per building code (may vary)
Field: Miller Farm North Fields Address: 500 Spear Street, Burlington VT Aerial Photo:
Total Space: 340,000 sqft Installation Type: 2 Number of Trackers: 124 Approximate DC Watts: 748,000 Solar PV System Size: 748 kW Basis of Design Equipment: Sharp 250W Mono Solar Modules All Earth Series 24 AllSun Trackers SMA 6000kW Powered Solar PV Inverter
Installation Type DC Watts per
Unit
Ground Mount Trackers 2.2 sqft

UVM Campus Renewable Energy Feasibility Study Field: Miller Farm North Market Conditions Total $/watt: $4.10 Estimated Installed Cost: $3,070,000 (rounded to nearest $10,000) Payback (with no incentives): 13.2 years Payback (with incentives): 11 years Building Annual Electrical Usage: 665,800 kWh * Solar System Annual Output: 1,159,400 kWh % offset: 174.14% Applicable Incentives A detailed summary of applicable incentives is included 1.Vermont Small Scale Renewable Energy Incentive Program: $2.25/watt DC up to 10
kW, $1.50/W DC for next 50 kW (up to 60 kW). Maximum incentive $97,500 or up to 50% of project costs (whichever is lower).
2. Green Mountain Power net metering bonus: Allows for an additional payment of $0.06/kWh produced by the system
Notes: 1. Installed cost includes all materials, labor, design, engineering…etc. based on observed
market conditions in Q2 2012. 2. Financial analysis assumes GMP utility 3. Electrical engineering/design of interconnection required (included in est. cost) 4. *Building offset calculation considers the entirety of the Miller Farm Complex 5.Sizing of installation assumes a 100 ft setback from the highway 6.Utility rate assumes an annual increase of 3% 7.Note that net metering only allows for up to 500kW of Solar PV. This report was
developed to illustrate the full potential of the land near the Miller Farm. If UVM were to install 500kW of Solar Trackers, we estimate that the $/watt price would remain nearly the same with the payback also being constant.

UVM Campus Renewable Energy Feasibility Study Field: Miller Farm South Visit Date: 7/1/2012 By: Jack Lehrecke Field: Miller Farm South Fields Address: 500 Spear Street, Burlington VT Aerial Photo:

UVM Campus Renewable Energy Feasibility Study Field: Miller Farm North
* Measurements are approximate and include all required spacing * Carport calculation requires a minimum of 20 contiguous spots * Flat roof assumes 10’ setbacks per OSHA * Sloped roof assumes 4’ setback per building code (may vary)
Total Space: 800,000 sqft Installation Type: 3 Number of Trackers: 293 Approximate DC Watts: 1,760,000 Solar PV System Size: 1.76 MW Basis of Design Equipment: Sharp 250W Mono Solar Modules All Earth Series 24 AllSun Trackers SMA 6000kW Powered Solar PV Inverter Market Conditions Total $/watt: $3.90 Estimated Installed Cost: $6,860,000 (rounded to nearest $10,000) Payback (with no incentives): 12.6 years Payback (with incentives): 11 years Building Annual Electrical Usage: 665,800 kWh * Solar System Annual Output: 2,728,000 kWh % offset: 409.73% Applicable Incentives A detailed summary of applicable incentives is included 1.Vermont Small Scale Renewable Energy Incentive Program: $2.25/watt DC up to 10
kW, $1.50/W DC for next 50 kW (up to 60 kW). Maximum incentive $97,500 or up to 50% of project costs (whichever is lower).
2. Green Mountain Power net metering bonus: Allows for an additional payment of $0.06/kWh produced by the system
Notes: 1. Installed cost includes all materials, labor, design, engineering…etc. based on observed
market conditions in Q2 2012.
Installation Type DC Watts per
Unit
Ground Mount Trackers 2.2 sqft

UVM Campus Renewable Energy Feasibility Study Field: Miller Farm North 2. Financial analysis assumes GMP utility 3. Electrical engineering/design of interconnection required (included in est. cost) 4. *Building offset calculation considers the entirety of the Miller Farm Complex 5.Sizing of installation assumes a 100 ft setback from the highway 6.Utility rate assumes an annual increase of 3% 7.Note that net metering only allows for up to 500kW of Solar PV. This report was
developed to illustrate the full potential of the land near the Miller Farm. If UVM were to install 500kW of Solar Trackers, we estimate that the $/watt price would remain nearly the same with the payback also being constant.

UVM Campus Renewable Energy Feasibility Study Lot: Admissions and North of Admissions 178 S. Prospect St., Burlington VT Visit Date: 5/31/2012 By: Rich Smith Parking Lot: Admissions and North of Address: 178 S. Prospect St., Burlington VT Aerial Photo:

UVM Campus Renewable Energy Feasibility Study Lot: Admissions and North of Admissions 178 S. Prospect St., Burlington VT Total Parking Spaces: 100 sqft Installation Type: Carport Tilt Angle: 10 degrees Orientation: Top Lot (75 spaces) SE/SW Lower Right Lot (25 spaces) E-W Approximate DC Watts: 100,000 Solar PV System Size: 100kW Basis of Design Equipment: Solaire Generation ‘Solaris’ System or similar Sharp 250W Module 1x PV Powered 100 kW Solar PV Inverter Cooper Crouse Hinds Disconnecting, Surge Protection Combiner Boxes Total $/watt: $5.83 Estimated Installed Cost: $570,000 (rounded to nearest $10,000) Payback (with no incentives): 25.1 years Payback (with incentives): 17 years Adjacent Building Annual Electrical Usage: 116,749 kWh* Solar System Annual Output: 113,750 kWh % offset: 97.43% Applicable Incentives A detailed summary of applicable incentives is included
1. Vermont Small Scale Renewable Energy Incentive Program: $2.25/watt DC up to 10 kW, $1.50/W DC for next 50 kW (up to 60 kW). Maximum incentive $97,500 or up to 50% of project costs (whichever is lower).
2. Electricity will be sold directly to Burlington Electric Department at a rate of $0.20/kWh. There will be a separate meter and service, one bill for the building use that will be offset by the bill for BED credit.

UVM Campus Renewable Energy Feasibility Study Lot: Admissions and North of Admissions 178 S. Prospect St., Burlington VT Notes:
1. Structural design of carport system(s) will be required. This has been included in the estimated cost. 2. Installed cost includes all materials, labor, design, engineering…etc. based on observed market
conditions in Q2 2012. 3. *Estimated electrical use based on use from Clement House, Admissions Vistor Center, and Allen
House 2011 Data. 4. Financial analysis assumes BED utility 5. Electrical engineering/design of interconnection required (included in est. cost)

UVM Campus Renewable Energy Feasibility Study Parking Lot: Aiken South Visitors Lot Report Date: 6/18/2012 By: Jack Lehrecke
* Measurements are approximate and include all required spacing * Carport calculation requires a minimum of 20 contiguous spots * Flat roof assumes 10’ setbacks per OSHA * Sloped roof assumes 4’ setback per building code (may vary)
Parking Lot: Aiken South Visitor Lot Address: 81 Carrigan Dr Burlington, VT Aerial Photo:
Total Parking Spaces: 14 Installation Type: Carport Tilt Angle: 10 degrees Orientation: SW Approximate DC Watts: 14,000 Solar PV System Size: 14.0kW
Installation Type DC Watts per
Unit
1. Roof Mount Ballasted Flat
8 sqft
2. Roof Mount Sloped 11.5 sqft 3. Ground Mount 5 sqft 4. Carport 1000 Parking
space

UVM Campus Renewable Energy Feasibility Study Parking Lot: Aiken South Visitors Lot Basis of Design Equipment: Solaire Generation ‘Solaris’ system or similar Sharp 250W Mono Solar Modules 2x SMA 7000 Powered Solar PV Inverter Cooper Crouse Hinds Disconnecting, Surge Protection Combiner Boxes Total $/watt: $7.86 Estimated Installed Cost: $110,000 (rounded to nearest $10,000) Payback (with no incentives): 34.2 years Payback (with incentives): 30 years Adjacent Building Annual Electrical Usage: 205,000 kWh Solar System Annual Output: 16,100 kWh % offset: 7.85% Applicable Incentives A detailed summary of applicable incentives is included
1. Vermont Small Scale Renewable Energy Incentive Program: $2.25/watt DC up to 10 kW, $1.50/W DC for next 50 kW (up to 60 kW). Maximum incentive $97,500 or up to 50% of project costs (whichever is lower).
2. Burlington Electric Department feed in tariff purchases PV produced power at 0.20 $/kWh, the offset calculation compares this power, which is fed directly into the grid, against the adjacent structure’s utility demand.
Notes:
1. Installed cost includes all materials, labor, design, engineering…etc. based on observed market conditions in Q2 2012.
2. Estimated electrical use based on use from Fleming Museum alone 3. Financial analysis assumes BED utility 4. Electrical engineering/design of interconnection required (included in est.
cost) 5. Utility rate assumes an annual increase of 3%

UVM Campus Renewable Energy Feasibility Study Lot: Athletics lot and Garage 178 S. Prospect St., Burlington VT Visit Date: 6/14/2012 By: Rich Smith Parking Lot: Athletics lot and Garage Address: 178 S. Prospect St., Burlington VT Aerial Photo: Total Parking Spaces: 497 Installation Type: Carport Tilt Angle: 10 degrees Orientation: E-W Approximate DC Watts: 497,000

UVM Campus Renewable Energy Feasibility Study Lot: Athletics lot and Garage 178 S. Prospect St., Burlington VT Solar PV System Size: 497kW Basis of Design Equipment: Solaire Generation ‘Solaris’ System or similar Sharp 250W Module 2x PV Powered 250 kW Solar PV Inverter Cooper Crouse Hinds Disconnecting, Surge Protection Combiner Boxes Total $/watt: $5.18 Estimated Installed Cost: $2,620,000^ (rounded to nearest $10,000) Payback (with no incentives): 24 years Payback (with incentives): 23 years Adjacent Building Annual Electrical Usage: 3,866,400 kWh* Solar System Annual Output: 546,700kWh % offset: 14.14% Applicable Incentives A detailed summary of applicable incentives is included
1. Vermont Small Scale Renewable Energy Incentive Program: $2.25/watt DC up to 10 kW, $1.50/W DC for next 50 kW (up to 60 kW). Maximum incentive $97,500 or up to 50% of project costs (whichever is lower).
2. Electricity will be sold directly to Burlington Electric Department at a rate of $0.20/kWh. There will be a separate meter and service, one bill for the building use that will be offset by the bill for BED credit.
Notes:
1. Structural design of carport system(s) will be required. This has been included in the estimated cost. 2. Installed cost includes all materials, labor, design, engineering…etc. based on observed market
conditions in Q2 2012. 3. ^Estimated additional Allowance for structural upgrades on garage. 4. *Estimated electrical use based on use from Gutterson Field House and Gutterson Parking Garage
2011 Data. 5. Financial analysis assumes BED utility 6. Electrical engineering/design of interconnection required (included in est. cost)

UVM Campus Renewable Energy Feasibility Study Lot: Booth House 86 S. Williams St., Burlington VT Visit Date: 6/14/2012 By: Rich Smith Aerial Photo: Parking Lot: Booth House Address: 86 S. Williams St., Burlington VT Total Parking Spaces: 31 Installation Type: Carport Tilt Angle: 10 degrees Orientation: E-W Approximate DC Watts: 31,000 Solar PV System Size: 31kW Basis of Design Equipment: Solaire Generation ‘Solaris’ System or similar Sharp 250W Module 3x SMA 10000 W Solar PV Inverter Cooper Crouse Hinds Disconnecting, Surge Protection Combiner Boxes Total $/watt: $6.75 Estimated Installed Cost: $200,000 (rounded to nearest $10,000)

UVM Campus Renewable Energy Feasibility Study Lot: Booth House 86 S. Williams St., Burlington VT Payback (with no incentives): 29.3 years Payback (with incentives): 13 years Adjacent Building Annual Electrical Usage: 16,865 kWh* Solar System Annual Output: 34,100kWh % offset: 202.19% Applicable Incentives A detailed summary of applicable incentives is included
1. Vermont Small Scale Renewable Energy Incentive Program: $2.25/watt DC up to 10 kW, $1.50/W DC for next 50 kW (up to 60 kW). Maximum incentive $97,500 or up to 50% of project costs (whichever is lower).
2. Electricity will be sold directly to Burlington Electric Department at a rate of $0.20/kWh. There will be a separate meter and service, one bill for the building use that will be offset by the bill for BED credit.
Notes:
1. Structural design of carport system(s) will be required. This has been included in the estimated cost. 2. Installed cost includes all materials, labor, design, engineering…etc. based on observed market
conditions in Q2 2012. 3. *Estimated electrical use based on use from Booth House 2011 Data. 4. Financial analysis assumes BED utility 5. Electrical engineering/design of interconnection required (included in est. cost)

UVM Campus Renewable Energy Feasibility Study Lot: Catholic Center 390 S. Prospect St., Burlington VT Visit Date: 6/18/2012 By: Rich Smith Aerial Photo: Parking Lot: Catholic Center Address: 390 S. Prospect St., Burlington VT Total Parking Spaces: 16 Installation Type: Carport Tilt Angle: 10 degrees Orientation: E-W Approximate DC Watts: 16,000 Solar PV System Size: 16kW Basis of Design Equipment: Solaire Generation ‘Solaris’ System or similar Sharp 250W Module 2x SMA 8000 W Solar PV Inverter Cooper Crouse Hinds Disconnecting, Surge Protection Combiner Boxes Total $/watt: $7.34 Estimated Installed Cost: $110,000 (rounded to nearest $10,000) Payback (with no incentives): 31.3 years

UVM Campus Renewable Energy Feasibility Study Lot: Catholic Center 390 S. Prospect St., Burlington VT Payback (with incentives): 19 years Adjacent Building Annual Electrical Usage: 45,000 kWh* Solar System Annual Output: 17,600 kWh % offset: 39.11% Applicable Incentives A detailed summary of applicable incentives is included
1. Vermont Small Scale Renewable Energy Incentive Program: $2.25/watt DC up to 10 kW, $1.50/W DC for next 50 kW (up to 60 kW). Maximum incentive $97,500 or up to 50% of project costs (whichever is lower).
2. Electricity will be sold directly to Burlington Electric Department at a rate of $0.20/kWh. There will be a separate meter and service, one bill for the building use that will be offset by the bill for BED credit.
Notes:
1. Structural design of carport system(s) will be required. This has been included in the estimated cost. 2. Installed cost includes all materials, labor, design, engineering…etc. based on observed market
conditions in Q2 2012. 3. *Estimated electrical use estimated based on use from Admissions Visitor Center 2011 Data. 4. Financial analysis assumes BED utility 5. Electrical engineering/design of interconnection required (included in est. cost)

UVM Campus Renewable Energy Feasibility Study Parking Lot: East of Harris Millis Complex Report Date: 6/13/2012 By: Jack Honor Parking Lot: East of Harris-Millis Complex Address: 67 Spear Street Aerial Photo:
Total Parking Spaces: 124 Installation Type: Carport Tilt Angle: 10 degrees Orientation: E-W

UVM Campus Renewable Energy Feasibility Study Parking Lot: East of Harris Millis Complex Approximate DC Watts: 124,000 Solar PV System Size: 124kW Basis of Design Equipment: Solaire Generation ‘Solaris’ System or similar Sharp 250W Module 1x PV Powered 100 W Solar PV Inverter Cooper Crouse Hinds Disconnecting, Surge Protection Combiner Boxes Total $/watt: $5.73 Estimated Installed Cost: $710,000 (rounded to nearest $10,000) Payback (with no incentives): 43.4 years Payback (with incentives): 12 years Adjacent Building Annual Electrical Usage: 1,053,920 kWh* Solar System Annual Output: 136,400 kWh % offset: 12.94% Applicable Incentives A detailed summary of applicable incentives is included
1. Vermont Small Scale Renewable Energy Incentive Program: $2.25/watt DC up to 10 kW, $1.50/W DC for next 50 kW (up to 60 kW). Maximum incentive $97,500 or up to 50% of project costs (whichever is lower).
2. Vermont SPEED; Standard Offer: $271/MWh annual. (See incentive summary for additional details on this program)
Notes:
1. Structural design of carport system(s) will be required. This has been included in the estimated cost. 2. Installed cost includes all materials, labor, design, engineering…etc. based on observed market
conditions in Q2 2012. 3. *Estimated electrical use based on use from entire H-M complex 4. Financial analysis assumes BED utility 5. Electrical engineering/design of interconnection required (included in est. cost)

UVM Campus Renewable Energy Feasibility Study Lot: East of Blundell 342 S. Prospect St., Burlington VT Visit Date: 7/11/2012 By: Rich Smith
Parking Lot: East of Blundell
Address: 342 S. Prospect St., Burlington VT
Aerial Photo:
Total Parking Spaces: 36
Installation Type: Carport

UVM Campus Renewable Energy Feasibility Study Lot: East of Blundell 342 S. Prospect St., Burlington VT
Tilt Angle: 10 degrees
Orientation: East/West
Approximate DC Watts: 36,000
Solar PV System Size: 36kW
Basis of Design Equipment:
Solaire Generation ‘Solaris’ System or similar
Sharp 250W Module
1x PVP 30kW Solar PV Inverter
Cooper Crouse Hinds Disconnecting, Surge Protection Combiner Boxes
Total $/watt: $7.14
Estimated Installed Cost: $250,000 (rounded to nearest $10,000)
Payback (with no incentives): 31.6 years
Payback (with incentives): 23 years
Adjacent Building Annual Electrical Usage: 32,339 kWh*
Solar System Annual Output: 39,600 kWh
% offset: 122.45%
Applicable Incentives
A detailed summary of applicable incentives is included
1. Vermont Small Scale Renewable Energy Incentive Program: $2.25/watt DC up to 10 kW, $1.50/W DC for next 50 kW (up to 60 kW). Maximum incentive $97,500 or up to 50% of project costs (whichever is lower).
2. Electricity will be sold directly to Burlington Electric Department at a rate of $0.20/kWh. There will be a separate meter and service, one bill for the building use that will be offset by the bill for BED credit

UVM Campus Renewable Energy Feasibility Study Lot: East of Blundell 342 S. Prospect St., Burlington VT
Notes: 1. Structural design of carport system(s) will be required. This has been included in the estimated cost.
2. Installed cost includes all materials, labor, design, engineering…etc. based on observed market
conditions in Q2 2012.
3. *Estimated electrical use based on use from Blundell House 2011 Data.
4. Financial analysis assumes BED utility
5. Electrical engineering/design of interconnection required (included in est. cost)

UVM Campus Renewable Energy Feasibility Study Parking Lot: Fleming Visitors Lot Report Date: 6/18/2012 By: Jack Lehrecke Parking Lot: Fleming Visitor Lot Address: 61 Colchester Ave, Burlington VT Aerial Photo:

UVM Campus Renewable Energy Feasibility Study Parking Lot: Fleming Visitors Lot
* Measurements are approximate and include all required spacing * Carport calculation requires a minimum of 20 contiguous spots * Flat roof assumes 10’ setbacks per OSHA * Sloped roof assumes 4’ setback per building code (may vary)
Total Parking Spaces: 14 Installation Type: Carport Tilt Angle: 10 degrees Orientation: E-W Approximate DC Watts: 14,000 Solar PV System Size: 14.0kW Basis of Design Equipment: Solaire Generation ‘Solaris’ system or similar Sharp 250W Mono Solar Modules 2x SMA 7000 Powered Solar PV Inverters Cooper Crouse Hinds Disconnecting, Surge Protection Combiner Boxes Total $/watt: $7.86 Estimated Installed Cost: $110,000 (rounded to nearest $10,000) Payback (with no incentives): 35.7 years Payback (with incentives): 32 years Adjacent Building Annual Electrical Usage: 465,552 kWh Solar System Annual Output: 15,400 kWh % offset: 3.31% Applicable Incentives A detailed summary of applicable incentives is included
1. Vermont Small Scale Renewable Energy Incentive Program: $2.25/watt DC up to 10 kW, $1.50/W DC for next 50 kW (up to 60 kW). Maximum incentive $97,500 or up to 50% of project costs (whichever is lower).
Installation Type DC Watts per
Unit
1. Roof Mount Ballasted Flat
8 sqft
2. Roof Mount Sloped 11.5 sqft 3. Ground Mount 5 sqft 4. Carport 1000 Parking
space

UVM Campus Renewable Energy Feasibility Study Parking Lot: Fleming Visitors Lot Notes:
1. Installed cost includes all materials, labor, design, engineering…etc. based on observed market conditions in Q2 2012.
2. Estimated electrical use based on use from Fleming Museum alone 3. Financial analysis assumes BED utility 4. Electrical engineering/design of interconnection required (included in est.
cost) 5. Utility rate assumes an annual increase of 3%

UVM Campus Renewable Energy Feasibility Study Parking Lot: Ira Allen School Lot Report Date: 6/18/2012 By: Jack Lehrecke Parking Lot: Fleming Visitor Lot Address: Trinity Campus, Burlington VT Aerial Photo:

UVM Campus Renewable Energy Feasibility Study Parking Lot: Ira Allen School Lot
* Measurements are approximate and include all required spacing * Carport calculation requires a minimum of 20 contiguous spots * Flat roof assumes 10’ setbacks per OSHA * Sloped roof assumes 4’ setback per building code (may vary)
Total Parking Spaces: 10 Installation Type: Carport Tilt Angle: 10° Orientation: SW Approximate DC Watts: 10,000 Solar PV System Size: 10.0kW Basis of Design Equipment: Solaire Generation ‘Solaris’ system or similar Sharp 250W Mono Solar Modules SMA 10000 Powered Solar PV Inverter Cooper Crouse Hinds Disconnecting, Surge Protection Combiner Boxes Total $/watt: $8.00 Estimated Installed Cost: $80,000 (rounded to nearest $10,000) Payback (with no incentives): 36.6 years Payback (with incentives): 18 years Adjacent Building Annual Electrical Usage: 102,960 kWh Solar System Annual Output: 11,500 kWh % offset: 11.17% Applicable Incentives A detailed summary of applicable incentives is included
1. Vermont Small Scale Renewable Energy Incentive Program: $2.25/watt DC up to 10 kW, $1.50/W DC for next 50 kW (up to 60 kW). Maximum incentive $97,500 or up to 50% of project costs (whichever is lower).
Installation Type DC Watts per
Unit
1. Roof Mount Ballasted Flat
8 sqft
2. Roof Mount Sloped 11.5 sqft 3. Ground Mount 5 sqft 4. Carport 1000 Parking
space

UVM Campus Renewable Energy Feasibility Study Parking Lot: Ira Allen School Lot
2. Burlington Electric Department feed in tariff purchases PV produced power at 0.20 $/kWh, the offset calculation compares this power, which is fed directly into the grid, against the adjacent structure’s utility demand.
Notes:
1. Installed cost includes all materials, labor, design, engineering…etc. based on observed market conditions in Q2 2012.
2. Estimated electrical use based on use from Ira Allen School alone 3. Financial analysis assumes BED utility 4. Electrical engineering/design of interconnection required (included in est.
cost) 5. Utility rate assumes an annual increase of 3%

UVM Campus Renewable Energy Feasibility Study Parking Lot: Jacob House Lot Report Date: 6/18/2012 By: Jack Lehrecke
* Measurements are approximate and include all required spacing * Carport calculation requires a minimum of 20 contiguous spots * Flat roof assumes 10’ setbacks per OSHA * Sloped roof assumes 4’ setback per building code (may vary)
Parking Lot: Jacob House Lot Address: 146 S. Williams Street, Burlington VT Aerial Photo:
Total Parking Spaces: 6 Installation Type: Carport Tilt Angle: 10° Orientation: E-W Approximate DC Watts: 6,000 Solar PV System Size: 6.0kW
Installation Type DC Watts per
Unit
1. Roof Mount Ballasted Flat
8 sqft
2. Roof Mount Sloped 11.5 sqft 3. Ground Mount 5 sqft 4. Carport 1000 Parking
space

UVM Campus Renewable Energy Feasibility Study Parking Lot: Jacob House Lot Basis of Design Equipment: Solaire Generation ‘Solaris’ system or similar Sharp 250W Mono Solar Modules SMA 6000 Powered Solar PV Inverter Cooper Crouse Hinds Disconnecting, Surge Protection Combiner Boxes Total $/watt: $10.00 Estimated Installed Cost: $60,000 (rounded to nearest $10,000) Payback (with no incentives): 47.8 years Payback (with incentives): 21 years Adjacent Building Annual Electrical Usage: 35,706 kWh Solar System Annual Output: 6,600 kWh % offset: 18.48% Applicable Incentives A detailed summary of applicable incentives is included
1. Vermont Small Scale Renewable Energy Incentive Program: $2.25/watt DC up to 10 kW, $1.50/W DC for next 50 kW (up to 60 kW). Maximum incentive $97,500 or up to 50% of project costs (whichever is lower).
2. Burlington Electric Department feed in tariff purchases PV produced power at 0.20 $/kWh, the offset calculation compares this power, which is fed directly into the grid, against the adjacent structure’s utility demand.
Notes: 1. Installed cost includes all materials, labor, design, engineering…etc. based on
observed market conditions in Q2 2012. 2. Estimated electrical use based on use from Jacob House alone 3. Financial analysis assumes BED utility 4. Electrical engineering/design of interconnection required (included in est.
cost) 5. Utility rate assumes an annual increase of 3%

UVM Campus Renewable Energy Feasibility Study Parking Lot: Living and Learning South Visitors Lot Parking Lot: L&L South Visitor Lot Address: 617 Main St Burlington, VT Aerial Photo:

UVM Campus Renewable Energy Feasibility Study Parking Lot: Living and Learning South Visitors Lot
* Measurements are approximate and include all required spacing * Carport calculation requires a minimum of 20 contiguous spots * Flat roof assumes 10’ setbacks per OSHA * Sloped roof assumes 4’ setback per building code (may vary)
Total Parking Spaces: 55 Installation Type: Carport Tilt Angle: 10° Orientation: SW/SE Approximate DC Watts: 55,000 Solar PV System Size: 55.0kW Basis of Design Equipment: Solaire Generation ‘Solaris’ system or similar Sharp 250W Mono Solar Modules PVP 50kW Powered Solar PV Inverter Cooper Crouse Hinds Disconnecting, Surge Protection Combiner Boxes Total $/watt: $6.36 Estimated Installed Cost: $350,000 (rounded to nearest $10,000) Payback (with no incentives): 29.1 years Payback (with incentives): 22 years Adjacent Building Annual Electrical Usage: 160,000kWh Solar System Annual Output: 63,250 kWh % offset: 39.53% Applicable Incentives A detailed summary of applicable incentives is included
1. Vermont Small Scale Renewable Energy Incentive Program: $2.25/watt DC up to 10 kW, $1.50/W DC for next 50 kW (up to 60 kW). Maximum incentive $97,500 or up to 50% of project costs (whichever is lower).
2. Burlington Electric Department feed in tariff purchases PV produced power at 0.20 $/kWh, the offset calculation compares this power, which is fed directly into the grid, against the adjacent structure’s utility demand.
Installation Type DC Watts per
Unit
1. Roof Mount Ballasted Flat
8 sqft
2. Roof Mount Sloped 11.5 sqft 3. Ground Mount 5 sqft 4. Carport 1000 Parking
space

UVM Campus Renewable Energy Feasibility Study Parking Lot: Living and Learning South Visitors Lot Notes:
1. Installed cost includes all materials, labor, design, engineering…etc. based on observed market conditions in Q2 2012.
2. Estimated electrical use based on use from nearest L&L facility alone 3. Financial analysis assumes BED utility 4. Electrical engineering/design of interconnection required (included in est.
cost) 5. Utility rate assumes an annual increase of 3%

UVM Campus Renewable Energy Feasibility Study Parking Lot: Mann Hall Parking Lot Report Date: 6/18/2012 By: Jack Lehrecke Parking Lot: Mann Hall Parking Lot Address: Trinity Campus, Burlington VT Aerial Photo:

UVM Campus Renewable Energy Feasibility Study Parking Lot: Mann Hall Parking Lot
* Measurements are approximate and include all required spacing * Carport calculation requires a minimum of 20 contiguous spots * Flat roof assumes 10’ setbacks per OSHA * Sloped roof assumes 4’ setback per building code (may vary)
Total Parking Spaces: 45 Installation Type: Carport Tilt Angle: 10° Orientation: SW Approximate DC Watts: 45,000 Solar PV System Size: 45.0kW Basis of Design Equipment: Solaire Generation ‘Solaris’ system or similar Sharp 250W Mono Solar Modules PVP 30kW Powered Solar PV Inverter Cooper Crouse Hinds Disconnecting, Surge Protection Combiner Boxes Total $/watt: $6.67 Estimated Installed Cost: $300,000 (rounded to nearest $10,000) Payback (with no incentives): 30.5 years Payback (with incentives): 23 years Adjacent Building Annual Electrical Usage: 486,206 kWh Solar System Annual Output: 51,750 kWh % offset: 10.64% Applicable Incentives A detailed summary of applicable incentives is included
1. Vermont Small Scale Renewable Energy Incentive Program: $2.25/watt DC up to 10 kW, $1.50/W DC for next 50 kW (up to 60 kW). Maximum incentive $97,500 or up to 50% of project costs (whichever is lower).
2. Burlington Electric Department feed in tariff purchases PV produced power at 0.20 $/kWh, the offset calculation compares this power, which is fed directly into the grid, against the adjacent structure’s utility demand.
Installation Type DC Watts per
Unit
1. Roof Mount Ballasted Flat
8 sqft
2. Roof Mount Sloped 11.5 sqft 3. Ground Mount 5 sqft 4. Carport 1000 Parking
space

UVM Campus Renewable Energy Feasibility Study Parking Lot: Mann Hall Parking Lot
Notes: 1. Installed cost includes all materials, labor, design, engineering…etc. based on
observed market conditions in Q2 2012. 2. Estimated electrical use based on use from Mann Hall alone 3. Financial analysis assumes BED utility 4. Electrical engineering/design of interconnection required (included in est.
cost) 5. Utility rate assumes an annual increase of 3%

UVM Campus Renewable Energy Feasibility Study Parking Lot: Mercy Hall Northeast Lot Report Date: 7/4/2012 By: Jack Lehrecke Parking Lot: Mercy Hall Northeast Lot Address: Trinity Campus Burlington, VT Aerial Photo:
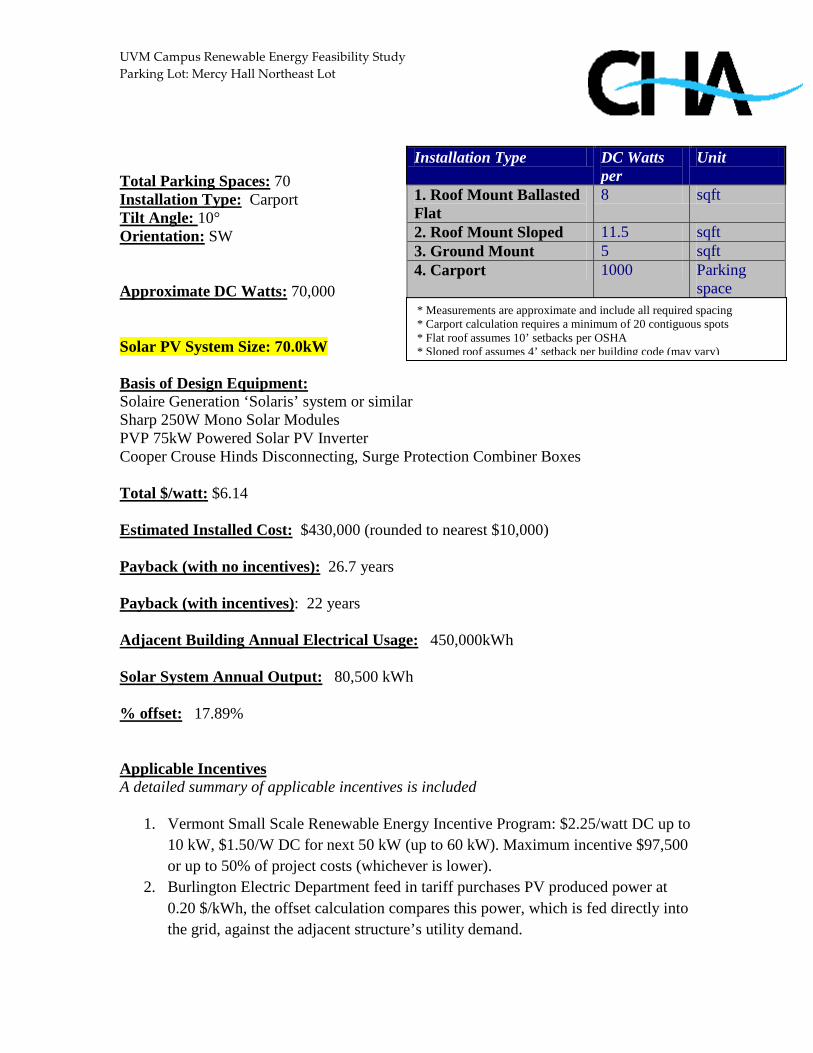
UVM Campus Renewable Energy Feasibility Study Parking Lot: Mercy Hall Northeast Lot
* Measurements are approximate and include all required spacing * Carport calculation requires a minimum of 20 contiguous spots * Flat roof assumes 10’ setbacks per OSHA * Sloped roof assumes 4’ setback per building code (may vary)
Total Parking Spaces: 70 Installation Type: Carport Tilt Angle: 10° Orientation: SW Approximate DC Watts: 70,000 Solar PV System Size: 70.0kW Basis of Design Equipment: Solaire Generation ‘Solaris’ system or similar Sharp 250W Mono Solar Modules PVP 75kW Powered Solar PV Inverter Cooper Crouse Hinds Disconnecting, Surge Protection Combiner Boxes Total $/watt: $6.14 Estimated Installed Cost: $430,000 (rounded to nearest $10,000) Payback (with no incentives): 26.7 years Payback (with incentives): 22 years Adjacent Building Annual Electrical Usage: 450,000kWh Solar System Annual Output: 80,500 kWh % offset: 17.89% Applicable Incentives A detailed summary of applicable incentives is included
1. Vermont Small Scale Renewable Energy Incentive Program: $2.25/watt DC up to 10 kW, $1.50/W DC for next 50 kW (up to 60 kW). Maximum incentive $97,500 or up to 50% of project costs (whichever is lower).
2. Burlington Electric Department feed in tariff purchases PV produced power at 0.20 $/kWh, the offset calculation compares this power, which is fed directly into the grid, against the adjacent structure’s utility demand.
Installation Type DC Watts per
Unit
1. Roof Mount Ballasted Flat
8 sqft
2. Roof Mount Sloped 11.5 sqft 3. Ground Mount 5 sqft 4. Carport 1000 Parking
space

UVM Campus Renewable Energy Feasibility Study Parking Lot: Mercy Hall Northeast Lot Notes:
1. Installed cost includes all materials, labor, design, engineering…etc. based on observed market conditions in Q2 2012.
2. Estimated electrical use based on use from Mercy Hall alone 3. Financial analysis assumes BED utility 4. Electrical engineering/design of interconnection required (included in est.
cost) 5. Western spaces excluded due to possible shading 6. Utility rate assumes an annual increase of 3%
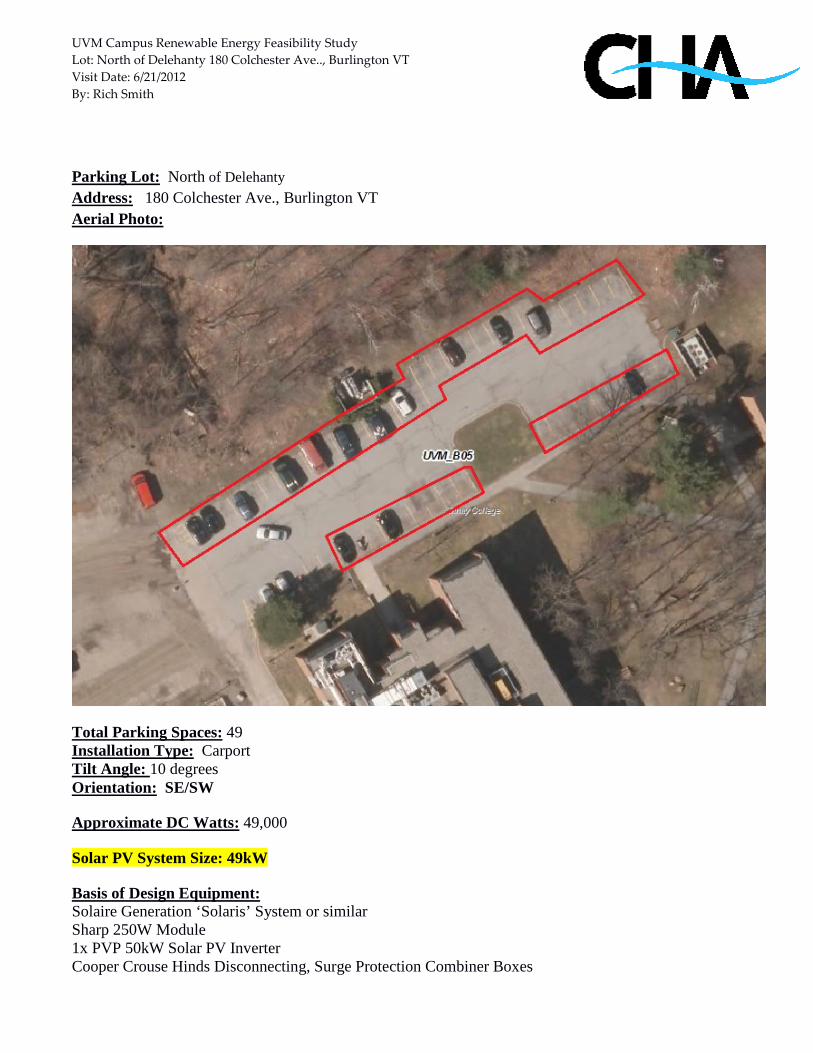
UVM Campus Renewable Energy Feasibility Study Lot: North of Delehanty 180 Colchester Ave.., Burlington VT Visit Date: 6/21/2012 By: Rich Smith
Parking Lot: North of Delehanty Address: 180 Colchester Ave., Burlington VT Aerial Photo:
Total Parking Spaces: 49 Installation Type: Carport Tilt Angle: 10 degrees Orientation: SE/SW Approximate DC Watts: 49,000 Solar PV System Size: 49kW Basis of Design Equipment: Solaire Generation ‘Solaris’ System or similar Sharp 250W Module 1x PVP 50kW Solar PV Inverter Cooper Crouse Hinds Disconnecting, Surge Protection Combiner Boxes

UVM Campus Renewable Energy Feasibility Study Lot: North of Delehanty 180 Colchester Ave.., Burlington VT
Total $/watt: $6.54 Estimated Installed Cost: $310,000 (rounded to nearest $10,000) Payback (with no incentives): 27.5 years Payback (with incentives): 16 years Adjacent Building Annual Electrical Usage: 587,165 kWh* Solar System Annual Output: 56,350kWh % offset: 9.6% Applicable Incentives A detailed summary of applicable incentives is included
1. Vermont Small Scale Renewable Energy Incentive Program: $2.25/watt DC up to 10 kW, $1.50/W DC for next 50 kW (up to 60 kW). Maximum incentive $97,500 or up to 50% of project costs (whichever is lower).
2. Electricity will be sold directly to Burlington Electric Department at a rate of $0.20/kWh. There will be a separate meter and service, one bill for the building use that will be offset by the bill for BED credit.
Notes:
1. Structural design of carport system(s) will be required. This has been included in the estimated cost. 2. Installed cost includes all materials, labor, design, engineering…etc. based on observed market
conditions in Q2 2012. 3. *Estimated electrical use based on use from Delehanty Hall 2011 Data. 4. Financial analysis assumes BED utility 5. Electrical engineering/design of interconnection required (included in est. cost)

UVM Campus Renewable Energy Feasibility Study Parking Lot: East of Chittenden, Burlington VT Visit Date: 6/19/2012 By: Ryan Darlow Parking Lot: East of Chittenden Address: Burlington, VT Aerial Photo:

UVM Campus Renewable Energy Feasibility Study Parking Lot: East of Chittenden, Burlington VT
* Measurements are approximate and include all required spacing * Carport calculation requires a minimum of 20 contiguous spots * Flat roof assumes 10’ setbacks per OSHA * Sloped roof assumes 4’ setback per building code (may vary)
Total Parking Spaces: 85 Installation Type: 4 Tilt Angle: 10° Orientation: East Approximate DC Watts: 85,000 Solar PV System Size: 85kW Basis of Design Equipment: Solaire Generation ‘Solaris’ system or similar Sharp 250W Mono Solar Modules 1x 75 kW PV Powered Solar PV Inverter Cooper Crouse Hinds Disconnecting, Surge Protection Combiner Boxes Market Conditions $/watt: $6.00 Estimated Installed Cost: $510,000 (rounded to nearest $10,000) Payback (with no incentives): 27.3 years Payback: 21 years Building Annual Electrical Usage: 726,840kWh Solar System Annual Output: 93,500 kWh % offset: 12.86% Applicable Incentives A detailed summary of applicable incentives is included
1. Vermont Small Scale Renewable Energy Incentive Program: $2.25/watt DC up to 10 kW, $1.50/W DC for next 50 kW (up to 60 kW). Maximum incentive $97,500 or up to 50% of project costs (whichever is lower).
2. Burlington Electric Department metering for $.20 per kWh.
Installation Type DC Watts per
Unit
1. Roof Mount Ballasted Flat
8 sqft
2. Roof Mount Sloped 11.5 sqft 3. Ground Mount 5 sqft 4. Carport 1000 Parking
space

UVM Campus Renewable Energy Feasibility Study Parking Lot: East of Chittenden, Burlington VT Notes:
1. Installed cost includes all materials, labor, design, engineering…etc. based on observed market conditions in Q2 2012.
2. Estimated electrical use based on use from Chittenden Buckham Wills Complex 3. Financial analysis assumes BED utility 4. Electrical engineering/design of interconnection required (included in est. cost) 5. Electricity will be directly fed into the grid, so the building offset is the equivalent amount

UVM Campus Renewable Energy Feasibility Study Parking Lot: East of Harris Millis, Burlington VT Visit Date: 6/21/2012 By: Ryan Darlow Parking Lot: East of Harris Millis Address: Burlington, VT Aerial Photo:

UVM Campus Renewable Energy Feasibility Study Parking Lot: East of Harris Millis, Burlington VT
* Measurements are approximate and include all required spacing * Carport calculation requires a minimum of 20 contiguous spots * Flat roof assumes 10’ setbacks per OSHA * Sloped roof assumes 4’ setback per building code (may vary)
Total Parking Spaces: 124 Installation Type: 4 Tilt Angle: 10° Orientation: East Approximate DC Watts: 124,000 Solar PV System Size: 124 kW Basis of Design Equipment: Solaire Generation ‘Solaris’ system or similar Sharp 250W Mono Solar Modules 1x 100 kW PV Powered Solar PV Inverter Cooper Crouse Hinds Disconnecting, Surge Protection Combiner Boxes Market Conditions $/watt: $5.73 Estimated Installed Cost: $710,000 (rounded to nearest $10,000) Payback (with no incentives): 26.0 years Payback: 21 years Building Annual Electrical Usage: 1,053,920 kWh Solar System Annual Output: 136,400 kWh % offset: 12.94% Applicable Incentives A detailed summary of applicable incentives is included
1. Vermont Small Scale Renewable Energy Incentive Program: $2.25/watt DC up to 10 kW, $1.50/W DC for next 50 kW (up to 60 kW). Maximum incentive $97,500 or up to 50% of project costs (whichever is lower).
2. Burlington Electric Department metering for $.20 per kWh.
Installation Type DC Watts per
Unit
1. Roof Mount Ballasted Flat
8 sqft
2. Roof Mount Sloped 11.5 sqft 3. Ground Mount 5 sqft 4. Carport 1000 Parking
space

UVM Campus Renewable Energy Feasibility Study Parking Lot: East of Harris Millis, Burlington VT Notes:
1. Installed cost includes all materials, labor, design, engineering…etc. based on observed market conditions in Q2 2012.
2. Estimated electrical use based on use from Harris Millis Complex 3. Financial analysis assumes BED utility 4. Electrical engineering/design of interconnection required (included in est. cost) 5. Electricity will be directly fed into the grid, so the building offset is the equivalent amount

UVM Campus Renewable Energy Feasibility Study Parking Lot: East of Health Sciences, Burlington VT Visit Date: 6/19/2012 By: Ryan Darlow
* Measurements are approximate and include all required spacing * Carport calculation requires a minimum of 20 contiguous spots * Flat roof assumes 10’ setbacks per OSHA * Sloped roof assumes 4’ setback per building code (may vary)
Parking Lot: East of Health Sciences Address: Burlington, VT Aerial Photo:
Total Spaces: 25 Installation Type: 4 Tilt Angle: 10° Orientation: East Approximate DC Watts: 25,000 Solar PV System Size: 25kW Basis of Design Equipment: Solaire Generation ‘Solaris’ system or similar Sharp 250W Mono Solar Modules 3x SMA 8000W Solar PV Inverters Cooper Crouse Hinds Disconnecting, Surge Protection Combiner Boxes
Installation Type DC Watts per
Unit
1. Roof Mount Ballasted Flat
8 sqft
2. Roof Mount Sloped 11.5 sqft 3. Ground Mount 5 sqft 4. Carport 1000 Parking
space

UVM Campus Renewable Energy Feasibility Study Parking Lot: East of Health Sciences, Burlington VT Market Conditions $/watt: $7.20 Estimated Installed Cost: $180,000 (rounded to nearest $10,000) Payback (with no incentives): 32.7 years Payback: 25 years Adjacent Building Annual Electrical Usage: 3,804,500kWh Solar System Annual Output: 27,500 kWh % offset: .72% Applicable Incentives A detailed summary of applicable incentives is included
1. Vermont Small Scale Renewable Energy Incentive Program: $2.25/watt DC up to 10 kW, $1.50/W DC for next 50 kW (up to 60 kW). Maximum incentive $97,500 or up to 50% of project costs (whichever is lower).
2. Burlington Electric Department metering for $.20 per kWh.
Notes: 1. Installed cost includes all materials, labor, design, engineering…etc. based on observed market
conditions in Q2 2012 2. Estimated electrical use based on use from Health Science Research Facility 3. Financial analysis assumes BED utility 4. Electrical engineering/design of interconnection required (included in est.cost) 5. Electricity will be directly fed into the grid, so the building offset is the equivalent amount

UVM Campus Renewable Energy Feasibility Study Parking Lot: East of Redstone Apartments, Burlington VT Visit Date: 6/21/2012 By: Ryan Darlow Parking Lot: East of Redstone Apartments Address: Burlington, VT Aerial Photo:

UVM Campus Renewable Energy Feasibility Study Parking Lot: East of Redstone Apartments, Burlington VT
* Measurements are approximate and include all required spacing * Carport calculation requires a minimum of 20 contiguous spots * Flat roof assumes 10’ setbacks per OSHA * Sloped roof assumes 4’ setback per building code (may vary)
Total Parking Spaces: 87 Installation Type: 4 Tilt Angle: 10° Orientation: East Approximate DC Watts: 87,000 Solar PV System Size: 87kW Basis of Design Equipment: Solaire Generation ‘Solaris’ system or similar Sharp 250W Mono Solar Modules 1x 75 kW PV Powered Solar PV Inverter Cooper Crouse Hinds Disconnecting, Surge Protection Combiner Boxes Market Conditions $/watt: $5.98 Estimated Installed Cost: $520,000 (rounded to nearest $10,000) Payback (with no incentives): 27.2 years Payback: 21 years Building Annual Electrical Usage: 803,640 kWh Solar System Annual Output: 95,700 kWh % offset: 11.91% Applicable Incentives A detailed summary of applicable incentives is included
1. Vermont Small Scale Renewable Energy Incentive Program: $2.25/watt DC up to 10 kW, $1.50/W DC for next 50 kW (up to 60 kW). Maximum incentive $97,500 or up to 50% of project costs (whichever is lower).
2. Burlington Electric Department metering for $.20 per kWh.
Installation Type DC Watts per
Unit
1. Roof Mount Ballasted Flat
8 sqft
2. Roof Mount Sloped 11.5 sqft 3. Ground Mount 5 sqft 4. Carport 1000 Parking
space

UVM Campus Renewable Energy Feasibility Study Parking Lot: East of Redstone Apartments, Burlington VT Notes:
1. Installed cost includes all materials, labor, design, engineering…etc. based on observed market conditions in Q2 2012.
2. Estimated electrical use based on use from Wing Davis Wilks Complex 3. Financial analysis assumes BED utility 4. Electrical engineering/design of interconnection required (included in est. cost) 5. Electricity rate assumes 3% average annual increase

UVM Campus Renewable Energy Feasibility Study Parking Lot: East of Tupper, Burlington VT Visit Date: 6/19/2012 By: Ryan Darlow
* Measurements are approximate and include all required spacing * Carport calculation requires a minimum of 20 contiguous spots * Flat roof assumes 10’ setbacks per OSHA * Sloped roof assumes 4’ setback per building code (may vary)
Parking Lot: East of Tupper Address: Burlington, VT Aerial Photo:
Total Parking Spaces: 95 Installation Type: 4 Tilt Angle: 10° Orientation: East Approximate DC Watts: 95,000 Solar PV System Size: 95kW
Installation Type DC Watts per
Unit
1. Roof Mount Ballasted Flat
8 sqft
2. Roof Mount Sloped 11.5 sqft 3. Ground Mount 5 sqft 4. Carport 1000 Parking
space

UVM Campus Renewable Energy Feasibility Study Parking Lot: East of Tupper, Burlington VT Basis of Design Equipment: Solaire Generation ‘Solaris’ system or similar Sharp 250W Mono Solar Modules 1x 100 kW PV Powered Solar PV Inverter Cooper Crouse Hinds Disconnecting, Surge Protection Combiner Boxes Market Conditions $/watt: $5.89 Estimated Installed Cost: $560,000 (rounded to nearest $10,000) Payback (with no incentives): 26.8 years Payback: 22 years Building Annual Electrical Usage: 591,680 kWh Solar System Annual Output: 104,500 kWh % offset: 17.69% Applicable Incentives A detailed summary of applicable incentives is included
1. Vermont Small Scale Renewable Energy Incentive Program: $2.25/watt DC up to 10 kW, $1.50/W DC for next 50 kW (up to 60 kW). Maximum incentive $97,500 or up to 50% of project costs (whichever is lower).
2. Burlington Electric Department metering for $.20 per kWh.
Notes:
1. Installed cost includes all materials, labor, design, engineering…etc. based on observed market conditions in Q2 2012.
2. Estimated electrical use based on use from Marsh Austin Tupper Complex 3. Financial analysis assumes BED utility 4. Electrical engineering/design of interconnection required (included in est. cost) 5. Existing light poles may cause some shading 6. Electricity will be directly fed into the grid, so the building offset is the equivalent amount

UVM Campus Renewable Energy Feasibility Study Parking Lot: East Wing Davis Wilks, Burlington VT Visit Date: 6/19/2012 By: Ryan Darlow
* Measurements are approximate and include all required spacing * Carport calculation requires a minimum of 20 contiguous spots * Flat roof assumes 10’ setbacks per OSHA * Sloped roof assumes 4’ setback per building code (may vary)
Parking Lot: East of Wing Davis Wilks Address: Burlington, VT Aerial Photo:
Total Parking Spaces: 93 Installation Type: 4 Tilt Angle: 10° Orientation: Southwest Approximate DC Watts: 93,000 Solar PV System Size: 93kW
Installation Type DC Watts per
Unit
1. Roof Mount Ballasted Flat
8 sqft
2. Roof Mount Sloped 11.5 sqft 3. Ground Mount 5 sqft 4. Carport 1000 Parking
space

UVM Campus Renewable Energy Feasibility Study Parking Lot: East Wing Davis Wilks, Burlington VT Basis of Design Equipment: Solaire Generation ‘Solaris’ system or similar Sharp 250W Mono Solar Modules 1x 100 kW PV Powered Solar PV Inverter Cooper Crouse Hinds Disconnecting, Surge Protection Combiner Boxes Market Conditions $/watt: $5.91 Estimated Installed Cost: $550,000 (rounded to nearest $10,000) Payback (with no incentives): 24.6 years Payback: 21 years Building Annual Electrical Usage: 803,640 kWh Solar System Annual Output: 111,600 kWh % offset: 13.89% Applicable Incentives A detailed summary of applicable incentives is included
1. Vermont Small Scale Renewable Energy Incentive Program: $2.25/watt DC up to 10 kW, $1.50/W DC for next 50 kW (up to 60 kW). Maximum incentive $97,500 or up to 50% of project costs (whichever is lower).
2. Burlington Electric Department metering for $.20 per kWh.
Notes:
1. Installed cost includes all materials, labor, design, engineering…etc. based on observed market conditions in Q2 2012.
2. Estimated electrical use based on use from Wing Davis Wilks Complex 3. Financial analysis assumes BED utility 4. Electrical engineering/design of interconnection required (included in est. cost) 5. Electricity will be directly fed into the grid, so the building offset is the equivalent amount

UVM Campus Renewable Energy Feasibility Study Parking Lot: North of Police Services, Burlington VT Visit Date: 7/11/2012 By: Ryan Darlow
* Measurements are approximate and include all required spacing * Carport calculation requires a minimum of 20 contiguous spots * Flat roof assumes 10’ setbacks per OSHA * Sloped roof assumes 4’ setback per building code (may vary)
Parking Lot: North of Police Services Address: Burlington, VT Aerial Photo:
Total Parking Spaces: 16 Installation Type: 4 Tilt Angle: 10° Orientation: East Approximate DC Watts: 16,000 Solar PV System Size: 16kW Basis of Design Equipment: Solaire Generation ‘Solaris’ system or similar Sharp 250W Mono Solar Modules 2 x SMA 8000W Solar PV Inverters Cooper Crouse Hinds Disconnecting, Surge Protection Combiner Boxes Market Conditions $/watt: $7.50 Estimated Installed Cost: $120,000 (rounded to nearest $10,000)
Installation Type DC Watts per
Unit
1. Roof Mount Ballasted Flat
8 sqft
2. Roof Mount Sloped 11.5 sqft 3. Ground Mount 5 sqft 4. Carport 1000 Parking
space

UVM Campus Renewable Energy Feasibility Study Parking Lot: North of Police Services, Burlington VT Payback (with no incentives): 31.3 years Payback: 27 years Building Annual Electrical Usage: 202,380 kWh Solar System Annual Output: 19,200 kWh % offset: 9.49% Applicable Incentives A detailed summary of applicable incentives is included
1. Vermont Small Scale Renewable Energy Incentive Program: $2.25/watt DC up to 10 kW, $1.50/W DC for next 50 kW (up to 60 kW). Maximum incentive $97,500 or up to 50% of project costs (whichever is lower).
2. Burlington Electric Department metering for $.20 per kWh.
Notes:
1. Installed cost includes all materials, labor, design, engineering…etc. based on observed market conditions in Q2 2012.
2. Estimated electrical use based on use from 284 East Ave 3. Financial analysis assumes BED utility 4. Electrical engineering/design of interconnection required (included in est. cost) 5. Electricity will be directly fed into the grid, so the building offset is the equivalent amount

UVM Campus Renewable Energy Feasibility Study Parking Lot: South of Police Services, Burlington VT Visit Date: 7/11/2012 By: Ryan Darlow
* Measurements are approximate and include all required spacing * Carport calculation requires a minimum of 20 contiguous spots * Flat roof assumes 10’ setbacks per OSHA * Sloped roof assumes 4’ setback per building code (may vary)
Parking Lot: South of Police Services Address: Burlington, VT Aerial Photo:
Total Parking Spaces: 30 Installation Type: 4 Tilt Angle: 10° Orientation: East Approximate DC Watts: 30,000 Solar PV System Size: 30kW Basis of Design Equipment: Solaire Generation ‘Solaris’ system or similar Sharp 250W Mono Solar Modules 3x SMA 10000W Solar PV Inverters Cooper Crouse Hinds Disconnecting, Surge Protection Combiner Boxes
Installation Type DC Watts per
Unit
1. Roof Mount Ballasted Flat
8 sqft
2. Roof Mount Sloped 11.5 sqft 3. Ground Mount 5 sqft 4. Carport 1000 Parking
space

UVM Campus Renewable Energy Feasibility Study Parking Lot: South of Police Services, Burlington VT Market Conditions $/watt: $7.00 Estimated Installed Cost: $210,000 (rounded to nearest $10,000) Payback (with no incentives): 31.8 years Payback: 24 years Building Annual Electrical Usage: 202,380 kWh Solar System Annual Output: 33,000 kWh % offset: 16.31% Applicable Incentives A detailed summary of applicable incentives is included
1. Vermont Small Scale Renewable Energy Incentive Program: $2.25/watt DC up to 10 kW, $1.50/W DC for next 50 kW (up to 60 kW). Maximum incentive $97,500 or up to 50% of project costs (whichever is lower).
2. Burlington Electric Department metering for $.20 per kWh.
Notes:
1. Installed cost includes all materials, labor, design, engineering…etc. based on observed market conditions in Q2 2012.
2. Estimated electrical use based on use from 284 East Ave 3. Financial analysis assumes BED utility 4. Electrical engineering/design of interconnection required (included in est. cost) 5. Electricity will be directly fed into the grid, so the building offset is the equivalent amount

UVM Campus Renewable Energy Feasibility Study Parking Lot: East of Water Tower, Burlington VT Visit Date: 7/11/2012 By: Ryan Darlow
* Measurements are approximate and include all required spacing * Carport calculation requires a minimum of 20 contiguous spots * Flat roof assumes 10’ setbacks per OSHA * Sloped roof assumes 4’ setback per building code (may vary)
Parking Lot: South of Water Tower Address: Burlington, VT Aerial Photo:
Total Parking Spaces: 72 Installation Type: 4 Tilt Angle: 10° Orientation: South, East, Southwest Approximate DC Watts: 72,000 Solar PV System Size: 72kW
Installation Type DC Watts per
Unit
1. Roof Mount Ballasted Flat
8 sqft
2. Roof Mount Sloped 11.5 sqft 3. Ground Mount 5 sqft 4. Carport 1000 Parking
space

UVM Campus Renewable Energy Feasibility Study Parking Lot: East of Water Tower, Burlington VT Basis of Design Equipment: Solaire Generation ‘Solaris’ system or similar Sharp 250W Mono Solar Modules 1x 75 kW PV Powered Solar PV Inverter Cooper Crouse Hinds Disconnecting, Surge Protection Combiner Boxes Market Conditions $/watt: $6.11 Estimated Installed Cost: $440,000 (rounded to nearest $10,000) Payback (with no incentives): 26.6 years Payback: 21 years Building Annual Electrical Usage: 2,360,960 kWh Solar System Annual Output: 82,800 kWh % offset: 3.51% Applicable Incentives A detailed summary of applicable incentives is included
1. Vermont Small Scale Renewable Energy Incentive Program: $2.25/watt DC up to 10 kW, $1.50/W DC for next 50 kW (up to 60 kW). Maximum incentive $97,500 or up to 50% of project costs (whichever is lower).
2. Burlington Electric Department metering for $.20 per kWh.
Notes:
1. Installed cost includes all materials, labor, design, engineering…etc. based on observed market conditions in Q2 2012.
2. Estimated electrical use based on use from Jeffords Hall 3. Financial analysis assumes BED utility 4. Electrical engineering/design of interconnection required (included in est. cost) 5. Electricity will be directly fed into the grid, so the building offset is the equivalent amount 6. Spots facing to the southwest may be shaded by Jeffords Hall

UVM Campus Renewable Energy Feasibility Study Parking Lot: Southwest of Mann Hall, Burlington VT Visit Date: 7/10/2012 By: Ryan Darlow
* Measurements are approximate and include all required spacing * Carport calculation requires a minimum of 20 contiguous spots * Flat roof assumes 10’ setbacks per OSHA * Sloped roof assumes 4’ setback per building code (may vary)
Parking Lot: Southwest of Mann Hall Address: Burlington, VT Aerial Photo:
Total Parking Space: 7 Installation Type: 4 Tilt Angle: 10° Orientation: 145° Southeast, 235° Southwest Approximate DC Watts: 7,000 Solar PV System Size: 7kW Basis of Design Equipment: Solaire Generation ‘Solaris’ system or similar Sharp 250W Mono Solar Modules 1 x SMA 7000 W Solar PV Inverter Cooper Crouse Hinds Disconnecting, Surge Protection Combiner Boxes Total $/watt: $10.00 Estimated Installed Cost: $70,000 (rounded to nearest $10,000)
Installation Type DC Watts per
Unit
1. Roof Mount Ballasted Flat
8 sqft
2. Roof Mount Sloped 11.5 sqft 3. Ground Mount 5 sqft 4. Carport 1000 Parking
space

UVM Campus Renewable Energy Feasibility Study Parking Lot: Southwest of Mann Hall, Burlington VT Payback (with no incentives): 43.5 years Payback: 46 years Building Annual Electrical Usage: 486,206 kWh Solar System Annual Output: 8050 kWh % offset: 1.66 % Applicable Incentives A detailed summary of applicable incentives is included
1. Vermont Small Scale Renewable Energy Incentive Program: $2.25/watt DC up to 10 kW, $1.50/W DC for next 50 kW (up to 60 kW). Maximum incentive $97,500 or up to 50% of project costs (whichever is lower).
2. Burlington Electric Department metering for $.20 per kWh. Notes:
1. Installed cost includes all materials, labor, design, engineering…etc. based on observed market conditions in Q2 2012.
2. Estimated electrical use based on use from Mann Hall 3. Financial analysis assumes BED utility 4. Electrical engineering/design of interconnection required (included in est. cost) 5. Electricity will be directly fed into the grid, so the building offset is the equivalent amount

UVM Campus Renewable Energy Feasibility Study Parking Lot: Wheeler/ Peirce Spaulding, Burlington VT Visit Date: 7/11/2012 By: Ryan Darlow
* Measurements are approximate and include all required spacing * Carport calculation requires a minimum of 20 contiguous spots * Flat roof assumes 10’ setbacks per OSHA * Sloped roof assumes 4’ setback per building code (may vary)
Parking Lot: Wheeler/Peirce Spaulding Address: Burlington, VT Aerial Photo:
Total Parking Spaces: 101 Installation Type: 4 Tilt Angle: 10° Orientation: South, East, Southeast, Southwest Approximate DC Watts: 101,000 Solar PV System Size: 101kW
Installation Type DC Watts per
Unit
1. Roof Mount Ballasted Flat
8 sqft
2. Roof Mount Sloped 11.5 sqft 3. Ground Mount 5 sqft 4. Carport 1000 Parking
space

UVM Campus Renewable Energy Feasibility Study Parking Lot: Wheeler/ Peirce Spaulding, Burlington VT Basis of Design Equipment: Solaire Generation ‘Solaris’ system or similar Sharp 250W Mono Solar Modules 1x 100 kW PV Powered Solar PV Inverter Cooper Crouse Hinds Disconnecting, Surge Protection Combiner Boxes Market Conditions $/watt: $5.84 Estimated Installed Cost: $590,000 (rounded to nearest $10,000) Payback (with no incentives): 24.3 years Payback: 22 years Building Annual Electrical Usage: 54,976 kWh* Solar System Annual Output: 121,200 kWh % offset: 220.46% Applicable Incentives A detailed summary of applicable incentives is included
1. Vermont Small Scale Renewable Energy Incentive Program: $2.25/watt DC up to 10 kW, $1.50/W DC for next 50 kW (up to 60 kW). Maximum incentive $97,500 or up to 50% of project costs (whichever is lower).
2. Burlington Electric Department metering for $.20 per kWh.
Notes:
1. Installed cost includes all materials, labor, design, engineering…etc. based on observed market conditions in Q2 2012.
2. *Estimated electrical use based on use from Wheeler House and Peirce Spaulding House combined 3. Financial analysis assumes BED utility 4. Electrical engineering/design of interconnection required (included in est. cost) 5. Electricity will be directly fed into the grid, so the building offset is the equivalent amount

UVM Campus Renewable Energy Feasibility Study Lot: South of Southwick 390 S. Prospect St., Burlington VT Visit Date: 6/21/2012 By: Rich Smith
Parking Lot: South of Southwick Address: 390 S. Prospect St., Burlington VT Aerial Photo:
Total Parking Spaces: 82 Installation Type: Carport Tilt Angle: 10 degrees Orientation: South Approximate DC Watts: 82,000 Solar PV System Size: 82kW Basis of Design Equipment: Solaire Generation ‘Solaris’ System or similar Sharp 250W Module 1x PVP 75kW Solar PV Inverter Cooper Crouse Hinds Disconnecting, Surge Protection Combiner Boxes

UVM Campus Renewable Energy Feasibility Study Lot: South of Southwick 390 S. Prospect St., Burlington VT
Total $/watt: $5.98 Estimated Installed Cost: $480,000 (rounded to nearest $10,000) Payback (with no incentives): 24.4 years Payback (with incentives): 16 years Adjacent Building Annual Electrical Usage: 388,911 kWh* Solar System Annual Output: 98,400kWh % offset: 25.3% Applicable Incentives A detailed summary of applicable incentives is included
1. Vermont Small Scale Renewable Energy Incentive Program: $2.25/watt DC up to 10 kW, $1.50/W DC for next 50 kW (up to 60 kW). Maximum incentive $97,500 or up to 50% of project costs (whichever is lower).
2. Electricity will be sold directly to Burlington Electric Department at a rate of $0.20/kWh. There will be a separate meter and service, one bill for the building use that will be offset by the bill for BED credit.
Notes:
1. Structural design of carport system(s) will be required. This has been included in the estimated cost. 2. Installed cost includes all materials, labor, design, engineering…etc. based on observed market
conditions in Q2 2012. 3. *Estimated electrical use based on use from Southwick 2011 Data. 4. Financial analysis assumes BED utility 5. Electrical engineering/design of interconnection required (included in est. cost)

UVM Campus Renewable Energy Feasibility Study Parking Lot: University Heights North Lot Report Date: 7/4/2012 By: Jack Lehrecke Parking Lot: University Heights North Lot Address: University Heights Burlington, VT Aerial Photo:

UVM Campus Renewable Energy Feasibility Study Parking Lot: University Heights North Lot
* Measurements are approximate and include all required spacing * Carport calculation requires a minimum of 20 contiguous spots * Flat roof assumes 10’ setbacks per OSHA * Sloped roof assumes 4’ setback per building code (may vary)
Total Parking Spaces: 51 Installation Type: Carport Tilt Angle: 10° Orientation: SW/SE Approximate DC Watts: 51,000 Solar PV System Size: 51.0kW Basis of Design Equipment: Solaire Generation ‘Solaris’ system or similar Sharp 250W Mono Solar Modules PVP 50kW Powered Solar PV Inverter Cooper Crouse Hinds Disconnecting, Surge Protection Combiner Boxes Total $/watt: $6.47 Estimated Installed Cost: $330,000 (rounded to nearest $10,000) Payback (with no incentives): 28.1 years Payback (with incentives): 22 years Adjacent Building Annual Electrical Usage: 640,000kWh Solar System Annual Output: 58,650 kWh % offset: 9.16% Applicable Incentives A detailed summary of applicable incentives is included
1. Vermont Small Scale Renewable Energy Incentive Program: $2.25/watt DC up to 10 kW, $1.50/W DC for next 50 kW (up to 60 kW). Maximum incentive $97,500 or up to 50% of project costs (whichever is lower).
2. Burlington Electric Department feed in tariff purchases PV produced power at 0.20 $/kWh, the offset calculation compares this power, which is fed directly into the grid, against the adjacent structure’s utility demand.
Installation Type DC Watts per
Unit
1. Roof Mount Ballasted Flat
8 sqft
2. Roof Mount Sloped 11.5 sqft 3. Ground Mount 5 sqft 4. Carport 1000 Parking
space

UVM Campus Renewable Energy Feasibility Study Parking Lot: University Heights North Lot Notes:
1. Installed cost includes all materials, labor, design, engineering…etc. based on observed market conditions in Q2 2012.
2. Estimated electrical use based on use from University Heights North1 alone 3. Financial analysis assumes BED utility 4. Electrical engineering/design of interconnection required (included in est.
cost) 5. Some of the southern parking spaces may be shaded by the adjacent building 6. Utility rate assumes an annual increase of 3%

UVM Campus Renewable Energy Feasibility Study Parking Lot: University Heights South West Lot Report Date: 7/4/2012 By: Jack Lehrecke Parking Lot: University Heights South West Lot Address: University Heights Burlington, VT Aerial Photo:

UVM Campus Renewable Energy Feasibility Study Parking Lot: University Heights South West Lot
* Measurements are approximate and include all required spacing * Carport calculation requires a minimum of 20 contiguous spots * Flat roof assumes 10’ setbacks per OSHA * Sloped roof assumes 4’ setback per building code (may vary)
Total Parking Spaces: 17 Installation Type: Carport Tilt Angle: 10° Orientation: SW/SE Approximate DC Watts: 17,000 Solar PV System Size: 17.0kW Basis of Design Equipment: Solaire Generation ‘Solaris’ system or similar Sharp 250W Mono Solar Modules 2x SMA 8000 Powered Solar PV Inverters Cooper Crouse Hinds Disconnecting, Surge Protection Combiner Boxes Total $/watt: $7.06 Estimated Installed Cost: $120,000 (rounded to nearest $10,000) Payback (with no incentives): 30.7 years Payback (with incentives): 26 years Adjacent Building Annual Electrical Usage: 375,000kWh Solar System Annual Output: 19,550 kWh % offset: 5.21% Applicable Incentives A detailed summary of applicable incentives is included
1. Vermont Small Scale Renewable Energy Incentive Program: $2.25/watt DC up to 10 kW, $1.50/W DC for next 50 kW (up to 60 kW). Maximum incentive $97,500 or up to 50% of project costs (whichever is lower).
2. Burlington Electric Department feed in tariff purchases PV produced power at 0.20 $/kWh, the offset calculation compares this power, which is fed directly into the grid, against the adjacent structure’s utility demand.
Installation Type DC Watts per
Unit
1. Roof Mount Ballasted Flat
8 sqft
2. Roof Mount Sloped 11.5 sqft 3. Ground Mount 5 sqft 4. Carport 1000 Parking
space

UVM Campus Renewable Energy Feasibility Study Parking Lot: University Heights South West Lot Notes:
1. Installed cost includes all materials, labor, design, engineering…etc. based on observed market conditions in Q2 2012.
2. Estimated electrical use based on use from University Heights South 2&3 alone 3. Financial analysis assumes BED utility 4. Electrical engineering/design of interconnection required (included in est.
cost) 5. Utility rate assumes an annual increase of 3%
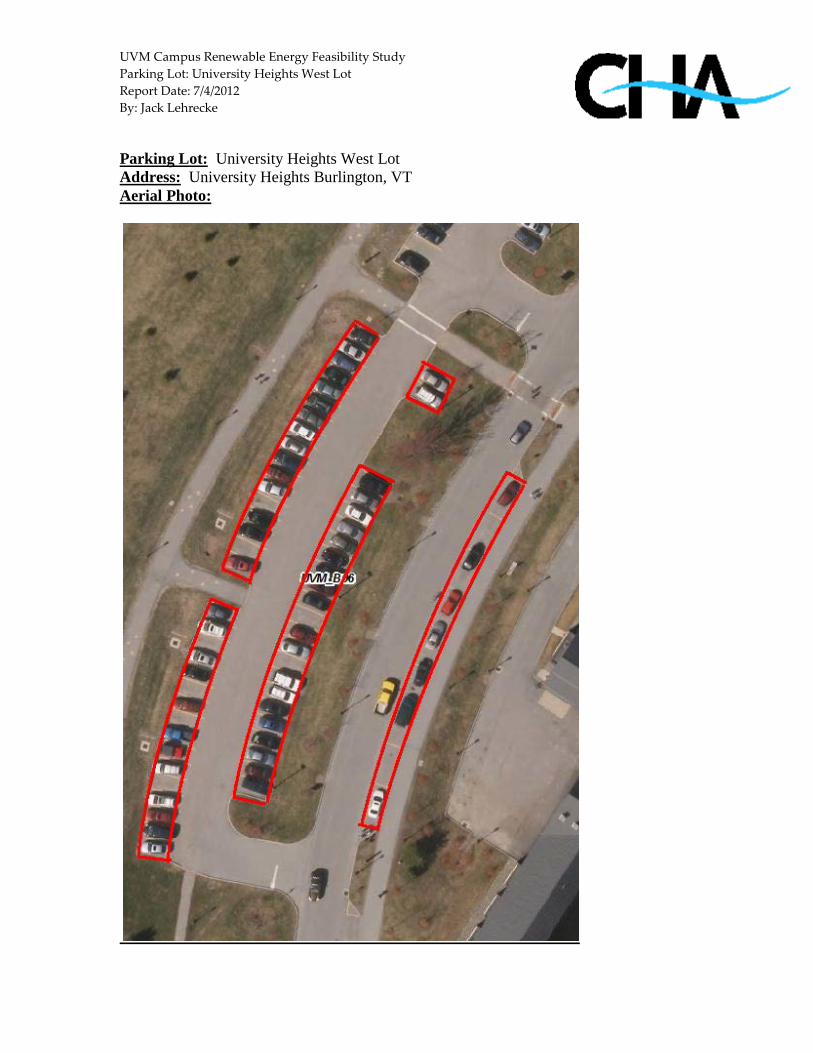
UVM Campus Renewable Energy Feasibility Study Parking Lot: University Heights West Lot Report Date: 7/4/2012 By: Jack Lehrecke Parking Lot: University Heights West Lot Address: University Heights Burlington, VT Aerial Photo:

UVM Campus Renewable Energy Feasibility Study Parking Lot: University Heights West Lot
* Measurements are approximate and include all required spacing * Carport calculation requires a minimum of 20 contiguous spots * Flat roof assumes 10’ setbacks per OSHA * Sloped roof assumes 4’ setback per building code (may vary)
Total Parking Spaces: 65 Installation Type: Carport Tilt Angle: 10° Orientation: SW/SE Approximate DC Watts: 65,000 Solar PV System Size: 65.0kW Basis of Design Equipment: Solaire Generation ‘Solaris’ system or similar Sharp 250W Mono Solar Modules PVP 50 kW Powered Solar PV Inverter Cooper Crouse Hinds Disconnecting, Surge Protection Combiner Boxes Total $/watt: $6.15 Estimated Installed Cost: $400,000 (rounded to nearest $10,000) Payback (with no incentives): 26.8 years Payback (with incentives): 21 years Adjacent Building Annual Electrical Usage: 375,000kWh Solar System Annual Output: 74,750 kWh % offset: 19.93% Applicable Incentives A detailed summary of applicable incentives is included
1. Vermont Small Scale Renewable Energy Incentive Program: $2.25/watt DC up to 10 kW, $1.50/W DC for next 50 kW (up to 60 kW). Maximum incentive $97,500 or up to 50% of project costs (whichever is lower).
2. Burlington Electric Department feed in tariff purchases PV produced power at 0.20 $/kWh, the offset calculation compares this power, which is fed directly into the grid, against the adjacent structure’s utility demand.
Installation Type DC Watts per
Unit
1. Roof Mount Ballasted Flat
8 sqft
2. Roof Mount Sloped 11.5 sqft 3. Ground Mount 5 sqft 4. Carport 1000 Parking
space

UVM Campus Renewable Energy Feasibility Study Parking Lot: University Heights West Lot Notes:
1. Installed cost includes all materials, labor, design, engineering…etc. based on observed market conditions in Q2 2012.
2. Estimated electrical use based on use from University Heights South 2&3 alone 3. Financial analysis assumes BED utility 4. Electrical engineering/design of interconnection required (included in est.
cost) 5. Utility rate assumes an annual increase of 3%

UVM Campus Renewable Energy Feasibility Study Lot: West of Waterman 85 S. Prospect St., Burlington VT Visit Date: 7/11/2012 By: Rich Smith
Parking Lot: West of Waterman Address: 85 S. Prospect St., Burlington VT Aerial Photo:
Total Parking Spaces: 115 Installation Type: Carport

UVM Campus Renewable Energy Feasibility Study Lot: West of Waterman 85 S. Prospect St., Burlington VT
Tilt Angle: 10 degrees Orientation: 40 – South, 75 – East/West Approximate DC Watts: 115,000 Solar PV System Size: 115kW Basis of Design Equipment: Solaire Generation ‘Solaris’ System or similar Sharp 250W Module 1x PVP 100kW Solar PV Inverter Cooper Crouse Hinds Disconnecting, Surge Protection Combiner Boxes Total $/watt: $5.76 Estimated Installed Cost: $660,000 (rounded to nearest $10,000) Payback (with no incentives): 25.3 years Payback (with incentives): 20 years Adjacent Building Annual Electrical Usage: 1,493,713 kWh* Solar System Annual Output: 130,500kWh % offset: 8.74% Applicable Incentives A detailed summary of applicable incentives is included
1. Vermont Small Scale Renewable Energy Incentive Program: $2.25/watt DC up to 10 kW, $1.50/W DC for next 50 kW (up to 60 kW). Maximum incentive $97,500 or up to 50% of project costs (whichever is lower).
2. Electricity will be sold directly to Burlington Electric Department at a rate of $0.20/kWh. There will be a separate meter and service, one bill for the building use that will be offset by the bill for BED credit.
Notes:
1. Structural design of carport system(s) will be required. This has been included in the estimated cost. 2. Installed cost includes all materials, labor, design, engineering…etc. based on observed market
conditions in Q2 2012. 3. *Estimated electrical use based on use from Waterman Building 2011 Data. 4. Financial analysis assumes BED utility 5. Electrical engineering/design of interconnection required (included in est. cost)

UVM Campus Renewable Energy Feasibility Study Building: Library Research Annex & IMF 280-282 East Ave. Burlington VT. Visit Date: 7/05/2012 By: Rich Smith Building: Library Research Annex & IMF Address: 280-282 East Ave., Burlington VT Aerial Photo:

UVM Campus Renewable Energy Feasibility Study Building: Library Research Annex & IMF 280-282 East Ave. Burlington VT.
* Measurements are approximate and include all required spacing * Carport calculation requires a minimum of 20 contiguous spots * Flat roof assumes 10’ setbacks per OSHA * Sloped roof assumes 4’ setback per building code (may vary)
Total Roof Space: 15,688 sqft Useable Roof Space: 12,088 sqft Installation Type: 1 Tilt Angle: 10 Degrees Orientation: 180 Degrees Approximate DC Watts: 96,704 Solar PV System Size: 96.7kW Basis of Design Equipment: Sharp 250W Mono Solar Modules Sunlink Ballasted Racking System 1x PV 100kW Solar PV Inverter Cooper Crouse Hinds Disconnecting, Surge Protection Combiner Boxes Total $/watt: $4.74 Estimated Installed Cost: $459,000.00 (rounded to nearest $10,000) Payback (with no incentives): 19.8 years Payback (with incentives): 15 years Building Annual Electrical Usage: 342,504kWh (estimated from 2011 Data) Solar System Annual Output: 116,045kW % offset: 33.78% Applicable Incentives A detailed summary of applicable incentives is included
1. Vermont Small Scale Renewable Energy Incentive Program: $2.25/watt DC up to 10 kW, $1.50/W DC for next 50 kW (up to 60 kW). Maximum incentive $97,500 or up to 50% of project costs (whichever is lower).
2. Electricity will be sold directly to Burlington Electric Department at a rate of $0.20/kWh. There will be a separate meter and service, one bill for the building use that will be offset by the bill for BED credit.
Installation Type DC Watts per
Unit
1. Roof Mount Ballasted Flat
8 sqft
2. Roof Mount Sloped 11.5 sqft 3. Ground Mount 5 sqft 4. Carport 1000 Parking space

UVM Campus Renewable Energy Feasibility Study Building: Library Research Annex & IMF 280-282 East Ave. Burlington VT.
Notes:
1. Structural analysis of the roof for ability to support the proposed solar PV system will be required. This should be coordinated with the structural engineer’s ballast requirement calculations. These have been included in the estimated cost.
2. Installed cost includes all materials, labor, design, engineering…etc. based on observed market conditions in Q2 2012.
3. Financial analysis assumes BED utility
4. Electrical engineering/design of interconnection required (included in est. cost)
5. Roof substrate is assumed to be EPDM Rubber or similar and fully adhered.
6. Roof conditions should be field verified and confirmed to be OK for installation. Coordinate with manufacturer to ensure continuation of warranty if applicable.
7. Avoid roof top fixtures and other roof obstructions.

UVM Campus Renewable Energy Feasibility Study Building: Police Services & UVM Rescue 284 East Ave. Burlington VT. Visit Date: 7/05/2012 By: Rich Smith Building: Police Services & UVM Rescue Address: 284 East Ave., Burlington VT Aerial Photo:

UVM Campus Renewable Energy Feasibility Study Building: Police Services & UVM Rescue 284 East Ave. Burlington VT.
* Measurements are approximate and include all required spacing * Carport calculation requires a minimum of 20 contiguous spots * Flat roof assumes 10’ setbacks per OSHA * Sloped roof assumes 4’ setback per building code (may vary)
Total Roof Space: 11,268 sqft Useable Roof Space: 8,630 sqft Installation Type: 1 Tilt Angle: 10 Degrees Orientation: 180 Degrees Approximate DC Watts: 69,040 Solar PV System Size: 69kW Basis of Design Equipment: Sharp 250W Mono Solar Modules Sunlink Ballasted Racking System 1x PV 75kW Solar PV Inverter Cooper Crouse Hinds Disconnecting, Surge Protection Combiner Boxes Total $/watt: $4.95 Estimated Installed Cost: $342,000.00 (rounded to nearest $10,000) Payback (with no incentives): 20.5 years Payback (with incentives): 14 years Building Annual Electrical Usage: 202,380kWh (estimated from 2011 Data) Solar System Annual Output: 82,848kW % offset: 40,94% Applicable Incentives A detailed summary of applicable incentives is included
1. Vermont Small Scale Renewable Energy Incentive Program: $2.25/watt DC up to 10 kW, $1.50/W DC for next 50 kW (up to 60 kW). Maximum incentive $97,500 or up to 50% of project costs (whichever is lower).
2. Electricity will be sold directly to Burlington Electric Department at a rate of $0.20/kWh. There will be a separate meter and service, one bill for the building use that will be offset by the bill for BED credit.
Installation Type DC Watts per
Unit
1. Roof Mount Ballasted Flat
8 sqft
2. Roof Mount Sloped 11.5 sqft 3. Ground Mount 5 sqft 4. Carport 1000 Parking space

UVM Campus Renewable Energy Feasibility Study Building: Police Services & UVM Rescue 284 East Ave. Burlington VT.
Notes:
1. Structural analysis of the roof for ability to support the proposed solar PV system will be required. This should be coordinated with the structural engineer’s ballast requirement calculations. These have been included in the estimated cost.
2. Installed cost includes all materials, labor, design, engineering…etc. based on observed market conditions in Q2 2012.
3. Financial analysis assumes BED utility
4. Electrical engineering/design of interconnection required (included in est. cost)
5. Roof substrate is assumed to be EPDM Rubber or similar and fully adhered.
6. Roof conditions should be field verified and confirmed to be OK for installation. Coordinate with manufacturer to ensure continuation of warranty if applicable.
7. Avoid roof top fixtures and other roof obstructions.

UVM Campus Renewable Energy Feasibility Study Building: 725 Bio Research Garage 657 Spear St., Burlington VT. Visit Date: 6/06/2012 By: Rich Smith Building: BRC Garage Address: 657 Spear St., Burlington VT Aerial Photo:

UVM Campus Renewable Energy Feasibility Study Building: 725 Bio Research Garage 657 Spear St., Burlington VT.
* Measurements are approximate and include all required spacing * Carport calculation requires a minimum of 20 contiguous spots * Flat roof assumes 10’ setbacks per OSHA * Sloped roof assumes 4’ setback per building code (may vary)
Total Roof Space: 1,110 sqft Useable Roof Space: 712 sqft Installation Type: 2 Tilt Angle: 30 Degrees Orientation: 180 Degrees Approximate DC Watts: 8,188 Solar PV System Size: 8.18kW Basis of Design Equipment: Sharp 250W Mono Solar Modules Unirac Racking System 1x SMA 8000W Solar PV Inverter Cooper Crouse Hinds Disconnecting, Surge Protection Combiner Boxes Total $/watt: $7.03 Estimated Installed Cost: $60,000.00 (rounded to nearest $10,000) Payback (with no incentives): 30.5 years Payback (with incentives): 15 years Building Annual Electrical Usage: 9,457kWh (estimated from 2011 Data) Solar System Annual Output: 9,826kW % offset: 103.9% Applicable Incentives A detailed summary of applicable incentives is included
1. Vermont Small Scale Renewable Energy Incentive Program: $2.25/watt DC up to 10 kW, $1.50/W DC for next 50 kW (up to 60 kW). Maximum incentive $97,500 or up to 50% of project costs (whichever is lower).
2. Green Mountain Power net meter tariff, commercial customers will receive $0.06 per kWh.
Installation Type DC Watts per
Unit
1. Roof Mount Ballasted Flat
8 sqft
2. Roof Mount Sloped 11.5 sqft 3. Ground Mount 5 sqft 4. Carport 1000 Parking space

UVM Campus Renewable Energy Feasibility Study Building: 725 Bio Research Garage 657 Spear St., Burlington VT.
Notes:
1. Structural analysis of the roof for ability to support the proposed solar PV system will be required. These have been included in the estimated cost.
2. Installed cost includes all materials, labor, design, engineering…etc. based on observed market conditions in Q2 2012.
3. Financial analysis assumes GMP utility
4. Electrical engineering/design of interconnection required (included in est. cost)
5. Roof substrate is assumed to be Corrugate Metal
6. Roof conditions should be field verified and confirmed to be OK for installation. Coordinate with manufacturer to ensure continuation of warranty if applicable.
7. Avoid roof top fixtures and other roof obstructions.

UVM Campus Renewable Energy Feasibility Study Building: 70 South Williams St – 70 South Williams St, Burlington VT Visit Date: 6/22/2012 By: Ryan Darlow
* Measurements are approximate and include all required spacing * Carport calculation requires a minimum of 20 contiguous spots * Flat roof assumes 10’ setbacks per OSHA * Sloped roof assumes 4’ setback per building code (may vary)
Building: 70 South Williams St Address: 70 South Williams St, Burlington, VT Aerial Photo:
Total Roof Space: 6,000 sqft Useable Roof Space: 800 sqft Installation Type: 2 Roof Slope: 10° Orientation: 90° East, 270° West Approximate DC Watts: 9,200 Solar PV System Size: 9.2kW Basis of Design Equipment: Sharp 250W Mono Solar Modules Unirac Racking System 1x SMA 10000 W Solar PV Inverter Cooper Crouse Hinds Disconnecting, Surge Protection Combiner Boxes Total $/watt: $6.52 Estimated Installed Cost: $60,000 (rounded to nearest $10,000) Payback (with no incentives): 27.2 years
Installation Type DC Watts per
Unit
1. Roof Mount Ballasted Flat
8 sqft
2. Roof Mount Sloped 11.5 sqft 3. Ground Mount 5 sqft 4. Carport 1000 Parking
space

UVM Campus Renewable Energy Feasibility Study Building: 70 South Williams St – 70 South Williams St, Burlington VT Payback: 24 years Building Annual Electrical Usage: 11,764 kWh Solar System Annual Output: 11,040 kWh % offset: 93.85% Applicable Incentives A detailed summary of applicable incentives is included
1. Vermont Small Scale Renewable Energy Incentive Program: $2.25/watt DC up to 10 kW, $1.50/W DC for next 50 kW (up to 60 kW). Maximum incentive $97,500 or up to 50% of project costs (whichever is lower).
2. Burlington Electric Department metering for $.20 per kWh. Notes:
1. Structural analysis of the roof for ability to support the proposed solar PV system will be required. This should be coordinated with the structural engineer’s ballast requirement calculations. These have been included in the estimated cost.
2. Installed cost includes all materials, labor, design, engineering…etc. based on observed market conditions in Q2 2012.
3. Financial analysis assumes BED utility 4. Electrical engineering/design of interconnection required (included in est. cost) 5. Roof substrate is assumed to be shingles 6. Roof conditions should be field verified and confirmed to be OK for installation. Coordinate with
manufacturer to ensure continuation 7. Roof shingles should be replaced prior to installation of PV. 8. Electricity will be directly fed into the grid, so the building offset is the equivalent amount 9. There is a large tree to the south that could cause significant shading 10. There are several large chimneys on the roof that need to be considered for shading

UVM Campus Renewable Energy Feasibility Study Building: Admissions Visitor Center- 184 South Prospect St, Burlington VT Visit Date: 7/2/2012 By: Ryan Darlow Building: Admissions Visitor Center Address: 184 South Prospect St, Burlington, VT Aerial Photo:
East Roof
West Roof

UVM Campus Renewable Energy Feasibility Study Building: Admissions Visitor Center- 184 South Prospect St, Burlington VT
* Measurements are approximate and include all required spacing * Carport calculation requires a minimum of 20 contiguous spots * Flat roof assumes 10’ setbacks per OSHA * Sloped roof assumes 4’ setback per building code (may vary)
Total Roof Space: 770 sqft Useable Roof Space: 390 sqft Installation Type: 2 Roof Slope: East 40°, West 45° Orientation: 90° East 270° West Approximate DC Watts: 4485 Solar PV System Size: 4.49kW Basis of Design Equipment: Sharp 250W Mono Solar Modules Unirac Racking System 1x SMA 5000 W Solar PV Inverter Cooper Crouse Hinds Disconnecting, Surge Protection Combiner Boxes Market Conditions $/watt: $8.92 Estimated Installed Cost: $40,000 (rounded to nearest $10,000) Payback (with no incentives): 37.2 years Payback: 49 years Building Annual Electrical Usage: 47,074 kWh Solar System Annual Output: 5382 kWh % offset: 11.43% Applicable Incentives A detailed summary of applicable incentives is included
1. Vermont Small Scale Renewable Energy Incentive Program: $2.25/watt DC up to 10 kW, $1.50/W DC for next 50 kW (up to 60 kW). Maximum incentive $97,500 or up to 50% of project costs (whichever is lower).
2. Burlington Electric Department metering for $.20 per kWh.
Installation Type DC Watts per
Unit
1. Roof Mount Ballasted Flat
8 sqft
2. Roof Mount Sloped 11.5 sqft 3. Ground Mount 5 sqft 4. Carport 1000 Parking
space

UVM Campus Renewable Energy Feasibility Study Building: Admissions Visitor Center- 184 South Prospect St, Burlington VT Notes:
1. Structural analysis of the roof for ability to support the proposed solar PV system will be required. This should be coordinated with the structural engineer’s ballast requirement calculations. These have been included in the estimated cost.
2. Installed cost includes all materials, labor, design, engineering…etc. based on observed market conditions in Q2 2012.
3. Financial analysis assumes BED utility 4. Electrical engineering/design of interconnection required (included in est. cost) 5. Roof substrate is assumed to be Standing Seem Metal 6. Roof conditions should be field verified and confirmed to be OK for installation. Coordinate with
manufacturer to ensure continuation 7. Electricity will be directly fed into the grid, so the building offset is the equivalent amount

UVM Campus Renewable Energy Feasibility Study Building: Aiken Center- 81 Carrigan Dr, Burlington VT Visit Date: 6/13/2012 By: Ryan Darlow
* Measurements are approximate and include all required spacing * Carport calculation requires a minimum of 20 contiguous spots * Flat roof assumes 10’ setbacks per OSHA * Sloped roof assumes 4’ setback per building code (may vary)
Building: Aiken Center Address: 81 Carrigan Dr, Burlington VT Aerial Photo:
Total Roof Space: 10,350 sqft Useable Roof Space: 4,900 sqft Installation Type: 1 Tilt Angle: 10° Orientation: 175° South Approximate DC Watts: 39,200 Solar PV System Size: 39.2kW
Installation Type DC Watts per
Unit
1. Roof Mount Ballasted Flat
8 sqft
2. Roof Mount Sloped 11.5 sqft 3. Ground Mount 5 sqft 4. Carport 1000 Parking
space

UVM Campus Renewable Energy Feasibility Study Building: Aiken Center- 81 Carrigan Dr, Burlington VT Basis of Design Equipment: Sharp 250W Mono Solar Modules SunLink Ballasted Racking System 1x 30 kW PV Powered Solar PV Inverter Cooper Crouse Hinds Disconnecting, Surge Protection Combiner Boxes Total $/watt: $5.36 Estimated Installed Cost: $210,000 (rounded to nearest $10,000) Payback (with no incentives): 22.3 years Payback: 17 years Building Annual Electrical Usage: 254,550 kWh** Solar System Annual Output: 47,040 kWh % offset: 18.48% Applicable Incentives A detailed summary of applicable incentives is included
1. Vermont Small Scale Renewable Energy Incentive Program: $2.25/watt DC up to 10 kW, $1.50/W DC for next 50 kW (up to 60 kW). Maximum incentive $97,500 or up to 50% of project costs (whichever is lower).
2. Burlington Electric Department metering for $.20 per kWh.
Notes: 1. Structural analysis of the roof for ability to support the proposed solar PV system will be required.
This should be coordinated with the structural engineer’s ballast requirement calculations. These have been included in the estimated cost.
2. Installed cost includes all materials, labor, design, engineering…etc. based on observed market conditions in Q2 2012.
3. Financial analysis assumes BED utility 4. Electrical engineering/design of interconnection required (included in est. cost) 5. Roof substrate is assumed to be EPDM rubber 6. Roof conditions should be field verified and confirmed to be OK for installation. Coordinate with
manufacturer to ensure continuation 7. **Estimated value based on existing installed solar PV accounting for 25% of building’s demand 8. Assumed solarium roof is not building edge, however space was not accounted for when calculating
roof space available for PV installation 9. Large portions of the roof are green roof spaces for research 10. Electricity will be directly fed into the grid, so the building offset is the equivalent amount
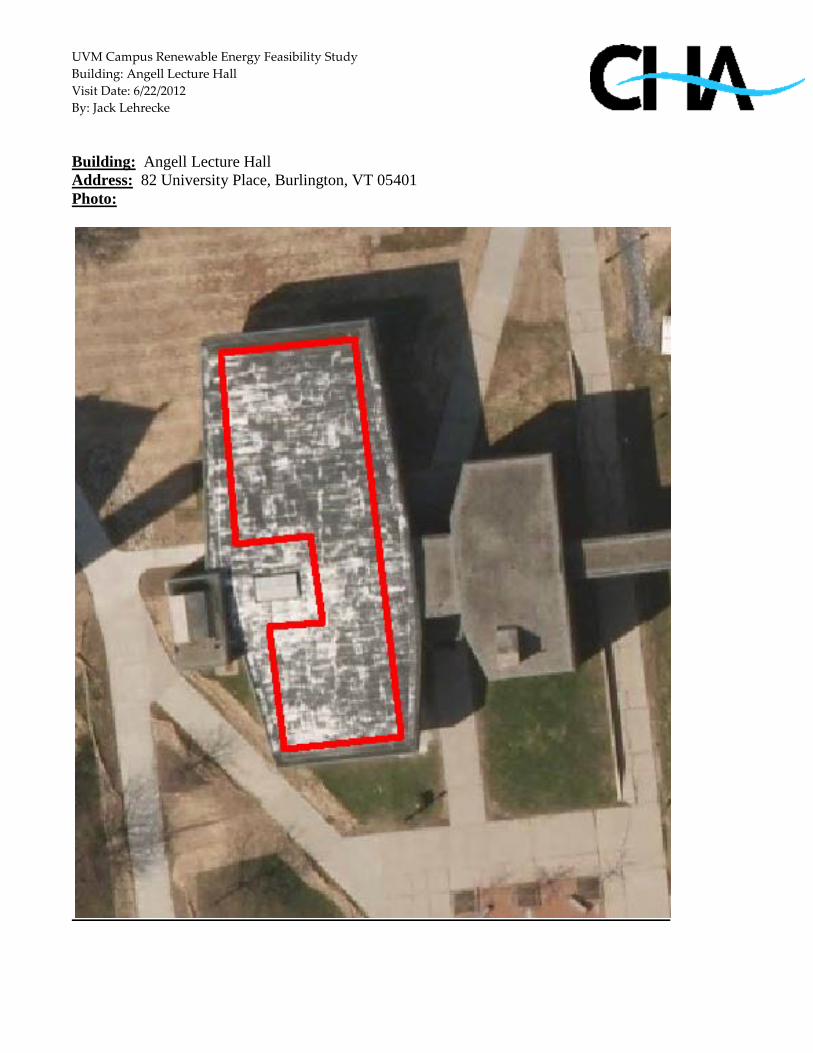
UVM Campus Renewable Energy Feasibility Study Building: Angell Lecture Hall Visit Date: 6/22/2012 By: Jack Lehrecke Building: Angell Lecture Hall Address: 82 University Place, Burlington, VT 05401 Photo:

UVM Campus Renewable Energy Feasibility Study Building: Angell Lecture Hall
* Measurements are approximate and include all required spacing * Carport calculation requires a minimum of 20 contiguous spots * Flat roof assumes 10’ setbacks per OSHA * Sloped roof assumes 4’ setback per building code (may vary)
Total Roof Space: 6,875 sqft Useable Roof Space: 4,475 sqft Installation Type: 1 Roof Slope: Flat (0°) Orientation: 170° (South) Approximate DC Watts: 35,800 Solar PV System Size: 35.8kW Basis of Design Equipment: Sharp 250W Mono Solar Modules SunLink Ballasted Racking System PVP 30 kW Solar PV Inverter Cooper Crouse Hinds Disconnecting, Surge Protection Combiner Boxes Total $/watt: $5.59 Estimated Installed Cost: $200,000 (rounded to nearest $10,000) Payback (with no incentives): 23.3 years Payback: 19 years Building Annual Electrical Usage: 150,000 kWh Solar System Annual Output: 42,960 kWh % offset: % 28.64 Applicable Incentives A detailed summary of applicable incentives is included
1. Vermont Small Scale Renewable Energy Incentive Program: $2.25/watt DC up to 10 kW, $1.50/W DC for next 50 kW (up to 60 kW). Maximum incentive $97,500 or up to 50% of project costs (whichever is lower).
2. Burlington Electric Department feed in tariff purchases PV produced power at 0.20 $/kWh, the offset calculation compares this power, which is fed directly into the grid, against the adjacent structure’s utility demand.
Installation Type DC Watts per
Unit
1. Roof Mount Ballasted Flat
8 sqft
2. Roof Mount Sloped 11.5 sqft 3. Ground Mount 5 sqft 4. Carport 1000 Parking
space

UVM Campus Renewable Energy Feasibility Study Building: Angell Lecture Hall Notes:
1. Structural analysis of the roof for ability to support the proposed solar PV system will be required. This should be coordinated with the structural engineer’s ballast requirement calculations. These have been included in the estimated cost.
2. Installed cost includes all materials, labor, design, engineering…etc. based on observed market conditions in Q2 2012.
3. Financial analysis assumes BED utility 4. Electrical engineering/design of interconnection required (included in est. cost) 5. Roof substrate is assumed to be EPDM Rubber or similar and fully adhered. 6. Roof conditions should be field verified and confirmed to be OK for installation. Coordinate
with manufacturer to ensure continuation

UVM Campus Renewable Energy Feasibility Study Building: Animal Care 492 Spear St., Burlington VT Visit Date: 6/29/2012 By: Rich Smith Building: Animal Care Address: 492 Spear St., Burlington VT Aerial Photo:

UVM Campus Renewable Energy Feasibility Study Building: Animal Care 492 Spear St., Burlington VT
* Measurements are approximate and include all required spacing * Carport calculation requires a minimum of 20 contiguous spots * Flat roof assumes 10’ setbacks per OSHA * Sloped roof assumes 4’ setback per building code (may vary)
Total Roof Space: 1,890 sqft Useable Roof Space: 880 sqft Installation Type: 2 Tilt Angle: 30 Degrees Orientation: 180 Degrees Approximate DC Watts: 10120 Solar PV System Size: 10.12kW Basis of Design Equipment: Sharp 250W Mono Solar Modules Unirac Racking System 1x SMA 10000 W Solar PV Inverter Cooper Crouse Hinds Disconnecting, Surge Protection Combiner Boxes Total $/watt: $6.74 Estimated Installed Cost: $69,000.00 (rounded to nearest $10,000) Payback (with no incentives): 30.3 years Payback (with incentives): 19 years Building Annual Electrical Usage: 665,800kWh (2011 Data of Miller Farm Research Complex) Solar System Annual Output: 12,144kW % offset: 1.82% Applicable Incentives A detailed summary of applicable incentives is included
1. Vermont Small Scale Renewable Energy Incentive Program: $2.25/watt DC up to 10 kW, $1.50/W DC for next 50 kW (up to 60 kW). Maximum incentive $97,500 or up to 50% of project costs (whichever is lower).
2. Green Mountain Power net meter tariff, commercial customers will receive $0.06 per kWh.
Installation Type DC Watts per
Unit
1. Roof Mount Ballasted Flat
8 sqft
2. Roof Mount Sloped 11.5 sqft 3. Ground Mount 5 sqft 4. Carport 1000 Parking space

UVM Campus Renewable Energy Feasibility Study Building: Animal Care 492 Spear St., Burlington VT
Notes: 1. Structural analysis of the roof for ability to support the proposed solar PV system will be required.
These have been included in the estimated cost.
2. Installed cost includes all materials, labor, design, engineering…etc. based on observed market conditions in Q2 2012.
3. Financial analysis assumes GMP utility
4. Electrical engineering/design of interconnection required (included in est. cost)
5. Roof substrate is Corrugated Metal.
6. Roof conditions should be field verified and confirmed to be OK for installation. Coordinate with manufacturer to ensure continuation of warranty if applicable.
7. Avoid roof top fixtures and other roof obstructions.

UVM Campus Renewable Energy Feasibility Study Building: Benedict House- 31 South Prospect St, Burlington VT Visit Date: 6/21/2012 By: Ryan Darlow Building: Benedict House Address: 31 South Prospect St, Burlington, VT Aerial Photo:

UVM Campus Renewable Energy Feasibility Study Building: Benedict House- 31 South Prospect St, Burlington VT
* Measurements are approximate and include all required spacing * Carport calculation requires a minimum of 20 contiguous spots * Flat roof assumes 10’ setbacks per OSHA * Sloped roof assumes 4’ setback per building code (may vary)
Total Roof Space: 850 sqft Useable Roof Space: 450 sqft Installation Type: 2 Roof Slope: 20° Orientation: 80° East, 170° South Approximate DC Watts: 5,175 Solar PV System Size: 5.2 kW Basis of Design Equipment: Sharp 250W Mono Solar Modules Unirac Racking System SMA 6000 W Solar PV Inverter Cooper Crouse Hinds Disconnecting, Surge Protection Combiner Boxes Market Conditions $/watt: $7.73 Estimated Installed Cost: $40,000 (rounded to nearest $10,000) Payback (with no incentives): 32.2 years Payback: 39 years Building Annual Electrical Usage: 19,617 kWh Solar System Annual Output: 6210 kWh % offset: 31.66% Applicable Incentives A detailed summary of applicable incentives is included
1. Vermont Small Scale Renewable Energy Incentive Program: $2.25/watt DC up to 10 kW, $1.50/W DC for next 50 kW (up to 60 kW). Maximum incentive $97,500 or up to 50% of project costs (whichever is lower).
2. Burlington Electric Department metering for $.20 per kWh.
Installation Type DC Watts per
Unit
1. Roof Mount Ballasted Flat
8 sqft
2. Roof Mount Sloped 11.5 sqft 3. Ground Mount 5 sqft 4. Carport 1000 Parking
space

UVM Campus Renewable Energy Feasibility Study Building: Benedict House- 31 South Prospect St, Burlington VT Notes:
1. Structural analysis of the roof for ability to support the proposed solar PV system will be required. This should be coordinated with the structural engineer’s ballast requirement calculations. These have been included in the estimated cost.
2. Installed cost includes all materials, labor, design, engineering…etc. based on observed market conditions in Q2 2012.
3. Financial analysis assumes BED utility 4. Electrical engineering/design of interconnection required (included in est. cost) 5. Roof substrate is assumed to be Shingles 6. Roof conditions should be field verified and confirmed to be OK for installation. Coordinate with
manufacturer to ensure continuation 7. Electricity will be directly fed into the grid, so the building offset is the equivalent amount

UVM Campus Renewable Energy Feasibility Study Building: Billings Lecture Hall- 17 University Place, Burlington VT Visit Date: 6/21/2012 By: Ryan Darlow Building: Billings Lecture Hall Address: 17 University Place, Burlington, VT Aerial Photo:

UVM Campus Renewable Energy Feasibility Study Building: Billings Lecture Hall- 17 University Place, Burlington VT
* Measurements are approximate and include all required spacing * Carport calculation requires a minimum of 20 contiguous spots * Flat roof assumes 10’ setbacks per OSHA * Sloped roof assumes 4’ setback per building code (may vary)
Total Roof Space: 8,580 sqft Useable Roof Space: 5,280 sqft Installation Type: 2 Roof Slope: 20° Orientation: 80° East, 260° West Approximate DC Watts: 60,720 Solar PV System Size: 60.7 kW Basis of Design Equipment: Sharp 250W Mono Solar Modules Unirac Racking System 1x 50 kW PV Powered Solar PV Inverter Cooper Crouse Hinds Disconnecting, Surge Protection Combiner Boxes Total $/watt: $5.11 Estimated Installed Cost: $310,000 (rounded to nearest $10,000) Payback (with no incentives): 21.3 years Payback: 16 years Building Annual Electrical Usage: 513,067 kWh Solar System Annual Output: 72,864 kWh % offset: 14.2 % Applicable Incentives A detailed summary of applicable incentives is included
1. Vermont Small Scale Renewable Energy Incentive Program: $2.25/watt DC up to 10 kW, $1.50/W DC for next 50 kW (up to 60 kW). Maximum incentive $97,500 or up to 50% of project costs (whichever is lower).
2. Burlington Electric Department metering for $.20 per kWh.
Installation Type DC Watts per
Unit
1. Roof Mount Ballasted Flat
8 sqft
2. Roof Mount Sloped 11.5 sqft 3. Ground Mount 5 sqft 4. Carport 1000 Parking
space

UVM Campus Renewable Energy Feasibility Study Building: Billings Lecture Hall- 17 University Place, Burlington VT Notes:
1. Structural analysis of the roof for ability to support the proposed solar PV system will be required. This should be coordinated with the structural engineer’s ballast requirement calculations. These have been included in the estimated cost.
2. Installed cost includes all materials, labor, design, engineering…etc. based on observed market conditions in Q2 2012.
3. Financial analysis assumes BED utility 4. Electrical engineering/design of interconnection required (included in est. cost) 5. Roof substrate is assumed to be Shingles 6. Roof conditions should be field verified and confirmed to be OK for installation. Coordinate with
manufacturer to ensure continuation 7. Annual electrical usage based data is from the Billings Center, which the lecture hall is connected to
via the Ira Allen Chapel 8. The building is partially shaded by Ira Allen Chapel and trees, assumed that only 75% of the total
roof area will have panels installed 9. Electricity will be directly fed into the grid, so the building offset is the equivalent amount

UVM Campus Renewable Energy Feasibility Study Building: Bio Research Complex Visit Date: 7/3/2012 By: Jack Lehrecke Building: Ungulate Facility Address: 665 Spear Street, Burlington, VT Aerial Photo:

UVM Campus Renewable Energy Feasibility Study Building: Bio Research Complex
* Measurements are approximate and include all required spacing * Carport calculation requires a minimum of 20 contiguous spots * Flat roof assumes 10’ setbacks per OSHA * Sloped roof assumes 4’ setback per building code (may vary)
Total Roof Space: 16,900 sqft Useable Roof Space: 12,400 sqft Installation Type: 2 Roof Slope: 20°, 20°, 35° * Orientation: 260°, 80°, 170° Approximate DC Watts: 142,600 Solar PV System Size: 142.6kW Basis of Design Equipment: Sharp 250W Mono Solar Modules Unirac Racking System 1xPVP 100kW and 1xPVP 35kW Solar PV Inverters Cooper Crouse Hinds Disconnecting, Surge Protection Combiner Boxes Total $/watt: $4.56 Estimated Installed Cost: $650,000 (rounded to nearest $10,000) Payback (with no incentives): 20 years Payback: 14 years Building Annual Electrical Usage: 170,000 kWh Solar System Annual Output: 171,120 kWh % offset: % 100.66 Applicable Incentives A detailed summary of applicable incentives is included
1. Vermont Small Scale Renewable Energy Incentive Program: $2.25/watt DC up to 10 kW, $1.50/W DC for next 50 kW (up to 60 kW). Maximum incentive $97,500 or up to 50% of project costs (whichever is lower).
2. Green Mountain Power net metering bonus: Allows for an additional payment of $0.06/kWh produced by the system.
Installation Type DC Watts per
Unit
1. Roof Mount Ballasted Flat
8 sqft
2. Roof Mount Sloped 11.5 sqft 3. Ground Mount 5 sqft 4. Carport 1000 Parking
space

UVM Campus Renewable Energy Feasibility Study Building: Bio Research Complex Notes:
1. Structural analysis of the roof for ability to support the proposed solar PV system will be required. This should be coordinated with the structural engineer’s ballast requirement calculations. These have been included in the estimated cost.
2. Installed cost includes all materials, labor, design, engineering…etc. based on observed market conditions in Q2 2012.
3. Financial analysis assumes GMP utility 4. Electrical engineering/design of interconnection required (included in est. cost) 5. Roof substrate is assumed to be corrugated metal 6. Roof conditions should be field verified and confirmed to be OK for installation. Coordinate
with manufacturer to ensure continuation 7. *Slope varies slightly for the south facing roof which appears to be at a 35° angle whereas all
east and west facing slopes are 20° 8. There are multiple buildings near this one within the complex that could possible receive excess
power generated through net metering

UVM Campus Renewable Energy Feasibility Study Building: Blundell House 342 S. Prospect St. Burlington VT. Visit Date: 7/02/2012 By: Rich Smith Building: Blundell House Address: 342 S. Prospect St., Burlington VT Aerial Photo:

UVM Campus Renewable Energy Feasibility Study Building: Blundell House 342 S. Prospect St. Burlington VT.
* Measurements are approximate and include all required spacing * Carport calculation requires a minimum of 20 contiguous spots * Flat roof assumes 10’ setbacks per OSHA * Sloped roof assumes 4’ setback per building code (may vary)
Total Roof Space: 3.300 sqft Useable Roof Space: 1,800 sqft Installation Type: 1 Tilt Angle: 10 Degrees Orientation: 180 Degrees Approximate DC Watts: 14400 Solar PV System Size: 14.4kW Basis of Design Equipment: Sharp 250W Mono Solar Modules Sunlink Ballasted Racking System 2x SMA 7000 W Solar PV Inverters Cooper Crouse Hinds Disconnecting, Surge Protection Combiner Boxes Total $/watt: $6.33 Estimated Installed Cost: $92,000.00 (rounded to nearest $10,000) Payback (with no incentives): 26 years Payback (with incentives): 14 years Building Annual Electrical Usage: 32,339kWh (estimated from 2011 Data) Solar System Annual Output: 17,280kW % offset: 53.43% Applicable Incentives A detailed summary of applicable incentives is included
1. Vermont Small Scale Renewable Energy Incentive Program: $2.25/watt DC up to 10 kW, $1.50/W DC for next 50 kW (up to 60 kW). Maximum incentive $97,500 or up to 50% of project costs (whichever is lower).
2. Electricity will be sold directly to Burlington Electric Department at a rate of $0.20/kWh. There will be a separate meter and service, one bill for the building use that will be offset by the bill for BED credit.
Installation Type DC Watts per
Unit
1. Roof Mount Ballasted Flat
8 sqft
2. Roof Mount Sloped 11.5 sqft 3. Ground Mount 5 sqft 4. Carport 1000 Parking space

UVM Campus Renewable Energy Feasibility Study Building: Blundell House 342 S. Prospect St. Burlington VT.
Notes: 1. Structural analysis of the roof for ability to support the proposed solar PV system will be required.
This should be coordinated with the structural engineer’s ballast requirement calculations. These have been included in the estimated cost.
2. Installed cost includes all materials, labor, design, engineering…etc. based on observed market conditions in Q2 2012.
3. Financial analysis assumes BED utility
4. Electrical engineering/design of interconnection required (included in est. cost)
5. Roof substrate is assumed to be EPDM Rubber or similar and fully adhered.
6. Roof conditions should be field verified and confirmed to be OK for installation. Coordinate with manufacturer to ensure continuation of warranty if applicable.
7. Avoid roof top fixtures and other roof obstructions.

UVM Campus Renewable Energy Feasibility Study Building: Buckham-Chittenden Hall Visit Date: 6/22/2012 By: Jack Lehrecke Building: Buckham-Chittenden Hall Address: Central Campus, Burlington, VT 05401 Photo:

UVM Campus Renewable Energy Feasibility Study Building: Buckham-Chittenden Hall
* Measurements are approximate and include all required spacing * Carport calculation requires a minimum of 20 contiguous spots * Flat roof assumes 10’ setbacks per OSHA * Sloped roof assumes 4’ setback per building code (may vary)
Total Roof Space: 16,000 sqft Useable Roof Space: 13,200 sqft Installation Type: 1 Roof Slope: Flat (0°) Orientation: 170° (South) Approximate DC Watts: 105,600 Solar PV System Size: 105.6kW Basis of Design Equipment: Sharp 250W Mono Solar Modules SunLink Ballasted Racking System PVP 100 kW Solar PV Inverter Cooper Crouse Hinds Disconnecting, Surge Protection Combiner Boxes Total $/watt: $4.55 Estimated Installed Cost: $480,000 (rounded to nearest $10,000) Payback (with no incentives): 18.9 years Payback: 16 years Building Annual Electrical Usage: 485,000 kWh Solar System Annual Output: 126,720 kWh % offset: % 26.13 Applicable Incentives A detailed summary of applicable incentives is included
1. Vermont Small Scale Renewable Energy Incentive Program: $2.25/watt DC up to 10 kW, $1.50/W DC for next 50 kW (up to 60 kW). Maximum incentive $97,500 or up to 50% of project costs (whichever is lower).
2. Burlington Electric Department feed in tariff purchases PV produced power at 0.20 $/kWh, the offset calculation compares this power, which is fed directly into the grid, against the adjacent structure’s utility demand.
Installation Type DC Watts per
Unit
1. Roof Mount Ballasted Flat
8 sqft
2. Roof Mount Sloped 11.5 sqft 3. Ground Mount 5 sqft 4. Carport 1000 Parking
space

UVM Campus Renewable Energy Feasibility Study Building: Buckham-Chittenden Hall Notes:
1. Structural analysis of the roof for ability to support the proposed solar PV system will be required. This should be coordinated with the structural engineer’s ballast requirement calculations. These have been included in the estimated cost.
2. Installed cost includes all materials, labor, design, engineering…etc. based on observed market conditions in Q2 2012.
3. Financial analysis assumes BED utility 4. Electrical engineering/design of interconnection required (included in est. cost) 5. Roof substrate is assumed to be EPDM Rubber or similar and fully adhered. 6. Roof conditions should be field verified and confirmed to be OK for installation. Coordinate
with manufacturer to ensure continuation 7. Energy offset calculations assume equal power consumption between the facilities in the C-B-W
complex.

UVM Campus Renewable Energy Feasibility Study Building: Canopies 490 Spear St., Burlington VT Visit Date: 6/21/2012 By: Rich Smith Building: Canopies Address: 490 Spear St., Burlington VT Aerial Photo:

UVM Campus Renewable Energy Feasibility Study Building: Canopies 490 Spear St., Burlington VT
* Measurements are approximate and include all required spacing * Carport calculation requires a minimum of 20 contiguous spots * Flat roof assumes 10’ setbacks per OSHA * Sloped roof assumes 4’ setback per building code (may vary)
Total Roof Space: 3,000 sqft Useable Roof Space: 2,400 sqft Installation Type: 2 Tilt Angle: 5 Degrees Orientation: 45,270 Degrees Approximate DC Watts: 27600 Solar PV System Size: 27.6kW Basis of Design Equipment: Sharp 250W Mono Solar Modules Unirac Racking System 3x SM 10000 W Solar PV Inverters Cooper Crouse Hinds Disconnecting, Surge Protection Combiner Boxes Total $/watt: $5.78 Estimated Installed Cost: $160,000.00 (rounded to nearest $10,000) Payback (with no incentives): 25.4 years Payback (with incentives): 15 years Building Annual Electrical Usage: 665,800kWh (2011 Data of Miller Farm Research Complex) Solar System Annual Output: 33,120kW % offset: 4.97% Applicable Incentives A detailed summary of applicable incentives is included
1. Vermont Small Scale Renewable Energy Incentive Program: $2.25/watt DC up to 10 kW, $1.50/W DC for next 50 kW (up to 60 kW). Maximum incentive $97,500 or up to 50% of project costs (whichever is lower).
2. Green Mountain Power net meter tariff, commercial customers will receive $0.06 per kWh.
Installation Type DC Watts per
Unit
1. Roof Mount Ballasted Flat
8 sqft
2. Roof Mount Sloped 11.5 sqft 3. Ground Mount 5 sqft 4. Carport 1000 Parking space

UVM Campus Renewable Energy Feasibility Study Building: Canopies 490 Spear St., Burlington VT
Notes: 1. Structural analysis of the roof for ability to support the proposed solar PV system will be required.
These have been included in the estimated cost. Reconstruction is most likely necessary.
2. Installed cost includes all materials, labor, design, engineering…etc. based on observed market conditions in Q2 2012.
3. Financial analysis assumes GMP utility
4. Electrical engineering/design of interconnection required (included in est. cost)
5. Roof substrate is Corrugated Metal.
6. Roof conditions should be field verified and confirmed to be OK for installation. Coordinate with manufacturer to ensure continuation of warranty if applicable.
7. Avoid roof top fixtures and other roof obstructions.

UVM Campus Renewable Energy Feasibility Study Building: Centennial Field Visitors Field House 287 Colchester Ave.., Burlington VT. Visit Date: 7/16/2012 By: Rich Smith Building: Centennial Field Visitors Field House Address: 287 Colchester Ave., Burlington VT Aerial Photo:

UVM Campus Renewable Energy Feasibility Study Building: Centennial Field Visitors Field House 287 Colchester Ave.., Burlington VT.
* Measurements are approximate and include all required spacing * Carport calculation requires a minimum of 20 contiguous spots * Flat roof assumes 10’ setbacks per OSHA * Sloped roof assumes 4’ setback per building code (may vary)
Total Roof Space: 713sqft Useable Roof Space: 426 sqft Installation Type: 2 Tilt Angle: 30 Degrees Orientation: 90,180 Degrees Approximate DC Watts: 4,899 Solar PV System Size: 4.9kW Basis of Design Equipment: Sharp 250W Mono Solar Modules Unirac Racking System 1x SMA 5000W Solar PV Inverter Cooper Crouse Hinds Disconnecting, Surge Protection Combiner Boxes Total $/watt: $8.05 Estimated Installed Cost: $40,000.00 (rounded to nearest $10,000) Payback (with no incentives): 34 years Payback (with incentives): 14 years Building Annual Electrical Usage: 3,680kWh (estimated from 2011 Data) Solar System Annual Output: 5,878kW % offset: 159.75% Applicable Incentives A detailed summary of applicable incentives is included
1. Vermont Small Scale Renewable Energy Incentive Program: $2.25/watt DC up to 10 kW, $1.50/W DC for next 50 kW (up to 60 kW). Maximum incentive $97,500 or up to 50% of project costs (whichever is lower).
Installation Type DC Watts per
Unit
1. Roof Mount Ballasted Flat
8 sqft
2. Roof Mount Sloped 11.5 sqft 3. Ground Mount 5 sqft 4. Carport 1000 Parking space

UVM Campus Renewable Energy Feasibility Study Building: Centennial Field Visitors Field House 287 Colchester Ave.., Burlington VT.
2. Electricity will be sold directly to Burlington Electric Department at a rate of $0.20/kWh. There will be a separate meter and service, one bill for the building use that will be offset by the bill for BED credit.
Notes:
1. Structural analysis of the roof for ability to support the proposed solar PV system will be required. These have been included in the estimated cost.
2. Installed cost includes all materials, labor, design, engineering…etc. based on observed market conditions in Q2 2012.
3. Financial analysis assumes BED utility
4. Electrical engineering/design of interconnection required (included in est. cost)
5. Roof substrate is assumed to be Corrugate Metal
6. Roof conditions should be field verified and confirmed to be OK for installation. Coordinate with manufacturer to ensure continuation of warranty if applicable.
7. Avoid roof top fixtures and other roof obstructions.

UVM Campus Renewable Energy Feasibility Study Building: Christie Hall- 436 South Prospect St, Burlington VT Visit Date: 7/2/2012 By: Ryan Darlow Building: Christie Hall Address: 436 South Prospect St, Burlington, VT Aerial Photo:

UVM Campus Renewable Energy Feasibility Study Building: Christie Hall- 436 South Prospect St, Burlington VT
* Measurements are approximate and include all required spacing * Carport calculation requires a minimum of 20 contiguous spots * Flat roof assumes 10’ setbacks per OSHA * Sloped roof assumes 4’ setback per building code (may vary)
Total Roof Space: 8700 sqft Useable Roof Space: 2000 sqft Installation Type: 1 Roof Slope: Flat (0°) Orientation: 175° South Approximate DC Watts: 16,000 Solar PV System Size: 16kW Basis of Design Equipment: Sharp 250W Mono Solar Modules SunLink Ballasted Racking System 2x SMA 8000 W Solar PV Inverters Cooper Crouse Hinds Disconnecting, Surge Protection Combiner Boxes Total $/watt: $6.25 Estimated Installed Cost: $100,000 (rounded to nearest $10,000) Payback (with no incentives): 26.0 years Payback: 21 years Building Annual Electrical Usage: 948,818 kWh* Solar System Annual Output: 19200 kWh % offset: 2.02 % Applicable Incentives A detailed summary of applicable incentives is included
1. Vermont Small Scale Renewable Energy Incentive Program: $2.25/watt DC up to 10 kW, $1.50/W DC for next 50 kW (up to 60 kW). Maximum incentive $97,500 or up to 50% of project costs (whichever is lower).
2. Burlington Electric Department metering for $.20 per kWh.
Installation Type DC Watts per
Unit
1. Roof Mount Ballasted Flat
8 sqft
2. Roof Mount Sloped 11.5 sqft 3. Ground Mount 5 sqft 4. Carport 1000 Parking
space

UVM Campus Renewable Energy Feasibility Study Building: Christie Hall- 436 South Prospect St, Burlington VT Notes:
1. Structural analysis of the roof for ability to support the proposed solar PV system will be required. This should be coordinated with the structural engineer’s ballast requirement calculations. These have been included in the estimated cost.
2. Installed cost includes all materials, labor, design, engineering…etc. based on observed market conditions in Q2 2012.
3. Financial analysis assumes BED utility 4. Electrical engineering/design of interconnection required (included in est. cost) 5. Roof substrate is assumed to be EPDM rubber 6. Roof conditions should be field verified and confirmed to be OK for installation. Coordinate with
manufacturer to ensure continuation 7. Electricity will be directly fed into the grid, so the building offset is the equivalent amount 8. Assume 40% of roof is usable for solar after OSHA restrictions are applied 9. *Annual electric usage is for the entire Christie Wright Patterson Complex

UVM Campus Renewable Energy Feasibility Study Building: Coolidge Hall- 402 South Prospect St, Burlington VT Visit Date: 7/2/2012 By: Ryan Darlow
* Measurements are approximate and include all required spacing * Carport calculation requires a minimum of 20 contiguous spots * Flat roof assumes 10’ setbacks per OSHA * Sloped roof assumes 4’ setback per building code (may vary)
Building: Coolidge Hall Address: 402 South Prospect St, Burlington, VT Aerial Photo:
Total Roof Space: 6192 sqft Useable Roof Space: 2650 sqft Installation Type: 1 Roof Slope: Flat (0°) Orientation: 175° South Approximate DC Watts: 21,200 Solar PV System Size: 21.2kW
Installation Type DC Watts per
Unit
1. Roof Mount Ballasted Flat
8 sqft
2. Roof Mount Sloped 11.5 sqft 3. Ground Mount 5 sqft 4. Carport 1000 Parking
space

UVM Campus Renewable Energy Feasibility Study Building: Coolidge Hall- 402 South Prospect St, Burlington VT Basis of Design Equipment: Sharp 250W Mono Solar Modules SunLink Ballasted Racking System 3x SMA 7000 W Solar PV Inverters Cooper Crouse Hinds Disconnecting, Surge Protection Combiner Boxes Total $/watt: $6.13 Estimated Installed Cost: $130,000 (rounded to nearest $10,000) Payback (with no incentives): 25.6 years Payback: 20 years Building Annual Electrical Usage: 177,918 kWh Solar System Annual Output: 25440 kWh % offset: 14.3% Applicable Incentives A detailed summary of applicable incentives is included
1. Vermont Small Scale Renewable Energy Incentive Program: $2.25/watt DC up to 10 kW, $1.50/W DC for next 50 kW (up to 60 kW). Maximum incentive $97,500 or up to 50% of project costs (whichever is lower).
2. Burlington Electric Department metering for $.20 per kWh. Notes:
1. Structural analysis of the roof for ability to support the proposed solar PV system will be required. This should be coordinated with the structural engineer’s ballast requirement calculations. These have been included in the estimated cost.
2. Installed cost includes all materials, labor, design, engineering…etc. based on observed market conditions in Q2 2012.
3. Financial analysis assumes BED utility 4. Electrical engineering/design of interconnection required (included in est. cost) 5. Roof substrate is assumed to be EPDM rubber 6. Roof conditions should be field verified and confirmed to be OK for installation. Coordinate with
manufacturer to ensure continuation 7. Electricity will be directly fed into the grid, so the building offset is the equivalent amount

UVM Campus Renewable Energy Feasibility Study Building: Cream Barn 490 Spear St., Burlington VT Visit Date: 6/21/2012 By: Rich Smith Building: Cream Barn Address: 490 Spear St., Burlington VT Aerial Photo:

UVM Campus Renewable Energy Feasibility Study Building: Cream Barn 490 Spear St., Burlington VT
* Measurements are approximate and include all required spacing * Carport calculation requires a minimum of 20 contiguous spots * Flat roof assumes 10’ setbacks per OSHA * Sloped roof assumes 4’ setback per building code (may vary)
Total Roof Space: 15,000 sqft Useable Roof Space: 7,200 sqft Installation Type: 2 Tilt Angle: 20,30,30 Degrees Orientation: 180,90,270 Degrees Approximate DC Watts: 82800 Solar PV System Size: 82.8kW Basis of Design Equipment: Sharp 250W Mono Solar Modules Unirac Racking System 1x 75kW PV Powered Solar PV Inverter Cooper Crouse Hinds Disconnecting, Surge Protection Combiner Boxes Total $/watt: $4.83 Estimated Installed Cost: $400,000.00 (rounded to nearest $10,000) Payback (with no incentives): 22 years Payback (with incentives): 13 years Building Annual Electrical Usage: 665,800kWh (2011 Data of Miller Farm Research Complex) Solar System Annual Output: 99,360kW % offset: 14.92% Applicable Incentives A detailed summary of applicable incentives is included
1. Vermont Small Scale Renewable Energy Incentive Program: $2.25/watt DC up to 10 kW, $1.50/W DC for next 50 kW (up to 60 kW). Maximum incentive $97,500 or up to 50% of project costs (whichever is lower).
2. Green Mountain Power net meter tariff, commercial customers will receive $0.06 per kWh.
Installation Type DC Watts per
Unit
1. Roof Mount Ballasted Flat
8 sqft
2. Roof Mount Sloped 11.5 sqft 3. Ground Mount 5 sqft 4. Carport 1000 Parking space

UVM Campus Renewable Energy Feasibility Study Building: Cream Barn 490 Spear St., Burlington VT
Notes: 1. Structural analysis of the roof for ability to support the proposed solar PV system will be required.
These have been included in the estimated cost.
2. Installed cost includes all materials, labor, design, engineering…etc. based on observed market conditions in Q2 2012.
3. Financial analysis assumes GMP utility
4. Electrical engineering/design of interconnection required (included in est. cost)
5. Roof substrate is Corrugated Metal.
6. Roof conditions should be field verified and confirmed to be OK for installation. Coordinate with manufacturer to ensure continuation of warranty if applicable.
7. Avoid roof top fixtures and other roof obstructions.
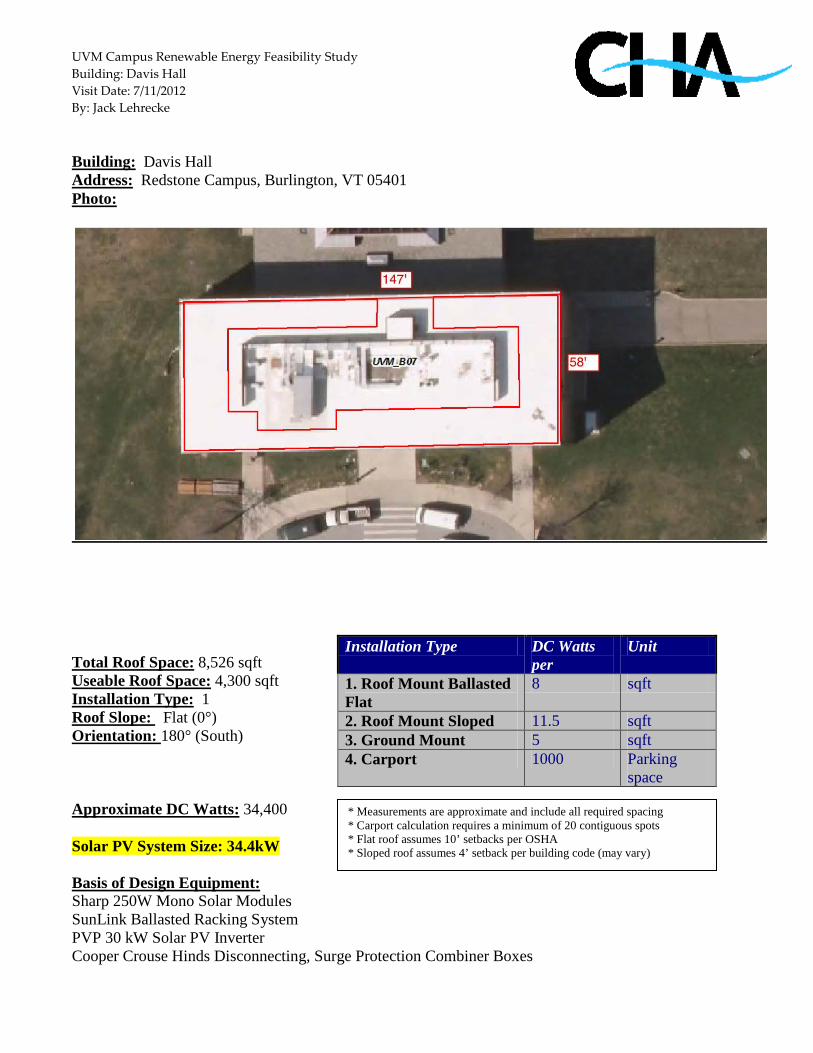
UVM Campus Renewable Energy Feasibility Study Building: Davis Hall Visit Date: 7/11/2012 By: Jack Lehrecke
* Measurements are approximate and include all required spacing * Carport calculation requires a minimum of 20 contiguous spots * Flat roof assumes 10’ setbacks per OSHA * Sloped roof assumes 4’ setback per building code (may vary)
Building: Davis Hall Address: Redstone Campus, Burlington, VT 05401 Photo:
Total Roof Space: 8,526 sqft Useable Roof Space: 4,300 sqft Installation Type: 1 Roof Slope: Flat (0°) Orientation: 180° (South) Approximate DC Watts: 34,400 Solar PV System Size: 34.4kW Basis of Design Equipment: Sharp 250W Mono Solar Modules SunLink Ballasted Racking System PVP 30 kW Solar PV Inverter Cooper Crouse Hinds Disconnecting, Surge Protection Combiner Boxes
Installation Type DC Watts per
Unit
1. Roof Mount Ballasted Flat
8 sqft
2. Roof Mount Sloped 11.5 sqft 3. Ground Mount 5 sqft 4. Carport 1000 Parking
space

UVM Campus Renewable Energy Feasibility Study Building: Davis Hall Total $/watt: $5.52 Estimated Installed Cost: $190,000 (rounded to nearest $10,000) Payback (with no incentives): 23 years Payback: 19 years Building Annual Electrical Usage: 267,000 kWh Solar System Annual Output: 41,280 kWh % offset: % 15.46 Applicable Incentives A detailed summary of applicable incentives is included
1. Vermont Small Scale Renewable Energy Incentive Program: $2.25/watt DC up to 10 kW, $1.50/W DC for next 50 kW (up to 60 kW). Maximum incentive $97,500 or up to 50% of project costs (whichever is lower).
2. Burlington Electric Department feed in tariff purchases PV produced power at 0.20 $/kWh, the offset calculation compares this power, which is fed directly into the grid, against the adjacent structure’s utility demand.
Notes:
1. Structural analysis of the roof for ability to support the proposed solar PV system will be required. This should be coordinated with the structural engineer’s ballast requirement calculations. These have been included in the estimated cost.
2. Installed cost includes all materials, labor, design, engineering…etc. based on observed market conditions in Q2 2012.
3. Financial analysis assumes BED utility 4. Electrical engineering/design of interconnection required (included in est. cost) 5. Roof substrate is assumed to be EPDM Rubber or similar and fully adhered. 6. Roof conditions should be field verified and confirmed to be OK for installation. Coordinate
with manufacturer to ensure continuation 7. Energy offset calculations assume equal power consumption between the facilities in the W-D-
W complex.

UVM Campus Renewable Energy Feasibility Study Building: Environmental Safety Facility- 667 Spear St, Burlington VT Visit Date: 6/22/2012 By: Ryan Darlow
* Measurements are approximate and include all required spacing * Carport calculation requires a minimum of 20 contiguous spots * Flat roof assumes 10’ setbacks per OSHA * Sloped roof assumes 4’ setback per building code (may vary)
Building: Environmental Safety Facility Address: 667 Spear St, Burlington, VT Aerial Photo:
Total Roof Space: 3,524 sqft Useable Roof Space: 2,210 sqft Installation Type: 2 Roof Slope: 20° Orientation: 165° South Approximate DC Watts: 25,415 Solar PV System Size: 25.4 kW Basis of Design Equipment: Sharp 250W Mono Solar Modules Unirac Racking System 3x SMA 8000 W Solar PV Inverters
Installation Type DC Watts per
Unit
1. Roof Mount Ballasted Flat
8 sqft
2. Roof Mount Sloped 11.5 sqft 3. Ground Mount 5 sqft 4. Carport 1000 Parking
space

UVM Campus Renewable Energy Feasibility Study Building: Environmental Safety Facility- 667 Spear St, Burlington VT Cooper Crouse Hinds Disconnecting, Surge Protection Combiner Boxes Total $/watt: $5.90 Estimated Installed Cost: $150,000 (rounded to nearest $10,000) Payback (with no incentives): 24.6 years Payback: 19 years Building Annual Electrical Usage: 108,880 kWh Solar System Annual Output: 30,498 kWh % offset: 28.01% Applicable Incentives A detailed summary of applicable incentives is included
1. Vermont Small Scale Renewable Energy Incentive Program: $2.25/watt DC up to 10 kW, $1.50/W DC for next 50 kW (up to 60 kW). Maximum incentive $97,500 or up to 50% of project costs (whichever is lower).
2. Burlington Electric Department metering for $.20 per kWh. Notes:
1. Structural analysis of the roof for ability to support the proposed solar PV system will be required. This should be coordinated with the structural engineer’s ballast requirement calculations. These have been included in the estimated cost.
2. Installed cost includes all materials, labor, design, engineering…etc. based on observed market conditions in Q2 2012.
3. Financial analysis assumes BED utility 4. Electrical engineering/design of interconnection required (included in est. cost) 5. Roof substrate is assumed to be standing seem metal 6. Roof conditions should be field verified and confirmed to be OK for installation. Coordinate with
manufacturer to ensure continuation 7. Electricity will be directly fed into the grid, so the building offset is the equivalent amount 8. Potential for 27 kW of ground mounted solar to East of the building, 3 panels in portrait * 37 rows of
panels- facing west (have space 25’ by 130’)

UVM Campus Renewable Energy Feasibility Study Building: 404 Farrell Hall -- 210 Colchester Ave, Burlington VT Visit Date: By: Building: 404 Farrell Hall Address: 210 Colchester Ave, Burlington VT Aerial Photo:

UVM Campus Renewable Energy Feasibility Study Building: 404 Farrell Hall -- 210 Colchester Ave, Burlington VT Visit Date: By:
* Measurements are approximate and include all required spacing * Carport calculation requires a minimum of 20 contiguous spots * Flat roof assumes 10’ setbacks per OSHA * Sloped roof assumes 4’ setback per building code (may vary)
Total Roof Space: 10,500sqft Useable Roof Space: 8,600sqft Installation Type: 2 Roof Slope: 30 Degrees Orientation: 160 Degrees Approximate DC Watts: 99,000 Solar PV System Size: 99kW Basis of Design Equipment: Sharp 250W Mono Solar Modules Unirac Solar Mount System 1x 100kW PV Powered Solar PV Inverter Cooper Crouse Hinds Disconnecting, Surge Protection Combiner Boxes Total $/watt: $4.73 Estimated Installed Cost: $470,000.00 (rounded to nearest $10,000) Payback (with no incentives): 20 years Payback (with incentives): 17 years Building Annual Electrical Usage: 223,785kWh (2011 Data) Solar System Annual Output: 118,266kW % offset: 52.86% Applicable Incentives A detailed summary of applicable incentives is included
1. Vermont Small Scale Renewable Energy Incentive Program: $2.25/watt DC up to 10 kW, $1.50/W DC for next 50 kW (up to 60 kW). Maximum incentive $97,500 or up to 50% of project costs (whichever is lower).
2. Electricity will be sold directly to Burlington Electric Department at a rate of $0.20/kWh. There will be a separate meter and service, one bill for the building use that will be offset by the bill for BED credit.
Installation Type DC Watts per Unit 1. Roof Mount Ballasted Flat 8 sqft 2. Roof Mount Sloped 11.5 sqft 3. Ground Mount 5 sqft 4. Carport 1000 Parking space

UVM Campus Renewable Energy Feasibility Study Building: 404 Farrell Hall -- 210 Colchester Ave, Burlington VT Visit Date: By: Notes:
1. Structural analysis of the roof for ability to support the proposed solar PV system will be required. This should be coordinated with the structural engineer’s ballast requirement calculations. These have been included in the estimated cost.
2. Installed cost includes all materials, labor, design, engineering…etc. based on observed market conditions in Q2 2012.
3. Financial analysis assumes BED utility 4. Electrical engineering/design of interconnection required (included in est. cost) 5. Roof substrate is assumed to be Standing Sheet Steel. 6. Roof conditions should be field verified and confirmed to be OK for installation. Coordinate with
manufacturer to ensure continuation of warranty if applicable. 7. Avoid snow guards and skylight roof obstructions. 8. Electricity Rate ($/kWh) assumes a 3% average annual increase.
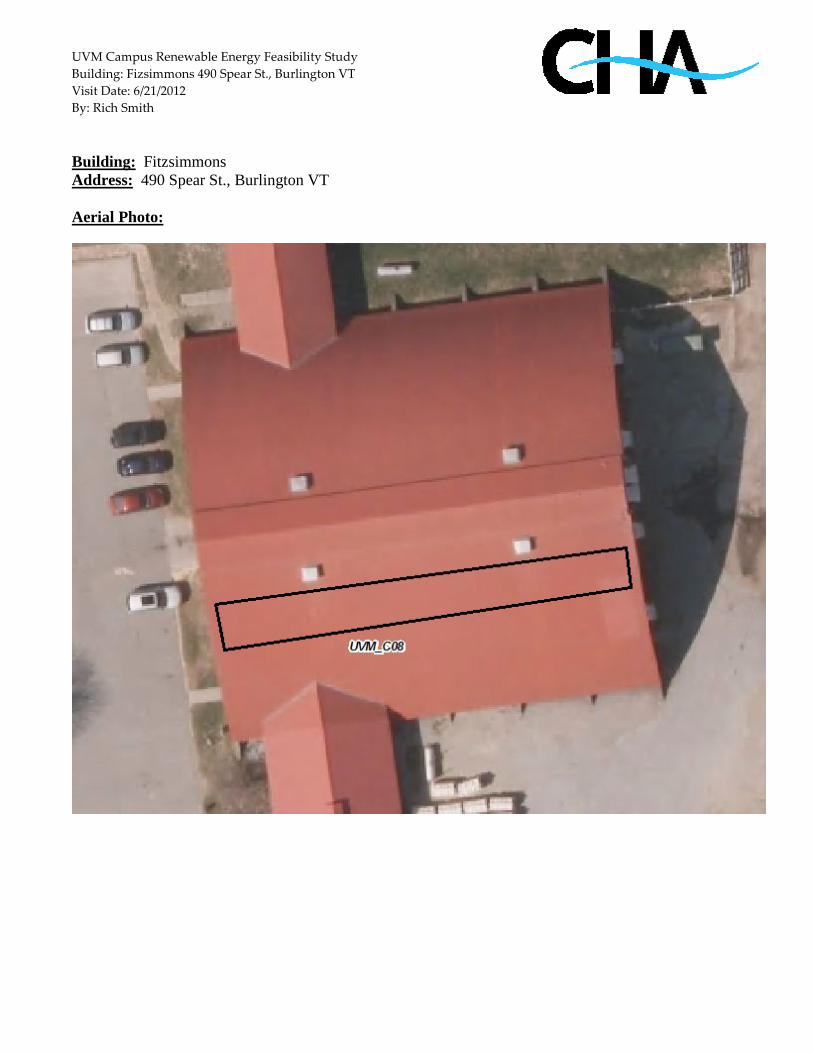
UVM Campus Renewable Energy Feasibility Study Building: Fizsimmons 490 Spear St., Burlington VT Visit Date: 6/21/2012 By: Rich Smith Building: Fitzsimmons Address: 490 Spear St., Burlington VT Aerial Photo:

UVM Campus Renewable Energy Feasibility Study Building: Fizsimmons 490 Spear St., Burlington VT
* Measurements are approximate and include all required spacing * Carport calculation requires a minimum of 20 contiguous spots * Flat roof assumes 10’ setbacks per OSHA * Sloped roof assumes 4’ setback per building code (may vary)
Total Roof Space: 15,000 sqft Useable Roof Space: 2,300 sqft Installation Type: 2 Tilt Angle: 30 Degrees Orientation: 180 Degrees Approximate DC Watts: 26450 Solar PV System Size: 26.5kW Basis of Design Equipment: Sharp 250W Mono Solar Modules Unirac Racking System 3x SM 10000 W Solar PV Inverter Cooper Crouse Hinds Disconnecting, Surge Protection Combiner Boxes Total $/watt: $5.38 Estimated Installed Cost: $150,000.00 (rounded to nearest $10,000) Payback (with no incentives): 25 years Payback (with incentives): 15 years Building Annual Electrical Usage: 665,800kWh (2011 Data of Miller Farm Research Complex) Solar System Annual Output: 31,740kW % offset: 4.77% Applicable Incentives A detailed summary of applicable incentives is included
1. Vermont Small Scale Renewable Energy Incentive Program: $2.25/watt DC up to 10 kW, $1.50/W DC for next 50 kW (up to 60 kW). Maximum incentive $97,500 or up to 50% of project costs (whichever is lower).
2. Green Mountain Power net meter tariff, commercial customers will receive $0.06 per kWh.
Installation Type DC Watts per
Unit
1. Roof Mount Ballasted Flat
8 sqft
2. Roof Mount Sloped 11.5 sqft 3. Ground Mount 5 sqft 4. Carport 1000 Parking space

UVM Campus Renewable Energy Feasibility Study Building: Fizsimmons 490 Spear St., Burlington VT
Notes: 1. Structural analysis of the roof for ability to support the proposed solar PV system will be required.
These have been included in the estimated cost.
2. Installed cost includes all materials, labor, design, engineering…etc. based on observed market conditions in Q2 2012.
3. Financial analysis assumes GMP utility
4. Electrical engineering/design of interconnection required (included in est. cost)
5. Roof substrate is Corrugated Metal.
6. Roof conditions should be field verified and confirmed to be OK for installation. Coordinate with manufacturer to ensure continuation of warranty if applicable.
7. Avoid roof top fixtures and other roof obstructions.

UVM Campus Renewable Energy Feasibility Study Building: Robert Hull Fleming Museum- 61 Colchester Ave, Burlington VT Visit Date: 7/11/2012 By: Ryan Darlow
* Measurements are approximate and include all required spacing * Carport calculation requires a minimum of 20 contiguous spots * Flat roof assumes 10’ setbacks per OSHA * Sloped roof assumes 4’ setback per building code (may vary)
Building: Robert Hull Fleming Museum Address: 61 Colchester Ave, Burlington, VT Aerial Photo:
Total Roof Space: 2,250 sqft Useable Roof Space: 1,000 sqft Installation Type: 1 Roof Slope: Flat (0°) Orientation: 165° South Approximate DC Watts: 8,000
Installation Type DC Watts per
Unit
1. Roof Mount Ballasted Flat
8 sqft
2. Roof Mount Sloped 11.5 sqft 3. Ground Mount 5 sqft 4. Carport 1000 Parking
space

UVM Campus Renewable Energy Feasibility Study Building: Robert Hull Fleming Museum- 61 Colchester Ave, Burlington VT Solar PV System Size: 8kW Basis of Design Equipment: Sharp 250W Mono Solar Modules SunLink Ballasted Racking System 1 x SMA 8000 W Solar PV Inverter Cooper Crouse Hinds Disconnecting, Surge Protection Combiner Boxes Total $/watt: $7.50 Estimated Installed Cost: $60,000 (rounded to nearest $10,000) Payback (with no incentives): 31.3 years Payback: 28 years Building Annual Electrical Usage: 465,552 kWh Solar System Annual Output: 9,600 kWh % offset: 2.02 % Applicable Incentives A detailed summary of applicable incentives is included
1. Vermont Small Scale Renewable Energy Incentive Program: $2.25/watt DC up to 10 kW, $1.50/W DC for next 50 kW (up to 60 kW). Maximum incentive $97,500 or up to 50% of project costs (whichever is lower).
2. Burlington Electric Department metering for $.20 per kWh. Notes:
1. Structural analysis of the roof for ability to support the proposed solar PV system will be required. This should be coordinated with the structural engineer’s ballast requirement calculations. These have been included in the estimated cost.
2. Installed cost includes all materials, labor, design, engineering…etc. based on observed market conditions in Q2 2012.
3. Financial analysis assumes BED utility 4. Electrical engineering/design of interconnection required (included in est. cost) 5. Roof substrate is assumed to be EPDM rubber 6. Roof conditions should be field verified and confirmed to be OK for installation. Coordinate with
manufacturer to ensure continuation 7. Electricity will be directly fed into the grid, so the building offset is the equivalent amount

UVM Campus Renewable Energy Feasibility Study Building: Free-Stall Facility and Milking Parlor 490 Spear St., Burlington VT Visit Date: 6/21/2012 By: Rich Smith Building: Free-Stall Facility and Milking Parlor Address: 490 Spear St., Burlington VT Aerial Photo:
UVM Campus Renewable Energy Feasibility Study Building: Free-Stall Facility and Milking Parlor 490 Spear St., Burlington VT
* Measurements are approximate and include all required spacing * Carport calculation requires a minimum of 20 contiguous spots * Flat roof assumes 10’ setbacks per OSHA * Sloped roof assumes 4’ setback per building code (may vary)
Total Roof Space: 10,000 sqft Useable Roof Space: 4,735 sqft Installation Type: 2 Tilt Angle: 20 Degrees Orientation: 180 Degrees Approximate DC Watts: 54452.5 Solar PV System Size: 55kW Basis of Design Equipment: Sharp 250W Mono Solar Modules Unirac Racking System 1x 50kW PV Powered Solar PV Inverter Cooper Crouse Hinds Disconnecting, Surge Protection Combiner Boxes Total $/watt: $5.15 Estimated Installed Cost: $280,000.00 (rounded to nearest $10,000) Payback (with no incentives): 23 years Payback (with incentives): 13 years Building Annual Electrical Usage: 665,800kWh (2011 Data of Miller Farm Research Complex) Solar System Annual Output: 65,343kW % offset: 9.81% Applicable Incentives A detailed summary of applicable incentives is included
1. Vermont Small Scale Renewable Energy Incentive Program: $2.25/watt DC up to 10 kW, $1.50/W DC for next 50 kW (up to 60 kW). Maximum incentive $97,500 or up to 50% of project costs (whichever is lower).
2. Green Mountain Power net meter tariff, commercial customers will receive $0.06 per kWh.
Installation Type DC Watts per
Unit
1. Roof Mount Ballasted Flat
8 sqft
2. Roof Mount Sloped 11.5 sqft 3. Ground Mount 5 sqft 4. Carport 1000 Parking space

UVM Campus Renewable Energy Feasibility Study Building: Free-Stall Facility and Milking Parlor 490 Spear St., Burlington VT
Notes: 1. Structural analysis of the roof for ability to support the proposed solar PV system will be required.
These have been included in the estimated cost.
2. Installed cost includes all materials, labor, design, engineering…etc. based on observed market conditions in Q2 2012.
3. Financial analysis assumes GMP utility
4. Electrical engineering/design of interconnection required (included in est. cost)
5. Roof substrate is Corrugated Metal.
6. Roof conditions should be field verified and confirmed to be OK for installation. Coordinate with manufacturer to ensure continuation of warranty if applicable.
7. Avoid roof top fixtures and other roof obstructions.

UVM Campus Renewable Energy Feasibility Study Building: Gucciardi Fitness Center 147 Spear St, Burlington VT Visit Date: 6/13/2012 By: Ryan Darlow
* Measurements are approximate and include all required spacing * Carport calculation requires a minimum of 20 contiguous spots * Flat roof assumes 10’ setbacks per OSHA * Sloped roof assumes 4’ setback per building code (may vary)
Building: Gucciardi Fitness Center Address: 147 Spear St, Burlington, VT Aerial Photo:
Total Roof Space: 8,600 sqft Useable Roof Space: 4,920 sqft Installation Type: 1 Tilt Angle: 10° Orientation: 170° South Approximate DC Watts: 39,360 Solar PV System Size: 39.4kW Basis of Design Equipment: Sharp 250W Mono Solar Modules SunLink Ballasted Racking System 1x 30 kW PV Powered PV Inverter Cooper Crouse Hinds Disconnecting, Surge Protection Combiner Boxes Total $/watt: $5.59 Estimated Installed Cost: $220,000 (rounded to nearest $10,000) Payback (with no incentives): 23.3 years Payback: 18 years Building Annual Electrical Usage: 3,655,385 kWh *
Installation Type DC Watts per
Unit
1. Roof Mount Ballasted Flat
8 sqft
2. Roof Mount Sloped 11.5 sqft 3. Ground Mount 5 sqft 4. Carport 1000 Parking
space

UVM Campus Renewable Energy Feasibility Study Building: Gucciardi Fitness Center- 147 Spear St, Burlington VT Solar System Annual Output: 47232 kWh % offset: 1.29 % Applicable Incentives A detailed summary of applicable incentives is included
1. Vermont Small Scale Renewable Energy Incentive Program: $2.25/watt DC up to 10 kW, $1.50/W DC for next 50 kW (up to 60 kW). Maximum incentive $97,500 or up to 50% of project costs (whichever is lower).
2. Burlington Electric Department metering for $.20 per kWh.
Notes:
1. Structural analysis of the roof for ability to support the proposed solar PV system will be required. This should be coordinated with the structural engineer’s ballast requirement calculations. These have been included in the estimated cost.
2. Installed cost includes all materials, labor, design, engineering…etc. based on observed market conditions in Q2 2012.
3. Financial analysis assumes BED utility 4. Electrical engineering/design of interconnection required (included in est. cost) 5. Roof substrate is assumed to be EPDM rubber 6. Roof conditions should be field verified and confirmed to be OK for installation. Coordinate with
manufacturer to ensure continuation 7. *Annual electric usage includes fieldhouse and gymnasium 8. Offset is calculated for total annual electric usage 9. Electricity will be directly fed into the grid, so the building offset is the equivalent amount

UVM Campus Renewable Energy Feasibility Study Building: Gutterson Fieldhouse: 97 Spear St Burlington, VT Visit Date: 6/7/2012 By: Ryan Darlow
* Measurements are approximate and include all required spacing * Carport calculation requires a minimum of 20 contiguous spots * Flat roof assumes 10’ setbacks per OSHA * Sloped roof assumes 4’ setback per building code (may vary)
Building: Gutterson Fieldhouse Address: 97 Spear St Burlington, VT 05405 Aerial Photo:
Total Roof Space: 95,000sqft Useable Roof Space: 35,000sqft Installation Type: 2 Roof Slope: Curved Orientation: 170° South Approximate DC Watts: 402,500 Solar PV System Size: 402.5kW
Installation Type DC Watts per
Unit
1. Roof Mount Ballasted Flat
8 sqft
2. Roof Mount Sloped 11.5 sqft 3. Ground Mount 5 sqft 4. Carport 1000 Parking
space

Basis of Design Equipment: Sharp 250W Mono Solar Modules Unirac Racking System 1x 100 kW PV Powered Solar PV Inverter 1x 250 kW PV Powered Solar PV Inverter Cooper Crouse Hinds Disconnecting, Surge Protection Combiner Boxes Market Conditions $/watt: $4.12 Estimated Installed Cost: $1,660,000 (rounded to nearest $10,000) Payback (with no incentives): 17.2 years Payback: 17 years Building Annual Electrical Usage: 3,655,385kWh* Solar System Annual Output: 483,000kWh % offset: 13.2% Applicable Incentives A detailed summary of applicable incentives is included
1. Vermont Small Scale Renewable Energy Incentive Program: $2.25/watt DC up to 10 kW, $1.50/W DC for next 50 kW (up to 60 kW). Maximum incentive $97,500 or up to 50% of project costs (whichever is lower).
2. Burlington Electric Department metering for $.20 per kWh.
Notes: 1. Structural analysis of the roof for ability to support the proposed solar PV system will be required.
This should be coordinated with the structural engineer’s ballast requirement calculations. These have been included in the estimated cost.
2. Installed cost includes all materials, labor, design, engineering…etc. based on observed market conditions in Q2 2012.
3. Financial analysis assumes BED utility 4. Electrical engineering/design of interconnection required (included in est. cost) 5. Roof substrate is assumed to be standing seem steel 6. Roof conditions should be field verified and confirmed to be OK for installation. Coordinate with
manufacturer to ensure continuation 7. Special care should be taken during design due to the curved roof, which may result in extra cost. 8. *The electrical usage is for the entire gymnasium, fieldhouse, and fitness center complex 9. Offset is calculated for total annual electric usage 10. Electricity will be directly fed into the grid, so the building offset is the equivalent amount

UVM Campus Renewable Energy Feasibility Study Building: Hamilton Hall- 438 South Prospect St, Burlington VT Visit Date: 7/11/2012 By: Ryan Darlow
* Measurements are approximate and include all required spacing * Carport calculation requires a minimum of 20 contiguous spots * Flat roof assumes 10’ setbacks per OSHA * Sloped roof assumes 4’ setback per building code (may vary)
Building: Hamilton Hall Address: 438 South Prospect St, Burlington, VT Aerial Photo:
Total Roof Space: 6,532 sqft Useable Roof Space: 2,600 sqft Installation Type: 1 Roof Slope: Flat (0°) Orientation: 175° South Approximate DC Watts: 20,800 Solar PV System Size: 20.8kW Basis of Design Equipment: Sharp 250W Mono Solar Modules SunLink Ballasted Racking System 3x SMA 7000 W Solar PV Inverters
Installation Type DC Watts per
Unit
1. Roof Mount Ballasted Flat
8 sqft
2. Roof Mount Sloped 11.5 sqft 3. Ground Mount 5 sqft 4. Carport 1000 Parking
space

UVM Campus Renewable Energy Feasibility Study Building: Hamilton Hall- 438 South Prospect St, Burlington VT Cooper Crouse Hinds Disconnecting, Surge Protection Combiner Boxes Total $/watt: $6.25 Estimated Installed Cost: $130,000 (rounded to nearest $10,000) Payback (with no incentives): 26.0 years Payback: 21 years Building Annual Electrical Usage: 638,795 kWh* Solar System Annual Output: 24,960 kWh % offset: 3.91 % Applicable Incentives A detailed summary of applicable incentives is included
1. Vermont Small Scale Renewable Energy Incentive Program: $2.25/watt DC up to 10 kW, $1.50/W DC for next 50 kW (up to 60 kW). Maximum incentive $97,500 or up to 50% of project costs (whichever is lower).
2. Burlington Electric Department metering for $.20 per kWh. Notes:
1. Structural analysis of the roof for ability to support the proposed solar PV system will be required. This should be coordinated with the structural engineer’s ballast requirement calculations. These have been included in the estimated cost.
2. Installed cost includes all materials, labor, design, engineering…etc. based on observed market conditions in Q2 2012.
3. Financial analysis assumes BED utility 4. Electrical engineering/design of interconnection required (included in est. cost) 5. Roof substrate is assumed to be EPDM rubber 6. Roof conditions should be field verified and confirmed to be OK for installation. Coordinate with
manufacturer to ensure continuation 7. Electricity will be directly fed into the grid, so the building offset is the equivalent amount 8. *Annual electrical usage is for the entire Mason Simpson Hamilton Complex
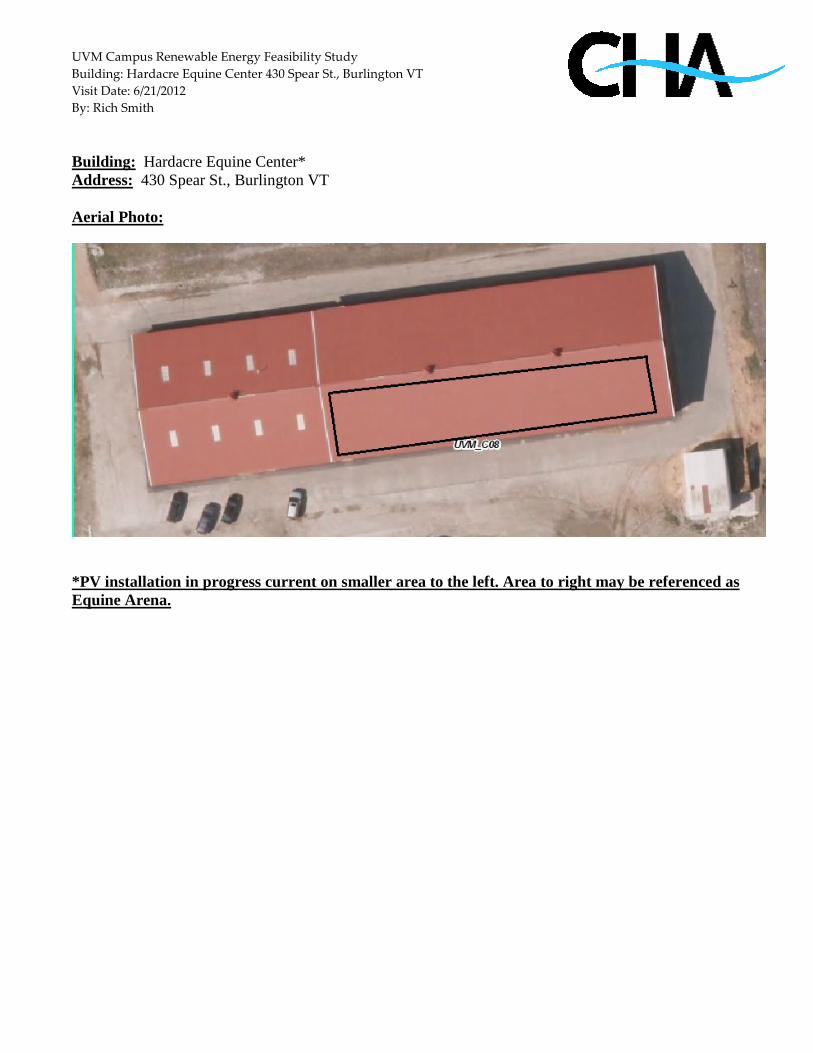
UVM Campus Renewable Energy Feasibility Study Building: Hardacre Equine Center 430 Spear St., Burlington VT Visit Date: 6/21/2012 By: Rich Smith Building: Hardacre Equine Center* Address: 430 Spear St., Burlington VT Aerial Photo:
*PV installation in progress current on smaller area to the left. Area to right may be referenced as Equine Arena.

UVM Campus Renewable Energy Feasibility Study Building: Hardacre Equine Center 430 Spear St., Burlington VT
* Measurements are approximate and include all required spacing * Carport calculation requires a minimum of 20 contiguous spots * Flat roof assumes 10’ setbacks per OSHA * Sloped roof assumes 4’ setback per building code (may vary)
Total Roof Space: 21,000 sqft Useable Roof Space: 7,000 sqft Installation Type: 2 Tilt Angle: 15 Degrees Orientation: 180 Degrees Approximate DC Watts: 80,500 Solar PV System Size: 80.5kW Basis of Design Equipment: Sharp 250W Mono Solar Modules Unirac Racking System 1x 75kW PV Powered Solar PV Inverter Cooper Crouse Hinds Disconnecting, Surge Protection Combiner Boxes Total $/watt: $4.85 Estimated Installed Cost: $390,000.00 (rounded to nearest $10,000) Payback (with no incentives): 22 years Payback (with incentives): 13 years Building Annual Electrical Usage: 665,800kWh (2011 Data of Miller Farm Research Complex) Solar System Annual Output: 96,600kW % offset: 14.51% Applicable Incentives A detailed summary of applicable incentives is included
1. Vermont Small Scale Renewable Energy Incentive Program: $2.25/watt DC up to 10 kW, $1.50/W DC for next 50 kW (up to 60 kW). Maximum incentive $97,500 or up to 50% of project costs (whichever is lower).
2. Green Mountain Power net meter tariff, commercial customers will receive $0.06 per kWh.
Installation Type DC Watts per
Unit
1. Roof Mount Ballasted Flat
8 sqft
2. Roof Mount Sloped 11.5 sqft 3. Ground Mount 5 sqft 4. Carport 1000 Parking space

UVM Campus Renewable Energy Feasibility Study Building: Hardacre Equine Center 430 Spear St., Burlington VT
Notes: 1. Structural analysis of the roof for ability to support the proposed solar PV system will be required.
These have been included in the estimated cost.
2. Installed cost includes all materials, labor, design, engineering…etc. based on observed market conditions in Q2 2012.
3. Financial analysis assumes GMP utility
4. Electrical engineering/design of interconnection required (included in est. cost)
5. Roof substrate is Corrugated Metal.
6. Roof conditions should be field verified and confirmed to be OK for installation. Coordinate with manufacturer to ensure continuation of warranty if applicable.
7. Avoid roof top fixtures and other roof obstructions.
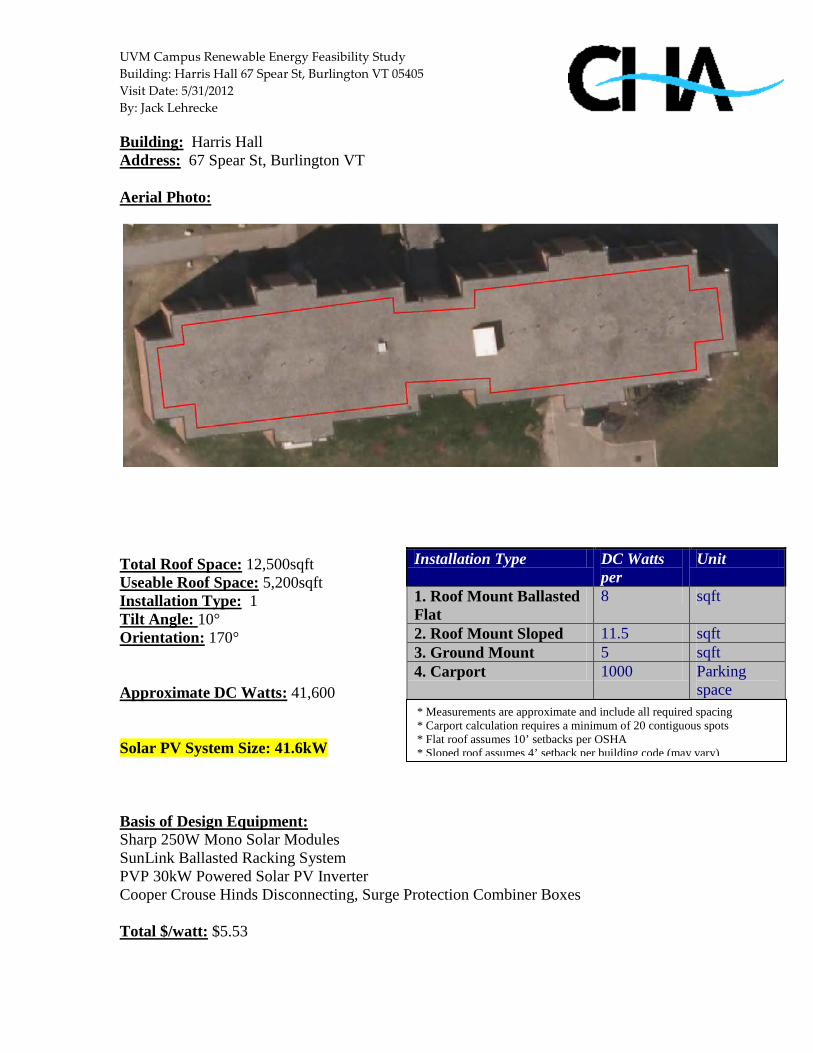
UVM Campus Renewable Energy Feasibility Study Building: Harris Hall 67 Spear St, Burlington VT 05405 Visit Date: 5/31/2012 By: Jack Lehrecke
* Measurements are approximate and include all required spacing * Carport calculation requires a minimum of 20 contiguous spots * Flat roof assumes 10’ setbacks per OSHA * Sloped roof assumes 4’ setback per building code (may vary)
Building: Harris Hall Address: 67 Spear St, Burlington VT Aerial Photo:
Total Roof Space: 12,500sqft Useable Roof Space: 5,200sqft Installation Type: 1 Tilt Angle: 10° Orientation: 170° Approximate DC Watts: 41,600 Solar PV System Size: 41.6kW Basis of Design Equipment: Sharp 250W Mono Solar Modules SunLink Ballasted Racking System PVP 30kW Powered Solar PV Inverter Cooper Crouse Hinds Disconnecting, Surge Protection Combiner Boxes Total $/watt: $5.53
Installation Type DC Watts per
Unit
1. Roof Mount Ballasted Flat
8 sqft
2. Roof Mount Sloped 11.5 sqft 3. Ground Mount 5 sqft 4. Carport 1000 Parking
space

UVM Campus Renewable Energy Feasibility Study Building: Harris Hall 67 Spear St, Burlington VT 05405 Estimated Installed Cost: $230,000 (rounded to nearest $10,000) Payback (with no incentives): 23 years Payback (with incentives): 17 years Building Annual Electrical Usage: 350,000 kWh Solar System Annual Output: 49,920 kWh % offset: 14.26% Applicable Incentives A detailed summary of applicable incentives is included 1.Vermont Small Scale Renewable Energy Incentive Program: $2.25/watt DC up to 10
kW, $1.50/W DC for next 50 kW (up to 60 kW). Maximum incentive $97,500 or up to 50% of project costs (whichever is lower).
2.Burlington Electric Department feed in tariff purchases PV produced power at 0.20 $/kWh, the offset calculation compares this power, which is fed directly into the grid, against the adjacent structure’s utility demand.
Notes: 1. Structural analysis of the roof for ability to support the proposed solar PV system will
be required. This should be coordinated with the structural engineer’s ballast requirement calculations. These have been included in the estimated cost.
2. Installed cost includes all materials, labor, design, engineering…etc. based on observed market conditions in Q2 2012.
3. Financial analysis assumes BED utility 4. Electrical engineering/design of interconnection required (included in est. cost) 5. Roof substrate is assumed to be EPDM Rubber or similar and fully adhered. 6.Roof conditions should be field verified and confirmed to be OK for installation.
Coordinate with manufacturer to ensure continuation 7.The energy consumption listed for the building was calculated assuming an even
distribution of power between the buildings in the H-M Complex and assuming Harris Millis Commons uses a similar amount of power compared with Cook Commons
8.Utility rate assumes an annual increase of 3%

UVM Campus Renewable Energy Feasibility Study Building: Harris-Millis Commons 67 Spear St, Burlington VT 05405 Visit Date: 5/31/2012 By: Jack Lehrecke Building: Harris-Millis Commons Address: 67 Spear St, Burlington VT Aerial Photo:

UVM Campus Renewable Energy Feasibility Study Building: Harris-Millis Commons 67 Spear St, Burlington VT 05405
* Measurements are approximate and include all required spacing * Carport calculation requires a minimum of 20 contiguous spots * Flat roof assumes 10’ setbacks per OSHA * Sloped roof assumes 4’ setback per building code (may vary)
Total Roof Space: 10,800sqft Useable Roof Space: 4,000sqft Installation Type: 1 Tilt Angle: 10° Orientation: 170° Approximate DC Watts: 32,000 Solar PV System Size: 32.0kW Basis of Design Equipment: Sharp 250W Mono Solar Modules SunLink Ballasted Racking System 3x SMA 10000 Powered Solar PV Inverters Cooper Crouse Hinds Disconnecting, Surge Protection Combiner Boxes Total $/watt: $5.63 Estimated Installed Cost: $180,000 (rounded to nearest $10,000) Payback (with no incentives): 23.4 years Payback (with incentives): 18 years Building Annual Electrical Usage: 350,000 kWh Solar System Annual Output: 38,400 kWh % offset: 10.97% Applicable Incentives A detailed summary of applicable incentives is included 1.Vermont Small Scale Renewable Energy Incentive Program: $2.25/watt DC up to 10
kW, $1.50/W DC for next 50 kW (up to 60 kW). Maximum incentive $97,500 or up to 50% of project costs (whichever is lower).
2.Burlington Electric Department feed in tariff purchases PV produced power at 0.20 $/kWh, the offset calculation compares this power, which is fed directly into the grid, against the adjacent structure’s utility demand.
Installation Type DC Watts per
Unit
1. Roof Mount Ballasted Flat
8 sqft
2. Roof Mount Sloped 11.5 sqft 3. Ground Mount 5 sqft 4. Carport 1000 Parking
space

UVM Campus Renewable Energy Feasibility Study Building: Harris-Millis Commons 67 Spear St, Burlington VT 05405 Notes: 1. Structural analysis of the roof for ability to support the proposed solar PV system will
be required. This should be coordinated with the structural engineer’s ballast requirement calculations. These have been included in the estimated cost.
2. Installed cost includes all materials, labor, design, engineering…etc. based on observed market conditions in Q2 2012.
3. Financial analysis assumes BED utility 4. Electrical engineering/design of interconnection required (included in est. cost) 5. Roof substrate is assumed to be EPDM Rubber or similar and fully adhered. 6.Roof conditions should be field verified and confirmed to be OK for installation.
Coordinate with manufacturer to ensure continuation 7.The energy consumption listed for the building was calculated assuming an even
distribution of power between the buildings in the H-M Complex and assuming Harris-Millis Commons uses a similar amount of power compared with Cook Commons
8.Utility rate assumes an annual increase of 3%

UVM Campus Renewable Energy Feasibility Study Building: 411 Hunt Hall 248 Colchester Ave., Burlington VT. Visit Date: 7/11/2012 By: Rich Smith Building: Hunt Hall Address: 248 Colchester Ave., Burlington VT Aerial Photo:

UVM Campus Renewable Energy Feasibility Study Building: 411 Hunt Hall 248 Colchester Ave., Burlington VT.
* Measurements are approximate and include all required spacing * Carport calculation requires a minimum of 20 contiguous spots * Flat roof assumes 10’ setbacks per OSHA * Sloped roof assumes 4’ setback per building code (may vary)
Total Roof Space: 4,096 sqft Useable Roof Space: 2,000 sqft Installation Type: 1 Tilt Angle: 10 Degrees Orientation: 180 Degrees Approximate DC Watts: 16,000 Solar PV System Size: 16kW Basis of Design Equipment: Sharp 250W Mono Solar Modules Sunlink Ballasted Racking System 2x SMA 8000W Solar PV Inverters Cooper Crouse Hinds Disconnecting, Surge Protection Combiner Boxes Total $/watt: $6.22 Estimated Installed Cost: $100,000.00 (rounded to nearest $10,000) Payback (with no incentives): 26 years Payback (with incentives): 15 years Building Annual Electrical Usage: 128,812kWh (estimated from 2011 Data) Solar System Annual Output: 19,200kW % offset: 14.91% Applicable Incentives A detailed summary of applicable incentives is included
1. Vermont Small Scale Renewable Energy Incentive Program: $2.25/watt DC up to 10 kW, $1.50/W DC for next 50 kW (up to 60 kW). Maximum incentive $97,500 or up to 50% of project costs (whichever is lower).
2. Electricity will be sold directly to Burlington Electric Department at a rate of $0.20/kWh. There will be a separate meter and service, one bill for the building use that will be offset by the bill for BED credit.
Installation Type DC Watts per
Unit
1. Roof Mount Ballasted Flat
8 sqft
2. Roof Mount Sloped 11.5 sqft 3. Ground Mount 5 sqft 4. Carport 1000 Parking space

UVM Campus Renewable Energy Feasibility Study Building: 411 Hunt Hall 248 Colchester Ave., Burlington VT.
Notes:
1. Structural analysis of the roof for ability to support the proposed solar PV system will be required. This should be coordinated with the structural engineer’s ballast requirement calculations. These have been included in the estimated cost.
2. Installed cost includes all materials, labor, design, engineering…etc. based on observed market conditions in Q2 2012.
3. Financial analysis assumes BED utility
4. Electrical engineering/design of interconnection required (included in est. cost)
5. Roof substrate is assumed to be EPDM Rubber or similar and fully adhered.
6. Roof conditions should be field verified and confirmed to be OK for installation. Coordinate with manufacturer to ensure continuation of warranty if applicable.
7. Avoid roof top fixtures and other roof obstructions.

UVM Campus Renewable Energy Feasibility Study Building: Ira Allen School- 34 Fletcher Place, Burlington VT Visit Date: 7/10/2012 By: Ryan Darlow
* Measurements are approximate and include all required spacing * Carport calculation requires a minimum of 20 contiguous spots * Flat roof assumes 10’ setbacks per OSHA * Sloped roof assumes 4’ setback per building code (may vary)
Building: Ira Allen School Address: 34 Fletcher Place, Burlington, VT Aerial Photo:
Total Roof Space: 13,680 sqft Useable Roof Space: 5,550 sqft Installation Type: 1 Roof Slope: Flat (0°) Orientation: 150° South
Installation Type DC Watts per
Unit
1. Roof Mount Ballasted Flat
8 sqft
2. Roof Mount Sloped 11.5 sqft 3. Ground Mount 5 sqft 4. Carport 1000 Parking
space

UVM Campus Renewable Energy Feasibility Study Building: Ira Allen School- 34 Fletcher Place, Burlington VT Approximate DC Watts: 44,400 Solar PV System Size: 44.4 kW Basis of Design Equipment: Sharp 250W Mono Solar Modules SunLink Ballasted Racking System 1x 30 kW PV Powered Solar PV Inverter Cooper Crouse Hinds Disconnecting, Surge Protection Combiner Boxes Total $/watt: $5.41 Estimated Installed Cost: $220,000 (rounded to nearest $10,000) Payback (with no incentives): 22.5 years Payback: 17 years Building Annual Electrical Usage: 102,960 kWh Solar System Annual Output: 53,280 kWh % offset: 51.75 % Applicable Incentives A detailed summary of applicable incentives is included
1. Vermont Small Scale Renewable Energy Incentive Program: $2.25/watt DC up to 10 kW, $1.50/W DC for next 50 kW (up to 60 kW). Maximum incentive $97,500 or up to 50% of project costs (whichever is lower).
2. Burlington Electric Department metering for $.20 per kWh. Notes:
1. Structural analysis of the roof for ability to support the proposed solar PV system will be required. This should be coordinated with the structural engineer’s ballast requirement calculations. These have been included in the estimated cost.
2. Installed cost includes all materials, labor, design, engineering…etc. based on observed market conditions in Q2 2012.
3. Financial analysis assumes BED utility 4. Electrical engineering/design of interconnection required (included in est. cost) 5. Roof substrate is assumed to be EPDM rubber 6. Roof conditions should be field verified and confirmed to be OK for installation. Coordinate with
manufacturer to ensure continuation 7. Electricity will be directly fed into the grid, so the building offset is the equivalent amount

UVM Campus Renewable Energy Feasibility Study Building: Jeanne Mance- 394 Pearl St, Burlington VT Visit Date: 7/10/2012 By: Ryan Darlow Building: Jeanne Mance Address: 394 Pearl St, Burlington, VT Aerial Photo:
UVM Campus Renewable Energy Feasibility Study Building: Jeanne Mance- 394 Pearl St, Burlington VT
* Measurements are approximate and include all required spacing * Carport calculation requires a minimum of 20 contiguous spots * Flat roof assumes 10’ setbacks per OSHA * Sloped roof assumes 4’ setback per building code (may vary)
Total Roof Space: 5,888 sqft Useable Roof Space: 2,280 sqft Installation Type: 1 Roof Slope: Flat (0°) Orientation: 160° South Approximate DC Watts: 18,240 Solar PV System Size: 18.24kW Basis of Design Equipment: Sharp 250W Mono Solar Modules Unirac Racking System 3 x SMA 6000 W Solar PV Inverters Cooper Crouse Hinds Disconnecting, Surge Protection Combiner Boxes Total $/watt: $6.03 Estimated Installed Cost: $110,000 (rounded to nearest $10,000) Payback (with no incentives): 25.1 years Payback: 20 years Building Annual Electrical Usage: 168,200 kWh Solar System Annual Output: 21,888 kWh % offset: 13.01 % Applicable Incentives A detailed summary of applicable incentives is included
1. Vermont Small Scale Renewable Energy Incentive Program: $2.25/watt DC up to 10 kW, $1.50/W DC for next 50 kW (up to 60 kW). Maximum incentive $97,500 or up to 50% of project costs (whichever is lower).
2. Burlington Electric Department metering for $.20 per kWh. Notes:
1. Structural analysis of the roof for ability to support the proposed solar PV system will be required. This should be coordinated with the structural engineer’s ballast requirement calculations. These have been included in the estimated cost.
Installation Type DC Watts per
Unit
1. Roof Mount Ballasted Flat
8 sqft
2. Roof Mount Sloped 11.5 sqft 3. Ground Mount 5 sqft 4. Carport 1000 Parking
space

UVM Campus Renewable Energy Feasibility Study Building: Jeanne Mance- 394 Pearl St, Burlington VT
2. Installed cost includes all materials, labor, design, engineering…etc. based on observed market conditions in Q2 2012.
3. Financial analysis assumes BED utility 4. Electrical engineering/design of interconnection required (included in est. cost) 5. Roof substrate is assumed to be EPDM rubber 6. Roof conditions should be field verified and confirmed to be OK for installation. Coordinate with
manufacturer to ensure continuation 7. Electricity will be directly fed into the grid, so the building offset is the equivalent amount

UVM Campus Renewable Energy Feasibility Study Building: Jeffords Hall- 63 Carrigan Dr, Burlington VT Visit Date: 7/11/2012 By: Ryan Darlow Building: Jeffords Hall Address: 63 Carrigan Dr, Burlington, VT Aerial Photo:

UVM Campus Renewable Energy Feasibility Study Building: Jeffords Hall- 63 Carrigan Dr, Burlington VT
* Measurements are approximate and include all required spacing * Carport calculation requires a minimum of 20 contiguous spots * Flat roof assumes 10’ setbacks per OSHA * Sloped roof assumes 4’ setback per building code (may vary)
Total Roof Space: 8,000 sqft Useable Roof Space: 3,200 sqft Installation Type: 1 Roof Slope: Flat (0°) Orientation: 80° East, 120° Southeast Approximate DC Watts: 25,600 Solar PV System Size: 25.6kW Basis of Design Equipment: Sharp 250W Mono Solar Modules SunLink Ballasted Racking System 3 x SMA 8000 W Solar PV Inverters Cooper Crouse Hinds Disconnecting, Surge Protection Combiner Boxes Total $/watt: $5.86 Estimated Installed Cost: $150,000 (rounded to nearest $10,000) Payback (with no incentives): 24.4 years Payback: 19 years Building Annual Electrical Usage: 2,360,960 kWh Solar System Annual Output: 30,720 kWh % offset: 1.30 % Applicable Incentives A detailed summary of applicable incentives is included
1. Vermont Small Scale Renewable Energy Incentive Program: $2.25/watt DC up to 10 kW, $1.50/W DC for next 50 kW (up to 60 kW). Maximum incentive $97,500 or up to 50% of project costs (whichever is lower).
2. Burlington Electric Department metering for $.20 per kW.
Installation Type DC Watts per
Unit
1. Roof Mount Ballasted Flat
8 sqft
2. Roof Mount Sloped 11.5 sqft 3. Ground Mount 5 sqft 4. Carport 1000 Parking
space

UVM Campus Renewable Energy Feasibility Study Building: Jeffords Hall- 63 Carrigan Dr, Burlington VT Notes:
1. Structural analysis of the roof for ability to support the proposed solar PV system will be required. This should be coordinated with the structural engineer’s ballast requirement calculations. These have been included in the estimated cost.
2. Installed cost includes all materials, labor, design, engineering…etc. based on observed market conditions in Q2 2012.
3. Financial analysis assumes BED utility 4. Electrical engineering/design of interconnection required (included in est. cost) 5. Roof substrate is assumed to be EPDM rubber 6. Roof conditions should be field verified and confirmed to be OK for installation. Coordinate with
manufacturer to ensure continuation 7. Electricity will be directly fed into the grid, so the building offset is the equivalent amount

UVM Campus Renewable Energy Feasibility Study Building: Tupper Hall- 31 Spear St, Burlington VT Visit Date: 6/13/2012 By: Ryan Darlow
* Measurements are approximate and include all required spacing * Carport calculation requires a minimum of 20 contiguous spots * Flat roof assumes 10’ setbacks per OSHA * Sloped roof assumes 4’ setback per building code (may vary)
Building: Tupper Hall Address: 31 Spear St, Burlington, VT Aerial Photo:
Total Roof Space: 1,300 sqft Useable Roof Space: 780 sqft Installation Type: 2 Roof Slope: 15° Orientation: 170° South, 80° East Approximate DC Watts: 8970 Solar PV System Size: 9kW Basis of Design Equipment: Sharp 250W Mono Solar Modules Unirac Racking System SMA 10000 W Solar PV Inverter Cooper Crouse Hinds Disconnecting, Surge Protection Combiner Boxes Total $/watt: $6.69 Estimated Installed Cost: $60,000 (rounded to nearest $10,000) Payback (with no incentives): 27.9 years
Installation Type DC Watts per
Unit
1. Roof Mount Ballasted Flat
8 sqft
2. Roof Mount Sloped 11.5 sqft 3. Ground Mount 5 sqft 4. Carport 1000 Parking
space

UVM Campus Renewable Energy Feasibility Study Building: Tupper Hall- 31 Spear St, Burlington VT Payback: 25 years Building Annual Electrical Usage: 27,760 kWh Solar System Annual Output: 10,764 kWh % offset: 38.78 % Applicable Incentives A detailed summary of applicable incentives is included
1. Vermont Small Scale Renewable Energy Incentive Program: $2.25/watt DC up to 10 kW, $1.50/W DC for next 50 kW (up to 60 kW). Maximum incentive $97,500 or up to 50% of project costs (whichever is lower).
2. Burlington Electric Department metering for $.20 per kWh.
Notes:
1. Structural analysis of the roof for ability to support the proposed solar PV system will be required. This should be coordinated with the structural engineer’s ballast requirement calculations. These have been included in the estimated cost.
2. Installed cost includes all materials, labor, design, engineering…etc. based on observed market conditions in Q2 2012.
3. Financial analysis assumes BED utility 4. Electrical engineering/design of interconnection required (included in est. cost) 5. Roof substrate is assumed to be shingles and standing seem metal 6. Roof conditions should be field verified and confirmed to be OK for installation. Coordinate with
manufacturer to ensure continuation 7. Contractor should perform shading analysis prior to installation 8. Assume no shading due to the chimney because it is to the north 9. Electricity will be directly fed into the grid, so the building offset is the equivalent amount

UVM Campus Renewable Energy Feasibility Study Building: 157 Kalkin Hall 55 Colchester Ave. Burlington VT. Visit Date: 7/02/2012 By: Rich Smith Building: Kalkin Hall Address: 55 Colchester Ave., Burlington VT Aerial Photo:

UVM Campus Renewable Energy Feasibility Study Building: 157 Kalkin Hall 55 Colchester Ave. Burlington VT.
* Measurements are approximate and include all required spacing * Carport calculation requires a minimum of 20 contiguous spots * Flat roof assumes 10’ setbacks per OSHA * Sloped roof assumes 4’ setback per building code (may vary)
Total Roof Space: 11,560 sqft Useable Roof Space: 8,040 sqft Installation Type: 1* & 2 Tilt Angle: 10 Degrees*,30 Degrees Orientation: 80,150, 260 Degrees *A south facing flat canopy will be constructed over the Area around courtyard Approximate DC Watts: 81,960 Solar PV System Size: 81.96kW Basis of Design Equipment: Sharp 250W Mono Solar Modules Unitrac Racking System on building Sunlink Ballasted Roof Mount for Canopy 1x 100kW PV Powered Solar PV Inveter Cooper Crouse Hinds Disconnecting, Surge Protection Combiner Boxes Total $/watt: $4.90 Estimated Installed Cost: $400,000.00 (rounded to nearest $10,000) Payback (with no incentives): 20.3 years Payback (with incentives): 15 years Building Annual Electrical Usage: 717,988kWh (estimated from 2011 Data) Solar System Annual Output: 98,352kW % offset: 13.7% Applicable Incentives A detailed summary of applicable incentives is included
1. Vermont Small Scale Renewable Energy Incentive Program: $2.25/watt DC up to 10 kW, $1.50/W DC for next 50 kW (up to 60 kW). Maximum incentive $97,500 or up to 50% of project costs (whichever is lower).
Installation Type DC Watts per
Unit
1. Roof Mount Ballasted Flat
8 sqft
2. Roof Mount Sloped 11.5 sqft 3. Ground Mount 5 sqft 4. Carport 1000 Parking space

UVM Campus Renewable Energy Feasibility Study Building: 157 Kalkin Hall 55 Colchester Ave. Burlington VT.
2. Electricity will be sold directly to Burlington Electric Department at a rate of $0.20/kWh. There will be a separate meter and service, one bill for the building use that will be offset by the bill for BED credit.
Notes:
1. Structural analysis of the roof for ability to support the proposed solar PV system will be required. This should be coordinated with the structural engineer’s ballast requirement calculations. These have been included in the estimated cost.
2. Installed cost includes all materials, labor, design, engineering…etc. based on observed market conditions in Q2 2012.
3. Financial analysis assumes BED utility
4. Electrical engineering/design of interconnection required (included in est. cost)
5. Roof substrate is assumed to be Corrugated Metal.
6. Roof conditions should be field verified and confirmed to be OK for installation. Coordinate with manufacturer to ensure continuation of warranty if applicable.
7. Avoid roof top fixtures and other roof obstructions.

UVM Campus Renewable Energy Feasibility Study Building: CHA HQ- 3 Winners Circle, Albany NY Visit Date: 5/29/2012 By: Jack B Honor Building: CHA HQ Address: 3 Winners Circle, Albany NY Aerial Photo:

UVM Campus Renewable Energy Feasibility Study Building: CHA HQ- 3 Winners Circle, Albany NY
* Measurements are approximate and include all required spacing * Carport calculation requires a minimum of 20 contiguous spots * Flat roof assumes 10’ setbacks per OSHA * Sloped roof assumes 4’ setback per building code (may vary)
Total Roof Space: 38,000sqft Useable Roof Space: 32,000sqft Installation Type: 1 Approximate DC Watts: 256,000 Solar PV System Size: 256kW Basis of Design Equipment: Sharp 250W Mono Solar Modules SunLink Ballasted Racking System 1x 250kW PV Powered Solar PV Inveter Cooper Crouse Hinds Disconnecting, Surge Protection Combiner Boxes Market Conditions Total $/watt: $4.38 Estimated Installed Cost: $1,120,000 (rounded to nearest $10,000) Payback (with no incentives): 30.4 years Payback (with incentives): 8 years Building Annual Electrical Usage: 1,000,000kWh (estimated) Solar System Annual Output: 307,200 % offset: 31% Applicable Incentives A detailed summary of applicable incentives is included
1. Vermont Small Scale Renewable Energy Incentive Program: $2.25/watt DC up to 10 kW, $1.50/W DC for next 50 kW (up to 60 kW). Maximum incentive $97,500 or up to 50% of project costs (whichever is lower).
2. Vermont SPEED; Standard Offer: $271/MWh annual. (See incentive summary for additional details on this program)
Installation Type DC Watts per
Unit
1. Roof Mount Ballasted Flat
8 sqft
2. Roof Mount Sloped 11.5 sqft 3. Ground Mount 5 sqft 4. Carport 1000 Parking
space

UVM Campus Renewable Energy Feasibility Study Building: CHA HQ- 3 Winners Circle, Albany NY Notes:
1. Structural analysis of the roof for ability to support the proposed solar PV system will be required. This should be coordinated with the structural engineer’s ballast requirement calculations. These have been included in the estimated cost.
2. Installed cost includes all materials, labor, design, engineering…etc. based on observed market conditions in Q2 2012.
3. Financial analysis assumes BED utility 4. Electrical engineering/design of interconnection required (included in est. cost) 5. Roof substrate is assumed to be EPDM Rubber or similar and fully adhered. 6. Roof conditions should be field verified and confirmed to be OK for installation. Coordinate with
manufacturer to ensure continuation

UVM Campus Renewable Energy Feasibility Study Building: Living & Learning Complex 663 Main St., Burlington VT Visit Date: 6/13/2012 By: Rich Smith Building: 385-390 Living and Learning Complex* Address: 663 Main St., Burlington VT Aerial Photo:
Above Left: Living & Learning Commons, Above Right: Living & Learning A. Same Dimensions apply for B, C, D, and E. *Includes All Living & Learning Buildings; Commons, A, B, C, D, and E

UVM Campus Renewable Energy Feasibility Study Building: Living & Learning Complex 663 Main St., Burlington VT Visit Date: 6/13/2012 By: Rich Smith Installation Type DC Watts per Unit
1. Roof Mount Ballasted Flat 8 sqft 2. Roof Mount Sloped 11.5 sqft 3. Ground Mount 5 sqft 4. Carport 1000 Parking space * Measurements are approximate and include all required spacing * Carport calculation requires a minimum of 20 contiguous spots * Flat roof assumes 10’ setbacks per OSHA * Sloped roof assumes 4’ setback per building code (may vary) Total Roof Space: 70,115 sqft Useable Roof Space: 53,400 sqft Installation Type: 1 Roof Slope: 10 Degrees Orientation: 170 Degrees Approximate DC Watts: 427200 Solar PV System Size: 427kW Basis of Design Equipment: Sharp 250W Mono Solar Modules SunLink Ballasted Racking System 2x 250kW PV Powered Solar PV Inveter Cooper Crouse Hinds Disconnecting, Surge Protection Combiner Boxes Total $/watt: $4.20 Estimated Installed Cost: $1,800,000.00 (rounded to nearest $10,000) Payback (with no incentives): 17.7 years Payback (with incentives): 17 years Building Annual Electrical Usage: 1,666,600kWh (2011 Data) Solar System Annual Output: 512,640kW % offset: 30.76% Applicable Incentives A detailed summary of applicable incentives is included

UVM Campus Renewable Energy Feasibility Study Building: Living & Learning Complex 663 Main St., Burlington VT Visit Date: 6/13/2012 By: Rich Smith
1. Vermont Small Scale Renewable Energy Incentive Program: $2.25/watt DC up to 10 kW, $1.50/W DC for next 50 kW (up to 60 kW). Maximum incentive $97,500 or up to 50% of project costs (whichever is lower).
2. Electricity will be sold directly to Burlington Electric Department at a rate of $0.20/kWh. There will be a separate meter and service, one bill for the building use that will be offset by the bill for BED credit.
Notes:
1. Structural analysis of the roof for ability to support the proposed solar PV system will be required. This should be coordinated with the structural engineer’s ballast requirement calculations. These have been included in the estimated cost.
2. Installed cost includes all materials, labor, design, engineering…etc. based on observed market conditions in Q2 2012.
3. Financial analysis assumes BED utility 4. Electrical engineering/design of interconnection required (included in est. cost) 5. Roof substrate is assumed to be EPDM Rubber or similar and fully adhered. 6. Roof conditions should be field verified and confirmed to be OK for installation. Coordinate with
manufacturer to ensure continuation of warranty if applicable. 7. Avoid roof top fixtures and other roof obstructions.
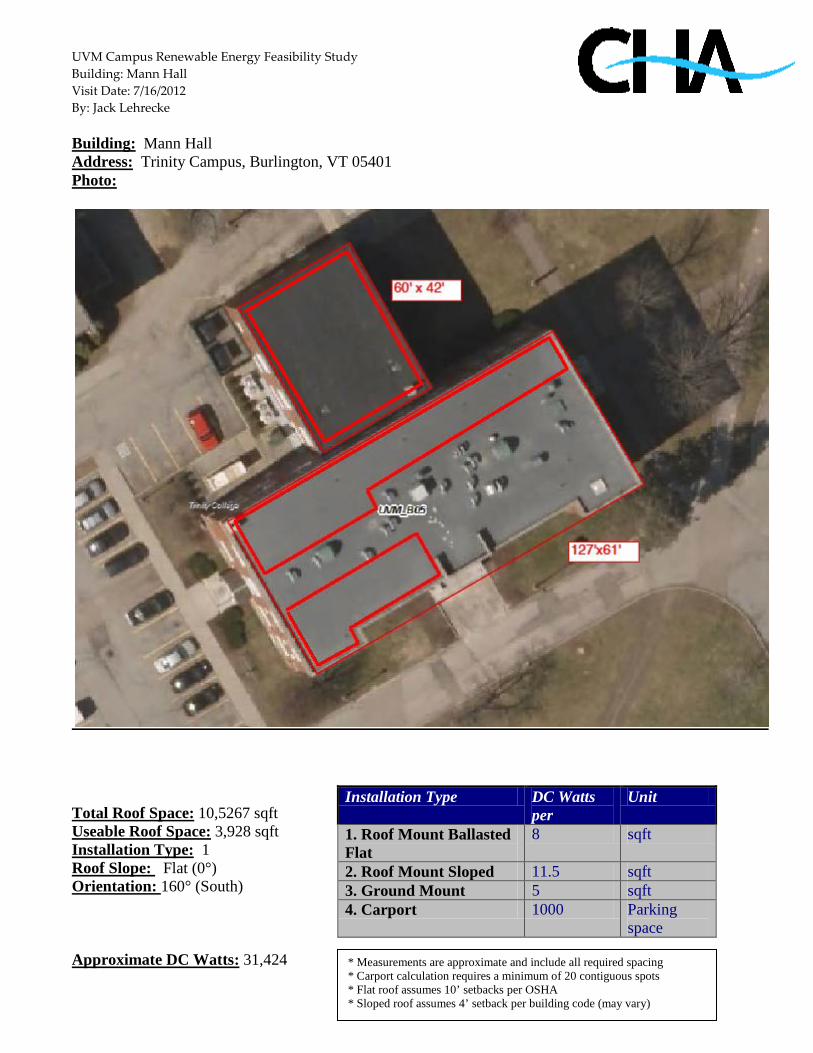
UVM Campus Renewable Energy Feasibility Study Building: Mann Hall Visit Date: 7/16/2012 By: Jack Lehrecke
* Measurements are approximate and include all required spacing * Carport calculation requires a minimum of 20 contiguous spots * Flat roof assumes 10’ setbacks per OSHA * Sloped roof assumes 4’ setback per building code (may vary)
Building: Mann Hall Address: Trinity Campus, Burlington, VT 05401 Photo:
Total Roof Space: 10,5267 sqft Useable Roof Space: 3,928 sqft Installation Type: 1 Roof Slope: Flat (0°) Orientation: 160° (South) Approximate DC Watts: 31,424
Installation Type DC Watts per
Unit
1. Roof Mount Ballasted Flat
8 sqft
2. Roof Mount Sloped 11.5 sqft 3. Ground Mount 5 sqft 4. Carport 1000 Parking
space
UVM Campus Renewable Energy Feasibility Study Building: Mann Hall Solar PV System Size: 31.424kW Basis of Design Equipment: Sharp 250W Mono Solar Modules SunLink Ballasted Racking System 3x SMA 10000kW Solar PV Inverters Cooper Crouse Hinds Disconnecting, Surge Protection Combiner Boxes Total $/watt: $5.73 Estimated Installed Cost: $180,000 (rounded to nearest $10,000) Payback (with no incentives): 23.9 years Payback: 18 years Building Annual Electrical Usage: 486,000 kWh Solar System Annual Output: 37,708 kWh % offset: % 7.76 Applicable Incentives A detailed summary of applicable incentives is included
1. Vermont Small Scale Renewable Energy Incentive Program: $2.25/watt DC up to 10 kW, $1.50/W DC for next 50 kW (up to 60 kW). Maximum incentive $97,500 or up to 50% of project costs (whichever is lower).
2. Burlington Electric Department feed in tariff purchases PV produced power at 0.20 $/kWh, the offset calculation compares this power, which is fed directly into the grid, against the adjacent structure’s utility demand.
Notes:
1. Structural analysis of the roof for ability to support the proposed solar PV system will be required. This should be coordinated with the structural engineer’s ballast requirement calculations. These have been included in the estimated cost.
2. Installed cost includes all materials, labor, design, engineering…etc. based on observed market conditions in Q2 2012.
3. Financial analysis assumes BED utility 4. Electrical engineering/design of interconnection required (included in est. cost) 5. Roof substrate is assumed to be EPDM Rubber or similar and fully adhered. 6. Roof conditions should be field verified and confirmed to be OK for installation. Coordinate
with manufacturer to ensure continuation

UVM Campus Renewable Energy Feasibility Study Building: Mann Hall
7. Obstructions on roof should be investigated for possible PV installation issues

UVM Campus Renewable Energy Feasibility Study Building: Marsh and Austin Halls, 31 Spear St. Burlington VT. Visit Date: 6/13/2012 By: Rich Smith Building: 345 and 347 Marsh and Austin Halls Address: 31 Spear St., Burlington VT Aerial Photo:

UVM Campus Renewable Energy Feasibility Study Building: Marsh and Austin Halls, 31 Spear St. Burlington VT. Installation Type DC Watts per Unit
1. Roof Mount Ballasted Flat 8 sqft 2. Roof Mount Sloped 11.5 sqft 3. Ground Mount 5 sqft 4. Carport 1000 Parking space * Measurements are approximate and include all required spacing * Carport calculation requires a minimum of 20 contiguous spots * Flat roof assumes 10’ setbacks per OSHA * Sloped roof assumes 4’ setback per building code (may vary) Total Roof Space: 10,678 sqft Useable Roof Space: 5,339 sqft Installation Type: 1 Tilt Angle: 10 Degrees Orientation: 170 Degrees Approximate DC Watts: 42712 Solar PV System Size: 42kW Basis of Design Equipment: Sharp 250W Mono Solar Modules SunLink Ballasted Racking System 1x 30kW PV Powered Solar PV Inverter Cooper Crouse Hinds Disconnecting, Surge Protection Combiner Boxes Total $/watt: $5.42 Estimated Installed Cost: $230,000.00 (rounded to nearest $10,000) Payback (with no incentives): 22.4 years Payback (with incentives): 17 years Building Annual Electrical Usage: 394,453kWh (2011 Data) Solar System Annual Output: 51,254kW % offset: 13%

UVM Campus Renewable Energy Feasibility Study Building: Marsh and Austin Halls, 31 Spear St. Burlington VT. Applicable Incentives A detailed summary of applicable incentives is included
1. Vermont Small Scale Renewable Energy Incentive Program: $2.25/watt DC up to 10 kW, $1.50/W DC for next 50 kW (up to 60 kW). Maximum incentive $97,500 or up to 50% of project costs (whichever is lower).
2. Electricity will be sold directly to Burlington Electric Department at a rate of $0.20/kWh. There will be a separate meter and service, one bill for the building use that will be offset by the bill for BED credit.
Notes:
1. Structural analysis of the roof for ability to support the proposed solar PV system will be required. This should be coordinated with the structural engineer’s ballast requirement calculations. These have been included in the estimated cost.
2. Installed cost includes all materials, labor, design, engineering…etc. based on observed market conditions in Q2 2012.
3. Financial analysis assumes BED utility 4. Electrical engineering/design of interconnection required (included in est. cost) 5. Roof substrate is assumed to be EPDM Rubber or similar and fully adhered. 6. Roof conditions should be field verified and confirmed to be OK for installation. Coordinate with
manufacturer to ensure continuation of warranty if applicable. 7. Avoid roof top fixtures and other roof obstructions. 8. Electricity Rate ($/kWh) assumes a 3% average annual increase.

UVM Campus Renewable Energy Feasibility Study Building: Marsh Life Science and Benedict Auditorium 109 Carrigan Dr. Burlington VT. Visit Date: 6/13/2012 By: Rich Smith Building: 86 Marsh Life Science and Benedict Auditorium Address: 109 Carrigan Dr., Burlington VT Aerial Photo:

UVM Campus Renewable Energy Feasibility Study Building: Marsh Life Science and Benedict Auditorium 109 Carrigan Dr. Burlington VT. Installation Type DC Watts per Unit
1. Roof Mount Ballasted Flat 8 sqft 2. Roof Mount Sloped 11.5 sqft 3. Ground Mount 5 sqft 4. Carport 1000 Parking space * Measurements are approximate and include all required spacing * Carport calculation requires a minimum of 20 contiguous spots * Flat roof assumes 10’ setbacks per OSHA * Sloped roof assumes 4’ setback per building code (may vary) Total Roof Space: 17,670 sqft Useable Roof Space: 4,302 sqft Installation Type: 1 Tilt Angle: 10 Degrees Orientation: 170 Degrees Approximate DC Watts: 34,416 Solar PV System Size: 34kW Basis of Design Equipment: Sharp 250W Mono Solar Modules SunLink Ballasted Racking System 1x 30kW PV Powered Solar PV Inverter Cooper Crouse Hinds Disconnecting, Surge Protection Combiner Boxes Total $/watt: $5.58 Estimated Installed Cost: $190,000.00 (rounded to nearest $10,000) Payback (with no incentives): 23 years Payback (with incentives): 16 years Building Annual Electrical Usage: 2,018,080kWh (2011 Data) Solar System Annual Output: 41,299kW % offset: 2.05% Applicable Incentives A detailed summary of applicable incentives is included

UVM Campus Renewable Energy Feasibility Study Building: Marsh Life Science and Benedict Auditorium 109 Carrigan Dr. Burlington VT.
1. Vermont Small Scale Renewable Energy Incentive Program: $2.25/watt DC up to 10 kW, $1.50/W DC for next 50 kW (up to 60 kW). Maximum incentive $97,500 or up to 50% of project costs (whichever is lower).
2. Electricity will be sold directly to Burlington Electric Department at a rate of $0.20/kWh. There will be a separate meter and service, one bill for the building use that will be offset by the bill for BED credit.
Notes:
1. Structural analysis of the roof for ability to support the proposed solar PV system will be required. This should be coordinated with the structural engineer’s ballast requirement calculations. These have been included in the estimated cost.
2. Installed cost includes all materials, labor, design, engineering…etc. based on observed market conditions in Q2 2012.
3. Financial analysis assumes BED utility 4. Electrical engineering/design of interconnection required (included in est. cost) 5. Roof substrate is assumed to be EPDM Rubber or similar and fully adhered. 6. Roof conditions should be field verified and confirmed to be OK for installation. Coordinate with
manufacturer to ensure continuation of warranty if applicable. 7. Avoid roof top fixtures and other roof obstructions.

UVM Campus Renewable Energy Feasibility Study Building: Mason Hall- 438 South Prospect St, Burlington VT Visit Date: 7/11/2012 By: Ryan Darlow Building: Mason Hall Address: 438 South Prospect St, Burlington, VT Aerial Photo:

UVM Campus Renewable Energy Feasibility Study Building: Mason Hall- 438 South Prospect St, Burlington VT
* Measurements are approximate and include all required spacing * Carport calculation requires a minimum of 20 contiguous spots * Flat roof assumes 10’ setbacks per OSHA * Sloped roof assumes 4’ setback per building code (may vary)
Total Roof Space: 6,440 sqft Useable Roof Space: 2,500 sqft Installation Type: 1 Roof Slope: Flat (0°) Orientation: 175° South Approximate DC Watts: 20,000 Solar PV System Size: 20kW Basis of Design Equipment: Sharp 250W Mono Solar Modules SunLink Ballasted Racking System 3x SMA 6000 W Solar PV Inverters Cooper Crouse Hinds Disconnecting, Surge Protection Combiner Boxes Total $/watt: $6.00 Estimated Installed Cost: $120,000 (rounded to nearest $10,000) Payback (with no incentives): 25.0 years Payback: 20 years Building Annual Electrical Usage: 638,795 kWh* Solar System Annual Output: 24,000 kWh % offset: 3.76 % Applicable Incentives A detailed summary of applicable incentives is included
1. Vermont Small Scale Renewable Energy Incentive Program: $2.25/watt DC up to 10 kW, $1.50/W DC for next 50 kW (up to 60 kW). Maximum incentive $97,500 or up to 50% of project costs (whichever is lower).
2. Burlington Electric Department metering for $.20 per kWh. Notes:
1. Structural analysis of the roof for ability to support the proposed solar PV system will be required. This should be coordinated with the structural engineer’s ballast requirement calculations. These have been included in the estimated cost.
Installation Type DC Watts per
Unit
1. Roof Mount Ballasted Flat
8 sqft
2. Roof Mount Sloped 11.5 sqft 3. Ground Mount 5 sqft 4. Carport 1000 Parking
space

UVM Campus Renewable Energy Feasibility Study Building: Mason Hall- 438 South Prospect St, Burlington VT
2. Installed cost includes all materials, labor, design, engineering…etc. based on observed market conditions in Q2 2012.
3. Financial analysis assumes BED utility 4. Electrical engineering/design of interconnection required (included in est. cost) 5. Roof substrate is assumed to be EPDM rubber 6. Roof conditions should be field verified and confirmed to be OK for installation. Coordinate with
manufacturer to ensure continuation 7. Electricity will be directly fed into the grid, so the building offset is the equivalent amount 8. *Annual electrical usage is for entire Mason Simpson Hamilton Complex

UVM Campus Renewable Energy Feasibility Study Building: Maternity Barn , Nutrition Lab , and Hay and Commodities 512 Spear St., Burlington VT Visit Date: 6/21/2012 By: Rich Smith Building: Maternity Barn, Nutrition Lab, and Hay and Commodities Address: 512 Spear St., Burlington VT Aerial Photo:

UVM Campus Renewable Energy Feasibility Study Building: Maternity Barn , Nutrition Lab , and Hay and Commodities 512 Spear St., Burlington VT
* Measurements are approximate and include all required spacing * Carport calculation requires a minimum of 20 contiguous spots * Flat roof assumes 10’ setbacks per OSHA * Sloped roof assumes 4’ setback per building code (may vary)
Total Roof Space: 11,677 sqft Useable Roof Space: 7,419 sqft Installation Type: 2 Tilt Angle: 30 Degrees Orientation: 180,270 Degrees Approximate DC Watts: 85319 Solar PV System Size: 85.3kW Basis of Design Equipment: Sharp 250W Mono Solar Modules Unirac Racking System 1x 75kW PV Powered Solar PV Inverter Cooper Crouse Hinds Disconnecting, Surge Protection Combiner Boxes Total $/watt: $4.81 Estimated Installed Cost: $411,000.00 (rounded to nearest $10,000) Payback (with no incentives): 21.1 years Payback (with incentives): 13 years Building Annual Electrical Usage: 665,800kWh (2011 Data of Miller Farm Research Complex) Solar System Annual Output: 102,382kW % offset: 15.38% Applicable Incentives A detailed summary of applicable incentives is included
1. Vermont Small Scale Renewable Energy Incentive Program: $2.25/watt DC up to 10 kW, $1.50/W DC for next 50 kW (up to 60 kW). Maximum incentive $97,500 or up to 50% of project costs (whichever is lower).
2. Green Mountain Power net meter tariff, commercial customers will receive $0.06 per kWh.
Installation Type DC Watts per
Unit
1. Roof Mount Ballasted Flat
8 sqft
2. Roof Mount Sloped 11.5 sqft 3. Ground Mount 5 sqft 4. Carport 1000 Parking space

UVM Campus Renewable Energy Feasibility Study Building: Maternity Barn , Nutrition Lab , and Hay and Commodities 512 Spear St., Burlington VT
Notes: 1. Structural analysis of the roof for ability to support the proposed solar PV system will be required.
These have been included in the estimated cost. The large overhang of the Hay and Commodities building will most likely need replacing or serious structural reinforcements.
2. Installed cost includes all materials, labor, design, engineering…etc. based on observed market conditions in Q2 2012.
3. Financial analysis assumes GMP utility
4. Electrical engineering/design of interconnection required (included in est. cost)
5. Roof substrate is Corrugated Metal.
6. Roof conditions should be field verified and confirmed to be OK for installation. Coordinate with manufacturer to ensure continuation of warranty if applicable.
7. Avoid roof top fixtures and other roof obstructions.

UVM Campus Renewable Energy Feasibility Study Building: 407 McAuley Hall 250 Colchester Ave., Burlington VT. Visit Date: 7/11/2012 By: Rich Smith Building: McAuley Hall Address: 250 Colchester Ave., Burlington VT Aerial Photo:

UVM Campus Renewable Energy Feasibility Study Building: 407 McAuley Hall 250 Colchester Ave., Burlington VT.
* Measurements are approximate and include all required spacing * Carport calculation requires a minimum of 20 contiguous spots * Flat roof assumes 10’ setbacks per OSHA * Sloped roof assumes 4’ setback per building code (may vary)
Total Roof Space: 11,350 sqft Useable Roof Space: 7,900 sqft Installation Type: 1 Tilt Angle: 10 Degrees Orientation: 180 Degrees Approximate DC Watts: 63,200 Solar PV System Size: 63.2kW Basis of Design Equipment: Sharp 250W Mono Solar Modules Sunlink Ballasted Racking System 1x 50kW PV Powered Solar Inverter Cooper Crouse Hinds Disconnecting, Surge Protection Combiner Boxes Total $/watt: $5.02 Estimated Installed Cost: $320,000.00 (rounded to nearest $10,000) Payback (with no incentives): 21.1 years Payback (with incentives): 14 years Building Annual Electrical Usage: 622,970kWh (estimated from 2011 Data) Solar System Annual Output: 75,840kW % offset: 12.17% Applicable Incentives A detailed summary of applicable incentives is included
1. Vermont Small Scale Renewable Energy Incentive Program: $2.25/watt DC up to 10 kW, $1.50/W DC for next 50 kW (up to 60 kW). Maximum incentive $97,500 or up to 50% of project costs (whichever is lower).
2. Electricity will be sold directly to Burlington Electric Department at a rate of $0.20/kWh. There will be a separate meter and service, one bill for the building use that will be offset by the bill for BED credit.
Installation Type DC Watts per
Unit
1. Roof Mount Ballasted Flat
8 sqft
2. Roof Mount Sloped 11.5 sqft 3. Ground Mount 5 sqft 4. Carport 1000 Parking space
UVM Campus Renewable Energy Feasibility Study Building: 407 McAuley Hall 250 Colchester Ave., Burlington VT.
Notes:
1. Structural analysis of the roof for ability to support the proposed solar PV system will be required. This should be coordinated with the structural engineer’s ballast requirement calculations. These have been included in the estimated cost.
2. Installed cost includes all materials, labor, design, engineering…etc. based on observed market conditions in Q2 2012.
3. Financial analysis assumes BED utility
4. Electrical engineering/design of interconnection required (included in est. cost)
5. Roof substrate is assumed to be EPDM Rubber or similar and fully adhered.
6. Roof conditions should be field verified and confirmed to be OK for installation. Coordinate with manufacturer to ensure continuation of warranty if applicable.
7. Avoid roof top fixtures and other roof obstructions.

UVM Campus Renewable Energy Feasibility Study Building: 409 McCann Hall 240 Colchester Ave., Burlington VT. Visit Date: 7/11/2012 By: Rich Smith Building: McCann Hall Address: 240 Colchester Ave., Burlington VT Aerial Photo:

UVM Campus Renewable Energy Feasibility Study Building: 409 McCann Hall 240 Colchester Ave., Burlington VT.
* Measurements are approximate and include all required spacing * Carport calculation requires a minimum of 20 contiguous spots * Flat roof assumes 10’ setbacks per OSHA * Sloped roof assumes 4’ setback per building code (may vary)
Total Roof Space: 4,096 sqft Useable Roof Space: 2,000 sqft Installation Type: 1 Tilt Angle: 10 Degrees Orientation: 180 Degrees Approximate DC Watts: 16,000 Solar PV System Size: 16kW Basis of Design Equipment: Sharp 250W Mono Solar Modules Sunlink Ballasted Racking System 2x SMA 8000W Solar PV Inverters Cooper Crouse Hinds Disconnecting, Surge Protection Combiner Boxes Total $/watt: $6.22 Estimated Installed Cost: $100,000.00 (rounded to nearest $10,000) Payback (with no incentives): 26 years Payback (with incentives): 15 years Building Annual Electrical Usage: 129,001kWh (estimated from 2011 Data) Solar System Annual Output: 19,200kW % offset: 14.88% Applicable Incentives A detailed summary of applicable incentives is included
1. Vermont Small Scale Renewable Energy Incentive Program: $2.25/watt DC up to 10 kW, $1.50/W DC for next 50 kW (up to 60 kW). Maximum incentive $97,500 or up to 50% of project costs (whichever is lower).
2. Electricity will be sold directly to Burlington Electric Department at a rate of $0.20/kWh. There will be a separate meter and service, one bill for the building use that will be offset by the bill for BED credit.
Installation Type DC Watts per
Unit
1. Roof Mount Ballasted Flat
8 sqft
2. Roof Mount Sloped 11.5 sqft 3. Ground Mount 5 sqft 4. Carport 1000 Parking space

UVM Campus Renewable Energy Feasibility Study Building: 409 McCann Hall 240 Colchester Ave., Burlington VT.
Notes:
1. Structural analysis of the roof for ability to support the proposed solar PV system will be required. This should be coordinated with the structural engineer’s ballast requirement calculations. These have been included in the estimated cost.
2. Installed cost includes all materials, labor, design, engineering…etc. based on observed market conditions in Q2 2012.
3. Financial analysis assumes BED utility
4. Electrical engineering/design of interconnection required (included in est. cost)
5. Roof substrate is assumed to be EPDM Rubber or similar and fully adhered.
6. Roof conditions should be field verified and confirmed to be OK for installation. Coordinate with manufacturer to ensure continuation of warranty if applicable.
7. Avoid roof top fixtures and other roof obstructions.

UVM Campus Renewable Energy Feasibility Study Building: 408 Mercy Hall 230 Colchester Ave., Burlington VT. Visit Date: 7/11/2012 By: Rich Smith Building: Mercy Hall Address: 230 Colchester Ave., Burlington VT Aerial Photo:

UVM Campus Renewable Energy Feasibility Study Building: 408 Mercy Hall 230 Colchester Ave., Burlington VT.
* Measurements are approximate and include all required spacing * Carport calculation requires a minimum of 20 contiguous spots * Flat roof assumes 10’ setbacks per OSHA * Sloped roof assumes 4’ setback per building code (may vary)
Total Roof Space: 4,480 sqft Useable Roof Space: 2,800 sqft Installation Type: 1 Tilt Angle: 10 Degrees Orientation: 180 Degrees Approximate DC Watts: 22,400 Solar PV System Size: 22.4kW Basis of Design Equipment: Sharp 250W Mono Solar Modules Sunlink Ballasted Racking System 3x SMA 7000W Solar PV Inverters Cooper Crouse Hinds Disconnecting, Surge Protection Combiner Boxes Total $/watt: $6.02 Estimated Installed Cost: $130,000.00 (rounded to nearest $10,000) Payback (with no incentives): 24.2 years Payback (with incentives): 14 years Building Annual Electrical Usage: 448,899kWh (estimated from 2011 Data) Solar System Annual Output: 26,880kW % offset: 5.99% Applicable Incentives A detailed summary of applicable incentives is included
1. Vermont Small Scale Renewable Energy Incentive Program: $2.25/watt DC up to 10 kW, $1.50/W DC for next 50 kW (up to 60 kW). Maximum incentive $97,500 or up to 50% of project costs (whichever is lower).
2. Electricity will be sold directly to Burlington Electric Department at a rate of $0.20/kWh. There will be a separate meter and service, one bill for the building use that will be offset by the bill for BED credit.
Installation Type DC Watts per
Unit
1. Roof Mount Ballasted Flat
8 sqft
2. Roof Mount Sloped 11.5 sqft 3. Ground Mount 5 sqft 4. Carport 1000 Parking space

UVM Campus Renewable Energy Feasibility Study Building: 408 Mercy Hall 230 Colchester Ave., Burlington VT.
Notes:
1. Structural analysis of the roof for ability to support the proposed solar PV system will be required. This should be coordinated with the structural engineer’s ballast requirement calculations. These have been included in the estimated cost.
2. Installed cost includes all materials, labor, design, engineering…etc. based on observed market conditions in Q2 2012.
3. Financial analysis assumes BED utility
4. Electrical engineering/design of interconnection required (included in est. cost)
5. Roof substrate is assumed to be EPDM Rubber or similar and fully adhered.
6. Roof conditions should be field verified and confirmed to be OK for installation. Coordinate with manufacturer to ensure continuation of warranty if applicable.
7. Avoid roof top fixtures and other roof obstructions.

UVM Campus Renewable Energy Feasibility Study Building: Miller Farm Complex 430 Spear St., Burlington VT Visit Date: 6/21/2012 By: Rich Smith Building: Miller Farm Complex Address: 430 Spear St., Burlington VT Aerial Photo:

* Measurements are approximate and include all required spacing * Carport calculation requires a minimum of 20 contiguous spots * Flat roof assumes 10’ setbacks per OSHA * Sloped roof assumes 4’ setback per building code (may vary)
Total Roof Space: 67,567 sqft Useable Roof Space: 27,199 sqft Installation Type: 2 Tilt Angle: See Specific Site Orientation: See Specific Site Approximate DC Watts: 312,789 Solar PV System Size: 312.79kW Basis of Design Equipment: See Specific Site Report Total $/watt: $4.26 Estimated Installed Cost: $1,303,000.00 (rounded to nearest $10,000) Payback (with no incentives): 18.2 years Payback (with incentives): 13 years Building Annual Electrical Usage: 665,800kWh (2011 Data of Miller Farm Research Complex) Solar System Annual Output: 375,346kW % offset: 56.38% Applicable Incentives A detailed summary of applicable incentives is included
1. Vermont Small Scale Renewable Energy Incentive Program: $2.25/watt DC up to 10 kW, $1.50/W DC for next 50 kW (up to 60 kW). Maximum incentive $97,500 or up to 50% of project costs (whichever is lower).
2. Green Mountain Power net meter tariff, commercial customers will receive $0.06 per kWh.
Installation Type DC Watts per
Unit
1. Roof Mount Ballasted Flat
8 sqft
2. Roof Mount Sloped 11.5 sqft 3. Ground Mount 5 sqft 4. Carport 1000 Parking space

Notes:
1. Structural analysis of the roof for ability to support the proposed solar PV system will be required. These have been included in the estimated cost.
2. Installed cost includes all materials, labor, design, engineering…etc. based on observed market conditions in Q2 2012.
3. Financial analysis assumes GMP utility
4. Electrical engineering/design of interconnection required (included in est. cost)
5. Roof substrate is Corrugated Metal.
6. Roof conditions should be field verified and confirmed to be OK for installation. Coordinate with manufacturer to ensure continuation of warranty if applicable.
7. Avoid roof top fixtures and other roof obstructions.

UVM Campus Renewable Energy Feasibility Study Building: Millis Hall- 67 Spear St, Burlington VT Visit Date: 6/13/2012 By: Ryan Darlow
* Measurements are approximate and include all required spacing * Carport calculation requires a minimum of 20 contiguous spots * Flat roof assumes 10’ setbacks per OSHA * Sloped roof assumes 4’ setback per building code (may vary)
Building: Millis Hall Address: 67 Spear St, Burlington, VT Aerial Photo:
Total Roof Space: 12,500 sqft Useable Roof Space: 5,200 sqft Installation Type: 1 Tilt Angle: 10° Orientation: 170° South Approximate DC Watts: 41,600 Solar PV System Size: 41.6kW Basis of Design Equipment: Sharp 250W Mono Solar Modules SunLink Ballasted Racking System 1x 30 kW PV Powered Solar PV Inverter Cooper Crouse Hinds Disconnecting, Surge Protection Combiner Boxes Total $/watt: $5.53 Estimated Installed Cost: $230,000 (rounded to nearest $10,000) Payback (with no incentives): 23.0 years Payback: 17 years
Installation Type DC Watts per
Unit
1. Roof Mount Ballasted Flat
8 sqft
2. Roof Mount Sloped 11.5 sqft 3. Ground Mount 5 sqft 4. Carport 1000 Parking
space

UVM Campus Renewable Energy Feasibility Study Building: Millis Hall- 67 Spear St, Burlington VT Building Annual Electrical Usage: 350,000 kWh Solar System Annual Output: 49,920 kWh % offset: 14.26 % Applicable Incentives A detailed summary of applicable incentives is included
1. Vermont Small Scale Renewable Energy Incentive Program: $2.25/watt DC up to 10 kW, $1.50/W DC for next 50 kW (up to 60 kW). Maximum incentive $97,500 or up to 50% of project costs (whichever is lower).
2. Burlington Electric Department metering for $.20 per kWh.
Notes:
1. Structural analysis of the roof for ability to support the proposed solar PV system will be required. This should be coordinated with the structural engineer’s ballast requirement calculations. These have been included in the estimated cost.
2. Installed cost includes all materials, labor, design, engineering…etc. based on observed market conditions in Q2 2012.
3. Financial analysis assumes BED utility 4. Electrical engineering/design of interconnection required (included in est. cost) 5. Roof substrate is assumed to be EPDM rubber 6. Roof conditions should be field verified and confirmed to be OK for installation. Coordinate with
manufacturer to ensure continuation 7. Assumed area east, north and west around elevator shaft to be obstructed from sunlight 8. Electricity will be directly fed into the grid, so the building offset is the equivalent amount

UVM Campus Renewable Energy Feasibility Study Building: 145 Music Building 384 S. Prospect St., Burlington VT. Visit Date: 7/05/2012 By: Rich Smith Building: Music Building Address: 384 S. Prospect St., Burlington VT Aerial Photo:
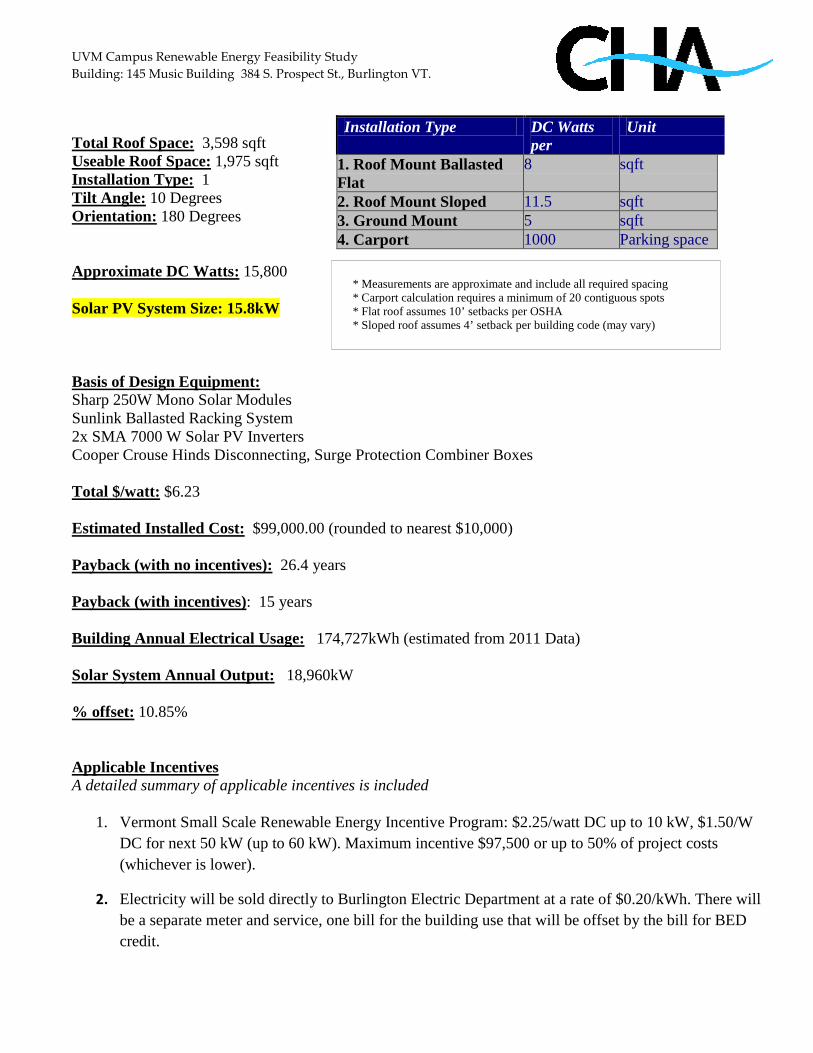
UVM Campus Renewable Energy Feasibility Study Building: 145 Music Building 384 S. Prospect St., Burlington VT.
* Measurements are approximate and include all required spacing * Carport calculation requires a minimum of 20 contiguous spots * Flat roof assumes 10’ setbacks per OSHA * Sloped roof assumes 4’ setback per building code (may vary)
Total Roof Space: 3,598 sqft Useable Roof Space: 1,975 sqft Installation Type: 1 Tilt Angle: 10 Degrees Orientation: 180 Degrees Approximate DC Watts: 15,800 Solar PV System Size: 15.8kW Basis of Design Equipment: Sharp 250W Mono Solar Modules Sunlink Ballasted Racking System 2x SMA 7000 W Solar PV Inverters Cooper Crouse Hinds Disconnecting, Surge Protection Combiner Boxes Total $/watt: $6.23 Estimated Installed Cost: $99,000.00 (rounded to nearest $10,000) Payback (with no incentives): 26.4 years Payback (with incentives): 15 years Building Annual Electrical Usage: 174,727kWh (estimated from 2011 Data) Solar System Annual Output: 18,960kW % offset: 10.85% Applicable Incentives A detailed summary of applicable incentives is included
1. Vermont Small Scale Renewable Energy Incentive Program: $2.25/watt DC up to 10 kW, $1.50/W DC for next 50 kW (up to 60 kW). Maximum incentive $97,500 or up to 50% of project costs (whichever is lower).
2. Electricity will be sold directly to Burlington Electric Department at a rate of $0.20/kWh. There will be a separate meter and service, one bill for the building use that will be offset by the bill for BED credit.
Installation Type DC Watts per
Unit
1. Roof Mount Ballasted Flat
8 sqft
2. Roof Mount Sloped 11.5 sqft 3. Ground Mount 5 sqft 4. Carport 1000 Parking space

UVM Campus Renewable Energy Feasibility Study Building: 145 Music Building 384 S. Prospect St., Burlington VT.
Notes:
1. Structural analysis of the roof for ability to support the proposed solar PV system will be required. This should be coordinated with the structural engineer’s ballast requirement calculations. These have been included in the estimated cost.
2. Installed cost includes all materials, labor, design, engineering…etc. based on observed market conditions in Q2 2012.
3. Financial analysis assumes BED utility
4. Electrical engineering/design of interconnection required (included in est. cost)
5. Roof substrate is assumed to be EPDM Rubber or similar and fully adhered.
6. Roof conditions should be field verified and confirmed to be OK for installation. Coordinate with manufacturer to ensure continuation of warranty if applicable.
7. Avoid roof top fixtures and other roof obstructions.

UVM Campus Renewable Energy Feasibility Study Building: Patrick Gymnasium- 147 Spear St, Burlington VT Visit Date: 6/15/2012 By: Ryan Darlow
* Measurements are approximate and include all required spacing * Carport calculation requires a minimum of 20 contiguous spots * Flat roof assumes 10’ setbacks per OSHA * Sloped roof assumes 4’ setback per building code (may vary)
Building: Patrick Gymnasium Address: 147 Spear St, Burlington, VT Aerial Photo:
Total Roof Space: 69,180 sqft Useable Roof Space: 40,000 sqft Installation Type: 1 Tilt Angle: 10° Orientation: 170° South Approximate DC Watts: 320,000 Solar PV System Size: 320kW
Installation Type DC Watts per
Unit
1. Roof Mount Ballasted Flat
8 sqft
2. Roof Mount Sloped 11.5 sqft 3. Ground Mount 5 sqft 4. Carport 1000 Parking
space

UVM Campus Renewable Energy Feasibility Study Building: Patrick Gymnasium- 147 Spear St, Burlington VT Basis of Design Equipment: Sharp 250W Mono Solar Modules SunLink Ballasted Racking System 1x 250 kW PV Powered Solar PV Inverter Cooper Crouse Hinds Disconnecting, Surge Protection Combiner Boxes Total $/watt: $4.16 Estimated Installed Cost: $1,330,000 (rounded to nearest $10,000) Payback (with no incentives): 17.3 years Payback: 17 years Building Annual Electrical Usage: 3,655,385 kWh* Solar System Annual Output: 384,000 kWh % offset: 10.51 % Applicable Incentives A detailed summary of applicable incentives is included
1. Vermont Small Scale Renewable Energy Incentive Program: $2.25/watt DC up to 10 kW, $1.50/W DC for next 50 kW (up to 60 kW). Maximum incentive $97,500 or up to 50% of project costs (whichever is lower).
2. Burlington Electric Department metering for $.20 per kWh.
Notes:
1. Structural analysis of the roof for ability to support the proposed solar PV system will be required. This should be coordinated with the structural engineer’s ballast requirement calculations. These have been included in the estimated cost.
2. Installed cost includes all materials, labor, design, engineering…etc. based on observed market conditions in Q2 2012.
3. Financial analysis assumes BED utility 4. Electrical engineering/design of interconnection required (included in est. cost) 5. Roof substrate is assumed to be EPDM rubber 6. Roof conditions should be field verified and confirmed to be OK for installation. Coordinate with
manufacturer to ensure continuation 7. Assumed minimal shading from Gutterson Fieldhouse, lower area may be significantly shaded 8. *Annual electric usage is for the entire complex including the fieldhouse and tennis courts. 9. Electricity will be directly fed into the grid, so the building offset is the equivalent amount

UVM Campus Renewable Energy Feasibility Study Building: Patterson Hall- 436 South Prospect St, Burlington VT Visit Date: 7/5/2012 By: Ryan Darlow
* Measurements are approximate and include all required spacing * Carport calculation requires a minimum of 20 contiguous spots * Flat roof assumes 10’ setbacks per OSHA * Sloped roof assumes 4’ setback per building code (may vary)
Building: Patterson Hall Address: 436 South Prospect St, Burlington, VT Aerial Photo:
Total Roof Space: 8,294 sqft Useable Roof Space: 3,250 sqft Installation Type: 1 Roof Slope: Flat (0°) Orientation: 165° South Approximate DC Watts: 26,000 Solar PV System Size: 26kW Basis of Design Equipment: Sharp 250W Mono Solar Modules SunLink Ballasted Racking System 3x SMA 8000 W Solar PV Inverters Cooper Crouse Hinds Disconnecting, Surge Protection Combiner Boxes
Installation Type DC Watts per
Unit
1. Roof Mount Ballasted Flat
8 sqft
2. Roof Mount Sloped 11.5 sqft 3. Ground Mount 5 sqft 4. Carport 1000 Parking
space
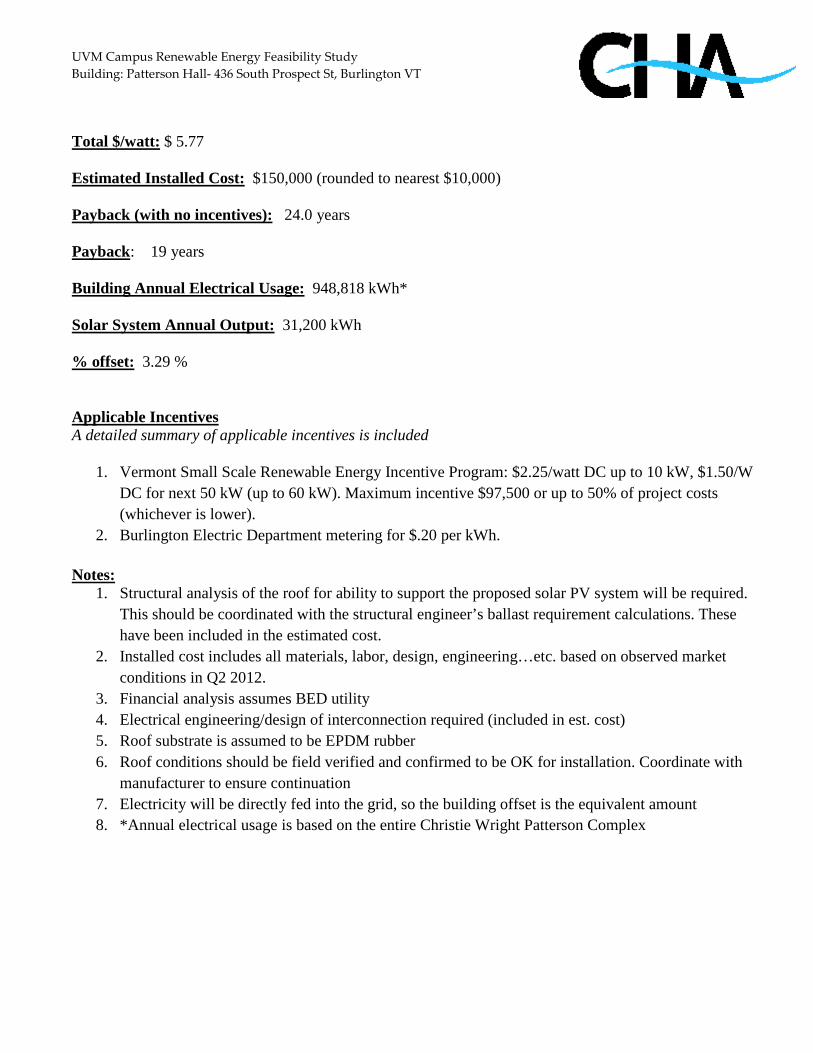
UVM Campus Renewable Energy Feasibility Study Building: Patterson Hall- 436 South Prospect St, Burlington VT Total $/watt: $ 5.77 Estimated Installed Cost: $150,000 (rounded to nearest $10,000) Payback (with no incentives): 24.0 years Payback: 19 years Building Annual Electrical Usage: 948,818 kWh* Solar System Annual Output: 31,200 kWh % offset: 3.29 % Applicable Incentives A detailed summary of applicable incentives is included
1. Vermont Small Scale Renewable Energy Incentive Program: $2.25/watt DC up to 10 kW, $1.50/W DC for next 50 kW (up to 60 kW). Maximum incentive $97,500 or up to 50% of project costs (whichever is lower).
2. Burlington Electric Department metering for $.20 per kWh. Notes:
1. Structural analysis of the roof for ability to support the proposed solar PV system will be required. This should be coordinated with the structural engineer’s ballast requirement calculations. These have been included in the estimated cost.
2. Installed cost includes all materials, labor, design, engineering…etc. based on observed market conditions in Q2 2012.
3. Financial analysis assumes BED utility 4. Electrical engineering/design of interconnection required (included in est. cost) 5. Roof substrate is assumed to be EPDM rubber 6. Roof conditions should be field verified and confirmed to be OK for installation. Coordinate with
manufacturer to ensure continuation 7. Electricity will be directly fed into the grid, so the building offset is the equivalent amount 8. *Annual electrical usage is based on the entire Christie Wright Patterson Complex

UVM Campus Renewable Energy Feasibility Study Building: Ready Hall Visit Date: 7/15/2012 By: Jack Lehrecke
* Measurements are approximate and include all required spacing * Carport calculation requires a minimum of 20 contiguous spots * Flat roof assumes 10’ setbacks per OSHA * Sloped roof assumes 4’ setback per building code (may vary)
Building: Ready Hall Address: 250 Colchester Ave, Burlington, VT Photo:
Total Roof Space: 6,300 sqft Useable Roof Space: 4,570 sqft Installation Type: 1 Roof Slope: 0° Orientation: 170° (South) Approximate DC Watts: 36,560
Installation Type DC Watts per
Unit
1. Roof Mount Ballasted Flat
8 sqft
2. Roof Mount Sloped 11.5 sqft 3. Ground Mount 5 sqft 4. Carport 1000 Parking
space

UVM Campus Renewable Energy Feasibility Study Building: Ready Hall Solar PV System Size: 36.56kW Basis of Design Equipment: Sharp 250W Mono Solar Modules SunLink Ballasted Racking System PVP 30 kW Solar PV Inverter Cooper Crouse Hinds Disconnecting, Surge Protection Combiner Boxes Total $/watt: $5.47 Estimated Installed Cost: $200,000 (rounded to nearest $10,000) Payback (with no incentives): 22.8 years Payback: 14 years Building Annual Electrical Usage: 129,000 kWh Solar System Annual Output: 43,872 kWh % offset: % 34.01 Applicable Incentives A detailed summary of applicable incentives is included
1. Vermont Small Scale Renewable Energy Incentive Program: $2.25/watt DC up to 10 kW, $1.50/W DC for next 50 kW (up to 60 kW). Maximum incentive $97,500 or up to 50% of project costs (whichever is lower).
2. Burlington Electric Department feed in tariff purchases PV produced power at 0.20 $/kWh, the offset calculation compares this power, which is fed directly into the grid, against the adjacent structure’s utility demand.
Notes:
1. Structural analysis of the roof for ability to support the proposed solar PV system will be required. This should be coordinated with the structural engineer’s ballast requirement calculations. These have been included in the estimated cost.
2. Installed cost includes all materials, labor, design, engineering…etc. based on observed market conditions in Q2 2012.
3. Financial analysis assumes BED utility 4. Electrical engineering/design of interconnection required (included in est. cost) 5. Roof substrate is assumed to be EPDM Rubber or similar and fully adhered. 6. Roof conditions should be field verified and confirmed to be OK for installation. Coordinate
with manufacturer to ensure continuation.

UVM Campus Renewable Energy Feasibility Study Building: Rowell Hall, 106 Carrigan Dr. Burlington VT. Visit Date: 6/13/2012 By: Rich Smith Building: 74 Rowell Hall Address: 106 Carrigan Dr., Burlington VT Aerial Photo:

UVM Campus Renewable Energy Feasibility Study Building: Rowell Hall, 106 Carrigan Dr. Burlington VT. Installation Type DC Watts per Unit
1. Roof Mount Ballasted Flat 8 sqft 2. Roof Mount Sloped 11.5 sqft 3. Ground Mount 5 sqft 4. Carport 1000 Parking space * Measurements are approximate and include all required spacing * Carport calculation requires a minimum of 20 contiguous spots * Flat roof assumes 10’ setbacks per OSHA * Sloped roof assumes 4’ setback per building code (may vary) Total Roof Space: 20,164 sqft Useable Roof Space: 13,144 sqft Installation Type: 1 Tilt Angle: 10 Degrees Orientation: 170 Degrees Approximate DC Watts: 105,152 Solar PV System Size: 105kW Basis of Design Equipment: Sharp 250W Mono Solar Modules SunLink Ballasted Racking System 1x 100kW PV Powered Solar PV Inverter Cooper Crouse Hinds Disconnecting, Surge Protection Combiner Boxes Total $/watt: $4.74 Estimated Installed Cost: $500,000.00 (rounded to nearest $10,000) Payback (with no incentives): 19.8 years Payback (with incentives): 17 years Building Annual Electrical Usage: 5,515,920kWh (estimated from 2011 Data) Solar System Annual Output: 126,182kW % offset: 2.29%

UVM Campus Renewable Energy Feasibility Study Building: Rowell Hall, 106 Carrigan Dr. Burlington VT. Applicable Incentives A detailed summary of applicable incentives is included
1. Vermont Small Scale Renewable Energy Incentive Program: $2.25/watt DC up to 10 kW, $1.50/W DC for next 50 kW (up to 60 kW). Maximum incentive $97,500 or up to 50% of project costs (whichever is lower).
2. Electricity will be sold directly to Burlington Electric Department at a rate of $0.20/kWh. There will be a separate meter and service, one bill for the building use that will be offset by the bill for BED credit.
Notes:
1. Structural analysis of the roof for ability to support the proposed solar PV system will be required. This should be coordinated with the structural engineer’s ballast requirement calculations. These have been included in the estimated cost.
2. Installed cost includes all materials, labor, design, engineering…etc. based on observed market conditions in Q2 2012.
3. Financial analysis assumes BED utility 4. Electrical engineering/design of interconnection required (included in est. cost) 5. Roof substrate is assumed to be EPDM Rubber or similar and fully adhered. 6. Roof conditions should be field verified and confirmed to be OK for installation. Coordinate with
manufacturer to ensure continuation of warranty if applicable. 7. Avoid roof top fixtures and other roof obstructions.

UVM Campus Renewable Energy Feasibility Study Building: Royal Tyler Theatre 116 University Place, Burlington VT 05405 Visit Date: 5/31/2012 By: Jack Lehrecke
* Measurements are approximate and include all required spacing * Carport calculation requires a minimum of 20 contiguous spots * Flat roof assumes 10’ setbacks per OSHA * Sloped roof assumes 4’ setback per building code (may vary)
Building: Royal Tyler Theatre Address: 116 University Place, Burlington VT Aerial Photo:
Total Roof Space: 12,800sqft Useable Roof Space: 8,760sqft Installation Type: 2 Roof Slope: 30° Orientation: 180° Approximate DC Watts: 100,740 Solar PV System Size: 100.74kW Basis of Design Equipment: Sharp 250W Mono Solar Modules Unirac Racking System PVP 100kW Powered Solar PV Inverter Cooper Crouse Hinds Disconnecting, Surge Protection Combiner Boxes
Installation Type DC Watts per
Unit
1. Roof Mount Ballasted Flat
8 sqft
2. Roof Mount Sloped 11.5 sqft 3. Ground Mount 5 sqft 4. Carport 1000 Parking
space

UVM Campus Renewable Energy Feasibility Study Building: Royal Tyler Theatre 116 University Place, Burlington VT 05405 Market Conditions Total $/watt: $4.99 Estimated Installed Cost: $480,000 (rounded to nearest $10,000) Payback (with no incentives): 19.9 years Payback (with incentives): 17 years Building Annual Electrical Usage: 266,062 kWh Solar System Annual Output: 84,096 kWh % offset: 31.61% Applicable Incentives A detailed summary of applicable incentives is included 1.Vermont Small Scale Renewable Energy Incentive Program: $2.25/watt DC up to 10
kW, $1.50/W DC for next 50 kW (up to 60 kW). Maximum incentive $97,500 or up to 50% of project costs (whichever is lower).
2.Burlington Electric Department feed in tariff purchases PV produced power at 0.20 $/kWh, the offset calculation compares this power, which is fed directly into the grid, against the adjacent structure’s utility demand.
Notes: 1. Structural analysis of the roof for ability to support the proposed solar PV system will
be required. This should be coordinated with the structural engineer’s ballast requirement calculations. These have been included in the estimated cost.
2. Installed cost includes all materials, labor, design, engineering…etc. based on observed market conditions in Q2 2012.
3. Financial analysis assumes BED utility 4. Electrical engineering/design of interconnection required (included in est. cost) 5. Roof substrate is assumed to be shingles 6.Roof conditions should be field verified and confirmed to be OK for installation.
Coordinate with manufacturer to ensure continuation 7.Avoid chimney on the eastern side of the western roof as well as the shaded area it
creates on the lower eastern roof. 8.Utility rate assumes an annual increase of 3%

UVM Campus Renewable Energy Feasibility Study Building: Simpson Hall- 438 South Prospect St, Burlington VT Visit Date: 7/11/2012 By: Ryan Darlow
* Measurements are approximate and include all required spacing * Carport calculation requires a minimum of 20 contiguous spots * Flat roof assumes 10’ setbacks per OSHA * Sloped roof assumes 4’ setback per building code (may vary)
Building: Simpson Hall Address: 438 South Prospect St, Burlington, VT Aerial Photo:
Total Roof Space: 14,025 sqft Useable Roof Space: 8,625 sqft Installation Type: 1 Roof Slope: Flat (0°) Orientation: 85° East
Installation Type DC Watts per
Unit
1. Roof Mount Ballasted Flat
8 sqft
2. Roof Mount Sloped 11.5 sqft 3. Ground Mount 5 sqft 4. Carport 1000 Parking
space

UVM Campus Renewable Energy Feasibility Study Building: Simpson Hall- 438 South Prospect St, Burlington VT Approximate DC Watts: 69,000 Solar PV System Size: 69 kW Basis of Design Equipment: Sharp 250W Mono Solar Modules SunLink Ballasted Racking System 1x 75 kW PV Powered Solar PV Inverter Cooper Crouse Hinds Disconnecting, Surge Protection Combiner Boxes Total $/watt: $4.93 Estimated Installed Cost: $340,000 (rounded to nearest $10,000) Payback (with no incentives): 20.5 years Payback: 16 years Building Annual Electrical Usage: 638,795 kWh* Solar System Annual Output: 82,800 kWh % offset: 12.96 % Applicable Incentives A detailed summary of applicable incentives is included
1. Vermont Small Scale Renewable Energy Incentive Program: $2.25/watt DC up to 10 kW, $1.50/W DC for next 50 kW (up to 60 kW). Maximum incentive $97,500 or up to 50% of project costs (whichever is lower).
2. Burlington Electric Department metering for $.20 per kWh. Notes:
1. Structural analysis of the roof for ability to support the proposed solar PV system will be required. This should be coordinated with the structural engineer’s ballast requirement calculations. These have been included in the estimated cost.
2. Installed cost includes all materials, labor, design, engineering…etc. based on observed market conditions in Q2 2012.
3. Financial analysis assumes BED utility 4. Electrical engineering/design of interconnection required (included in est. cost) 5. Roof substrate is assumed to be EPDM rubber 6. Roof conditions should be field verified and confirmed to be OK for installation. Coordinate with
manufacturer to ensure continuation 7. Electricity will be directly fed into the grid, so the building offset is the equivalent amount

UVM Campus Renewable Energy Feasibility Study Building: Simpson Hall- 438 South Prospect St, Burlington VT
8. *Annual electrical usage is for entire Mason Simpson Hamilton Complex

UVM Campus Renewable Energy Feasibility Study Building: Tennis Courts -147 Spear St, Burlington VT Visit Date: 6/15/2012 By: Ryan Darlow Building: Tennis Courts Address: 147 Spear St, Burlington, VT Aerial Photo:

* Measurements are approximate and include all required spacing * Carport calculation requires a minimum of 20 contiguous spots * Flat roof assumes 10’ setbacks per OSHA * Sloped roof assumes 4’ setback per building code (may vary)
Total Roof Space: 39,000 sqft Useable Roof Space: 30,500 sqft Installation Type: 2 Roof Slope: 15° Orientation: 80° East, 260° West Approximate DC Watts: 350,750 Solar PV System Size: 350.75 kW Basis of Design Equipment: Sharp 250W Mono Solar Modules Unirac Racking System 1x 50 kW PV Powered Solar PV Inverter 1x 250 kW PV Powered Solar PV Inverter Cooper Crouse Hinds Disconnecting, Surge Protection Combiner Boxes Total $/watt: $4.13 Estimated Installed Cost: $1,450,000 (rounded to nearest $10,000) Payback (with no incentives): 17.2 years Payback: 17 years Building Annual Electrical Usage: 3,655,385 kWh Solar System Annual Output: 420,900 kWh % offset: 11.51% Applicable Incentives A detailed summary of applicable incentives is included
1. Vermont Small Scale Renewable Energy Incentive Program: $2.25/watt DC up to 10 kW, $1.50/W DC for next 50 kW (up to 60 kW). Maximum incentive $97,500 or up to 50% of project costs (whichever is lower).
2. Burlington Electric Department metering for $.20 per kWh.
Notes: 1. Structural analysis of the roof for ability to support the proposed solar PV system will be required.
This should be coordinated with the structural engineer’s ballast requirement calculations. These have been included in the estimated cost.
Installation Type DC Watts per
Unit
1. Roof Mount Ballasted Flat
8 sqft
2. Roof Mount Sloped 11.5 sqft 3. Ground Mount 5 sqft 4. Carport 1000 Parking
space

2. Installed cost includes all materials, labor, design, engineering…etc. based on observed market conditions in Q2 2012.
3. Financial analysis assumes BED utility 4. Electrical engineering/design of interconnection required (included in est. cost) 5. Roof substrate is assumed to be corrugated metal 6. Roof conditions should be field verified and confirmed to be OK for installation. Coordinate with
manufacturer to ensure continuation 7. East slope is partially shaded by basketball courts 8. Assumed that panels could be built over the existing metal frames for vents/skylights on the roof
surface 9. Annual electric usage is for the entire building complex including the fieldhouse, fitness center and
gymnasium 10. Electricity will be directly fed into the grid, so the building offset is the equivalent amount

UVM Campus Renewable Energy Feasibility Study Building: Track Building- Spear St, Burlington VT Visit Date: 6/15/2012 By: Ryan Darlow
* Measurements are approximate and include all required spacing * Carport calculation requires a minimum of 20 contiguous spots * Flat roof assumes 10’ setbacks per OSHA * Sloped roof assumes 4’ setback per building code (may vary)
Building: Track Building Address: Spear St, Burlington, VT Aerial Photo:
Total Roof Space: 3375 sqft Useable Roof Space: 2479 sqft Installation Type: 2 Roof Slope: 15° Orientation: 170° South Approximate DC Watts: 28,508.5 Solar PV System Size: 28.5kW Basis of Design Equipment: Sharp 250W Mono Solar Modules Unirac Racking System 3x SMA 10,000 W Solar PV Inverters Cooper Crouse Hinds Disconnecting, Surge Protection Combiner Boxes Total $/watt: $ 5.61 Estimated Installed Cost: $160,000 (rounded to nearest $10,000) Payback (with no incentives): 23.4 years Payback: 18 years
Installation Type DC Watts per
Unit
1. Roof Mount Ballasted Flat
8 sqft
2. Roof Mount Sloped 11.5 sqft 3. Ground Mount 5 sqft 4. Carport 1000 Parking
space

UVM Campus Renewable Energy Feasibility Study Building: Track Building- Spear St, Burlington VT Building Annual Electrical Usage: Unknown Solar System Annual Output: 34,210.2 kWh % offset: Unknown Applicable Incentives A detailed summary of applicable incentives is included
1. Vermont Small Scale Renewable Energy Incentive Program: $2.25/watt DC up to 10 kW, $1.50/W DC for next 50 kW (up to 60 kW). Maximum incentive $97,500 or up to 50% of project costs (whichever is lower).
2. Burlington Electric Department metering for $.20 per kWh.
Notes:
1. Structural analysis of the roof for ability to support the proposed solar PV system will be required. This should be coordinated with the structural engineer’s ballast requirement calculations. These have been included in the estimated cost.
2. Installed cost includes all materials, labor, design, engineering…etc. based on observed market conditions in Q2 2012.
3. Financial analysis assumes BED utility 4. Electrical engineering/design of interconnection required (included in est. cost) 5. Roof substrate is assumed to be standing seem metal 6. Roof conditions should be field verified and confirmed to be OK for installation. Coordinate with
manufacturer to ensure continuation 7. There is no current data for the electrical demand from this building, however if it is connected with
the scoreboard or the gymnasium complex it may have a significant demand 8. Electricity will be directly fed into the grid, so the building offset is the equivalent amount

UVM Campus Renewable Energy Feasibility Study Building: Trinity Cottage Visit Date: 7/16/2012 By: Jack Lehrecke
* Measurements are approximate and include all required spacing * Carport calculation requires a minimum of 20 contiguous spots * Flat roof assumes 10’ setbacks per OSHA * Sloped roof assumes 4’ setback per building code (may vary)
Building: Trinity Cottages Address: 256 Colchester Ave, Burlington VT Aerial Photo:
Total Roof Space: 774 sqft Useable Roof Space: 550sqft Installation Type: 2 Roof Slope: 30° Orientation: 160°, 250° Approximate DC Watts: 6,325
Installation Type DC Watts per
Unit
1. Roof Mount Ballasted Flat
8 sqft
2. Roof Mount Sloped 11.5 sqft 3. Ground Mount 5 sqft 4. Carport 1000 Parking
space

UVM Campus Renewable Energy Feasibility Study Building: Trinity Cottage Visit Date: 7/16/2012 By: Jack Lehrecke Solar PV System Size: 6.325kW Basis of Design Equipment: Sharp 250W Mono Solar Modules Unirack Racking System SMA 7000kW Powered Solar PV Inverter Cooper Crouse Hinds Disconnecting, Surge Protection Combiner Boxes Market Conditions Total $/watt: $7.91 Estimated Installed Cost: $50,000 (rounded to nearest $10,000) Payback (with no incentives): 32.9 years Payback (with incentives): 27 years Building Annual Electrical Usage: 13,153 kWh Solar System Annual Output: 7,590 kWh % offset: 57.71% Applicable Incentives A detailed summary of applicable incentives is included 1.Vermont Small Scale Renewable Energy Incentive Program: $2.25/watt DC up to 10
kW, $1.50/W DC for next 50 kW (up to 60 kW). Maximum incentive $97,500 or up to 50% of project costs (whichever is lower).
2.Burlington Electric Department feed in tariff purchases PV produced power at 0.20 $/kWh, the offset calculation compares this power, which is fed directly into the grid, against the adjacent structure’s utility demand.
Notes: 1. Structural analysis of the roof for ability to support the proposed solar PV system will
be required. This should be coordinated with the structural engineer’s ballast requirement calculations. These have been included in the estimated cost.
2. Installed cost includes all materials, labor, design, engineering…etc. based on observed market conditions in Q2 2012.
3. Financial analysis assumes BED utility 4. Electrical engineering/design of interconnection required (included in est. cost) 5. Roof substrate is assumed to be shingles 6.Roof conditions should be field verified and confirmed to be OK for installation.
Coordinate with manufacturer to ensure continuation 7.Avoid northern portion of the roof due to shading from adjacent tree

UVM Campus Renewable Energy Feasibility Study Building: Trinity Cottage Visit Date: 7/16/2012 By: Jack Lehrecke 8.Utility rate assumes an annual increase of 3%

UVM Campus Renewable Energy Feasibility Study Building: Tupper Hall- 31 Spear St, Burlington VT Visit Date: 6/13/2012 By: Ryan Darlow
* Measurements are approximate and include all required spacing * Carport calculation requires a minimum of 20 contiguous spots * Flat roof assumes 10’ setbacks per OSHA * Sloped roof assumes 4’ setback per building code (may vary)
Building: Tupper Hall Address: 31 Spear St, Burlington, VT Aerial Photo:
Total Roof Space: 5,760 sqft Useable Roof Space: 1,500 sqft Installation Type: 1 Tilt Angle: 10° Orientation: 165° South Approximate DC Watts: 12,000 Solar PV System Size: 12kW
Installation Type DC Watts per
Unit
1. Roof Mount Ballasted Flat
8 sqft
2. Roof Mount Sloped 11.5 sqft 3. Ground Mount 5 sqft 4. Carport 1000 Parking
space

UVM Campus Renewable Energy Feasibility Study Building: Tupper Hall- 31 Spear St, Burlington VT Basis of Design Equipment: Sharp 250W Mono Solar Modules SunLink Ballasted Racking System 2x SMA 6000 W Solar PV Inverters Cooper Crouse Hinds Disconnecting, Surge Protection Combiner Boxes Total $/watt: $6.67 Estimated Installed Cost: $80,000 (rounded to nearest $10,000) Payback (with no incentives): 27.8 years Payback: 22 years Building Annual Electrical Usage: 197,227 kWh* Solar System Annual Output: 14,400 kWh % offset: 7.3% Applicable Incentives A detailed summary of applicable incentives is included
1. Vermont Small Scale Renewable Energy Incentive Program: $2.25/watt DC up to 10 kW, $1.50/W DC for next 50 kW (up to 60 kW). Maximum incentive $97,500 or up to 50% of project costs (whichever is lower).
2. Burlington Electric Department metering for $.20 per kWh.
Notes:
1. Structural analysis of the roof for ability to support the proposed solar PV system will be required. This should be coordinated with the structural engineer’s ballast requirement calculations. These have been included in the estimated cost.
2. Installed cost includes all materials, labor, design, engineering…etc. based on observed market conditions in Q2 2012.
3. *Estimated electrical use based on use from entire M-A-T complex 4. Financial analysis assumes BED utility 5. Electrical engineering/design of interconnection required (included in est. cost) 6. Roof substrate is assumed to be EPDM rubber 7. Roof conditions should be field verified and confirmed to be OK for installation. Coordinate with
manufacturer to ensure continuation 8. Electricity will be directly fed into the grid, so the building offset is the equivalent amount

UVM Campus Renewable Energy Feasibility Study Building: University Heights North Complex Visit Date: 7/3/2012 By: Jack Lehrecke
* Measurements are approximate and include all required spacing * Carport calculation requires a minimum of 20 contiguous spots * Flat roof assumes 10’ setbacks per OSHA * Sloped roof assumes 4’ setback per building code (may vary)
Building: University Heights North 1 Address: 30 University Heights, Burlington, VT Photo: Arial
Total Roof Space: 9,800 sqft Useable Roof Space: 6,000 sqft Installation Type: 2 Roof Slope: 55°, 55°, 55°, 50° * Orientation: 190°, 190°, 175°, 85° * Approximate DC Watts: 69,000 Solar PV System Size: 69.0kW
Installation Type DC Watts per
Unit
1. Roof Mount Ballasted Flat
8 sqft
2. Roof Mount Sloped 11.5 sqft 3. Ground Mount 5 sqft 4. Carport 1000 Parking
space
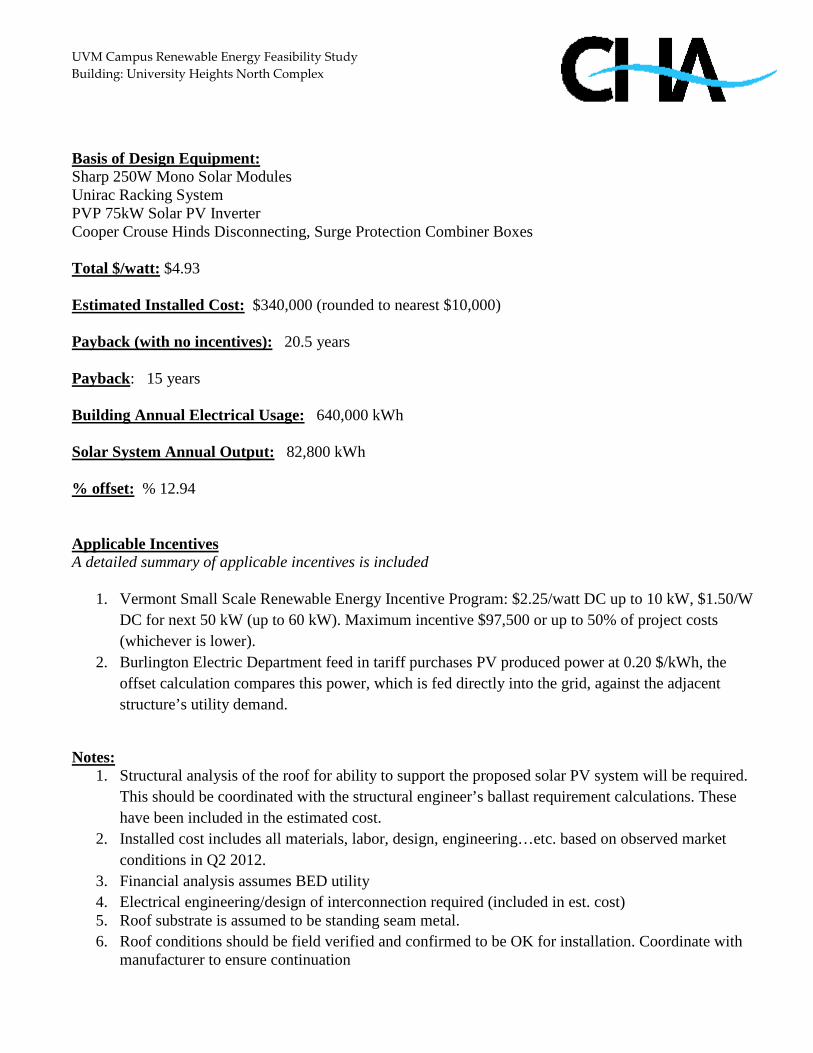
UVM Campus Renewable Energy Feasibility Study Building: University Heights North Complex Basis of Design Equipment: Sharp 250W Mono Solar Modules Unirac Racking System PVP 75kW Solar PV Inverter Cooper Crouse Hinds Disconnecting, Surge Protection Combiner Boxes Total $/watt: $4.93 Estimated Installed Cost: $340,000 (rounded to nearest $10,000) Payback (with no incentives): 20.5 years Payback: 15 years Building Annual Electrical Usage: 640,000 kWh Solar System Annual Output: 82,800 kWh % offset: % 12.94 Applicable Incentives A detailed summary of applicable incentives is included
1. Vermont Small Scale Renewable Energy Incentive Program: $2.25/watt DC up to 10 kW, $1.50/W DC for next 50 kW (up to 60 kW). Maximum incentive $97,500 or up to 50% of project costs (whichever is lower).
2. Burlington Electric Department feed in tariff purchases PV produced power at 0.20 $/kWh, the offset calculation compares this power, which is fed directly into the grid, against the adjacent structure’s utility demand.
Notes:
1. Structural analysis of the roof for ability to support the proposed solar PV system will be required. This should be coordinated with the structural engineer’s ballast requirement calculations. These have been included in the estimated cost.
2. Installed cost includes all materials, labor, design, engineering…etc. based on observed market conditions in Q2 2012.
3. Financial analysis assumes BED utility 4. Electrical engineering/design of interconnection required (included in est. cost) 5. Roof substrate is assumed to be standing seam metal. 6. Roof conditions should be field verified and confirmed to be OK for installation. Coordinate with
manufacturer to ensure continuation

UVM Campus Renewable Energy Feasibility Study Building: University Heights North Complex
7. *Slope varies slightly for the easterly facing roof which appears to be at a 50° angle whereas all south and west facing slopes are 55°
8. *Both orientation and slope values refer to each of the four different adjacent buildings from east to west respectively
9. Validity of reported slopes should be confirmed through building plans prior to construction 10. Racking system to be attached via ‘S-5’ clips or similar. 11. Confirm loading of ‘S-5’ clips with the manufacturer or structural engineer.

UVM Campus Renewable Energy Feasibility Study Building: University Heights North Complex Visit Date: 7/3/2012 By: Jack Lehrecke Building: University Heights North 2&3 Address: 50 University Heights, Burlington, VT Photo: Arial

UVM Campus Renewable Energy Feasibility Study Building: University Heights North Complex
* Measurements are approximate and include all required spacing * Carport calculation requires a minimum of 20 contiguous spots * Flat roof assumes 10’ setbacks per OSHA * Sloped roof assumes 4’ setback per building code (may vary)
West Facing Roof
Total Roof Space: 14,500 sqft Useable Roof Space: 8,750 sqft Installation Type: 2 Roof Slope: 55°* Orientation: 190°, 280°, 190°, 175° * Approximate DC Watts: 100,625 Solar PV System Size: 100.625kW
Installation Type DC Watts per
Unit
1. Roof Mount Ballasted Flat
8 sqft
2. Roof Mount Sloped 11.5 sqft 3. Ground Mount 5 sqft 4. Carport 1000 Parking
space

UVM Campus Renewable Energy Feasibility Study Building: University Heights North Complex Basis of Design Equipment: Sharp 250W Mono Solar Modules Unirac Racking System PVP 100kW Solar PV Inverter Cooper Crouse Hinds Disconnecting, Surge Protection Combiner Boxes Total $/watt: $4.77 Estimated Installed Cost: $480,000 (rounded to nearest $10,000) Payback (with no incentives): 19.9 years Payback: 16 years Building Annual Electrical Usage: 666,900 kWh Solar System Annual Output: 120,750 kWh % offset: % 18.11 Applicable Incentives A detailed summary of applicable incentives is included
1. Vermont Small Scale Renewable Energy Incentive Program: $2.25/watt DC up to 10 kW, $1.50/W DC for next 50 kW (up to 60 kW). Maximum incentive $97,500 or up to 50% of project costs (whichever is lower).
2. Burlington Electric Department feed in tariff purchases PV produced power at 0.20 $/kWh, the offset calculation compares this power, which is fed directly into the grid, against the adjacent structure’s utility demand.
Notes:
1. Structural analysis of the roof for ability to support the proposed solar PV system will be required. This should be coordinated with the structural engineer’s ballast requirement calculations. These have been included in the estimated cost.
2. Installed cost includes all materials, labor, design, engineering…etc. based on observed market conditions in Q2 2012.
3. Financial analysis assumes BED utility 4. Electrical engineering/design of interconnection required (included in est. cost) 5. Roof substrate is assumed to be standing seam metal 6. Roof conditions should be field verified and confirmed to be OK for installation. Coordinate
with manufacturer to ensure continuation 7. *Slope varies slightly for the easterly facing roof which appears to be at a 50° angle whereas all
south and west facing slopes are 55°

UVM Campus Renewable Energy Feasibility Study Building: University Heights North Complex
8. *Both orientation and slope values refer to each of the four different adjacent buildings from east to west respectively
9. Validity of reported slopes should be confirmed through building plans prior to construction

UVM Campus Renewable Energy Feasibility Study Building: University Heights South Complex Visit Date: 6/22/2012 By: Jack Lehrecke
* Measurements are approximate and include all required spacing * Carport calculation requires a minimum of 20 contiguous spots * Flat roof assumes 10’ setbacks per OSHA * Sloped roof assumes 4’ setback per building code (may vary)
Building: University Heights South 1 Address: 50 University Heights, Burlington, VT Photo:
Total Roof Space: 9,500 sqft Useable Roof Space: 6,200 sqft Installation Type: 2 Roof Slope: 55°, 55°, 50° * Orientation: 170°, 180°, 90° * Approximate DC Watts: 71,300 Solar PV System Size: 71.3kW
Installation Type DC Watts per
Unit
1. Roof Mount Ballasted Flat
8 sqft
2. Roof Mount Sloped 11.5 sqft 3. Ground Mount 5 sqft 4. Carport 1000 Parking
space

UVM Campus Renewable Energy Feasibility Study Building: University Heights South Complex Basis of Design Equipment: Sharp 250W Mono Solar Modules Unirac Racking System PVP 75 kW Solar PV Inverter Cooper Crouse Hinds Disconnecting, Surge Protection Combiner Boxes Total $/watt: $4.91 Estimated Installed Cost: $350,000 (rounded to nearest $10,000) Payback (with no incentives): 20.5 years Payback: 15 years Building Annual Electrical Usage: 497,000 kWh Solar System Annual Output: 85,560 kWh % offset: % 17.22 Applicable Incentives A detailed summary of applicable incentives is included
1. Vermont Small Scale Renewable Energy Incentive Program: $2.25/watt DC up to 10 kW, $1.50/W DC for next 50 kW (up to 60 kW). Maximum incentive $97,500 or up to 50% of project costs (whichever is lower).
2. Burlington Electric Department feed in tariff purchases PV produced power at 0.20 $/kWh, the offset calculation compares this power, which is fed directly into the grid, against the adjacent structure’s utility demand.
Notes:
1. Structural analysis of the roof for ability to support the proposed solar PV system will be required. This should be coordinated with the structural engineer’s ballast requirement calculations. These have been included in the estimated cost.
2. Installed cost includes all materials, labor, design, engineering…etc. based on observed market conditions in Q2 2012.
3. Financial analysis assumes BED utility 4. Electrical engineering/design of interconnection required (included in est. cost) 5. Roof substrate is assumed to be standing seam metal 6. Roof conditions should be field verified and confirmed to be OK for installation. Coordinate
with manufacturer to ensure continuation 7. *Slope varies slightly for the easterly facing roof which appears to be at a 50° angle whereas all
south facing slopes are 55°

UVM Campus Renewable Energy Feasibility Study Building: University Heights South Complex
8. *Both orientation and slope values refer to each of the three different adjacent buildings from east to west respectively
9. Validity of reported slopes should be confirmed through building plans prior to construction

UVM Campus Renewable Energy Feasibility Study Building: University Heights South Complex Visit Date: 6/22/2012 By: Jack Lehrecke
Building: University Heights South Address: 70 University Heights, Burlington, VT Photo: Arial

UVM Campus Renewable Energy Feasibility Study Building: University Heights South Complex
* Measurements are approximate and include all required spacing * Carport calculation requires a minimum of 20 contiguous spots * Flat roof assumes 10’ setbacks per OSHA * Sloped roof assumes 4’ setback per building code (may vary)
West Facing Roof
Total Roof Space: 15,000 sqft Useable Roof Space: 9,800 sqft Installation Type: 2 Roof Slope: 55°, 55°, 55°, 50° * Orientation: 250°, 160°, 175°, 85° * Approximate DC Watts: 112,700 Solar PV System Size: 112.7kW Basis of Design Equipment: Sharp 250W Mono Solar Modules
Installation Type DC Watts per
Unit
1. Roof Mount Ballasted Flat
8 sqft
2. Roof Mount Sloped 11.5 sqft 3. Ground Mount 5 sqft 4. Carport 1000 Parking
space

UVM Campus Renewable Energy Feasibility Study Building: University Heights South Complex Unirac Racking System PVP 100kW Solar PV Inverter Cooper Crouse Hinds Disconnecting, Surge Protection Combiner Boxes Total $/watt: $4.70 Estimated Installed Cost: $530,000 (rounded to nearest $10,000) Payback (with no incentives): 19.6 years Payback: 16 years Building Annual Electrical Usage: 375,000 kWh Solar System Annual Output: 135,240 kWh % offset: % 36.06 Applicable Incentives A detailed summary of applicable incentives is included
1. Vermont Small Scale Renewable Energy Incentive Program: $2.25/watt DC up to 10 kW, $1.50/W DC for next 50 kW (up to 60 kW). Maximum incentive $97,500 or up to 50% of project costs (whichever is lower).
2. Burlington Electric Department feed in tariff purchases PV produced power at 0.20 $/kWh, the offset calculation compares this power, which is fed directly into the grid, against the adjacent structure’s utility demand.
Notes:
1. Structural analysis of the roof for ability to support the proposed solar PV system will be required. This should be coordinated with the structural engineer’s ballast requirement calculations. These have been included in the estimated cost.
2. Installed cost includes all materials, labor, design, engineering…etc. based on observed market conditions in Q2 2012.
3. Financial analysis assumes BED utility 4. Electrical engineering/design of interconnection required (included in est. cost) 5. Roof substrate is assumed to be standing seam metal 6. Roof conditions should be field verified and confirmed to be OK for installation. Coordinate
with manufacturer to ensure continuation 7. *Slope varies slightly for the easterly facing roof which appears to be at a 50° angle whereas all
south facing slopes are 55° 8. *Both orientation and slope values refer to each of the three different adjacent buildings from
east to west respectively 9. Validity of reported slopes should be confirmed through building plans prior to construction

UVM Campus Renewable Energy Feasibility Study Building: Votey Hall 33 Colchester Ave, Burlington VT 05405 Visit Date: 5/31/2012 By: Jack Lehrecke Building: Votey Hall Address: 33 Colchester Ave, Burlington VT Aerial Photo:

UVM Campus Renewable Energy Feasibility Study Building: Votey Hall 33 Colchester Ave, Burlington VT 05405
* Measurements are approximate and include all required spacing * Carport calculation requires a minimum of 20 contiguous spots * Flat roof assumes 10’ setbacks per OSHA * Sloped roof assumes 4’ setback per building code (may vary)
Total Roof Space: 24,156sqft Useable Roof Space: 14,500sqft Installation Type: 1 Tilt Angle: 10° Orientation: 170° Approximate DC Watts: 116,000 Solar PV System Size: 116.0kW Basis of Design Equipment: Sharp 250W Mono Solar Modules SunLink Ballasted Racking System PVP 100kW Powered Solar PV Inverter Cooper Crouse Hinds Disconnecting, Surge Protection Combiner Boxes Total $/watt: $4.66 Estimated Installed Cost: $540,000 (rounded to nearest $10,000) Payback (with no incentives): 19.4 years Payback (with incentives): 17 years Building Annual Electrical Usage: 1,409,124 kWh Solar System Annual Output: 139,200 kWh % offset: 9.88%
Installation Type DC Watts per
Unit
1. Roof Mount Ballasted Flat
8 sqft
2. Roof Mount Sloped 11.5 sqft 3. Ground Mount 5 sqft 4. Carport 1000 Parking
space

UVM Campus Renewable Energy Feasibility Study Building: Votey Hall 33 Colchester Ave, Burlington VT 05405 Applicable Incentives A detailed summary of applicable incentives is included 1.Vermont Small Scale Renewable Energy Incentive Program: $2.25/watt DC up to 10
kW, $1.50/W DC for next 50 kW (up to 60 kW). Maximum incentive $97,500 or up to 50% of project costs (whichever is lower).
2. Burlington Electric Department feed in tariff purchases PV produced power at 0.20 $/kWh, the offset calculation compares this power, which is fed directly into the grid, against the adjacent structure’s utility demand.
Notes: 1. Structural analysis of the roof for ability to support the proposed solar PV system will
be required. This should be coordinated with the structural engineer’s ballast requirement calculations. These have been included in the estimated cost.
2. Installed cost includes all materials, labor, design, engineering…etc. based on observed market conditions in Q2 2012.
3. Financial analysis assumes BED utility 4. Electrical engineering/design of interconnection required (included in est. cost) 5. Roof substrate is assumed to be EPDM Rubber or similar and fully adhered. 6. Roof conditions should be field verified and confirmed to be OK for installation.
Coordinate with manufacturer to ensure continuation 7. Useable roof space calculation did not account for the recently installed PV panels 8. The various obstacles on the roof may cause a different system output based on
shading; further roof inspection is required. 9. Utility rate assumes an annual increase of 3%

UVM Campus Renewable Energy Feasibility Study Building: Wadhams House- 178 South Prospect St, Burlington VT Visit Date: 7/2/2012 By: Ryan Darlow
* Measurements are approximate and include all required spacing * Carport calculation requires a minimum of 20 contiguous spots * Flat roof assumes 10’ setbacks per OSHA * Sloped roof assumes 4’ setback per building code (may vary)
Building: Wadhams House Address: 178 South Prospect St, Burlington, VT Aerial Photo:
Total Roof Space: 420 sqft Useable Roof Space: 250 sqft Installation Type: 2 Roof Slope: 30° Orientation: 175° South Approximate DC Watts: 2875
Installation Type DC Watts per
Unit
1. Roof Mount Ballasted Flat
8 sqft
2. Roof Mount Sloped 11.5 sqft 3. Ground Mount 5 sqft 4. Carport 1000 Parking
space

UVM Campus Renewable Energy Feasibility Study Building: Wadhams House- 178 South Prospect St, Burlington VT Solar PV System Size: 2.88kW Basis of Design Equipment: Sharp 250W Mono Solar Modules Unirac Racking System 1x SMA 5000 W Solar PV Inverter Cooper Crouse Hinds Disconnecting, Surge Protection Combiner Boxes Total $/watt: $10.43 Estimated Installed Cost: $30,000 (rounded to nearest $10,000) Payback (with no incentives): 43.5 years Payback: 118 years Building Annual Electrical Usage: 21,025 kWh Solar System Annual Output: 3,045 kWh % offset: 16.41% Applicable Incentives A detailed summary of applicable incentives is included
1. Vermont Small Scale Renewable Energy Incentive Program: $2.25/watt DC up to 10 kW, $1.50/W DC for next 50 kW (up to 60 kW). Maximum incentive $97,500 or up to 50% of project costs (whichever is lower).
2. Burlington Electric Department metering for $.20 per kWh. Notes:
1. Structural analysis of the roof for ability to support the proposed solar PV system will be required. This should be coordinated with the structural engineer’s ballast requirement calculations. These have been included in the estimated cost.
2. Installed cost includes all materials, labor, design, engineering…etc. based on observed market conditions in Q2 2012.
3. Financial analysis assumes BED utility 4. Electrical engineering/design of interconnection required (included in est. cost) 5. Roof substrate is assumed to be shingles 6. Roof conditions should be field verified and confirmed to be OK for installation. Coordinate with
manufacturer to ensure continuation 7. Electricity will be directly fed into the grid, so the building offset is the equivalent amount 8. Roof may require some additional maintenance

UVM Campus Renewable Energy Feasibility Study Building: Wilks Hall Visit Date: 7/11/2012 By: Jack Lehrecke
* Measurements are approximate and include all required spacing * Carport calculation requires a minimum of 20 contiguous spots * Flat roof assumes 10’ setbacks per OSHA * Sloped roof assumes 4’ setback per building code (may vary)
Building: Wilks Hall Address: Redstone Campus, Burlington, VT 05401 Photo:
Total Roof Space: 8,700 sqft Useable Roof Space: 4,400 sqft Installation Type: 1 Roof Slope: Flat (0°) Orientation: 180° (South) Approximate DC Watts: 35,200 Solar PV System Size: 35.2kW Basis of Design Equipment: Sharp 250W Mono Solar Modules SunLink Ballasted Racking System PVP 30 kW Solar PV Inverter Cooper Crouse Hinds Disconnecting, Surge Protection Combiner Boxes
Installation Type DC Watts per
Unit
1. Roof Mount Ballasted Flat
8 sqft
2. Roof Mount Sloped 11.5 sqft 3. Ground Mount 5 sqft 4. Carport 1000 Parking
space
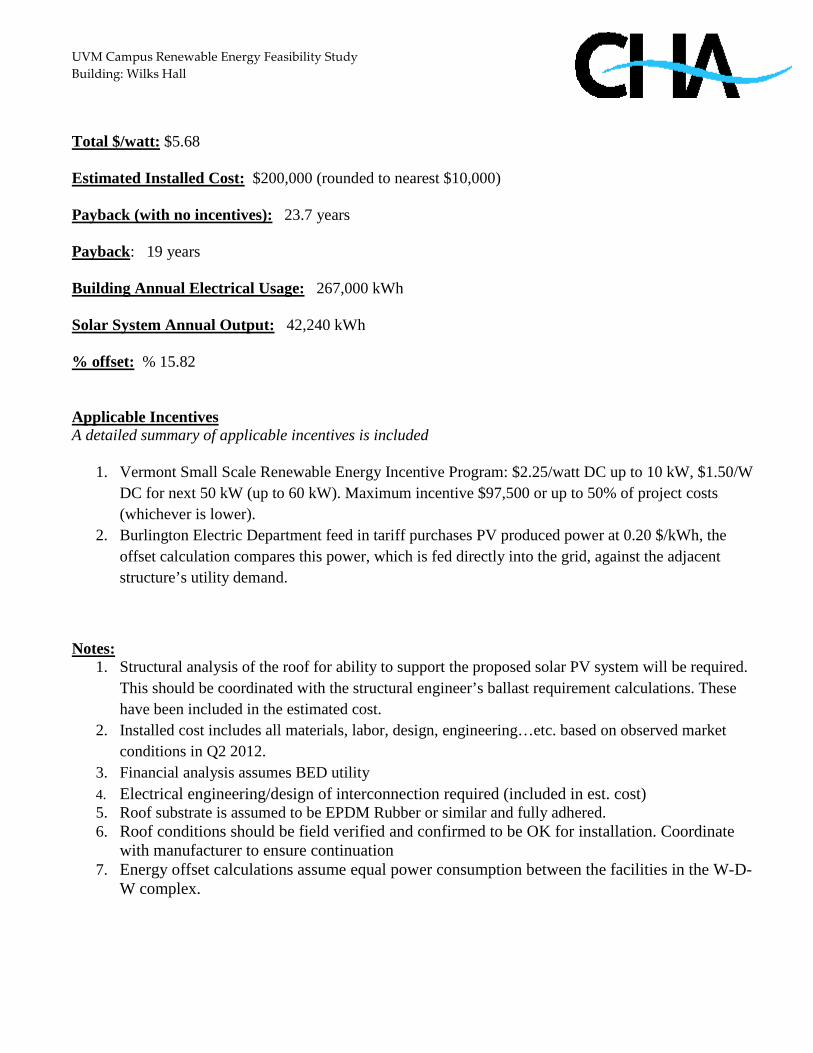
UVM Campus Renewable Energy Feasibility Study Building: Wilks Hall Total $/watt: $5.68 Estimated Installed Cost: $200,000 (rounded to nearest $10,000) Payback (with no incentives): 23.7 years Payback: 19 years Building Annual Electrical Usage: 267,000 kWh Solar System Annual Output: 42,240 kWh % offset: % 15.82 Applicable Incentives A detailed summary of applicable incentives is included
1. Vermont Small Scale Renewable Energy Incentive Program: $2.25/watt DC up to 10 kW, $1.50/W DC for next 50 kW (up to 60 kW). Maximum incentive $97,500 or up to 50% of project costs (whichever is lower).
2. Burlington Electric Department feed in tariff purchases PV produced power at 0.20 $/kWh, the offset calculation compares this power, which is fed directly into the grid, against the adjacent structure’s utility demand.
Notes:
1. Structural analysis of the roof for ability to support the proposed solar PV system will be required. This should be coordinated with the structural engineer’s ballast requirement calculations. These have been included in the estimated cost.
2. Installed cost includes all materials, labor, design, engineering…etc. based on observed market conditions in Q2 2012.
3. Financial analysis assumes BED utility 4. Electrical engineering/design of interconnection required (included in est. cost) 5. Roof substrate is assumed to be EPDM Rubber or similar and fully adhered. 6. Roof conditions should be field verified and confirmed to be OK for installation. Coordinate
with manufacturer to ensure continuation 7. Energy offset calculations assume equal power consumption between the facilities in the W-D-
W complex.

UVM Campus Renewable Energy Feasibility Study Building: Wills Hall 71 Colchester Ave, Burlington VT 05405 Visit Date: 5/31/2012 By: Jack Lehrecke Building: Wills Hall Address: 71 Colchester Ave, Burlington VT Aerial Photo:

UVM Campus Renewable Energy Feasibility Study Building: Wills Hall 71 Colchester Ave, Burlington VT 05405
* Measurements are approximate and include all required spacing * Carport calculation requires a minimum of 20 contiguous spots * Flat roof assumes 10’ setbacks per OSHA * Sloped roof assumes 4’ setback per building code (may vary)
Total Roof Space: 4,550sqft Useable Roof Space: 1,630sqft Installation Type: 1 Tilt Angle: 10° Orientation: 170° Approximate DC Watts: 13,040 Solar PV System Size: 13.04kW Basis of Design Equipment: Sharp 250W Mono Solar Modules SunLink Ballasted Racking System 2x SMA 6000 Powered Solar PV Inverter Cooper Crouse Hinds Disconnecting, Surge Protection Combiner Boxes Total $/watt: $6.13 Estimated Installed Cost: $80,000 (rounded to nearest $10,000) Payback (with no incentives): 25.6 years Payback (with incentives): 21 years Building Annual Electrical Usage: 266,062 kWh Solar System Annual Output: 15,648 kWh % offset: 5.88% Applicable Incentives A detailed summary of applicable incentives is included 1.Vermont Small Scale Renewable Energy Incentive Program: $2.25/watt DC up to 10
kW, $1.50/W DC for next 50 kW (up to 60 kW). Maximum incentive $97,500 or up to
Installation Type DC Watts per
Unit
1. Roof Mount Ballasted Flat
8 sqft
2. Roof Mount Sloped 11.5 sqft 3. Ground Mount 5 sqft 4. Carport 1000 Parking
space

UVM Campus Renewable Energy Feasibility Study Building: Wills Hall 71 Colchester Ave, Burlington VT 05405
50% of project costs (whichever is lower). 2.Burlington Electric Department feed in tariff purchases PV produced power at 0.20
$/kWh, the offset calculation compares this power, which is fed directly into the grid, against the adjacent structure’s utility demand.
Notes: 1. Structural analysis of the roof for ability to support the proposed solar PV system will
be required. This should be coordinated with the structural engineer’s ballast requirement calculations. These have been included in the estimated cost.
2. Installed cost includes all materials, labor, design, engineering…etc. based on observed market conditions in Q2 2012.
3. Financial analysis assumes BED utility 4. Electrical engineering/design of interconnection required (included in est. cost) 5. Roof substrate is assumed to be EPDM Rubber or similar and fully adhered. 6.Roof conditions should be field verified and confirmed to be OK for installation.
Coordinate with manufacturer to ensure continuation 7.The annual energy consumption of the building was estimated by dividing the total
energy used by the CBW complex evenly 8.Useable roof space calculation accounted for the vents on the roof 9.Utility rate assumes an annual increase of 3%

UVM Campus Renewable Energy Feasibility Study Building: Wing Hall Visit Date: 7/11/2012 By: Jack Lehrecke
* Measurements are approximate and include all required spacing * Carport calculation requires a minimum of 20 contiguous spots * Flat roof assumes 10’ setbacks per OSHA * Sloped roof assumes 4’ setback per building code (may vary)
Building: Wing Hall Address: Redstone Campus, Burlington, VT 05401 Photo:
Total Roof Space: 8,700 sqft Useable Roof Space: 4,400 sqft Installation Type: 1 Roof Slope: Flat (0°) Orientation: 180° (South) Approximate DC Watts: 35,200 Solar PV System Size: 35.2kW Basis of Design Equipment: Sharp 250W Mono Solar Modules SunLink Ballasted Racking System PVP 30 kW Solar PV Inverter
Installation Type DC Watts per
Unit
1. Roof Mount Ballasted Flat
8 sqft
2. Roof Mount Sloped 11.5 sqft 3. Ground Mount 5 sqft 4. Carport 1000 Parking
space

UVM Campus Renewable Energy Feasibility Study Building: Wing Hall Cooper Crouse Hinds Disconnecting, Surge Protection Combiner Boxes Total $/watt: $5.68 Estimated Installed Cost: $200,000 (rounded to nearest $10,000) Payback (with no incentives): 23.7 years Payback: 19 years Building Annual Electrical Usage: 267,000 kWh Solar System Annual Output: 42,240 kWh % offset: % 15.82 Applicable Incentives A detailed summary of applicable incentives is included
1. Vermont Small Scale Renewable Energy Incentive Program: $2.25/watt DC up to 10 kW, $1.50/W DC for next 50 kW (up to 60 kW). Maximum incentive $97,500 or up to 50% of project costs (whichever is lower).
2. Burlington Electric Department feed in tariff purchases PV produced power at 0.20 $/kWh, the offset calculation compares this power, which is fed directly into the grid, against the adjacent structure’s utility demand.
Notes:
1. Structural analysis of the roof for ability to support the proposed solar PV system will be required. This should be coordinated with the structural engineer’s ballast requirement calculations. These have been included in the estimated cost.
2. Installed cost includes all materials, labor, design, engineering…etc. based on observed market conditions in Q2 2012.
3. Financial analysis assumes BED utility 4. Electrical engineering/design of interconnection required (included in est. cost) 5. Roof substrate is assumed to be EPDM Rubber or similar and fully adhered. 6. Roof conditions should be field verified and confirmed to be OK for installation. Coordinate
with manufacturer to ensure continuation 7. Energy offset calculations assume equal power consumption between the facilities in the W-D-
W complex.

UVM Campus Renewable Energy Feasibility Study Building: Wright Hall- 436 South Prospect St, Burlington VT Visit Date: 7/5/2012 By: Ryan Darlow
* Measurements are approximate and include all required spacing * Carport calculation requires a minimum of 20 contiguous spots * Flat roof assumes 10’ setbacks per OSHA * Sloped roof assumes 4’ setback per building code (may vary)
Building: Wright Hall Address: 436 South Prospect St, Burlington, VT Aerial Photo:
Total Roof Space: 7875 sqft Useable Roof Space: 3,875 sqft Installation Type: 1 Roof Slope: Flat (0°) Orientation: 90° East Approximate DC Watts: 31,000 Solar PV System Size: 31kW Basis of Design Equipment: Sharp 250W Mono Solar Modules SunLink Ballasted Racking System 3x SMA 10,000 W Solar PV Inverters Cooper Crouse Hinds Disconnecting, Surge Protection Combiner Boxes Total $/watt: $ 5.81 Estimated Installed Cost: $180,000 (rounded to nearest $10,000) Payback (with no incentives): 24.2 years Payback: 19 years Building Annual Electrical Usage: 948,818 kWh*
Installation Type DC Watts per
Unit
1. Roof Mount Ballasted Flat
8 sqft
2. Roof Mount Sloped 11.5 sqft 3. Ground Mount 5 sqft 4. Carport 1000 Parking
space
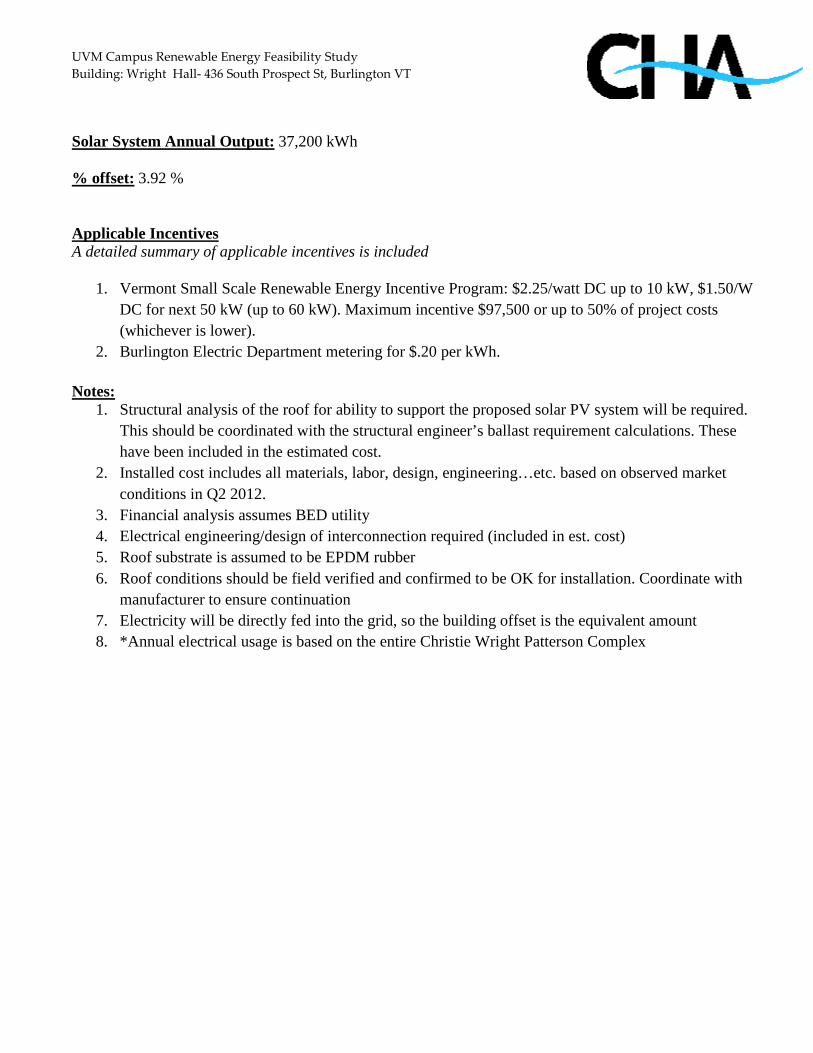
UVM Campus Renewable Energy Feasibility Study Building: Wright Hall- 436 South Prospect St, Burlington VT Solar System Annual Output: 37,200 kWh % offset: 3.92 % Applicable Incentives A detailed summary of applicable incentives is included
1. Vermont Small Scale Renewable Energy Incentive Program: $2.25/watt DC up to 10 kW, $1.50/W DC for next 50 kW (up to 60 kW). Maximum incentive $97,500 or up to 50% of project costs (whichever is lower).
2. Burlington Electric Department metering for $.20 per kWh. Notes:
1. Structural analysis of the roof for ability to support the proposed solar PV system will be required. This should be coordinated with the structural engineer’s ballast requirement calculations. These have been included in the estimated cost.
2. Installed cost includes all materials, labor, design, engineering…etc. based on observed market conditions in Q2 2012.
3. Financial analysis assumes BED utility 4. Electrical engineering/design of interconnection required (included in est. cost) 5. Roof substrate is assumed to be EPDM rubber 6. Roof conditions should be field verified and confirmed to be OK for installation. Coordinate with
manufacturer to ensure continuation 7. Electricity will be directly fed into the grid, so the building offset is the equivalent amount 8. *Annual electrical usage is based on the entire Christie Wright Patterson Complex

UVM Campus Renewable Energy Feasibility Study Building: Harris Millis Commons Visit Date: 7/1/2012 By: Jack Lehrecke Building: Harris Millis Commons Dining Facility Address: 67 Spear Street, Burlington VT 05405 Photo:
Total Roof Space: 10,800 sqft Useable Roof Space: 4,000 sqft Roof Slope: Flat (0°) Tilt Angle: 35° Orientation: 170° (South) Approximate Annual Yield: 369,735 kBtu
Installation Detail System Spec. Units
Collector Area 1606 ft2
Number of Collectors 40 -
Number of Arrays 5 -
DHW Demand 2,402 Gal/day
Temperature Setting 140 °F System Flow Rate 44.8 gpm

UVM Campus Renewable Energy Feasibility Study Building: Harris Millis Commons Basis of Design Equipment: Heliodyne GOBI 410 Blue Sputter Collectors Heliodyne Rack-Mount System Heliodyne HCOM 180 External Heat Exchanger 1x Heliodyne 2,400 gallon Storage Tank System Cost Estimate: $240,900 Total Energy Demand: 911,248 kBtu Total Solar Fraction: 38.6% (Average)
Solar fraction: fraction of solar energy to system [SFn] %
Applicable Incentives A detailed summary of applicable incentives is included
1. Vermont Small Scale Renewable Energy Incentive Program: funds a maximum of $45,000 or 50% of the total project costs (whichever is less). These values are generated by the $3.00/100 Btu/d rate offered by the program up to 1,500 kBtu/d where the incentive is capped.
Notes:
1. Structural analysis of the roof for ability to support the proposed solar thermal system will be required. This should be coordinated with the structural engineer’s ballast requirement calculations. These have been included in the estimated cost.

UVM Campus Renewable Energy Feasibility Study Building: Harris Millis Commons
2. Installed cost includes all materials, labor, design, engineering…etc. based on observed market conditions in Q2 2012.
3. Roof substrate is assumed to be EPDM Rubber or similar and fully adhered. 4. Roof conditions should be field verified and confirmed to be OK for installation.
Coordinate with manufacturer to ensure continuation

UVM Campus Renewable Energy Feasibility Study Building: Living and Learning Building D Visit Date: 7/1/2012 By: Jack Lehrecke Building: Living and Learning Building D Address: 663 Main Street, Burlington VT 05405 Photo:
Total Roof Space: 11,250 sqft Useable Roof Space: 7,880 sqft Roof Slope: Flat (0°) Tilt Angle: 35° Orientation: 170° (South)
Installation Detail System Spec. Units
Collector Area 482 ft2
Number of Collectors 12 -
Number of Arrays 3 -
DHW Demand 1,142 Gal/day
Temperature Setting 120 °F System Flow Rate 13.4 gpm

UVM Campus Renewable Energy Feasibility Study Building: Living and Learning Building D Approximate Annual Yield: 127,738 kBtu Basis of Design Equipment: Heliodyne GOBI 410 Blue Sputter Collectors Heliodyne Rack-Mount System Heliodyne HCOM 180 External Heat Exchanger 1x Heliodyne 600 gallon Storage Tank System Cost Estimate: $72,300 Total Energy Demand: 344,393 kBtu Total Solar Fraction: 34.1% (Average)
Solar fraction: fraction of solar energy to system [SFn] %
Applicable Incentives A detailed summary of applicable incentives is included
1. Vermont Small Scale Renewable Energy Incentive Program: funds a maximum of $45,000 or 50% of the total project costs (whichever is less). These values are generated by the $3.00/100 Btu/d rate offered by the program up to 1,500 kBtu/d where the incentive is capped.
Notes:
1. Structural analysis of the roof for ability to support the proposed solar thermal system will be required. This should be coordinated with the structural engineer’s ballast requirement calculations. These have been included in the estimated cost.

UVM Campus Renewable Energy Feasibility Study Building: Living and Learning Building D
2. Installed cost includes all materials, labor, design, engineering…etc. based on observed market conditions in Q2 2012.
3. Roof substrate is assumed to be EPDM Rubber or similar and fully adhered. 4. Roof conditions should be field verified and confirmed to be OK for installation.
Coordinate with manufacturer to ensure continuation

UVM Campus Renewable Energy Feasibility Study Building: Marsh & Austin Hall Visit Date: 7/1/2012 By: Jack Lehrecke Building: Marsh & Austin Hall Address: 31 Spear Street, Burlington, VT 05401 Photo:
Total Roof Space: 10,678 sqft Useable Roof Space: 5,339 sqft Roof Slope: Flat (0°) Tilt Angle: 35° Orientation: 170° (South) Approximate Annual Yield: 300,000 kBtu
Installation Detail System Spec. Units
Collector Area 1,124 ft2
Number of Collectors 28 -
Number of Arrays 4 -
DHW Demand 2,823 Gal/day
Temperature Setting 120 °F System Flow Rate 15.7 gpm
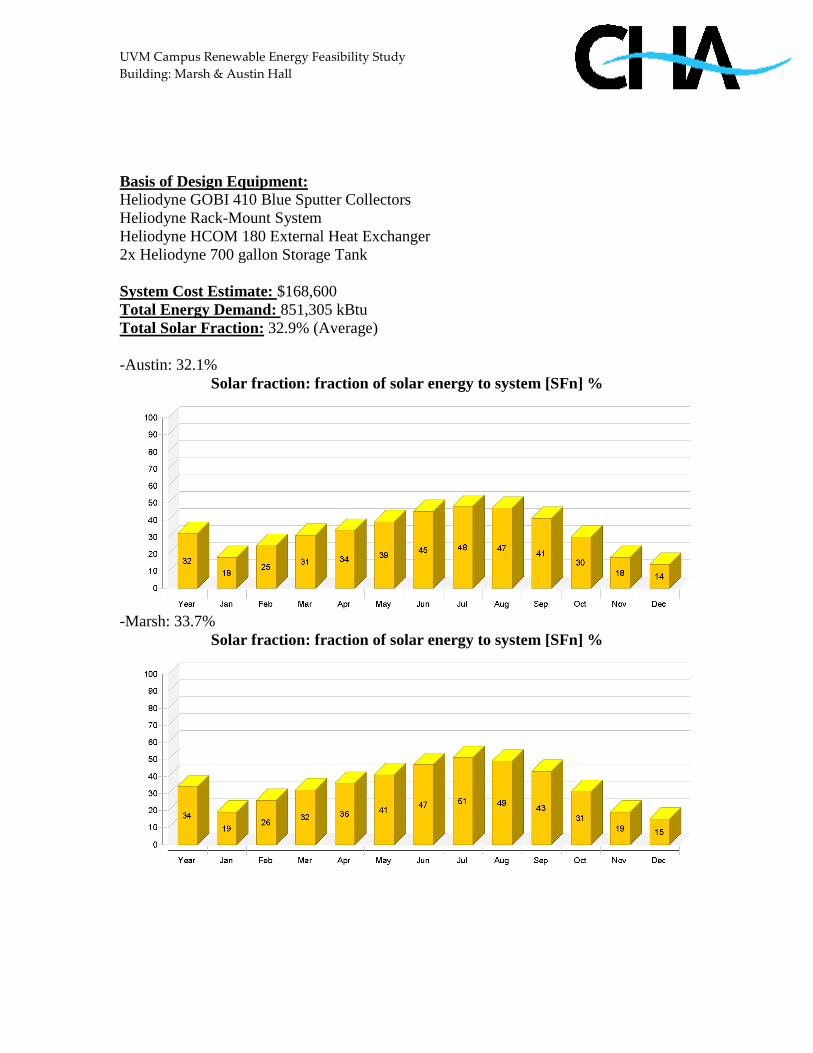
UVM Campus Renewable Energy Feasibility Study Building: Marsh & Austin Hall Basis of Design Equipment: Heliodyne GOBI 410 Blue Sputter Collectors Heliodyne Rack-Mount System Heliodyne HCOM 180 External Heat Exchanger 2x Heliodyne 700 gallon Storage Tank System Cost Estimate: $168,600 Total Energy Demand: 851,305 kBtu Total Solar Fraction: 32.9% (Average) -Austin: 32.1%
Solar fraction: fraction of solar energy to system [SFn] %
-Marsh: 33.7%
Solar fraction: fraction of solar energy to system [SFn] %

UVM Campus Renewable Energy Feasibility Study Building: Marsh & Austin Hall Applicable Incentives A detailed summary of applicable incentives is included
1. Vermont Small Scale Renewable Energy Incentive Program: funds a maximum of $45,000 or 50% of the total project costs (whichever is less). These values are generated by the $3.00/100 Btu/d rate offered by the program up to 1,500 kBtu/d where the incentive is capped.
Notes:
1. Structural analysis of the roof for ability to support the proposed solar thermal system will be required. This should be coordinated with the structural engineer’s ballast requirement calculations. These have been included in the estimated cost.
2. Installed cost includes all materials, labor, design, engineering…etc. based on observed market conditions in Q2 2012.
3. Roof substrate is assumed to be EPDM Rubber or similar and fully adhered. 4. Roof conditions should be field verified and confirmed to be OK for installation.
Coordinate with manufacturer to ensure continuation

UVM Campus Renewable Energy Feasibility Study Building: Simpson Hall Visit Date: 7/1/2012 By: Jack Lehrecke Building: Simpson Hall Dining Facility Address: 438 South Prospect Street, Burlington VT 05405 Photo:
Total Roof Space: 14,025 sqft Useable Roof Space: 8,025 sqft Roof Slope: Flat (0°) Tilt Angle: 35° Orientation: 180° (South) Approximate Annual Yield: 369,735 kBtu
Installation Detail System Spec. Units
Collector Area 1606 ft2
Number of Collectors 40 -
Number of Arrays 5 -
DHW Demand 2,402 Gal/day
Temperature Setting 140 °F System Flow Rate 44.8 gpm

UVM Campus Renewable Energy Feasibility Study Building: Simpson Hall Basis of Design Equipment: Heliodyne GOBI 410 Blue Sputter Collectors Heliodyne Rack-Mount System Heliodyne HCOM 180 External Heat Exchanger 1x Heliodyne 2,400 gallon Storage Tank System Cost Estimate: $240,900 Total Energy Demand: 911,248 kBtu Total Solar Fraction: 38.6% (Average)
Solar fraction: fraction of solar energy to system [SFn] %
Applicable Incentives A detailed summary of applicable incentives is included
1. Vermont Small Scale Renewable Energy Incentive Program: funds a maximum of $45,000 or 50% of the total project costs (whichever is less). These values are generated by the $3.00/100 Btu/d rate offered by the program up to 1,500 kBtu/d where the incentive is capped.
Notes:
1. Structural analysis of the roof for ability to support the proposed solar thermal system will be required. This should be coordinated with the structural engineer’s ballast requirement calculations. These have been included in the estimated cost.

UVM Campus Renewable Energy Feasibility Study Building: Simpson Hall
2. Installed cost includes all materials, labor, design, engineering…etc. based on observed market conditions in Q2 2012.
3. Roof substrate is assumed to be EPDM Rubber or similar and fully adhered. 4. Roof conditions should be field verified and confirmed to be OK for installation.
Coordinate with manufacturer to ensure continuation

UVM Campus Renewable Energy Feasibility Study Building: Tupper Hall Visit Date: 7/1/2012 By: Jack Lehrecke Building: Tupper Hall Address: 31 Spear Street, Burlington, VT 05401 Photo:

UVM Campus Renewable Energy Feasibility Study Building: Tupper Hall
Total Roof Space: 10,678 sqft Useable Roof Space: 5,339 sqft Roof Slope: Flat (0°) Tilt Angle: 35° Orientation: 170° (South) Approximate Annual Yield: 192,292 kBtu Basis of Design Equipment: Heliodyne GOBI 410 Blue Sputter Collectors Heliodyne Rack-Mount System Heliodyne HCOM 180 External Heat Exchanger 1x Heliodyne 1000 gallon Storage Tank System Cost Estimate: $108,450 Total Energy Demand: 547,727 kBtu Total Solar Fraction: 33.2% (Average)
Solar fraction: fraction of solar energy to system [SFn] %
Installation Detail System Spec. Units
Collector Area 722.7 ft2
Number of Collectors 18 -
Number of Arrays 3 -
DHW Demand 1,816 Gal/day
Temperature Setting 120 °F System Flow Rate 20.2 gpm

UVM Campus Renewable Energy Feasibility Study Building: Tupper Hall Applicable Incentives A detailed summary of applicable incentives is included
1. Vermont Small Scale Renewable Energy Incentive Program: funds a maximum of $45,000 or 50% of the total project costs (whichever is less). These values are generated by the $3.00/100 Btu/d rate offered by the program up to 1,500 kBtu/d where the incentive is capped.
Notes:
1. Structural analysis of the roof for ability to support the proposed solar thermal system will be required. This should be coordinated with the structural engineer’s ballast requirement calculations. These have been included in the estimated cost.
2. Installed cost includes all materials, labor, design, engineering…etc. based on observed market conditions in Q2 2012.
3. Roof substrate is assumed to be EPDM Rubber or similar and fully adhered. 4. Roof conditions should be field verified and confirmed to be OK for installation.
Coordinate with manufacturer to ensure continuation

UVM Campus Renewable Energy Feasibility Study Building: University Heights North 1 Visit Date: 7/1/2012 By: Jack Lehrecke Building: University Heights North 1 Address: 30 University Heights, Burlington, VT 05405 Photo:
Total Roof Space: 9,800 sqft Useable Roof Space: 6,000 sqft Roof Slope: 55° Tilt Angle: 55° Orientation: 190° (South) Approximate Annual Yield: 187,086 kBtu
Installation Detail System Spec. Units
Collector Area 723 ft2
Number of Collectors 18 -
Number of Arrays 3 -
DHW Demand 1,816 Gal/day
Temperature Setting 120 °F System Flow Rate 20.2 gpm

UVM Campus Renewable Energy Feasibility Study Building: University Heights North 1 Basis of Design Equipment: Heliodyne GOBI 410 Blue Sputter Collectors Heliodyne Flush-Mount System Heliodyne HCOM 180 External Heat Exchanger 1x Heliodyne 1000 gallon Storage Tank System Cost Estimate: $108,450 Total Energy Demand: 547,615 kBtu Total Solar Fraction: 32.3% (Average)
Solar fraction: fraction of solar energy to system [SFn] %
Applicable Incentives A detailed summary of applicable incentives is included
1. Vermont Small Scale Renewable Energy Incentive Program: funds a maximum of $45,000 or 50% of the total project costs (whichever is less). These values are generated by the $3.00/100 Btu/d rate offered by the program up to 1,500 kBtu/d where the incentive is capped.
Notes:
1. Structural analysis of the roof for ability to support the proposed solar thermal system will be required. This should be coordinated with the structural engineer’s ballast requirement calculations. These have been included in the estimated cost.

UVM Campus Renewable Energy Feasibility Study Building: University Heights North 1
2. Installed cost includes all materials, labor, design, engineering…etc. based on observed market conditions in Q2 2012.
3. Roof substrate is assumed to be Standing Seam Metal or similar and fully adhered.
4. Roof conditions should be field verified and confirmed to be OK for installation. Coordinate with manufacturer to ensure continuation

UVM Campus Renewable Energy Feasibility Study Building: University Heights North 2&3 Visit Date: 7/1/2012 By: Jack Lehrecke Building: University Heights North 2&3 Address: 50 University Heights, Burlington, VT 05405 Photo:
Total Roof Space: 14,500 sqft Useable Roof Space: 8,750 sqft Roof Slope: 55° Tilt Angle: 55° Orientation: 190° (South) Approximate Annual Yield: 308,067 kBtu
Installation Detail System Spec. Units
Collector Area 1,285 ft2
Number of Collectors 32 -
Number of Arrays 5 -
DHW Demand 2,267 Gal/day
Temperature Setting 120 °F System Flow Rate 35.8 gpm

UVM Campus Renewable Energy Feasibility Study Building: University Heights North 2&3 Basis of Design Equipment: Heliodyne GOBI 410 Blue Sputter Collectors Heliodyne Flush-Mount System Heliodyne HCOM 180 External Heat Exchanger 1x Heliodyne 1600 gallon Storage Tank System Cost Estimate: $192,750 Total Energy Demand: 684,239 kBtu Total Solar Fraction: 42.7% (Average)
Solar fraction: fraction of solar energy to system [SFn] %
Applicable Incentives A detailed summary of applicable incentives is included
1. Vermont Small Scale Renewable Energy Incentive Program: funds a maximum of $45,000 or 50% of the total project costs (whichever is less). These values are generated by the $3.00/100 Btu/d rate offered by the program up to 1,500 kBtu/d where the incentive is capped.
Notes:
1. Structural analysis of the roof for ability to support the proposed solar thermal system will be required. This should be coordinated with the structural engineer’s ballast requirement calculations. These have been included in the estimated cost.

UVM Campus Renewable Energy Feasibility Study Building: University Heights North 2&3
2. Installed cost includes all materials, labor, design, engineering…etc. based on observed market conditions in Q2 2012.
3. Roof substrate is assumed to be Standing Seam Metal or similar and fully adhered.
4. Roof conditions should be field verified and confirmed to be OK for installation. Coordinate with manufacturer to ensure continuation

UVM Campus Renewable Energy Feasibility Study Building: University Heights South 1 Visit Date: 7/1/2012 By: Jack Lehrecke Building: University Heights South 1 Address: 50 University Heights, Burlington, VT 05405 Photo:
Total Roof Space: 9,500 sqft Useable Roof Space: 6,200 sqft Roof Slope: 55° Tilt Angle: 55° Orientation: 165° (South) Approximate Annual Yield: 187,086 kBtu
Installation Detail System Spec. Units
Collector Area 723 ft2
Number of Collectors 18 -
Number of Arrays 3 -
DHW Demand 1,816 Gal/day
Temperature Setting 120 °F System Flow Rate 20.2 gpm

UVM Campus Renewable Energy Feasibility Study Building: University Heights South 1 Basis of Design Equipment: Heliodyne GOBI 410 Blue Sputter Collectors Heliodyne Flush-Mount System Heliodyne HCOM 180 External Heat Exchanger 1x Heliodyne 1000 gallon Storage Tank System Cost Estimate: $108,450 Total Energy Demand: 547,615 kBtu Total Solar Fraction: 32.3% (Average)
Solar fraction: fraction of solar energy to system [SFn] %
Applicable Incentives A detailed summary of applicable incentives is included
1. Vermont Small Scale Renewable Energy Incentive Program: funds a maximum of $45,000 or 50% of the total project costs (whichever is less). These values are generated by the $3.00/100 Btu/d rate offered by the program up to 1,500 kBtu/d where the incentive is capped.

UVM Campus Renewable Energy Feasibility Study Building: University Heights South 1 Notes:
1. Structural analysis of the roof for ability to support the proposed solar thermal system will be required. This should be coordinated with the structural engineer’s ballast requirement calculations. These have been included in the estimated cost.
2. Installed cost includes all materials, labor, design, engineering…etc. based on observed market conditions in Q2 2012.
3. Roof substrate is assumed to be Standing Seam Metal or similar and fully adhered.
4. Roof conditions should be field verified and confirmed to be OK for installation. Coordinate with manufacturer to ensure continuation

UVM Campus Renewable Energy Feasibility Study Building: University Heights South 2&3 Visit Date: 7/1/2012 By: Jack Lehrecke Building: University Heights South 2&3 Address: 70 University Heights, Burlington, VT 05405 Photo:
Total Roof Space: 15,000 sqft Useable Roof Space: 9,800 sqft Roof Slope: 55° Tilt Angle: 55° Orientation: 170° (South) Approximate Annual Yield: 302,272 kBtu
Installation Detail System Spec. Units
Collector Area 1,285 ft2
Number of Collectors 32 -
Number of Arrays 5 -
DHW Demand 2,042 Gal/day
Temperature Setting 120 °F System Flow Rate 35.8 gpm

UVM Campus Renewable Energy Feasibility Study Building: University Heights South 2&3 Basis of Design Equipment: Heliodyne GOBI 410 Blue Sputter Collectors Heliodyne Flush-Mount System Heliodyne HCOM 180 External Heat Exchanger 1x Heliodyne 1600 gallon Storage Tank System Cost Estimate: $192,750 Total Energy Demand: 616,465 kBtu Total Solar Fraction: 46.1% (Average)
Solar fraction: fraction of solar energy to system [SFn] %
Applicable Incentives A detailed summary of applicable incentives is included
1. Vermont Small Scale Renewable Energy Incentive Program: funds a maximum of $45,000 or 50% of the total project costs (whichever is less). These values are generated by the $3.00/100 Btu/d rate offered by the program up to 1,500 kBtu/d where the incentive is capped.
Notes:
1. Structural analysis of the roof for ability to support the proposed solar thermal system will be required. This should be coordinated with the structural engineer’s ballast requirement calculations. These have been included in the estimated cost.

UVM Campus Renewable Energy Feasibility Study Building: University Heights South 2&3
2. Installed cost includes all materials, labor, design, engineering…etc. based on observed market conditions in Q2 2012.
3. Roof substrate is assumed to be Standing Seam Metal or similar and fully adhered.
4. Roof conditions should be field verified and confirmed to be OK for installation. Coordinate with manufacturer to ensure continuation