offshore renewable energy feasibility study for the gulf
TRANSCRIPT

Offshore Renewable Energy Feasibility Study for the Gulf of Mexico
Suzanne Tegen, Ph.D. National Renewable Energy Laboratory
Information Transfer Meeting
Session 1B, OFFSHORE RENEWABLE ENERGY August 22, 2017

2
• Offshore wind energy cost and jobs analysis (CA, OR, HI)
• Marine hydrokinetic training for BOEM staff
• White paper to inform BOEM on offshore wind and fishing community interaction
• Floating wind turbine visualizations for hypothetical projects in Hawaii
• Technical analysis of offshore wind energy lease areas
Other BOEM-NREL Work on Offshore Renewable Energy
Massachusetts Wind Energy Area

3
NREL is surveying the potential offshore renewable energy resources in the Gulf of Mexico and quantifying the feasibility of the technologies, to inform strategic energy planning.
Offshore Renewable Energy Feasibility Study Summary
• Funded by BOEM Environmental Studies Program
• Geographic region – Gulf states from Mexico to Key West
4
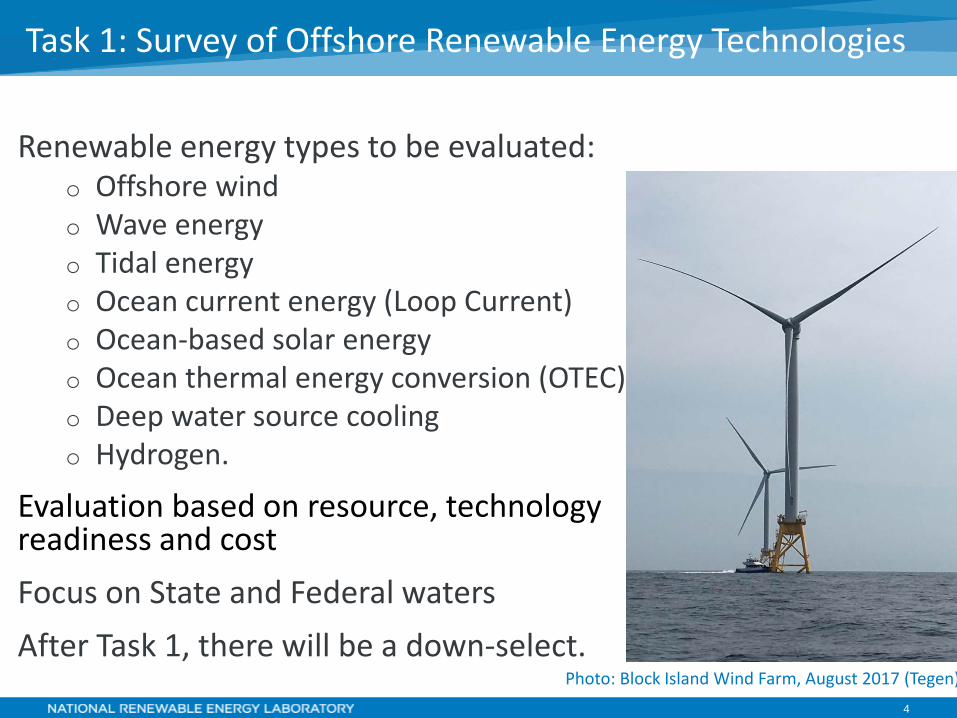
Renewable energy types to be evaluated: o Offshore wind o Wave energy o Tidal energy o Ocean current energy (Loop Current) o Ocean-based solar energy o Ocean thermal energy conversion (OTEC) o Deep water source cooling o Hydrogen.
Evaluation based on resource, technology readiness and cost Focus on State and Federal waters After Task 1, there will be a down-select.
Task 1: Survey of Offshore Renewable Energy Technologies
Photo: Block Island Wind Farm, August 2017 (Tegen)

5
• Part A - Geospatial Regional Economic Analysis o Resource capacity and energy potential by state, distance from
shore, and water depth
o Geospatial cost variables include water depth, wind resource, sea state, substructure type, technology size, distance to port, distance to cable interconnect, and installation method
o Regional Levelized Avoided Cost of Energy (LACE) and economic potential
• Part B – Local Benefits and Supply Chain Advantages o Integrate local benefits and challenges of deploying offshore
renewable energy in the Gulf of Mexico into geo-spatial LCOE cost models
o Perform analysis including supply chain and local content.
Task 2: Regional Economic Modeling for the Gulf

6
Representative offshore sites will be selected to provide site-specific physical and economic analyses for typical projects in the Gulf of Mexico region
Task 3: Site-Specific Economic Analysis
Cost Reduction Estimates for Two CA Sites
Offshore wind reference areas used for physical site and economic analysis in California.

7
• Use NREL’s jobs and economic development impacts (JEDI) model to estimate gross jobs and economic impacts of construction and operations associated with offshore wind build scenario.
• Use assumptions on supply chain and Gulf labor from Task 2. Estimate on-site, supply chain and induced jobs and economic impacts at state or regional level.
Task 4: Jobs and Economic Development
01,0002,0003,0004,0005,0006,0007,0008,000
Ore
gon
Ope
ratio
ns-P
hase
Jobs
(FTE
) Range of Jobs Supported by Scenario A Range of Jobs Supported by Scenario B
Example from Oregon report for BOEM (Jimenez et al 2016 www.nrel.gov/docs/fy16osti/65421.pdf)
Block Island Wind Turbine with Maintenance Boat

Preliminary Findings
9
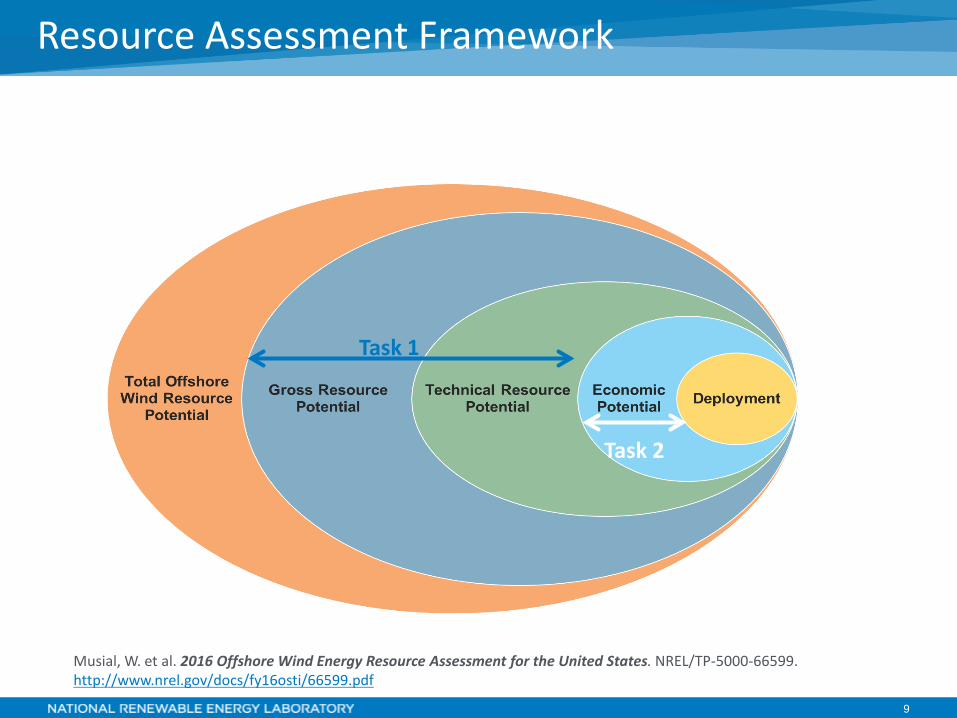
Resource Assessment Framework
Musial, W. et al. 2016 Offshore Wind Energy Resource Assessment for the United States. NREL/TP-5000-66599. http://www.nrel.gov/docs/fy16osti/66599.pdf
Task 1
Task 2

10
Sample Filters for Technical Potential Renewable Energy Resource Limit Criteria for the Gulf of Mexico
Technology Gross Potential Limits Technical Potential Limits
Distance From Shore
Water Depth Distance
From Shore Water Depth
Resource Minimum
Offshore Wind 200 nm unlimited 200 nm 1,000 m Average wind speed greater than 7 m/s
Wave Energy 200 nm unlimited 200 nm 250 m Average wave power
Greater than 10 kW/m
Offshore Solar Photovoltaics
200 nm unlimited 200 nm 1,000 m None – assumed
adequate everywhere
Tidal Energy 200 nm unlimited 200 nm 1,000 m Greater than 500 W/m2
Ocean Current 200 nm unlimited 200 nm 1,000 m Greater than 500 W/m2
Ocean Thermal Energy
200 nm unlimited 200 nm unlimited Annual average
temperature differential greater than 18˚ C
Cold Water Source Cooling
200 nm unlimited 10 nm 1,000 m Annual average
temperature less than 8˚C
11
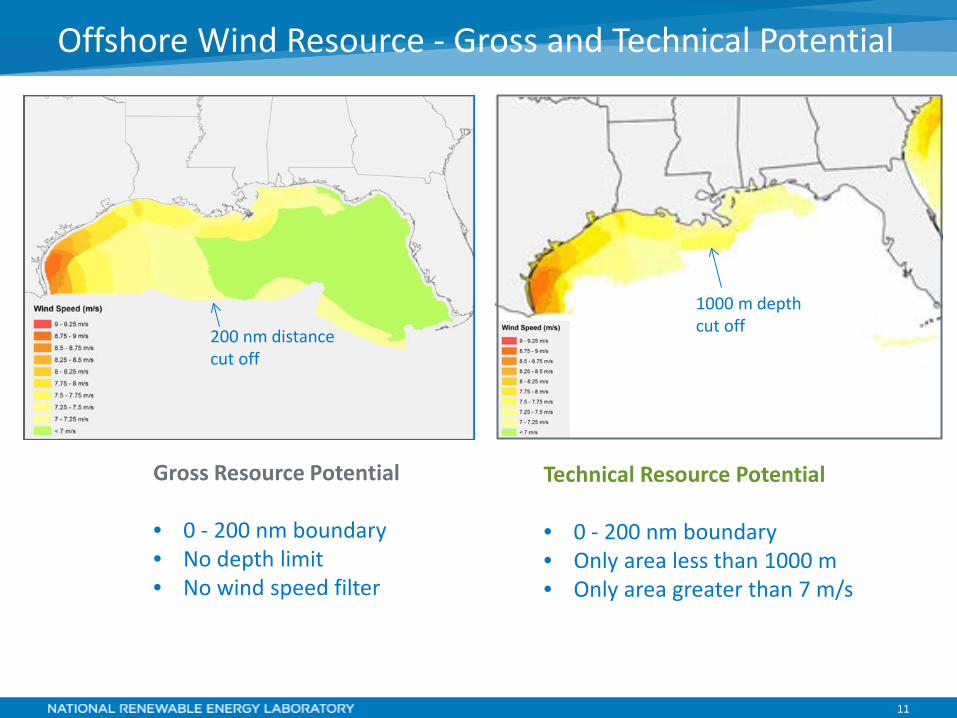
Offshore Wind Resource - Gross and Technical Potential
Gross Resource Potential • 0 - 200 nm boundary • No depth limit • No wind speed filter
Technical Resource Potential • 0 - 200 nm boundary • Only area less than 1000 m • Only area greater than 7 m/s
1000 m depth cut off 200 nm distance
cut off

12
Wave Resource - Gross and Technical Potential
Gross Resource Potential Filters • 0- 200 nm boundary • No depth limit • No wind speed filter • Data limited to area shown
Technical Resource Potential Filters • 0- 200 nm boundary • Area less than 1000 m deep • Wave power greater than 10 kW/m • No wave energy resource within filters

13
Tidal Power Density – Florida Keys
Source: NREL MHK Atlas https://maps.nrel.gov/mhk-atlas

14
• Finish feasibility analysis of RE technologies
• Down-select based on resource availability, technology readiness, and cost
• Conduct specific analysis for ~3 sites in Federal waters, on most viable technology
• Conduct supply chain, economic impact and jobs analysis
• Develop and disseminate outreach educational material
• Publish report by end of 2018/early 2019.
Next Steps

15
Photo Credit : Dennis Schroeder-NREL
Suzanne Tegen Technology, Engineering and Deployment Manager Wind and Water Power National Renewable Energy Laboratory [email protected]