review of 2008-09 online courses and programs (as requested in ssb 5410) karl nelson...
TRANSCRIPT


PROCESS AND CONTEXT

Process
• Student-level data from programs• Surveys/interviews of districts and programs• Digital Learning Commons data• OSPI data• Existing reports• Future: – CEDARS– Monthly enrollment reporting

Courses and Programs
• Content – blended to fully-online• Instruction – blended to fully-online• Sequence – individual courses to full programs• Duration – short-term to full-year

BACKGROUND AND DEMOGRAPHICS

2008-09 Totals
• 15,805 total students (headcount) estimated to be in online courses• 13,130 in 33 online school programs• 998 in Digital Learning Commons (DLC) courses• 1,677 in courses offered by districts
• 18 course, content, and program providers

Grade Levels – Program Headcount
K 1 2 3 4 5 6 7 8 9 10 11 120
500
1,000
1,500
2,000
2,500
3,000
3,500
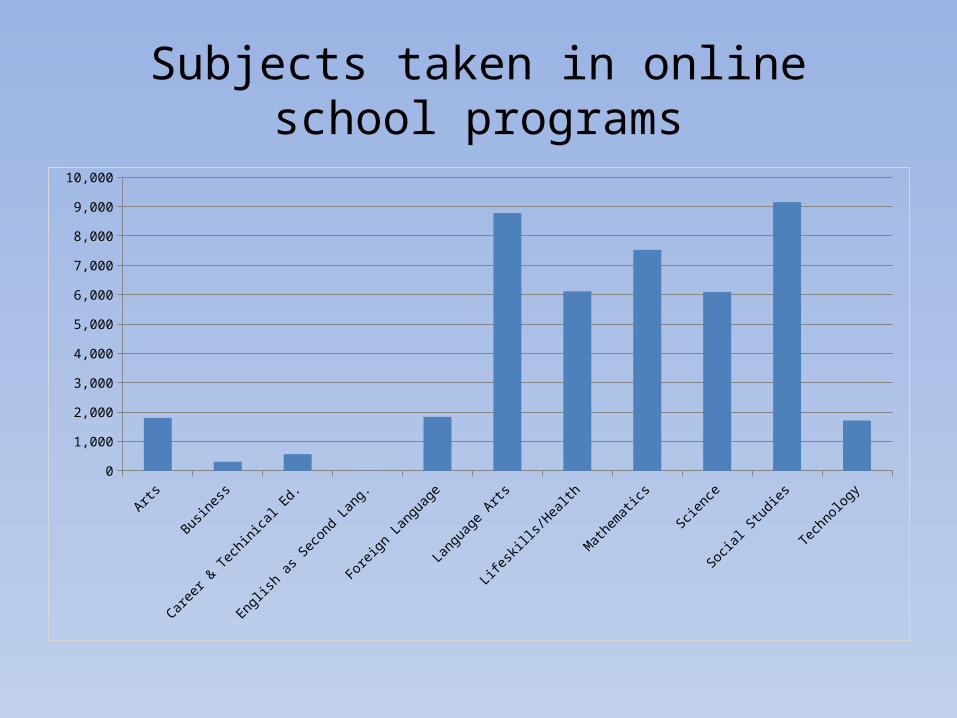
Subjects taken in online school programs
Arts
Business
Career
& Tech
inical E
d.
Engli
sh as
Seco
nd Lang.
Forei
gn La
nguag
e
Langu
age A
rts
Lifesk
ills/H
ealth
Mathem
atics
Scien
ce
Socia
l Studies
Tech
nology0
1,000
2,000
3,000
4,000
5,000
6,000
7,000
8,000
9,000
10,000

Levels of courses taken in online school programs
Advanced Placement Credit Recovery Honors Standard WASL Prep Other0%
10%
20%
30%
40%
50%
60%
70%
80%
90%

Gender of students in online school programs
Female Male
-10%
0%
10%
20%
30%
40%
50%
60%
70%
55.2%
44.8%48.5%
51.5%
Online School Programs State

Ethnicity
American Indian Asian Black Hispanic Multi-racial Other Pacific Islander White0%
10%
20%
30%
40%
50%
60%
70%
80%
90%
Online School Programs State

Poverty
• Free and Reduced-Price Meal rates aren’t a proxy for poverty for online school programs.
• No access to the USDA Child Nutrition program = no data
Special Education
• 3.7% in online school programs• 12.7% in state• Some issues around how special education
services are delivered

Previous Enrollment
Home District Same program Homeschooled Not in school Out of State0
1,000
2,000
3,000
4,000
5,000
6,000
7,000

FINANCIAL IMPACTS

Interdistrict Transfers
• 64% of students (headcount) transferred districts to attend an online program
• 97% of transfers were to the 7 districts operating the largest online programs
• 248 districts lost students to online programs• Of these 248, 17 districts lost more than 100
FTE

Districts gaining students
District FTESteilacoom Historical 2,483Quillayute Valley 2,407Monroe 573Evergreen (Clark) 531Kittitas 402Federal Way 262Stevenson-Carson 233

Districts losing studentsDistrict FTETacoma 365.67
Seattle 215.55
Puyallup 190.24
Clover Park 158.03
Everett 139.84
Kent 137.55
Edmonds 131.80
Vancouver 124.00
Peninsula 118.69
North Thurston 118.51
Kennewick 118.05
Lake Washington 112.64
Pasco 110.20
South Kitsap 108.01
Spokane 107.47
Bellingham 104.74
Federal Way 103.75

Districts losing studentsDistrict 07-08 Total Enrollment Transferred Out % of 07-08 studentsWilson Creek 128 28 21.9%
Shaw Island 19 4 21.1%
Brinnon 45 5 11.1%
Odessa 230 19 8.3%
Onion Creek 36 2 5.6%
Highland 1149 61 5.3%
Skykomish 57 3 5.3%
Creston 116 6 5.2%
White Pass 499 23 4.6%
LaCrosse 148 6 4.1%
Orient 52 2 3.8%
Quilcene 258 8 3.1%
Klickitat 131 4 3.1%

Districts with large online populations
District % of Oct 08 District Headcount in Online ProgramQuillayute Valley 57.0%
Steilacoom Historical 49.3%
Kittitas 38.8%
Stevenson-Carson School 13.0%
Monroe 9.8%

Financial Impacts
• 8 districts had basic education costs greater than basic education revenue
• Districts that saw increased enrollment saw increased I-728 revenue
• Even with additional I-728 revenue, half had costs exceeding revenue
• Average net excess cost over revenue represents about 1% of the total BEA revenue (State average is 10%)
NERC, Facilities, and Staffing
• Hard to assess NERC when districts contract with 3rd party providers
• Districts estimate higher NERC than with traditional programs
• Minimal facilities requirements• Business managers report 43.87 certificated
instructional staff per 1000 students (state average: 47.49)

Levy Bases and Levy Equalization: Districts with increasing enrollment
• Creates potential for increased levy revenue• May see increases in LEA funding
Levy Bases and Levy Equalization: Districts with declining enrollment
• Lowers levy authority which could result in lower levy collections
• May see lower LEA funding

OVERSIGHT

Contract Types
• Online School Programs• Online Content• Individual Online Courses

Contracts
• 21 of 30 programs contracted for content, instruction, or administration
• 14 programs used third-party teachers• 16 programs used district teachers• 8 districts contracted for administration• 16 entirely contracted for content; 5 used
both district and third-party content

Teachers
• All online school programs indicated the teachers had WA certifications
• Rates vary for WA certification for teachers of individual online courses
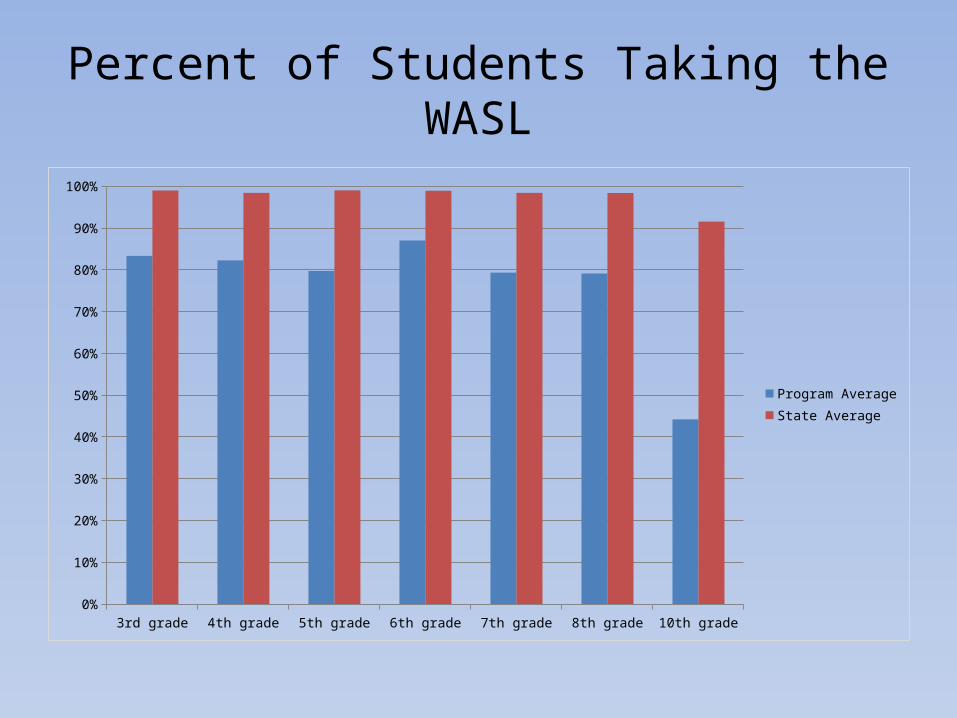
Percent of Students Taking the WASL
3rd grade 4th grade 5th grade 6th grade 7th grade 8th grade 10th grade0%
10%
20%
30%
40%
50%
60%
70%
80%
90%
100%
Program AverageState Average

STUDENT ACHIEVEMENT

Course Completion Rates
• A “completed” course is defined as a semester-long course where the student received a final grade and did not drop the course
• 84% of courses taken in online school programs were completed

Course Completion Rates for Online School Programs
0%
10%
20%
30%
40%
50%
60%
70%
80%
90%
100%
Course Pass Rates
• A “passing grade” is when a student earned an A, B, C, or a Pass grade in a completed course (dropped courses are not counted)
• Students earned a passing grade in 50.3% of completed courses in online programs

Grades Earned
A B C D F P0%
5%
10%
15%
20%
25%
30%
35%
40%
45%
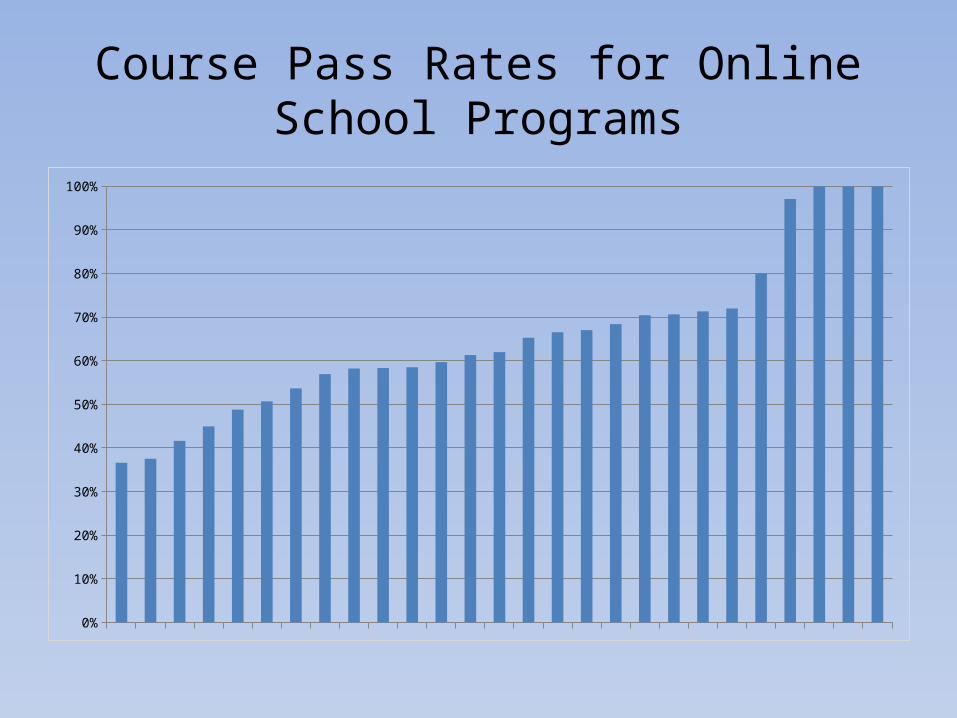
Course Pass Rates for Online School Programs
0%
10%
20%
30%
40%
50%
60%
70%
80%
90%
100%

Program Completion
• Half to two-thirds of students complete a program’s course of study
• Lack of reliable, consistent data from programs
• Variation in program model – some students may be successful without staying a full year

WASL Results
• Across all grades and subjects tested, none of the online school programs reporting WASL scores met the state average for students meeting standard
STUDENT SUPPORT

Student/Teacher Ratios
• Student-to-teacher ratios (FTE) range from 11.4 to 61.2
• Teachers per 1000 students (FTE) range from 16.3 to 88.1
• On average, online programs are staffed with slightly fewer certificated teachers per student than the overall state teacher-to-student ratio
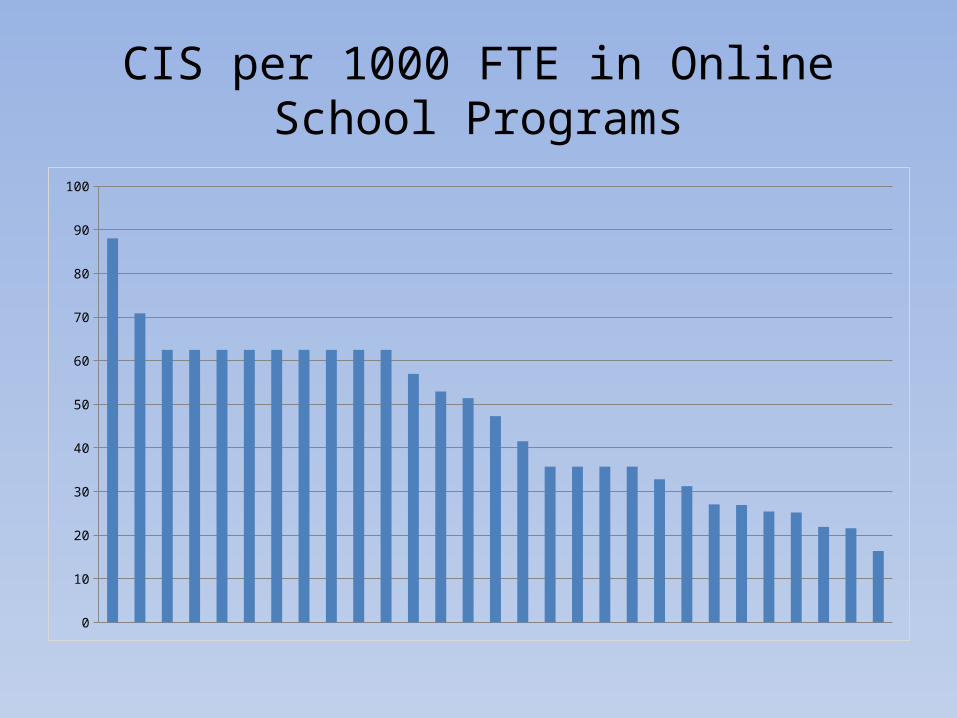
CIS per 1000 FTE in Online School Programs
0
10
20
30
40
50
60
70
80
90
100

Q & A