retirement reform october 2012 1. section 1: the problem retirement costs are jacksonville’s...
TRANSCRIPT

Retirement Reform
October 2012
1

Section 1: The Problem
Retirement Costs are Jacksonville’s Fiscal Cliff

An Everywhere Challenge
• Municipalities throughout the nation and throughout the State of Florida are facing significant budget challenges brought on by compounding compensation and benefit obligations that are growing at alarming rates.
Municipalities that fail to take timely action to address the increasing costs associated with compensation and benefits find themselves with budget deficits, layoffs, and the elimination of needed services.
Worse case scenario: Stockton, CA or Central Falls, RI

City Revenue Going Down
• Decline in revenues from FY 11/12 ($958 million) to FY 12/13 ($948 million)
• Passage of Amendment Four could reduce revenue by $7 million in FY 13/14 and $13 million in FY 14/15

City Retirement Costs Going Up
• Just four years ago, the City of Jacksonville spent less than 7% -- $65 million – of its budget on overall pension costs.
• This coming year, the City is projected to spend nearly 16% of its budget – nearly $150 million – on overall pension costs.
• That’s an increase from $65 million to $150 million in just four years with the same size budget.
5

Retirement Reform Priority
• Mayor Brown has made retirement reform the top priority of his second year as mayor.
• His promise: unveil a retirement reform plan by the end of 2012.
• The goal was to have a plan that would respect and protect both hard-working city employees and taxpayers

Retirement Reform Process
• For the Brown Administration, this process started back in June 2011 with the detailed work of then Mayor-elect Brown’s Pension Transition Committee.
• Peyton Administration laid foundation with 2011-400

The Retirement Reform Process, continued
• Those efforts, along with other community analyses, helped to frame up four key questions for our retirement reform initiative:
• (1) What is the scope of the problem?

The Retirement Reform Process, continued
• (2) How have other municipalities dealt with retirement cost challenges?
• (3) What limitations does Florida law place on the reform of retirement benefits?
• (4) What reform plan(s) address the city’s financial needs while meeting the state’s legal requirements?

Retirement Reform Experts
• To help answer those questions, we turned to three experts:
– Attorney Jim Linn of Lewis, Longman, and Walker in Tallahassee
– Actuary Robert Dezube of the Milliman Group to evaluate the PFPF and assist in making reform recommendations
(Milliman is the actuary for the FRS)

Retirement reform experts, continued
• Jeff Williams of the Siegel Group to evaluate the General Employees Pension Plan (GEPP) and assist in making reform recommendations
• Mayor’s Special Adviser on Pensions, Kevin Hyde.

COJ Pension Plans
• Police and Fire Pension Fund (PFPF)
• General Employees Pension Plan (GEPP)– Includes Corrections Employees
12

Specific PFPF Challenges
1. Annual Contributions Skyrocketing
Fiscal Year 10/11: $76.1 million
(8% of overall general fund)
Fiscal Year 12/13: 121.3 million
(Nearly 13% of overall general fund)13
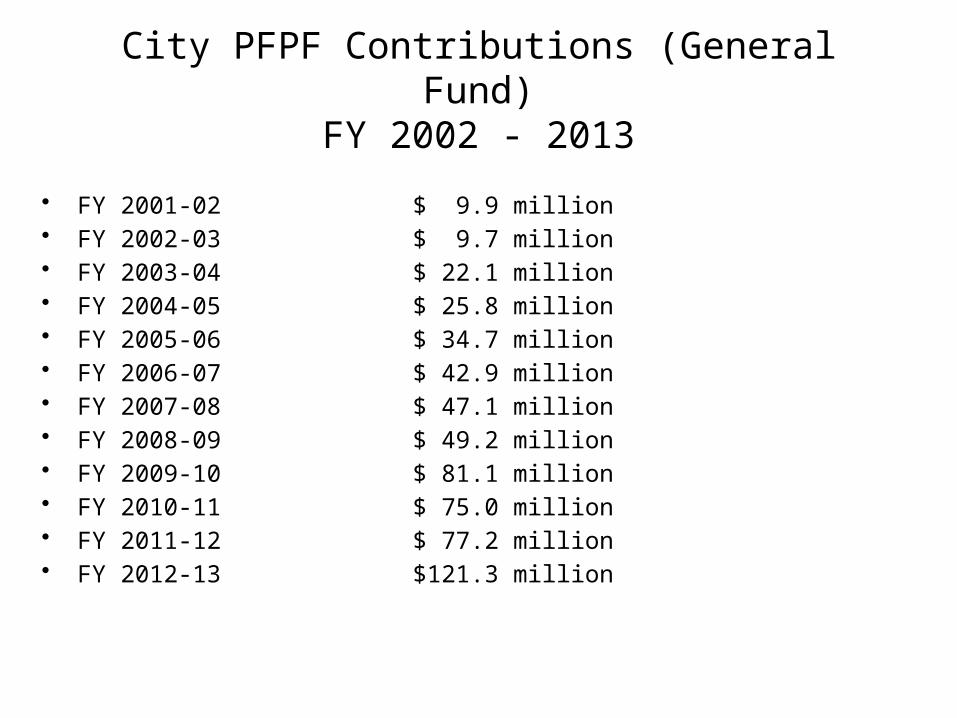
City PFPF Contributions (General Fund)FY 2002 - 2013
• FY 2001-02 $ 9.9 million• FY 2002-03 $ 9.7 million
• FY 2003-04 $ 22.1 million• FY 2004-05 $ 25.8 million• FY 2005-06 $ 34.7 million• FY 2006-07 $ 42.9 million• FY 2007-08 $ 47.1 million
• FY 2008-09 $ 49.2 million• FY 2009-10 $ 81.1 million• FY 2010-11 $ 75.0 million• FY 2011-12 $ 77.2 million• FY 2012-13 $121.3 million

2. PFPF Significantly Underfunded
Unfunded Actuarial Liability (UAAL)
Actuarial accrued liability (value of benefits)Minus Net assets available for benefits
= Unfunded Actuarial Accrued Liability(bigger number means bigger problem)
15

Increase in UAAL
16
Oct. '03 Oct. '06 Oct. '08 Oct.'110
200
400
600
800
1000
1200
1400
1600
UAAL
UAAL

Pension Report Card Grade for PFPF
“F”Source:
Tough Choices Facing Florida’s Government
November 2011 – based on 2009 data
Leroy Collins Institute
Reason: Plan was less than 50% funded
17

The Cost of Inaction
• If the COJ takes no action – PFPF benefits stay the same and we rely on the same assumptions as to rate of return on investments (7.75%) – we will continue to underfund the PFPF while steadily increasing general fund contributions.
18

Pension Cost Components
1. Normal Cost – annual cost of current benefits, without unfunded actuarial accrued liability (UAAL) payment
2. UAAL Amortization Payment
[UAAL = assets minus liabilities = debt]
Actuarial losses Plan improvements
19

Projected Contributions Under Status Quo
Series1
Ser
ies1
0
50,000,000
100,000,000
150,000,000
200,000,000
250,000,000
300,000,000Recommended City Contribution
Employer Normal Cost UAL Amortization
Rec
om
men
ded
Cit
y C
on
trib
uti
on
20

Projected Contribution Trend Under Status Quo
2013 2014 2015 2016 2017 2018 2019 2020 2021 2022 2023 2024 2025 2026 2027 2028 2029 2030 2031 2032 2033 2034 2035 2036 2037 2038 2039 2040 2041 2042 2043
$131.988592678547
143.692067587921
151.237350722791
157.576115797781
164.236671915082
168.970155450913
174.770992826171
178.558166201967
182.206836908616
189.708469789908
197.905458469548
207.483951489574
216.409428958765
225.615866887931
235.229451182178
219.098779726701
218.173690968736
228.731009320338
239.422960101416
250.534861966086
261.178883362744
273.628030493931
254.055111616427
264.723645423725
277.662088750207
268.828768194505
280.999368055187
248.946694703623
258.944081011062
271.872870185172
173.551680029456
25
75
125
175
225
275
Projection of Recommended City Contribution
Rec
om
men
ded
Cit
y C
on
trib
uti
on
(m
illi
on
s)
21

Projected UAAL Trend Under Status Quo
2011 2012 2013 2014 2015 2016 2017 2018 2019 2020 2021 2022 2023 2024 2025 2026 2027 2028 2029 2030 2031 2032 2033 2034 2035 2036 2037 2038 2039 2040 2041
$1409.751559
1547.8581325075
1596.97753295733
1626.42896692502
1648.36191782071
1662.21071158632
1674.00548338176
1681.54180070885
1684.77503845628
1685.41940338664
1684.23499462661
1676.88613756517
1662.71678881147
1639.68031091436
1607.98280260022
1564.17796534424
1509.86347715342
1469.19781050781
1429.66367647966
1379.25991012934
1315.17560436186
1237.9079725199
1147.1677120877
1040.36801798699
949.976820060985
846.062597465711
725.914892821803
610.630948122993
478.989967552525
375.696503525346
259.70832845356
100
300
500
700
900
1,100
1,300
1,500
1,700
Projection of Unfunded Actuarial Accrued Liability ($ mil-lions)
UA
AL
($
mil
lio
ns)
22

Key Status Quo Data Points
• Retirement benefits stay the same• Rate of return remains at 7.75%• Anticipated FY 2013 Contribution: $122m• Recommended COJ Contributions:
– FY 2014: $144 million– FY 2015: $151 million– FY 2016: $158 million– FY 2017: $164 million– FY 2018: $169 million– FY 2019: $175 million
23

Bottom Line for Next Budget
• If nothing changes – benefits stay the same, the assumed rate of return stays the same – the City will devote an additional $22 million in general fund revenue to the PFPF (yet still be under-funding).
24

The Rate Debate
• Growing consensus that the assumed rate of return (7.75%) is too optimistic given recent market conditions.
• The State of Florida has worked to utilize more realistic assumptions in the Florida Retirement System (FRS) and urged municipal governments to do the same.
25

More on the Rate Debate
• In September, Florida State Board of Administration Exec. Dir. Ash Williams recommended that the state lower its rate of return from 7.75% to 7.25%.
• PFPF Executive Director John Keane and actuary Jarmon Welch say they want to lower the PFPF rate “in stages”
26

Even More on the Rate Debate
• In September, PFPF provided data from its investment advisers showing an expected actual return of 6.9% over the next 10 years.
• Based on that data, our actuary recommended an assumed rate of return of 6.5% (6.9% minus .4% commission for PFPF investment advisers)
27

The Costs of Inaction with a Realistic Rate of Return
• Adjusting the rate of return from 7.75% to a more realistic 6.9% is a fiscally conservative and prudent step that limits PFPF underfunding.
• But it causes annual COJ contributions to the PFPF to grow substantially
28

Contribution Projection: Same Benefits, New Rate
Series1
Ser
ies1
0
50,000,000
100,000,000
150,000,000
200,000,000
250,000,000Recommended City Contribution
Employer Normal Cost UAL Amortization
Rec
om
men
ded
Cit
y C
on
trib
uti
on
29

Contribution Trend: Same Benefits, New Rate
2013 2014 2015 2016 2017 2018 2019 2020 2021 2022 2023 2024 2025 2026 2027 2028 2029 2030 2031 2032 2033 2034 2035 2036 2037 2038 2039 2040 2041 2042 2043
$167.386839025735
180.502650658775
186.068883245014
190.176838243258
194.460835578562
196.826502339378
200.011056525029
201.320322062845
202.482561479985
206.876633629376
211.731644628432
217.575291665322
222.650141373642
227.752981478701
233.040124393886
218.000023818192
215.09122718186
221.009266281085
226.909364591408
232.939549822709
238.384336365634
244.903185386644
228.871712941804
234.016259418794
240.643069251381
232.607381794007
238.507269991113
215.907755624508
220.503402191614
226.934860254739
119.668180124325
25
75
125
175
225
275
Projection of Recommended City Contribution
30

UAALTrend: Same Benefits, New Rate
2011 2012 2013 2014 2015 2016 2017 2018 2019 2020 2021 2022 2023 2024 2025 2026 2027 2028 2029 2030 2031 2032 2033 2034 2035 2036 2037 2038 2039 2040 2041
$1792.792214
1956.473825845
1979.32161309793
1981.43362105029
1976.82126391756
1964.0015478392
1948.75488709375
1928.71807765984
1904.31570426273
1877.04759005481
1847.78871208837
1812.79758254912
1771.75796392981
1723.10715933525
1667.28125412204
1601.45405808997
1527.48601445582
1464.14033485545
1401.53572563605
1330.37123571739
1248.48025131902
1156.74141586976
1055.13399243629
942.101644029654
840.456216171581
729.150985127733
606.505143241036
486.528353826704
355.01153812044
240.604613803267
116.531674660481
250
750
1,250
1,750
2,250
Projection of Unfunded Actuarial Accrued Liability ($ mil-lions)
UA
AL
($
mil
lio
ns)
31

Key Data Points for Same Benefits, New Rate of Return
• Retirement benefits stay the same• Rate of return lowered to 6.9%• Anticipated FY 2013 Contribution: $122m• Recommended COJ Contributions:
– FY 2014: $181 million – FY 2015: $186 million– FY 2016: $190 million– FY 2017: $194 million– FY 2018: $197 million– FY 2019: $200 million
32

COJ Reform Options
• Fundamental Operating Principles
• Utilization of “Freeze” Concept
• The Reform Plan
33

Fundamental Operating Principles
1. Reform will not rely on an increase in the millage rate.
2. Any reform must use realistic assumptions on rate of return and payroll growth.
3. Current retirees will not be affected.
34

Fundamental Operating Principles, continued
4. All current employees will keep what they have already earned but will experience change once the reform plan is implemented.
5. Any reform must reduce the unfunded liability, not merely extend the time for payment. Debt will not pay for debt.
• We will not propose Pension Obligation Bonds or Pension Liability Reduction Bonds
35

The “Plan Freeze”
– The current plan will be “frozen” as of date certain (the “Frozen Plan”).• Employees’ vested benefits as of that date will be
fixed at whatever level the employee was entitled to as of date certain
– Example – employee who had worked 10 years had vested at 30% (10 x 3% yearly) in the plan. Upon retirement the employee is entitled to retirement benefit at 30% of pay.
– Employee will not accrue any additional benefits under the frozen plan for subsequent years of service
36

After the “Plan Freeze”
• A new plan will be implemented from a date certain going forward
• Employees will begin accruing benefits under the new plan or all service after the Frozen Plan fixed date.
• The new plan will have different benefits from what was available in the Frozen Plan
• This approach is not unique – the most effective way to achieve meaningful savings on a short and long term basis
37

The Plan: Maintain Defined Benefit (DB) model but reform benefit package
– Working with our experts, we crafted a reform package that we believe will credibly:
• Fund COJ pension obligations• Control costs short and long term• Comply with law to retain Chapter funds• Reduce UAAL
38

Current System vs. DB Reforms
Benefit-by-Benefit Comparison
39

Benefit CapCURRENT JAX
POLICE OFFICERS &
FIREFIGHTERS
2011-400 PROPOSED CHANGES
None None Cap of $99,999
40

Normal Retirement AgeCURRENT JAX
POLICE OFFICERS &
FIREFIGHTERS
2011-400 PROPOSED CHANGES
20 years 55/10 years or
65/5<10yrs
60 years of age AND 27
years of work
41

Employee Contribution
CURRENT JAX POLICE
OFFICERS & FIREFIGHTERS
2011-400 PROPOSED CHANGES
7% 8% 14%
42

Benefit Accrual RateCURRENT JAX
POLICE OFFICERS &
FIREFIGHTERS
2011-400 PROPOSED CHANGES
3% (for 20yrs); then 2% for cap
at 80%
2.8% (for 25yrs); then 2% for cap
at 80%
1.667% with a cap at 50%
43

COLACURRENT JAX
POLICE OFFICERS &
FIREFIGHTERS
2011-400 PROPOSED CHANGES
3%, 3mos. after DROP
3%, 24 mos. after
separation
Elimination, if not
accrued
44

DROPCURRENT JAX
POLICE OFFICERS &
FIREFIGHTERS
2011-400 PROPOSED CHANGES
DROP Eligibility at
20 yrs
Delay DROP Eligibility to
25 yrs
Elimination
45

Average Final Contribution
CURRENT JAX POLICE
OFFICERS & FIREFIGHTERS
2011-400 PROPOSED CHANGES
Avg. last 24 mos.
(52 pay pds.)
Avg. of last 5 Avg. of last 5
46
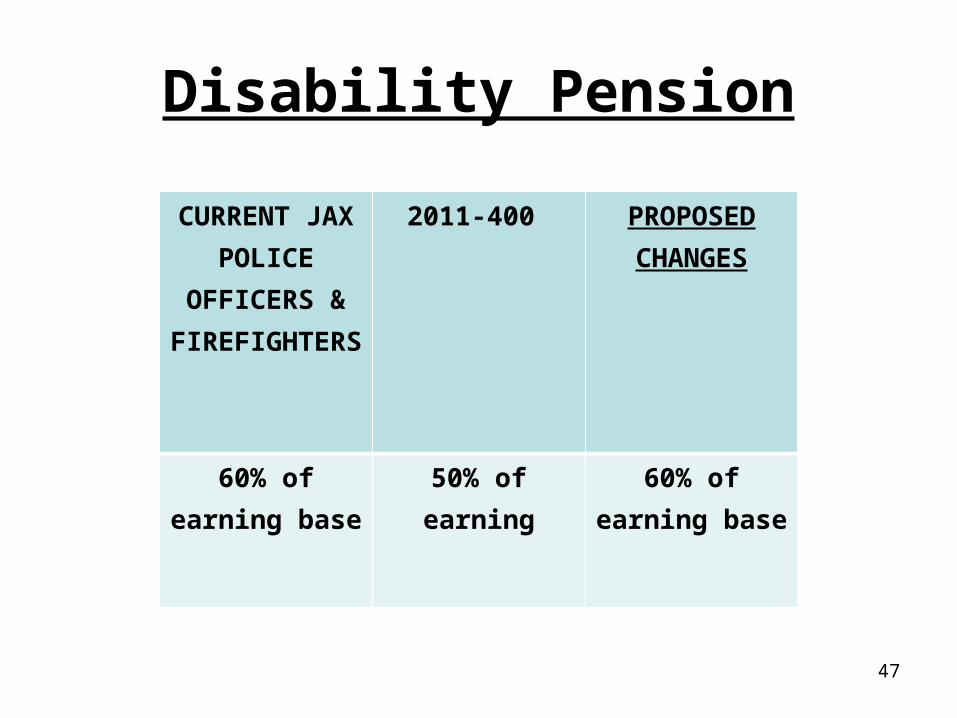
Disability Pension
CURRENT JAX POLICE
OFFICERS & FIREFIGHTERS
2011-400 PROPOSED CHANGES
60% of earning base
50% of earning 60% of earning base
47

Pensionable Wages
CURRENT JAX POLICE
OFFICERS & FIREFIGHTERS
2011-400 PROPOSED CHANGES
No Change No change Exclude Shift and
Differentials
48

DB Reform: City Contribution
Series1
Ser
ies1
0
50,000,000
100,000,000
150,000,000
200,000,000
250,000,000 Recommended City Contribution
Employer Normal Cost UAL Amortization
Rec
om
men
ded
Cit
y C
on
trib
uti
on
49

DB Reform: Contribution Trend
2013 2014 2015 2016 2017 2018 2019 2020 2021 2022 2023 2024 2025 2026 2027 2028 2029 2030 2031 2032 2033 2034 2035 2036 2037 2038 2039 2040 2041 2042 2043
$122.01693773701
132.55643683876
137.836745694657
141.8908824993
146.389019485776
148.809400206101
152.844296298488
154.502302698852
155.734103292209
160.408151822953
165.441387213858
171.312267391898
176.685699199932
182.164368830316
187.787799604363
172.700630039021
169.516540184567
175.133781505044
180.68262812511
186.215456880396
191.19818714156
197.192459961254
180.538055599325
185.119347982805
190.797766693428
182.024579065869
187.170664772476
163.751390442552
167.617129177925
173.427825595508
74.2812923069966
25
75
125
175
225
Projection of Recommended City Contribution
Rec
om
men
ded
Cit
y C
on
trib
uti
on
Per
cen
tag
e
50

DB Reform: UAAL Trend
2011 2012 2013 2014 2015 2016 2017 2018 2019 2020 2021 2022 2023 2024 2025 2026 2027 2028 2029 2030 2031 2032 2033 2034 2035 2036 2037 2038 2039 2040 2041
$1718.7969089796
1837.99806229353
1862.15603390413
1867.82865011105
1867.13038202144
1859.93539286967
1850.31541096349
1838.86597676982
1823.94672478459
1807.68802179634
1790.22904891674
1768.03317418271
1740.24860078333
1705.34681422736
1663.25093676401
1612.91077247144
1553.16622755123
1505.7030668633
1458.18386361747
1401.34058430827
1335.48429452039
1259.23718845455
1172.86885965878
1075.09105589148
988.369498278328
892.198312734641
784.435600829684
679.696311084713
563.970294028003
466.324850432603
359.465933850165
100
300
500
700
900
1,100
1,300
1,500
1,700
1,900
Projection of Unfunded Actuarial Accrued Liability ($ mil-lions)
UA
AL
($
mil
lio
ns)
51

Key Data Points for DB Reform (Level Percent of Pay)
• Retirement benefits modified in DB model• Rate of return lowered to 6.9%• Anticipated FY 2013 Contribution: $122m• Recommended COJ Contributions:
– FY 2014: $133 million– FY 2015: $138 million– FY 2016: $142 million– FY 2017: $146 million– FY 2018: $149 million– FY 2019: $153 million
52

Bottom Line for Next Budget
• Let’s look at this in two ways.
• If we simply compare this to how much we are slated to pay next year under the status quo, $133 million is $11 million less than $144 million.
• But that $133 million means we are not underfunding the plan.
53

More on Next Budget
• And $133 million is $48 million less than $181 million.
• If we make the rate of return more realistic without changing benefits, we would have to spend $181 million next year to fully fund our obligations.
• If we use more realistic assumptions, modify DB benefits, and use the level percentage of payroll approach, COJ will save $48 million and still fully
fund plan.54

What Does $48 Million Mean?
• $48 million means the jobs of 800 City of Jacksonville employees if you assume an average compensation amount of $60K (salary + benefits).
• $48 million means approximately the combined FY 2013 budgets for Public Libraries and Parks & Recreation.
55

Retirement Reform Process
• We haven’t negotiated directly with the Police and Fire Pension Fund or with the General Employees Pension Plan because the law says that employee benefits should be negotiated with unions.
• Judicial decisions hold that retirement benefits are a mandatory subject of collective bargaining with unions.
56

More Retirement Reform Process
• And in the contracts that they signed and that City Council overwhelmingly ratified, several unions agreed that they would sit down with the City and discuss retirement reform.
• That process starts this week with meetings with four
COJ employee unions.
57

Schedule of Meetings
• Monday, 10/29: FOP
• Tuesday, 10/30: AFSCME
• Wednesday, 10/31: FOP
• Thursday, 11/1: LIUNA and JSA
58

Retirement Reform Resources
• Web Page at www.coj.net
• Fact Sheet
• Employee Q&A
• Side-by-Side
• Links to studies59