retail banking and wealth management - investor update
TRANSCRIPT

March 2016
Investor Update
Retail Banking and Wealth Management

2
Important notice and forward-looking statements
The information set out in this presentation and subsequent discussion does not constitute a public offer for the purposes of any applicable law or an offer to sell or solicitation of any offer to purchase any securities or other financial instruments or any recommendation in respect of such securities or instruments.
Important notice
Forward-looking statements
This presentation and subsequent discussion may contain projections, estimates, forecasts, targets, opinions, prospects, results, returns and forward-looking statements with respect to the financial condition, results of operations, capital position and business of the Group (together, “forward-looking statements”). Any such forward-looking statements are not a reliable indicator of future performance, as they may involve significant assumptions and subjective judgements which may or may not prove to be correct and there can be no assurance that any of the matters set out in forward-looking statements are attainable, will actually occur or will be realised or are complete or accurate. Forward-looking statements are statements about the future and are inherently uncertain and generally based on stated or implied assumptions. The assumptions may prove to be incorrect and involve known and unknown risks, uncertainties, contingencies and other important factors, many of which are outside the control of the Group. Actual achievements, results, performance or other future events or conditions may differ materially from those stated, implied and/or reflected in any forward-looking statements due to a variety of risks, uncertainties and other factors (including without limitation those which are referable to general market conditions or regulatory changes). Any such forward-looking statements are based on the beliefs, expectations and opinions of the Group at the date the statements are made, and the Group does not assume, and hereby disclaims, any obligation or duty to update them if circumstances or management’s beliefs, expectations or opinions should change. For these reasons, recipients should not place reliance on, and are cautioned about relying on, any forward-looking statements. Additional detailed information concerning important factors that could cause actual results to differ materially is available in our 2015 Annual Report and Accounts.
This presentation contains non-GAAP financial information. The primary non-GAAP financial measure we use is ‘adjusted performance’ which is computed by adjusting reported results for the period-on-period effects of foreign currency translation differences and significant items which distort period-on-period comparisons. Significant items are those items which management and investors would ordinarily identify and consider separately when assessing performance in order to better understand the underlying trends in the business. Reconciliations between non-GAAP financial measurements and the most directly comparable measures under GAAP are provided in the 2015 Annual Report and Accounts and the Reconciliations of Non-GAAP Financial Measures document which are both available at www.hsbc.com.

3
Group highlights
2015 Full Year
Reported PBT (2014: $18.7bn)
$18.9bn
2015
Financial
Performance
Capital and
dividends
Strategy
execution
‒ Reported PBT up 1%: net favourable movement in significant items
‒ Adjusted PBT fell 7%:
‒ Higher revenue of $0.5bn (1%) from growth in client-facing GB&M (7%), CMB (3%)
and Principal RBWM (2%)
‒ Higher costs (up $1.6bn) from increased bank levy ($0.4bn), investment in growth
($0.3bn) and regulatory programmes and compliance ($0.7bn)
‒ Higher LICs (up 17% or $0.6bn) across a number of countries and industrial sectors,
most notably oil and gas Adjusted PBT (2014: $22.0bn)
$20.4bn
Reported RoE (2014: 7.3%)
7.2%
Adjusted Jaws
(3.7)%
CET1 ratio (2014: 11.1%)
11.9%
‒ Strong capital position with a common equity tier one ratio of 11.9% on an end point basis and
a strong leverage ratio of 5.0%
‒ Progressive dividends in 2015 of $0.51 per ordinary share; total dividends in respect of the
year of $10.0bn
‒ Clearly defined actions to capture value from our network and connecting our customers to
opportunities
‒ Progress on reducing Group RWAs with a $124bn reduction from RWA initiatives or
45% of our rebased 2017 target achieved
‒ Signed agreement to sell operations in Brazil1
‒ Revenue from transaction banking products up 4% highlighting the value and
potential of our international network
‒ Development of Asia business gaining momentum – revenue growth in excess of
GDP in seven out of eight of our priority Asia markets
‒ 2H15 costs in line with 1H15 following tight cost control and the initial effect of our
cost saving plans
Ordinary dividends In respect of the year
(2014: $0.50)
$0.51
1. We plan to maintain a corporate presence in Brazil to serve our international clients

4
Group 2015 key metrics
1. From 1 January 2015 the CRD IV transitional CET1 and end-point CET1 capital ratios became aligned for HSBC Holdings plc due to recognition of unrealised gains on investment property and available-for-sale securities 2. Net bank levy charge was USD1,421m in 2015 and USD1,063m in 2014; 1Q14 and 1Q15 included credits relating to the prior year’s bank levy charge of USD45m and USD44m respectively
2015 Full Year
Return on average ordinary shareholders’ equity
Jaws (adjusted)
Dividends per ordinary share in respect of the year
Key financial metrics
7.3% 7.2% >10%
- (3.7)% Positive
$0.50 $0.51 Progressive
FY14 FY15 Target
Advances to deposit ratio
Net asset value per ordinary share (NAV)
Tangible net asset value per ordinary share (TNAV)
72.2% 71.7% n/a
$9.28 $8.73 n/a
$7.91 $7.48 n/a
Revenue 12,950 (1)% 57,765 1%
LICs (1,645) (63)% (3,721) (17)%
Costs (9,959) (2)% (36,182) (5)%
Bank levy2 (1,465) (32)% (1,421) (34)%
Costs excl. bank levy (8,494) 2% (34,761) (4)%
Associates 557 2% 2,556 3%
PBT 1,903 (34)% 20,418 (7)%
Adjusted Income Statement (USDm)
4Q15 vs. 4Q14 2015 vs. 2014
Revenue 11,772 (18)% 59,800 (2)%
LICs (1,645) (32)% (3,721) 3%
Costs (11,542) 3% (39,768) 4%
Bank levy2 (1,465) (32)% (1,421) (34)%
Costs excl. bank levy (10,077) 6% (38,347) 5%
Associates 557 (2)% 2,556 1%
PBT (858) (150)% 18,867 1%
Reported Income Statement (USDm)
4Q15 vs. 4Q14 2015 vs. 2014
Earnings per share
Common equity tier 1 ratio (end point basis)1
Return on average tangible equity
Leverage ratio
$0.69 $0.65 n/a
11.1% 11.9% n/a
8.5% 8.1% n/a
4.8% 5.0% n/a

5
Key strategic priorities Retail Banking and Wealth Management
1. Financial data presented on an “adjusted” basis. 2017 is presented at 1Q 2015 average rates 2. Includes associates
RoRWA excl.
Associates
2015, USDbn
Operating expenses 14.9
Revenue 22.7
LICs 1.9
PBT2 6.3
CER 66%
RWA 152
– Consistently strong returns, accretive to Group RoE Capital accretive
Sustainable
high quality
revenue
Diversified
revenue base
Strong deposit
franchise
– Client base positioned towards affluent customers
– High quality asset book with low LICs
– Repositioned the business for conduct risk
– Revenue sources broadly spread across products and segments
Group value
– Business will benefit as interest rates rise
– Shared infrastructure generates economies of scale
– Global footprint enhances brand visibility
– Branch services support other Global Businesses
Interest rate
sensitivity
– Supports a stable and diversified core funding base for the
Group
Total RBWM, USDbn 2015
Adjusted PBT: 6.8
Of which: US run-off portfolio 0.5
Principal RBWM 6.3
Key messages Principal RBWM financial outlook1
6.3
4.5
2017E 2015

6
RBWM is now a simpler business, delivering sustainable, diversified revenues RBWM Investment Case
1. Principal RBWM financial data presented on an “adjusted” basis with comparatives translated at average 2015 exchange rates 2. Data since 2011 3. Number excludes impact of disposals (c.20k FTE reduction)
– Simplified our portfolio with 62
disposals / closures of business
lines or markets2 Simpler
portfolio
Consistent
organisation
Reduced costs
– Implemented a common
organisation design and target
operating model
– Reduced headcount by over
17,700 FTE2,3
8%Other Latin
America
Asia
Europe
Brazil
North
America
MENA
2015
38%
32%
10%
8%
4%
6.8 6.3
2015
22.7
2014
22.7
Revenue PBT
Business transformation Principal RBWM Revenue and PBT1
(USDbn)
Principal RBWM Revenue by
region1

7
Through Premier and Advance, we are able to attract an affluent client base, with higher revenue per customer RBWM Investment case
1. Deposit market share > 4% as at Dec 2014 2. Australia, Canada, China, France, Hong Kong, India, Indonesia, Malaysia, Mexico, Singapore, Turkey, UAE, UK US: Source: Datamonitor as of September 2014 3. Existing customers as at Dec 2015; New customers acquired in 2015 4. Selected examples only. In some countries neither HSBC nor the market have a high proportion of Premier clients. E.g. Turkey (1% Market, c.4% Premier customer base) 5. Premier / Advance estimated as % of banked individuals holding USD 100,000 / USD 50,000 or more in liquid assets; Source: Datamonitor as of September 2014
New
customers3
Existing
customers3
Market2,5
2x
Personal
1x
Premier
6x
Advance
Latin America
North America
Middle East
Asia
Europe
Premier Advance
Customer
base
compared to
market
Customer
revenues by
segment
– Close to 45 million customers
worldwide, served through a
consistent global proposition
model
– Significant domestic scale in
two home markets, Hong Kong
and UK
– A strong local market share1 in
five further priority markets
– Focused on developing affluent
segments in other priority
markets
Personal Advance Premier
France 7% c. 50%
Canada 17% c. 35%
UAE 3% c. 23%
China 2% c. 71%
8%
21%
35%
RB
WM
G
PB
Customers and markets Positioned towards affluent customers
Selected markets4 HSBC customer
base
% Premier Market5
Revenue per customer Geographical distribution
of customers by segment (Dec 2015)

8
Conduct risk is redefining how retail banks engage with and serve their customers. We have proactively repositioned the business for this… RBWM Investment case
All figures are sourced from 2010, 2011, 2012, 2013, 2014 and 2015 Annual Report and Accounts & Data Pack 1. Reported basis. 2010 figure corresponds to RBWM (total) reported LIC less USD7.9bn related to US CRS and US run-off. In the first half of 2015, a portfolio of customers was transferred from CMB to RBWM in Latin America in
order to better align the combined banking needs of the customers with our established global businesses. 2014 and 2013 comparatives have been re-presented accordingly 2. 2014 and 2015 include provisions arising from the ongoing review of compliance with the Consumer Credit Act in the UK , respectively of USD568m and USD22m
Credit and
conduct risk
cost
– Removed the formulaic link between product
sales and remuneration: staff are paid on a
discretionary basis
– Simplified our product shelf (c.30% reduction
in retail products as of 2015 vs. 2012)
– Addressed pro-actively the Fair Value
Exchange (FVE) between customers and
shareholders
– Implemented new sales quality monitoring,
including mystery shopping and strengthened
assurance programme
– Deployed new investment product risk
framework to better match products with
clients’ risk profile
UK customer redress / CCA provisions2
Principal RBWM LICs1
1,8771,906
2,805
2,6242,737
3,274
563
953
1,751
875
78
2010
1,560
2011 2012 2013 2014 2015
UK customer redress and CCA provisions at their lowest since 2010 (USDm) Numerous actions to significantly
reduce conduct risk starting in 2012

9
… and we are maintaining our credit discipline – Example RBWM UK RBWM Investment case
Source: “Stress testing the UK banking system: 2015 results”, Bank of England , Dec 2014 and Dec 2015, respectively page 17 and page 46 1. Data sources: Participating banks’ FDSF data submissions, Bank of England analysis and calculations 2. Cumulative impairment charge rates = (three-year total impairment charge) / (average gross on balance sheet exposure), where the denominator is a simple average of 2014, 2015 and 2016 year-end positions. This calculation
may result in a lower impairment rate for those banks that expand balances significantly in the later years of the scenario as the economy recovers
0%
5%
10%
15%
20%
25%
Barclays LBG Nation-wide
RBS San UK HSBC
0%
1%
2%
3%
4%
LBG San UK RBS HSBC Barclays Nation-wide
0%
1%
2%
3%
4%
LBG Co-op San UK RBS Nation-wide
Barclays HSBC
0%
5%
10%
15%
20%
25%
Barclays Co-op LBG San UK RBS Nation-wide
HSBC
2014
2015
PRA stress tests: Projected cumulative three-year
impairment charge rates on UK individuals mortgage
lending in the stress1,2 (%)
PRA stress tests: Projected cumulative three-year
impairment charge rates on UK individuals non-
mortgage lending in the stress1,2 (%)

10
The repositioning impacted the rate of revenue growth in 2013 and 2014, but we are confident the quality of revenues is improving… RBWM Investment Case
1. 1Q13: Global Wealth Incentive Framework (GWIF) globally, and Retail Bank Incentive Framework (RBIF) in Canada, USA and UK; 1Q14: GWIF and RBIF in all other markets
2011 2012 2013 2014 2015
– Business Risk Review
– New Risk Profiling tool
– New global policy to protect
Potentially Vulnerable Clients
– Global Product Range Review
– First phase of new sales Incentive
Frameworks1
– Global Sales Quality Standards
– Global Mystery Shopping
– Fair Value Exchange
– Second phase of new sales
Incentive Frameworks1
– Updated Financial Planning
Standards
Principal RBWM revenue progress 2011 to 2015 (USDm)
Implementation (2014) Implementation (2013) Design and policy (2012)

11
+90%
... and there are signs that the repositioning is leading to improved customer experience – Example RBWM Mexico RBWM Investment Case
1. Financial data presented on an “adjusted” basis with comparatives based on 2015 average exchange rates 2. Other lending includes value of total drawdowns for Personal loans, Payroll loans and Mortgages 3. Source: HSBC Customer Recommendation Index Q4’14-Q4'15, TNS Global
Q4 2015
84
82
85
80
83
Q3 2015 Q2 2015 Q1 2015 Q4 2014
86
74
83
Santander BBVA Banorte Banamex HSBC
+7%
2015 2014
+106%
Other lending
(USDm)
Cards (k)
2015 2014
– In 2013-24, a new incentive framework was implemented across
the Group, remunerating staff for meeting customer needs
– Following an initial decline as we adjusted to the new framework,
product sales and revenue have been steadily increasing over
the past year
– Implementation of the Conduct Agenda has resulted in an
improved customer experience and a better reputation for the
bank
HSBC
– Customers feel valued
– Advice is relevant to customer needs
– Customers are treated fairly
Competitor 1 – Strong reputation
– Good customer service
Competitor 2 – Customers feel understood
– Poor relationship managers service
Latin American Retail
Bank of the Year 2015 : HSBC Mexico
78
82
Conduct Agenda Business performance
Reported drivers of customer recommendation3 Customer recommendation3
Revenues1 Sales volumes2

12
Our growth priorities have not changed and we continue to optimise our portfolio of markets and businesses Growth Priorities
1. Money lent to individuals rather than institutions. This includes both secured and unsecured loans such as mortgages and credit card balances. 2. Aggregate of Deposits (both local and foreign currency), investments (e.g. Mutual Funds, Equities, etc.) and Insurance (Life, Pension and Investment insurance products). It is exclusive of Credit Enhancement Services Insurance
and General Insurance products, pure Protection Insurance products as well as Mortgage or other Loan / Asset balances 3. Wealth Distribution revenue only 4. Total customers who have logged in to one of our Digital platforms (Internet / Mobile) in the last three months as a % of all RBWM active customers (priority markets)
– Principal RBWM lending balance1
growth 3-4% CAGR
Growth
Priorities
– Premier Total Relationship Balance2
5-7% CAGR
– Wealth revenue3 growth 5-7% CAGR
– Review market portfolio in line with Group priorities and requirements
– Address low performing / sub-scale businesses
– Focus investment on key priority growth markets
Portfolio
optimisation
– 40-50% of customers digitally active4
– 2017 exit cost rate at 2014 level
– Portfolio review conclusions
implemented
4
1
– Invest in marketing, customer relationship management, analytics
and digital
– Strengthen credit capabilities (people, tools)
– Acquire new customers through unsecured lending
Relationship-led Personal Lending
– Deliver competitive Premier USD1-5m, International, FX and Digital
propositions
– Disciplined execution of the needs-based sales model
– Continue strong collaboration with the rest of Group
– Accelerate the pivot of Insurance and Asset Management towards
Asia
2 Wealth Management
– Expand digital ways of working within RBWM including digitalisation
of processes
– Deliver data-driven, relevant and timely customer touchpoints
– Leverage digital investment to transform customer experience
– and cost base
3 Digital
Continue portfolio optimisation
– c.10% growth p.a. AUM in Asia
In progress
In progress
In progress
Strategic actions Targeted outcome 2014-17 2015 Progress

13
We have the capacity to take more credit risk in RBWM and the business
is showing signs of volume growth Relationship-led Personal Lending
1. Principal RBWM financial data presented at December 2015 exchange rate 2. Average Weekly Sales for Priority Markets; Cards: Number of new cards issued; Loans & Mortgages: Value of total drawdowns in USD
– Global analytics capability improving the identification of customer needs
– New triggers enabling targeted offers to individual customers
– Expansion of sales channels supported by increased investment in marketing,
improving new-to-bank customer acquisition
– Consistently implemented global segmentation capability, strengthening
pricing and profitability discipline
– Integrated risk approach enhancing risk adjusted returns
– Investing further in analytics, including digital targeting and real-time offer
capability
– Deploying digital utilities (e-signature, document upload) to simplify the
customer experience and enable straight through processing
– Focusing on innovation, including new mobile sales and service capabilities,
and strategic partnerships with new payment providers
– Leveraging the Group’s connectivity to deliver international mortgages and
global consumer offers
Sales
volumes2
Personal
lending
balances1
(USD)
+19%
2015 2014
+25%
2015 2014
+13%
2015 2014
+3%
2015 2014
Principal RBWM lending balances and sales volume growth Actions to date
Next steps Cards Loans Mortgages

14
Our investment in a differentiated Wealth offering is driving improved performance, with further opportunities for growth Wealth Management
1. HSBC Premier Relationship Manager Customer Experience Survey 4Q15; Median recommendation score across 18 priority markets 2. YTD constant currency FX rate. Mutual funds gross sales (USDm); Equities turnover (USDm); Wealth balances (USDbn); Wealth revenues (USDm) 3. Wealth Distribution revenues only 4. New Net Money collected for Top 10 Markets, of which $30bn is Liabilities, USD6bn is Investments and USD3bn is Insurance. Excluding mortgages
– Further customising our Premier proposition to better meet the needs of
wealthier and more international customers
– Deploying enhanced analytics to improve our understanding of customer
needs
– Investing in marketing, tools, and digital capabilities
– Simplifying our processes for our customers
– Bringing Asset Management and Insurance capabilities to retail clients
including research, insights and advice
Appointments Financial reviews
Equities Mutual funds
19% 13%
41% 1%
1% 7%
Wealth balances
2014 - 2015
Activity
Sales growth2
Financial
results2
Customer
satisfaction
Financial
planning
Integrated
advice
Aligned to
needs
– We operate a consistent global financial planning model
based on our customers’ goals and aspirations
– A single relationship manager can provide professional
advice across a customer’s Wealth and Retail needs
– Our relationship managers are rewarded for meeting
customer needs, not for product sales
82% Would recommend their Premier RM to
family or friends1
2014 - 2015
2014 2015 2014 2015
2014 2015 2014 2015
Wealth revenues3
Net New
Money4 c.USD40bn Net New Money in Investments,
Insurance and Liabilities in 2015
Strong customer satisfaction with improving sales momentum We have built a clearly differentiated Wealth offering
With opportunities for sustainable growth

15
Our Asset Management business delivers attractive returns, and is positioned to benefit from managed asset growth in Asia Asset Management
1. Source: PwC Report “Asset Management 2020 – A Brave New World” 2. Principal RBWM financial data presented on an “adjusted” basis
2020 2012
Europe
Asia Pacific
Latin America
Middle East
North America
2020 2012
+10%
+6%
+10%
+7%
Asia
Total
Asia
Total
CAGR Market
growth
opportunity
2015 2014
+6% Revenue2
2015 2014
+1% AUM2
HSBC Asset
Management
performance
– Defined contribution pensions growth, driving reliance on
investments for retirement income Retirement
– Distribution footprint aligned to forecast growth of
managed assets in key emerging markets Asia focus
– Group customer base including relationships with
pension funds and insurance companies Group
clients
– Deepened relationships with pension, insurance and corporate clients
– Developed core asset allocation solutions for RBWM
– Deployed a single global investment process and platform; ongoing alignment
with GPB for management of discretionary portfolios
– Differentiated products and services through highest standards of fiduciary
conduct and governance
– Participating in growing managed asset pools driven by individual investors’
wealth, savings and retirement plans, particularly in Asia
– Driving continued growth from Group retail distribution channels
– Leveraging Group connectivity to meet needs of institutional clients, both
long-term and liquidity management
– Potential for selective acquisitions to strengthen franchise
Global AUM1
Global
pension
fund assets 1
Asia Pacific Rest of the World
10%
Asia Pacific growth rate Rest of the World growth rate
13%
Managed asset pools are forecast to grow strongly (USD) This growth provides opportunities for us
We have already moved on these
And we are positioned for future growth

16
Insurance is accretive to the Group, with majority of exposure to Asia Insurance
1. Life Insurance 2. HK TDC (Trade Development Council) research, H1 2015 YoY 3. CAGR, Munich Re Insurance Market Outlook (May 2015)
4. 2014 EY Asia-Pacific insurance outlook 5. 2014 EY Waves of change 6. Principal RBWM financial data presented on an “adjusted” basis
HSBC
Insurance
performance6
Market growth
opportunity1
– Insurance contributes positively to Group CET1 capital through the dividends
it pays to the Group, with a high RoRWA
– Significant distribution footprint in markets where bancassurance is the
predominant channel
– Proactively addressed the conduct agenda improving customer outcomes
and minimising the risk of mis-selling
– Asia’s share of the global middle class will almost double by 20204, driving
growth and demand for wealth products including insurance, particularly to
meet saving and protection needs
– Asia’s aging population, particularly in China5, is increasing the need for
retirement and protection products as public systems become strained
– Increasing international availability and usage of RMB drives demand for
RMB-denominated insurance products
– Continued focus on the high quality and underpenetrated customer base in
Hong Kong where market growth has exceeded 13% for the last 2 years
2015 2014
+10%
2015 2014
Manufacturing revenue Distribution revenue
40%
60%
53% 47%
Rest of World Asia
China
20%
Hong Kong
14%
Gross premium annual
growth2 (2015)
Emerging Asia life
premium growth3
(2015-2025)
2015
– Committed to invest in Asia to capitalise on growth opportunities
– Fill in product gaps, enhance offerings, and simplify processes while
increasing distribution capabilities and capacity
– Support development with improved data and analytics
2020 2015
+9%
+4%
Profitable and accretive returns for Group (USD) Significant growth opportunity, particularly in Asia
The insurance business is positioned for quality earnings
Next steps

17
Digital transformation will enable process simplification and accelerate channel migration, improving productivity and customer experience Digital
1. Retail sales for mortgage, loans, cards, savings, current accounts, through digital channels in top 6 markets (includes ATM / third party sales) 2. Top 6 markets. Previously shown as c. 20%. Change reflects planned disposal of Brazil
c.-17.5%
2017 2016 2015 2014
c.75%
2017 2016 2015 2014 2017 exit cost rate 2017 2016 2015 2014
Without investment, inflation drives rising costs Investment brings 2017 exit costs to 2014 levels
Digital
transformation
Product and
service
automation
Channel
simplification
– Enhance digital platform and service capabilities
– Accelerate deployment across geographies
– Improve supporting digital operations
– Optimise end-to-end customer journeys
– Automate sales and service transactions to deliver
straight through processing
– Deliver effortless multi-channel capability
– Empower customers via self-assisted sales
– Optimise branch and contact centre footprint
Enhances
customer
experience
Improves
productivity
Simplifies
customer
interactions
Changing customer behaviour The Group’s streamlining programme will sustainably reduce RBWM’s costs
Branch area2
(million sq.m.)
Digital sales
volumes1
(million)

18
c.250k customers
Digital transformation is well under way Digital
1. Proportion of active customers that have logged into online or mobile banking at least once in the last 90 days‘, in our home and priority markets excluding Brazil 2. All data is shown as per 2015, except indicated otherwise 3. Delivering USD62m cost savings, or 0.4% of total cost base
Process
simplification2
Active
digital
users1
(%)
Channel
Migration2
– Branch optimisation programme delivering cost savings as per plan3
– Mortgages live connect video roll out in the UK with completion of 1st
remote mortgage drawdown in December 2015
– Live chat available in 6 countries with 400k chats
– Touch ID implemented in Firstdirect UK with 100,000 users in the
first month after launch
– Voice ID to be implemented from Spring 2016 onwards for telephone
banking customers, reducing time to complete the authentication
process by up to 2 minutes
– Simplified wealth advice journeys in the UK and Hong-Kong allowing
Relationship Managers to focus on value- adding discussions
– Faster decisions on online personal loans with real time approvals in
Australia and the UAE
– Paperless tablet account opening in the UK, reducing account
opening turnaround time to c.10 minutes for low risk customers
– Mortgage tablet application launch in India, reducing approval time
from days to minutes
34%
36%
36%
34%
2014 2015
Active digital users Key achievements – Examples
19
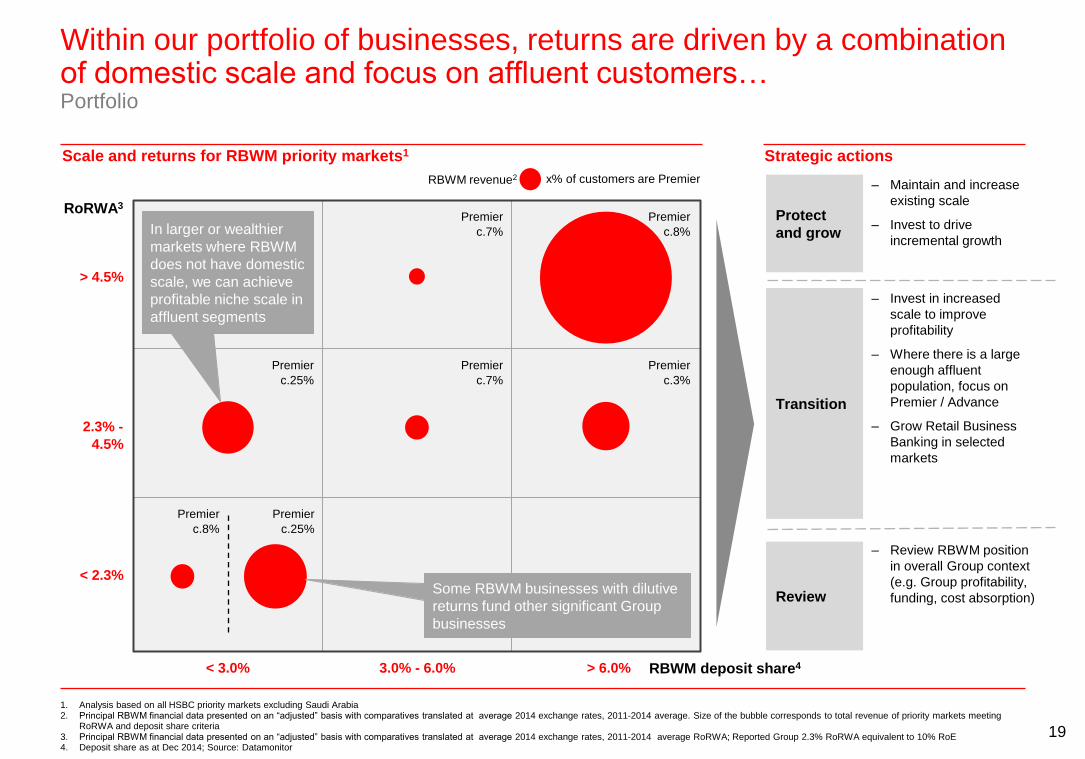
Within our portfolio of businesses, returns are driven by a combination of domestic scale and focus on affluent customers… Portfolio
1. Analysis based on all HSBC priority markets excluding Saudi Arabia 2. Principal RBWM financial data presented on an “adjusted” basis with comparatives translated at average 2014 exchange rates, 2011-2014 average. Size of the bubble corresponds to total revenue of priority markets meeting
RoRWA and deposit share criteria 3. Principal RBWM financial data presented on an “adjusted” basis with comparatives translated at average 2014 exchange rates, 2011-2014 average RoRWA; Reported Group 2.3% RoRWA equivalent to 10% RoE 4. Deposit share as at Dec 2014; Source: Datamonitor
RBWM revenue2
RoRWA3
RBWM deposit share4
> 4.5%
2.3% -
4.5%
< 2.3%
< 3.0% 3.0% - 6.0% > 6.0%
Some RBWM businesses with dilutive
returns fund other significant Group
businesses
In larger or wealthier
markets where RBWM
does not have domestic
scale, we can achieve
profitable niche scale in
affluent segments
Premier
c.7%
Premier
c.25%
Premier
c.7%
Premier
c.3%
Premier
c.25%
Premier
c.8%
Premier
c.8%
x% of customers are Premier
Protect
and grow
Transition
Review
– Maintain and increase
existing scale
– Invest to drive
incremental growth
– Invest in increased
scale to improve
profitability
– Where there is a large
enough affluent
population, focus on
Premier / Advance
– Grow Retail Business
Banking in selected
markets
– Review RBWM position
in overall Group context
(e.g. Group profitability,
funding, cost absorption)
Scale and returns for RBWM priority markets1 Strategic actions

20
RBWM is focused on growth, and will invest to offset rising costs while optimising our portfolio of businesses Conclusion
1. RoRWA excluding associates. As shown at the investors update, June 2015. Financial data presented on an “adjusted” basis with 2017 translated at 1Q 2015 average rates 2. Adjustments includes impact of the sale of operations in Brazil and Turkey, FX adjustments and other actions 3. Risk adjusted revenue growth net of RWA growth, including any impact of interest rate changes
4.8
6.3
2014 Adjust-
ments2
Growth3 Cost
growth -
Inflation and
investments
Cost
savings
2017
Growth
priorities
– Our growth priorities have not changed. We will continue to
focus our investment on relationship-led lending, wealth
management and digital
– We will shift the focus of our Asset Management and
Insurance businesses to capture opportunities in Asia
– Through these priorities, we will grow our PBT faster than our
RWAs, increasing our RoRWA
Portfolio
optimisation
Digital
transformation
Interest rate
sensitivity
– Our strong deposit franchise supports a stable and diversified
core funding base for the Group, and positions us to benefit
when interest rates rise
– We will continue to review our portfolio of markets from both
RBWM and Group perspectives
– We will address poorly performing businesses, and focus our
investment on priority growth markets
– Digital transformation will enable process simplification and
accelerate channel migration, improving productivity and
customer experience
– Through our investment in the digital transformation, we will
hold our 2017 exit cost rate at 2014 levels
2014 – 2017 Principal RBWM RoRWA walk1 Achieving the 2017 RoRWA
Appendix – 2015 Performance

22
2015 Profit before tax performance Revenue growth more than offset by higher LICs and increased costs from the bank levy and regulatory programmes and compliance
USD57,766m
2015 vs. 2014
USD(3,722)m
USD(36,184)m
USD2,556m
USD20,416m
(1,609)
(554)
540
(1,559) (7)%
1%
(17)%
(5)%
3%
adverse favourable
Profit before tax
Revenue
LICs
Operating
expenses
Share of profits in
associates and joint
ventures 63
(1,559)
540
(554)
(1,609)
Adjusted PBT by global
business (USDm) 2014 2015 vs. 2014
RBWM 7,556 6,829 (727)
CMB 8,622 8,193 (429)
GB&M 7,679 8,746 1,067
GPB 703 518 (185)
Other (2,584) (3,869) (1,285)
Group 21,976 20,416 (1,559)
Adjusted PBT by geography
(USDm) 2014 2015 vs. 2014
Europe 3,498 2,393 (1,105)
Asia 14,295 14,462 167
Middle East and North Africa 1,819 1,541 (278)
North America 1,998 1,563 (435)
Latin America 366 459 93
Group 21,976 20,416 (1,559)
Full year PBT analysis
Adjusted PBT by account line

23
RBWM 2015 Financial Performance Principal RBWM adjusted PBT lower driven by higher costs and LICs, partly offset by an increase in revenue
Refer to pages 24 and 30 of the 2015 Annual Report and the 2015 Presentation to Investors and Analysts for further details on RBWM Financial Performance 1. Reported Total RBWM PBT: 2014 USD5,581m, 2015 USD4,967m. Reported US run-off PBT: 2014 USD569m, 2015 USD(620)m 2. Reported Principal RBWM PBT: 2014 USD5012m, 2015 USD5,587m; Revenue: 2014 USD23,813m, 2015 USD22,690m; Operating Expenses: 2014 USD17,292m, 2015 USD15,636m;
Loan Impairment Charge (LICs): 2014 USD1907m, 2015 USD1878m. 3. Adjusted RoRWA for Principal RBWM excludes associates. Reported RoRWA for Principal RBWM (including associates): 2014 3.2%, 2015 3.7% 4. Excludes Brazil
1.6%
LICs / average gross loans
& advances to customers4 3.7%
0.30 0.35
20.1%
x x
2014 2015 vs.
Total RBWM 7,556 6,829 (9.6)%
Of which:
US run-off portfolio 737 480 (35)%
Principal RBWM 6,819 6,349 (6.9)%
Adjusted RoRWA3 2014 2015 vs.
Principal RBWM 5% 4.5% (0.5)%
2015
6,349
2014
6,819
Latin America
North America
MENA
Asia
Europe 2015
22,687
841
6,282
9,962
2014
22,333
759
5,825
10,218
Other
Wealth Management
products
Current account, savings
and deposits
Personal lending
2015
14,871
2014
14,342
2015
1,878
2014
1,564
Reported 5,012 5,587
5,530 5,602
Adjusted PBT1,2 (USDm) Adjusted revenue2 (USDm)
Adjusted operating expenses2
(USDm)
Adjusted LICs2 (USDm)

24
Principal RBWM – Balance sheet Growth in both customer lending and customer account balances since 4Q14
All figures are sourced from the data Pack for further details on RBWM Balance Sheet 1. Comparatives have been retranslated at 31 December 2015 rates. The reported quarterly balances for Loans and advances to customers are as follows: 1Q14 USD348.8bn; 2Q14 USD356.4bn; 3Q14 USD344.3bn; 4Q14
USD338.0bn; 1Q15 USD327.6bn; 2Q15 USD331.0bn; 3Q15 USD323.6bn; 4Q15USD321.7bn. The reported quarterly balances for Customer accounts are as follows: 1Q14 USD586.9bn; 2Q14 USD600.6bn; 3Q14 USD590.3bn; 4Q14 USD583.8bn; 1Q15 USD574bn; 2Q15 USD589.7bn; 3Q15 USD580.6bn;4Q15 USD584.9bn
2. During 2Q15, customer lending and customer account balances relating to our Brazil operations were reclassified to ‘Assets held for sale’ or ‘Liabilities of disposal groups held for sale’ respectively
309.7
2Q15
316.9
316.4
1Q15
4.9
321.8
4Q14
4.9
317.1
3Q14
4.7
313.6
2Q14
307.7
4.7
312.4
1Q14
304.9
4.8
316.4
Brazil2 – balances were reclassified as ‘Held for Sale’ in 2Q15
7.5
538.2
543.6
7.6
551.2
2Q14
537.8
7.5
545.4
1Q14
530.7 557.3
1Q15
570.7 556.5
3Q14
8
565.3
4Q14
548.5
8
2Q15
570.7
Balances excluding Brazil
USD9.5bn
increase USD36.4bn
increase
3Q15
319.3
308.9 319.3 312.2
3Q15
575.2
575.2
4Q15
584.9
584.9
321.7
4Q15
321.7
Loans and advances to customers
(USDbn, Constant currency basis1)
Customer accounts
(USDbn, Constant currency basis1)

25
39
(213)
176
(158)
Insurance manufacturing subject to market volatility
1. Insurance manufacturing PAT sensitivity covers all Global Businesses 2. Where a –100 basis point parallel shift in the yield curve would result in a negative interest rate, the effects on profit after tax have been calculated using a minimum rate of 0%
-100 bps
decrease2 in
yield curves
+100 bps
increase in
yield curves
290
(549)
-10%
decrease in
equity prices
+10%
increase in
equity prices
180
(153)
Insurance manufacturing PAT sensitivity1 (USDm)
2015 2015
2014 2014

26
Total RBWM – Income Statement – Reported
All figures are sourced from the ARA 1. Other income in this context comprises where applicable net trading income, net income/(expense) from other financial instruments designated at fair value, gains less losses from financial investments, dividend income, net
insurance premium income and other operating income less net insurance claims and benefits paid and movement in liabilities to policyholders 2. Net operating income before loan impairment charges and other credit risk provisions, also referred to as revenue 3. Loan impairment charges and other credit risk provisions 4. Share of profit in associates and joint ventures 5. Risk-weighted assets (‘RWA’s) and pre-tax return on average risk-weighted assets (‘RoRWA’) 6. In 2015 insurance manufacturing net operating income for RBWM included USD1,686m within Wealth Management (2014: USD1,529m) and USD191m within other products (2014: USD350m)
Principal RBWM consists of:
Total RBWM6
(USDm)
US run-off
portfolio
(USDm)
Principal
RBWM
(USDm)
Banking
operations
(USDm)
Insurance
Manufacturing
(USDm)
Asset
Management
(USDm)
2015
2014
2015
Net interest income 15,926 1,033 14,893 13,127 1,757 9
Net fee income 6,218 (4) 6,222 5,726 (560) 1,056
Other income / (expense)1 1,372 (203) 1,575 876 680 19
Net operating income2 23,516 826 22,690 19,729 1,8776 1,084
LICs3 (1,939) (62) (1,877) (1,877) – (0)
Net operating income 21,577 764 20,813 17,852 1,877 1,084
Total operating expenses (17,020) (1,384) (15,636) (14,459) (432) (745)
Operating profit 4,557 (620) 5,177 3,393 1,445 339
Income from associates4 410 – 410 357 24 29
Profit before tax 4,967 (620) 5,587 3,750 1,469 368
RoRWA5 2.5% (1.3%) 3.7%
2014
Net interest income 17,130 1,390 15,740 13,983 1,746 11
Net fee income 6,836 (4) 6,840 6,264 (534) 1,110
Other income / (expense)1 1,183 (49) 1,232 602 608 22
Net operating income2 25,149 1,337 23,812 20,849 1,820 1,143
LICs3 (1,936) (30) (1,906) (1,906) – (0)
Net operating income 23,213 1,307 21,906 18,943 1,820 1,143
Total operating expenses (18,030) (738) (17,292) (16,060) (453) (779)
Operating profit 5,183 569 4,614 2,883 1,367 364
Income from associates4 398 – 398 323 40 35
Profit before tax 5,581 569 5,012 3,205 1,407 400
RoRWA5 2.5% 0.8% 3.2%