results presentation january-september - altia q3 20… · q3 results presentation ceo pekka...
TRANSCRIPT

Q3 results presentationCEO PEKKA TENNILÄ
CFO NIKLAS NYLANDER
7 NOVEMBER 2019

Agenda
7.11.2019 2
1. HIGHLIGHTS
2. MARKET
3. SEGMENTS
4. FINANCIALS
5. STRATEGY
6. Q&A
Leading Nordic alcoholic beverage brandcompany operating in thewines and spirits markets
in the Nordic countries, Estonia and Latvia. Wealso have production in
Cognac, France.

Leading Nordic alcoholic beverage brand house
7.11.2019 3
WE OPERATE ON THE STABLE AND PROFITABLE NORDIC MARKETS
Exports to
approx. 30
countries
Production
Distillery
Sales office
Head office
Warehouse

Solid net sales growth of spirits in core markets, profitability improved in Q3
7.11.2019 4
HIGHLIGHTS FROM Q1-Q3 19
25.1 (24.1)249.5 (246.4) 10.1% (9.8%)EUR million
Comparable EBITDAReported net sales Comparable EBITDA margin
EUR million
Net salesgrew by 2.1% in constant currencies 22.2
Comparable EBITDA
without IFRS 16 impact
EUR million
8.9%
Comparable EBITDA margin
without IFRS 16 impact

Market development
• Finland
– In spirits, growth mainly from gin, whisky and liqueurs
– In wine, red wines gre slights, white and sparkling wines
declined
• Sweden
– In spirits, growth mainly from gin, rum, whisky and liqueurs
– In wine, sparkling and red wines grew
• Norway
– In spirits, growth in most of the categories e.g. gin,
liqueurs, whisky and aquavit
– In wine, both sparkling and white wines grew, red wines
stable
7.11.2019 5
APPROXIMATELY TWO THIRDS OF CONSUMER PRODUCT SALES COME FROM STATE RETAIL MONOPOLIES
Combined spirits and wine sales volume development in the state retail monopolies
Change compared to
previous year, %Q3 19 Q3 18
Q1-Q3
19
Q1-Q3
182018
Finland, total sales -2.0 -5.3 -3.0 -3.4 -3.3
Spirits +0.6 -6.7 -1.4 -4.1 -3.6
Wine -2.9 -4.8 -3.6 -3.1 -3.2
Sweden, total sales +2.5 +0.6 +0.4 +1.8 +2.1
Spirits +6.5 +0.3 +3.8 +2.2 +2.7
Wine +2.1 +0.7 +0.1 +1.7 +2.0
Norway, total sales +2.0 +0.2 -0.4 +1.6 +1.5
Spirits +2.5 -1.1 +1.1 +0.3 +0.1
Wine +1.9 +0.5 -0.6 +1.8 +1.7
Source: Based on sales volumes by litre published by the state retail
monopolies (Alko, Systembolaget, and Vinmonopolet).
Q3 19 Q1 –Q3 19
Spirits +3.3 +1.1
Wine +1.2 -0.7
Total +1.5 -0.4
• Nordic spirits and wine market in total (%)
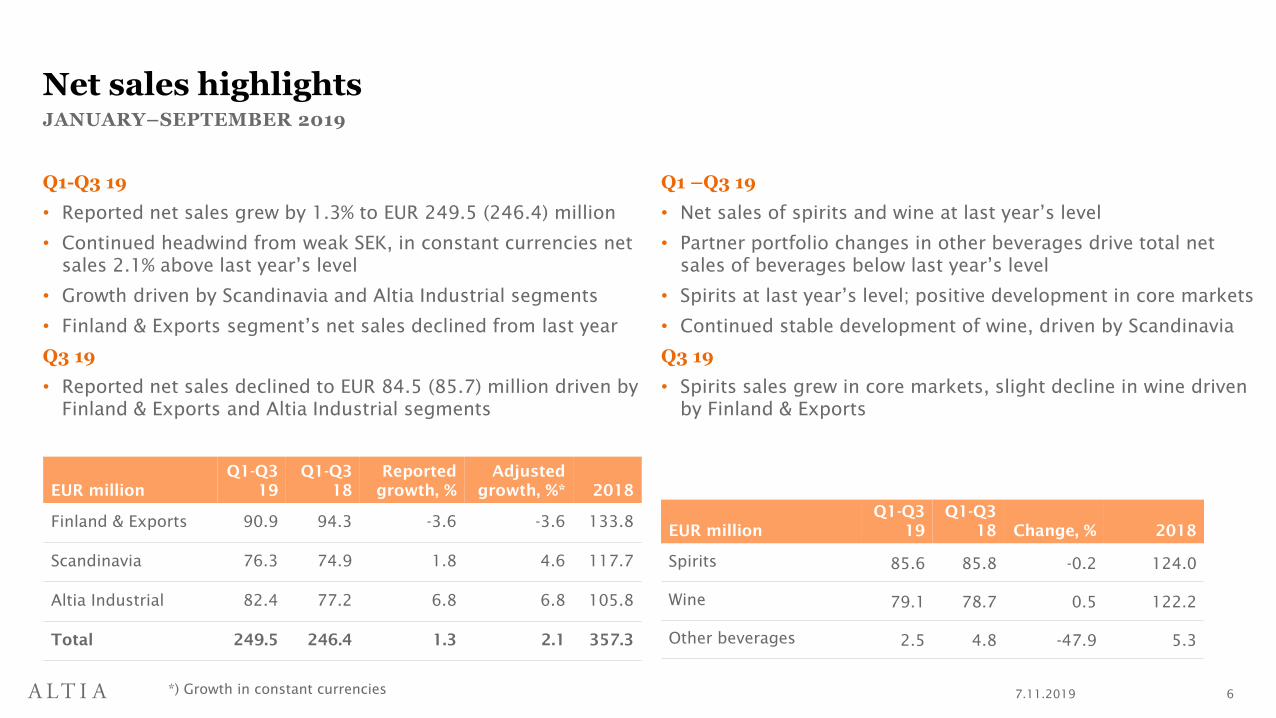
Net sales highlights
Q1-Q3 19
• Reported net sales grew by 1.3% to EUR 249.5 (246.4) million
• Continued headwind from weak SEK, in constant currencies net
sales 2.1% above last year’s level
• Growth driven by Scandinavia and Altia Industrial segments
• Finland & Exports segment’s net sales declined from last year
Q3 19
• Reported net sales declined to EUR 84.5 (85.7) million driven by
Finland & Exports and Altia Industrial segments
Q1 –Q3 19
• Net sales of spirits and wine at last year’s level
• Partner portfolio changes in other beverages drive total net
sales of beverages below last year’s level
• Spirits at last year’s level; positive development in core markets
• Continued stable development of wine, driven by Scandinavia
Q3 19
• Spirits sales grew in core markets, slight decline in wine driven
by Finland & Exports
7.11.2019 6
JANUARY–SEPTEMBER 2019
EUR million
Q1-Q3
19
Q1-Q3
18
Reported
growth, %
Adjusted
growth, %* 2018
Finland & Exports 90.9 94.3 -3.6 -3.6 133.8
Scandinavia 76.3 74.9 1.8 4.6 117.7
Altia Industrial 82.4 77.2 6.8 6.8 105.8
Total 249.5 246.4 1.3 2.1 357.3
EUR million
Q1-Q3
19
Q1-Q3
18 Change, % 2018
Spirits 85.6 85.8 -0.2 124.0
Wine 79.1 78.7 0.5 122.2
Other beverages 2.5 4.8 -47.9 5.3
*) Growth in constant currencies
5
6
7
8
9
10
11
12
13
14
15
0
10
20
30
40
50
60
70
80
90
Q1-Q3 18 Q1-Q3 19
Net sales, MEUR Comparable EBITDA, MEUR
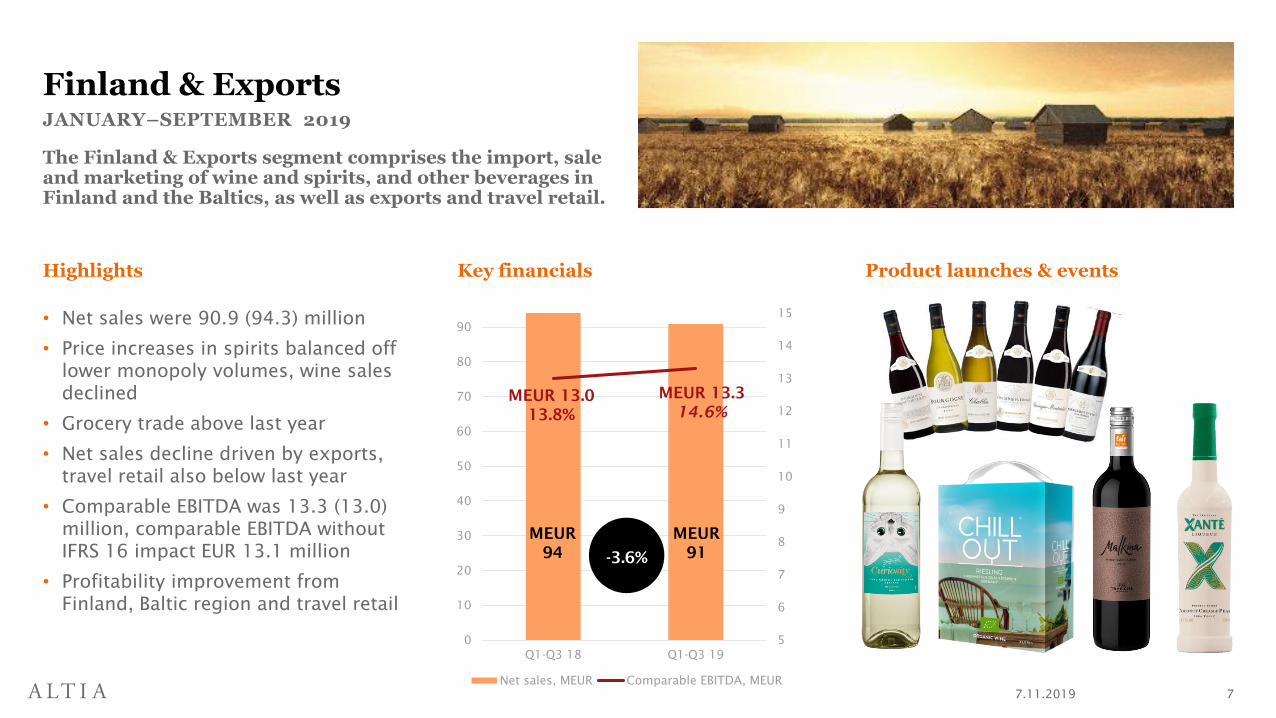
Highlights
• Net sales were 90.9 (94.3) million
• Price increases in spirits balanced off
lower monopoly volumes, wine sales
declined
• Grocery trade above last year
• Net sales decline driven by exports,
travel retail also below last year
• Comparable EBITDA was 13.3 (13.0)
million, comparable EBITDA without
IFRS 16 impact EUR 13.1 million
• Profitability improvement from
Finland, Baltic region and travel retail
Key financials
7.11.2019 7
Finland & ExportsJANUARY–SEPTEMBER 2019
Product launches & events
The Finland & Exports segment comprises the import, sale and marketing of wine and spirits, and other beverages in Finland and the Baltics, as well as exports and travel retail.
-3.6%
MEUR
94
MEUR
91
MEUR 13.0
13.8%
MEUR 13.3
14.6%
0
1
2
3
4
5
0
10
20
30
40
50
60
70
80
Q1-Q3 18 Q1-Q3 19
Net sales, MEUR Comparable EBITDA, MEUR
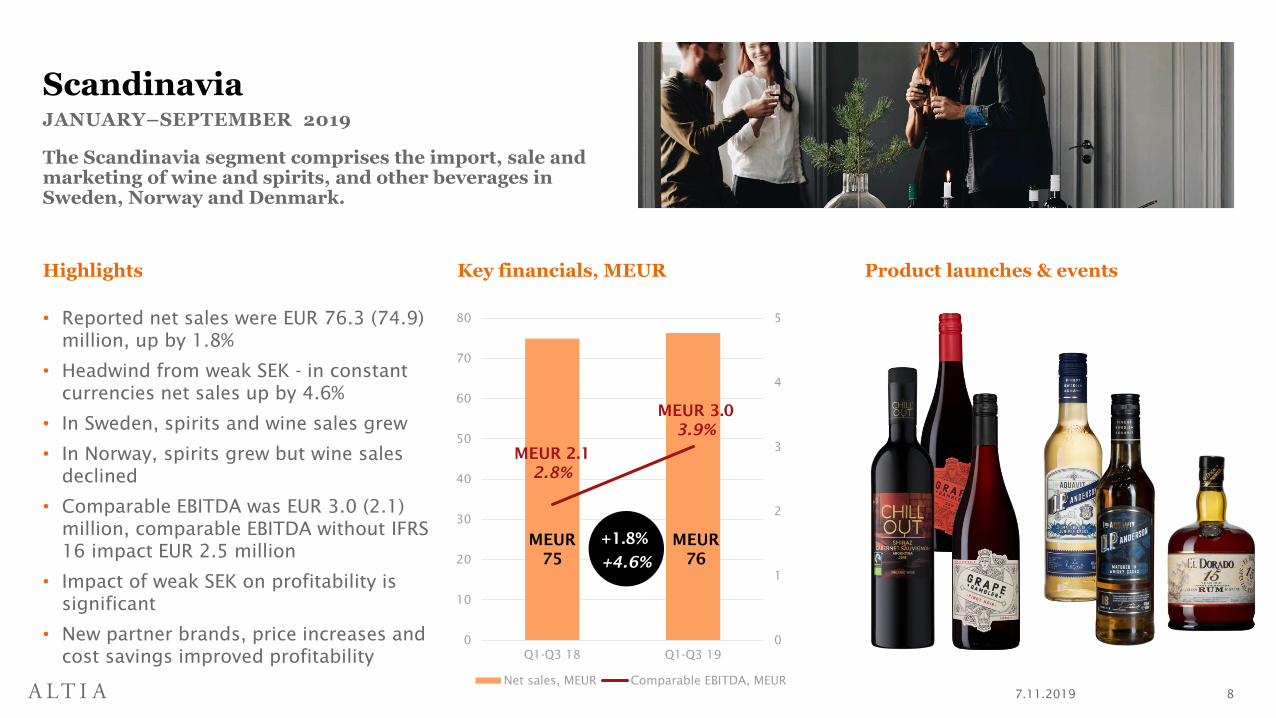
Highlights
• Reported net sales were EUR 76.3 (74.9)
million, up by 1.8%
• Headwind from weak SEK - in constant
currencies net sales up by 4.6%
• In Sweden, spirits and wine sales grew
• In Norway, spirits grew but wine sales
declined
• Comparable EBITDA was EUR 3.0 (2.1)
million, comparable EBITDA without IFRS
16 impact EUR 2.5 million
• Impact of weak SEK on profitability is
significant
• New partner brands, price increases and
cost savings improved profitability
Product launches & events
7.11.2019 8
ScandinaviaJANUARY–SEPTEMBER 2019
Key financials, MEUR
The Scandinavia segment comprises the import, sale and marketing of wine and spirits, and other beverages in Sweden, Norway and Denmark.
+1.8%MEUR
75
MEUR
76
MEUR 2.1
2.8%
MEUR 3.0
3.9%
+4.6%
0
1
2
3
4
5
6
7
8
9
10
0
10
20
30
40
50
60
70
80
Q1-Q3 18 Q1-Q3 19
Net sales, MEUR Comparable EBITDA, MEUR
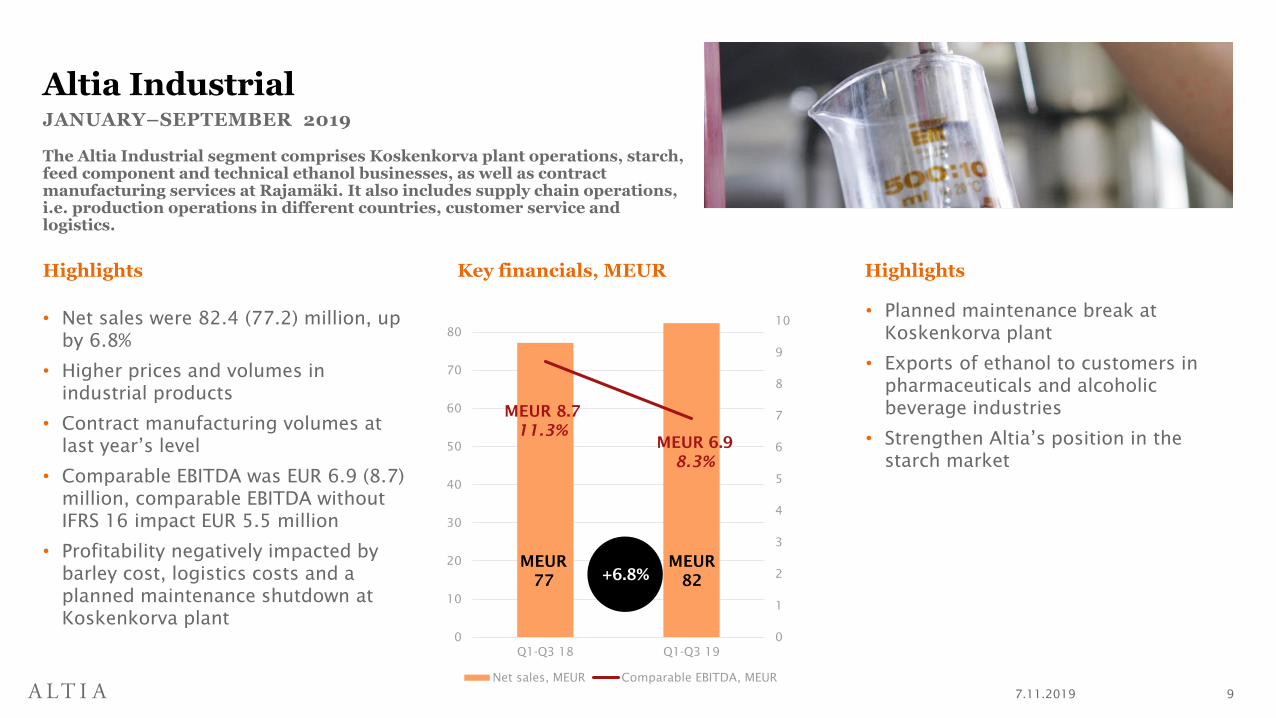
Highlights
• Net sales were 82.4 (77.2) million, up
by 6.8%
• Higher prices and volumes in
industrial products
• Contract manufacturing volumes at
last year’s level
• Comparable EBITDA was EUR 6.9 (8.7)
million, comparable EBITDA without
IFRS 16 impact EUR 5.5 million
• Profitability negatively impacted by
barley cost, logistics costs and a
planned maintenance shutdown at
Koskenkorva plant
Highlights
7.11.2019 9
Altia Industrial
Key financials, MEUR
The Altia Industrial segment comprises Koskenkorva plant operations, starch, feed component and technical ethanol businesses, as well as contractmanufacturing services at Rajamäki. It also includes supply chain operations, i.e. production operations in different countries, customer service and logistics.
+6.8%
JANUARY–SEPTEMBER 2019
• Planned maintenance break at
Koskenkorva plant
• Exports of ethanol to customers in
pharmaceuticals and alcoholic
beverage industries
• Strengthen Altia’s position in the
starch market
MEUR
77
MEUR
82
MEUR 8.7
11.3%
MEUR 6.9
8.3%
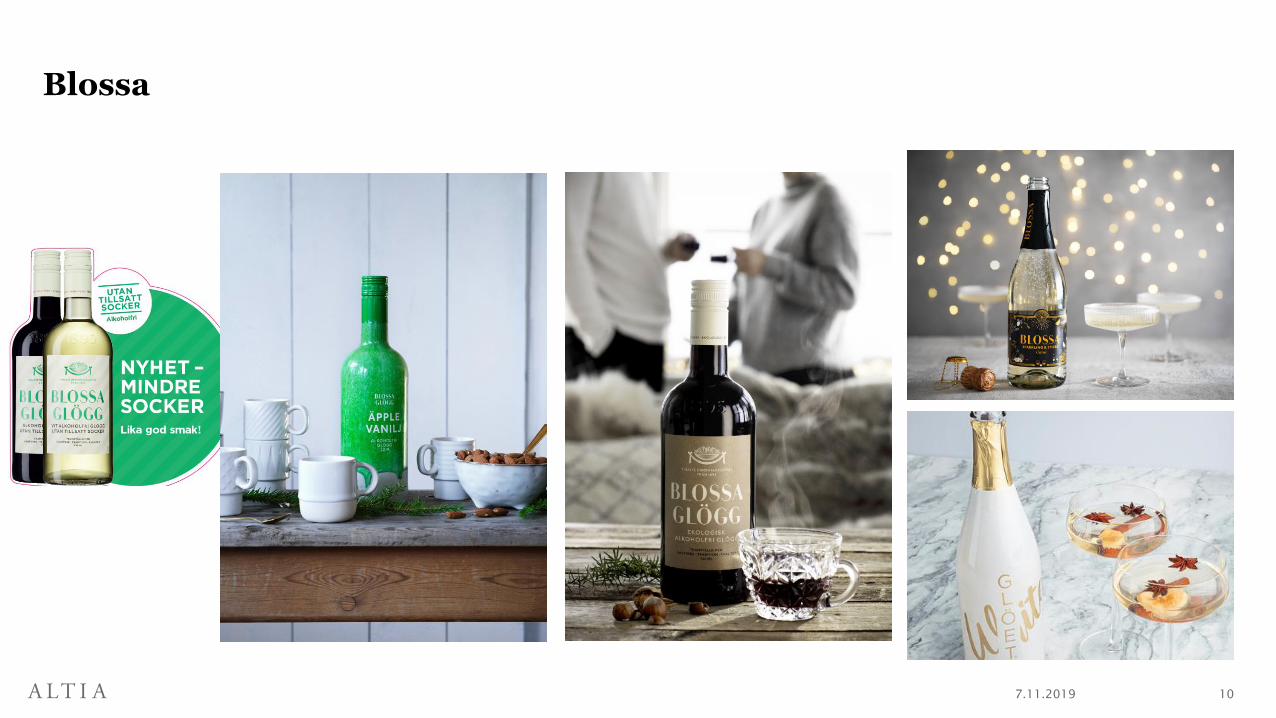
Blossa
7.11.2019 10

FinancialsCFO NIKLAS NYLANDER
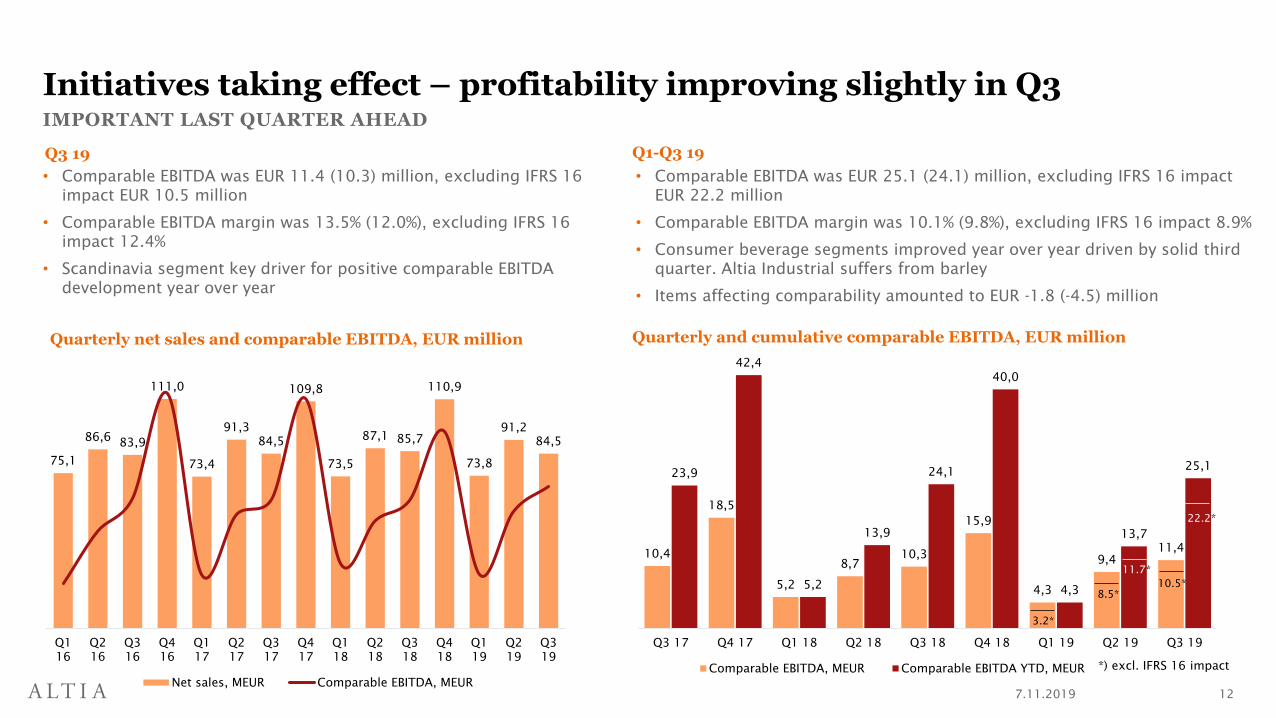
Initiatives taking effect – profitability improving slightly in Q3
7.11.2019 12
IMPORTANT LAST QUARTER AHEAD
Quarterly net sales and comparable EBITDA, EUR million Quarterly and cumulative comparable EBITDA, EUR million
• Comparable EBITDA was EUR 11.4 (10.3) million, excluding IFRS 16
impact EUR 10.5 million
• Comparable EBITDA margin was 13.5% (12.0%), excluding IFRS 16
impact 12.4%
• Scandinavia segment key driver for positive comparable EBITDA
development year over year
75,1
86,683,9
111,0
73,4
91,3
84,5
109,8
73,5
87,1 85,7
110,9
73,8
91,2
84,5
Q1
16
Q2
16
Q3
16
Q4
16
Q1
17
Q2
17
Q3
17
Q4
17
Q1
18
Q2
18
Q3
18
Q4
18
Q1
19
Q2
19
Q3
19
Net sales, MEUR Comparable EBITDA, MEUR
10,4
18,5
5,2
8,7
10,3
15,9
4,3
9,4
11,4
23,9
42,4
5,2
13,9
24,1
40,0
4,3
13,7
25,1
Q3 17 Q4 17 Q1 18 Q2 18 Q3 18 Q4 18 Q1 19 Q2 19 Q3 19
Comparable EBITDA, MEUR Comparable EBITDA YTD, MEUR *) excl. IFRS 16 impact
• Comparable EBITDA was EUR 25.1 (24.1) million, excluding IFRS 16 impact
EUR 22.2 million
• Comparable EBITDA margin was 10.1% (9.8%), excluding IFRS 16 impact 8.9%
• Consumer beverage segments improved year over year driven by solid third
quarter. Altia Industrial suffers from barley
• Items affecting comparability amounted to EUR -1.8 (-4.5) million
Q3 19 Q1-Q3 19
3.2*
8.5*
10.5*
11.7*
22.2*

Comparable EBITDA by segment
7.11.2019 13
IMPROVED PROFITABILITY IN CONSUMER SEGMENTS; NEGATIVE IMPACT FROM FX AND BARLEY
EUR million Q3 19Q3 19
excl. IFRS 16Q3 18 Q1-Q3 19
Q1-Q3 19
excl. IFRS 16Q1-Q3 18 2018
Finland & Exports 5.0 5.0 4.9 13.3 13.1 13.0 19.2
% of net sales 16.1 16.0 15.6 14.6 14.4 13.8 14.3
Scandinavia 1.3 1.2 0.8 3.0 2.5 2.1 10.1
% of net sales 5.1 4.5 3.0 3.9 3.3 2.8 8.6
Altia Industrial 3.6 3.1 4.8 6.9 5.5 8.7 10.9
% of net sales 12.8 11.2 16.7 8.3 6.7 11.3 10.3
Other 1.5 1.2 -0.3 2.0 1.1 0.3 -0.3
Total 11.4 10.5 10.3 25.1 22.2 24.1 40.0
% net sales 13.5 12.4 12.0 10.1 8.9 9.8 11.2
0
5 000
10 000
15 000
20 000
25 000
30 000
0
50
100
150
200
250
January
Ap
ril
July
October
January
Ap
ril
July
October
January
Ap
ril
July
October
January
Ap
ril
July
October
January
Ap
ril
July
October
January
Ap
ril
July
October
January
Ap
ril
July
October
January
Ap
ril
July
October
January
Ap
ril
July
October
January
Ap
ril
July
October
January
Ap
ril
July
October
January
Ap
ril
July
October
January
Ap
ril
July
Altia's grain purchases to Koskenkorva tn Average feed barley market price without premiums (Luke)
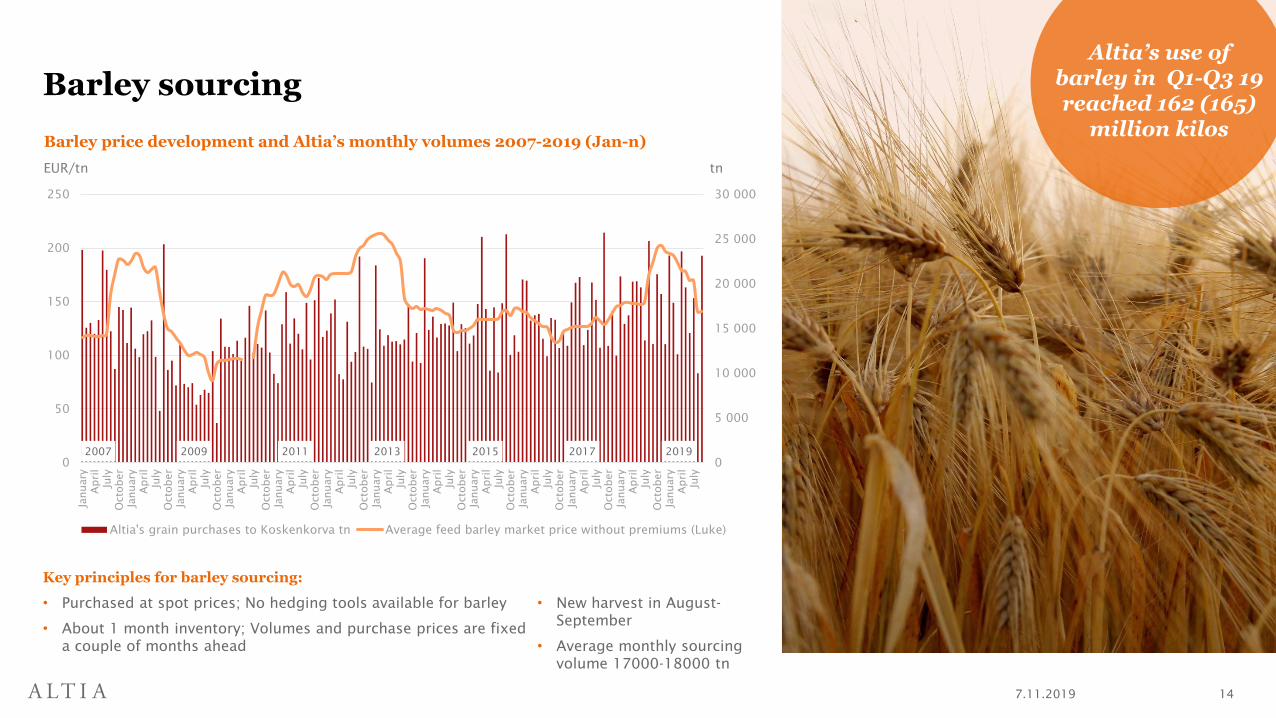
Barley sourcing
7.11.2019 14
Key principles for barley sourcing:
• Purchased at spot prices; No hedging tools available for barley
• About 1 month inventory; Volumes and purchase prices are fixed
a couple of months ahead
Barley price development and Altia’s monthly volumes 2007-2019 (Jan-n)
tnEUR/tn
Altia’s use of barley in Q1-Q3 19 reached 162 (165)
million kilos
• New harvest in August-
September
• Average monthly sourcing
volume 17000-18000 tn
2007 2009 2011 2013 2015 2017 2019

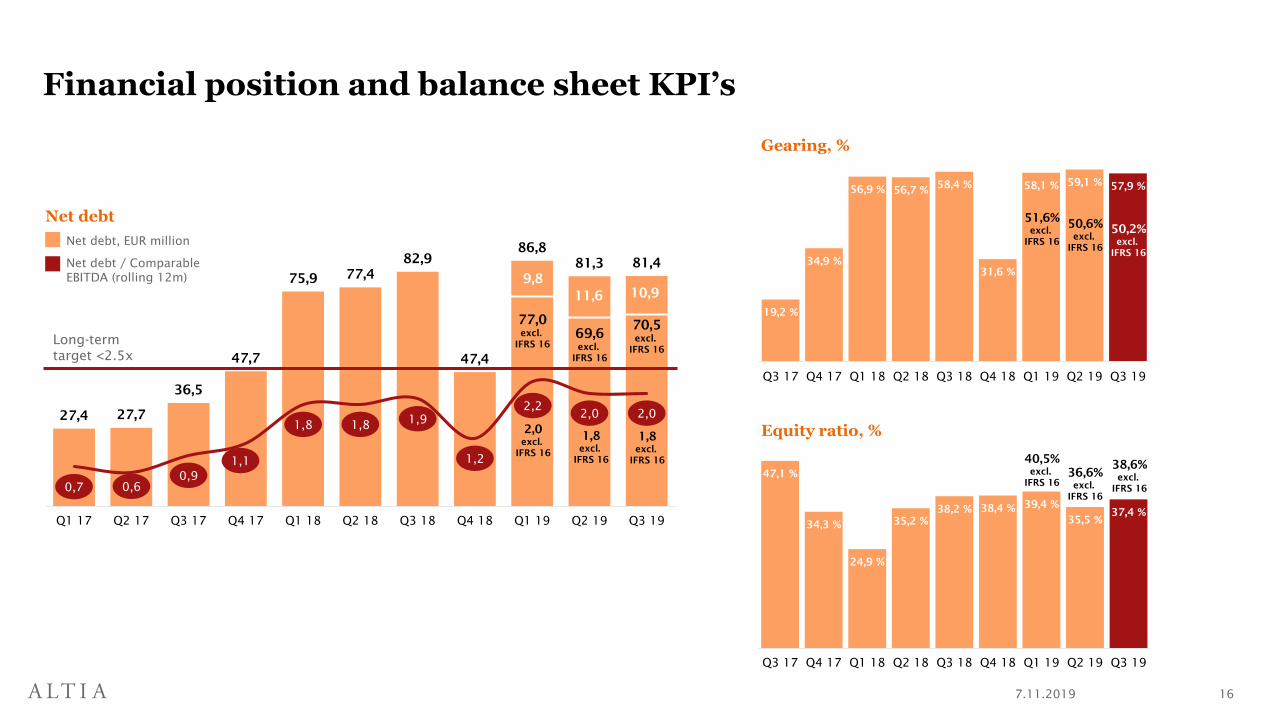
Financial position and balance sheet KPI’s
7.11.2019 15
AS AT 30 SEPTEMBER
Net cash flow from operating activities EUR -0.8 (-31.1) million
Receivables sold EUR 44.8 (48.3) million
Net debt EUR 81.4 /70.5 excl. IFRS 16 (82.9) million
Gearing 57.9% / 50.2% excl. IFRS 16 (58.4%)
Equity ratio 37.4% / 38.6% excl. IFRS 16 (38.2%)
Reported net debt to comparable EBITDA ratio, rolling 12m 2.0 / 1.8 excl. IFRS 16 (1.9)
In use from revolving credit facility EUR 0.0 (0.0) million million
Nominal value of commercial papers issued EUR 12.0 (13.0) million
19,2 %
34,9 %
56,9 % 56,7 %58,4 %
31,6 %
58,1 %59,1 %
57,9 %
Q3 17 Q4 17 Q1 18 Q2 18 Q3 18 Q4 18 Q1 19 Q2 19 Q3 19
Financial position and balance sheet KPI’s
7.11.2019 16
27,4 27,7
36,5
47,7
75,977,4
82,9
47,4
86,8
81,3 81,4
0,7 0,6
0,9
1,1
1,8 1,81,9
1,2
2,22,0 2,0
Q1 17 Q2 17 Q3 17 Q4 17 Q1 18 Q2 18 Q3 18 Q4 18 Q1 19 Q2 19 Q3 19
Long-term
target <2.5x
Equity ratio, %
Gearing, %
Net debt, EUR million
Net debt
Net debt / Comparable
EBITDA (rolling 12m)
77,0
excl.
IFRS 16
69,6
excl.
IFRS 16
9,8
11,6
2,0
excl.
IFRS 16
1,8
excl.
IFRS 16
47,1 %
34,3 %
24,9 %
35,2 %
38,2 % 38,4 %39,4 %
35,5 %
37,4 %
Q3 17 Q4 17 Q1 18 Q2 18 Q3 18 Q4 18 Q1 19 Q2 19 Q3 19
51,6%
excl.
IFRS 16
50,6%
excl.
IFRS 16
40,5%
excl.
IFRS 16
36,6%
excl.
IFRS 16
70,5
excl.
IFRS 16
10,9
1,8
excl.
IFRS 1638,6%
excl.
IFRS 16
50,2%
excl.
IFRS 16

StrategyCEO PEKKA TENNILÄ
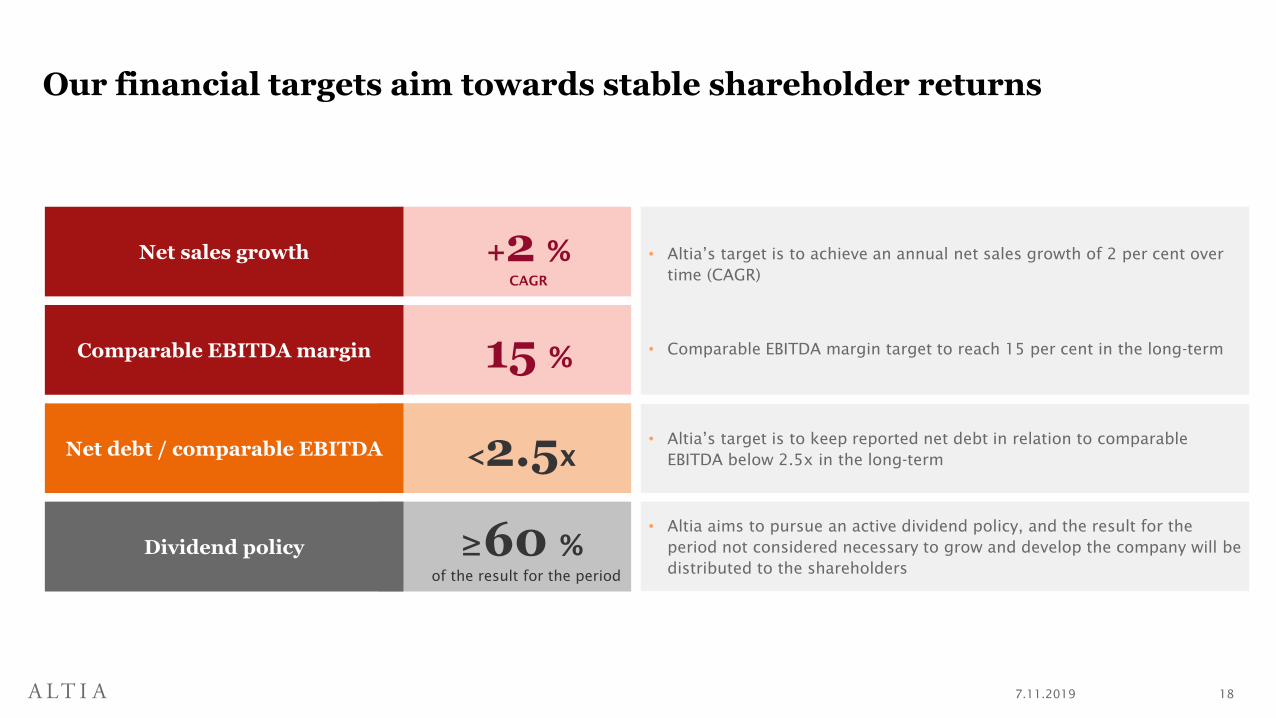
Our financial targets aim towards stable shareholder returns
7.11.2019 18
+2 %CAGR
15 %
<2.5x
≥60 %of the result for the period
Net sales growth
Comparable EBITDA margin
Net debt / comparable EBITDA
Dividend policy
• Altia’s target is to achieve an annual net sales growth of 2 per cent over
time (CAGR)
• Comparable EBITDA margin target to reach 15 per cent in the long-term
• Altia’s target is to keep reported net debt in relation to comparable
EBITDA below 2.5x in the long-term
• Altia aims to pursue an active dividend policy, and the result for the
period not considered necessary to grow and develop the company will be
distributed to the shareholders

The core of our strategy is to deliver profitable growth
7.11.2019 19
• Grow wine segment with innovations and
higher level of co-operation with partners
• Focus on Sweden and Finland – monopoly
channel
• Expand and develop new business and co-
operation models
• Growth through innovations and co-
operation models
• Retail
• E-commerce and other digital platforms
Growth and profitabilitythrough the fivestrategic streams
1 Grow Nordic Core Brands
Execute a step change in wines2
Strengthen strategic partnerships
Channel expansion and development4
3
Fund and enable growth – continuous improvement of overall efficiency
• Efficiencies and new capabilities in the supply chain
• Organisational ways of working through simplification and digitalisation
• Product portfolio optimisation
• Continuous development of co-operation and industrial products offering
5
Commercial battles
• Expand into new geographical markets
• Innovate into new occasions and
consumer segmentsActive brand
portfolio
management
Altia continues to focus
on active brand
portfolio management,
potential selective
acquisitions and/or
divestments
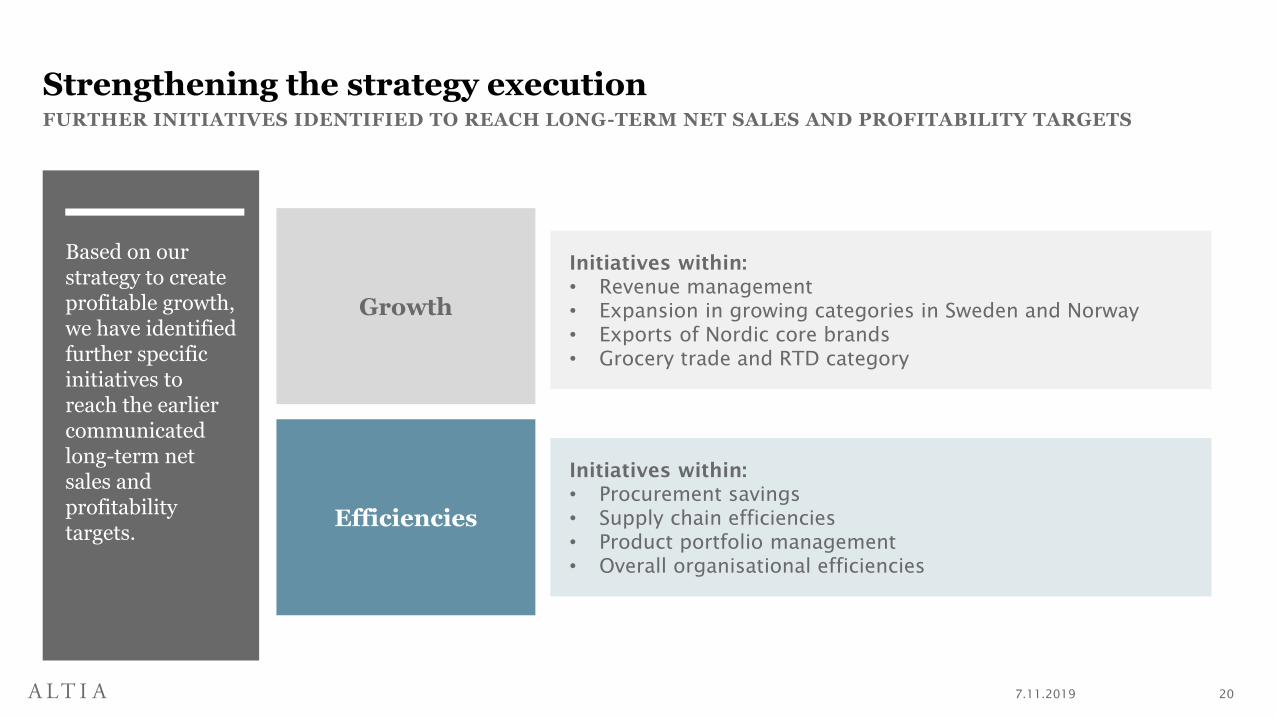
Strengthening the strategy execution
Based on our strategy to create profitable growth, we have identified further specific initiatives to reach the earlier communicated long-term net sales and profitability targets.
7.11.2019 20
FURTHER INITIATIVES IDENTIFIED TO REACH LONG-TERM NET SALES AND PROFITABILITY TARGETS
Growth
Efficiencies
Initiatives within:
• Revenue management
• Expansion in growing categories in Sweden and Norway
• Exports of Nordic core brands
• Grocery trade and RTD category
Initiatives within:
• Procurement savings
• Supply chain efficiencies
• Product portfolio management
• Overall organisational efficiencies

Guidance 2019
• The comparable EBITDA is expected to improve from
the 2018 level.
– The positive trend of Altia’s Nordic core brand
portfolio is expected to continue.
– Market development in Finland is expected to flatten
out in comparison to 2018 and the markets in Sweden
and Norway are expected to grow.
– The negative impact of the increased barley cost will
be reflected in high raw material costs, especially in
the first quarters of the year.
– The guidance assumes a normal harvest in 2019.
• In addition, the impact from the implementation of the
new IFRS 16 standard is expected to improve
comparable EBITDA by EUR 3-4 million.
7.11.2019 21
REMAINS UNCHANGED

7.11.2019 22
Solid development
of spirits net sales
Guidance remains
unchanged
Profitability
improved in third
quarter
Next events
13 Feb – Financial Statements Bulletin
25 Mar – Annual General Meeting
Q&A AND SUMMARY

Thank youwww.altiagroup.com

7.11.2019 24
Appendices

Key ratios
7.11.2019 25
EUR million Q3 19 Q3 18 Q1-Q3 19 Q1-Q3 18 2018
Net sales, EUR million 84.5 85.7 249.5 246.4 357.3
Comparable EBITDA, EUR million 11.4 10.3 25.1 24.1 40.0
% of net sales 13.5 12.0 10.1 9.8 11.2
EBITDA, EUR million 9.8 10.3 23.3 19.6 34.0
Comparable operating result, EUR million 6.9 6.6 11.6 13.4 25.6
% of net sales 8.2 7.7 4.7 5.4 7.2
Operating result, EUR million 5.3 6.6 9.8 8.9 19.7
Result for the period, EUR million 4.0 4.8 8.0 6.5 15.1
Earnings per share, EUR 0.11 0.13 0.22 0.18 0.42
Net debt / comparable EBITDA, rolling 12 months 2.0 1.9 2.0 1.9 1.2
Average number of personnel 677 725 693 724 718
Comparable EBITDA without IFRS 16 impact, EUR million 10.5 - 22.2 - -
Net debt/comparable EBITDA, rolling 12 months without IFRS 16 impact - - 1.8 - -
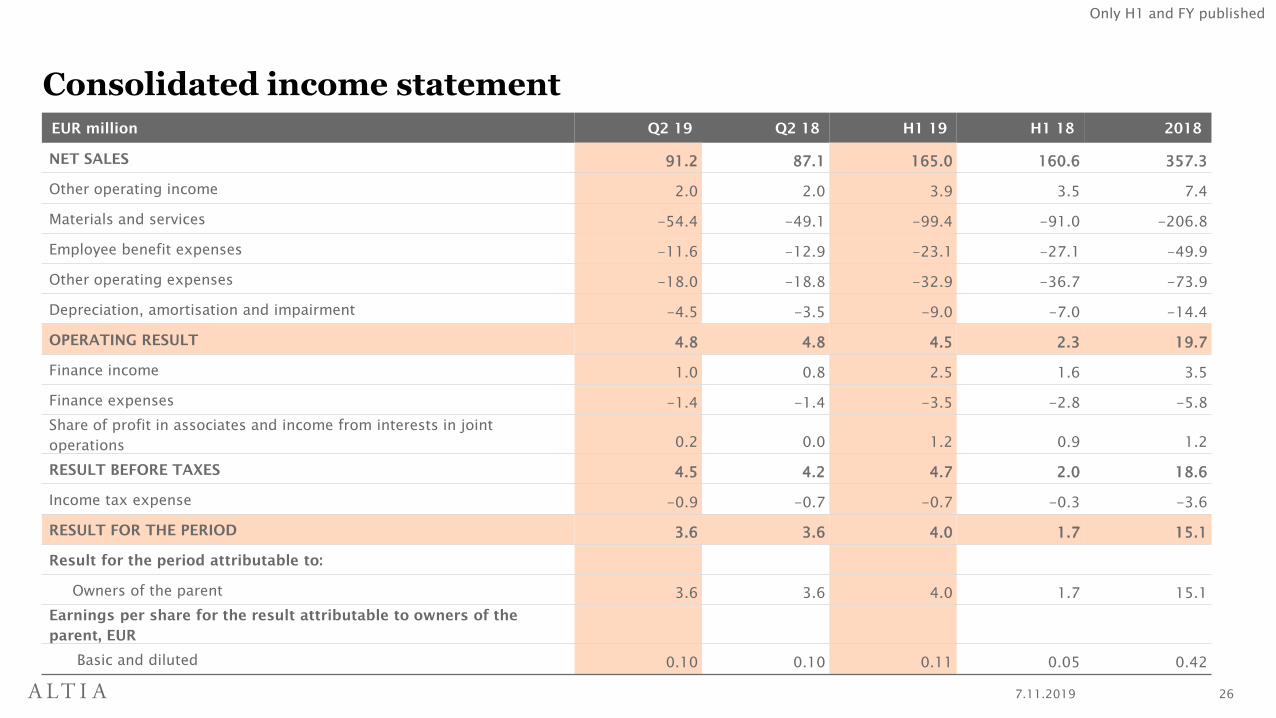
Consolidated income statement
7.11.2019 26
EUR million Q2 19 Q2 18 H1 19 H1 18 2018
NET SALES 91.2 87.1 165.0 160.6 357.3
Other operating income 2.0 2.0 3.9 3.5 7.4
Materials and services -54.4 -49.1 -99.4 -91.0 -206.8
Employee benefit expenses -11.6 -12.9 -23.1 -27.1 -49.9
Other operating expenses -18.0 -18.8 -32.9 -36.7 -73.9
Depreciation, amortisation and impairment -4.5 -3.5 -9.0 -7.0 -14.4
OPERATING RESULT 4.8 4.8 4.5 2.3 19.7
Finance income 1.0 0.8 2.5 1.6 3.5
Finance expenses -1.4 -1.4 -3.5 -2.8 -5.8
Share of profit in associates and income from interests in joint
operations 0.2 0.0 1.2 0.9 1.2
RESULT BEFORE TAXES 4.5 4.2 4.7 2.0 18.6
Income tax expense -0.9 -0.7 -0.7 -0.3 -3.6
RESULT FOR THE PERIOD 3.6 3.6 4.0 1.7 15.1
Result for the period attributable to:
Owners of the parent 3.6 3.6 4.0 1.7 15.1
Earnings per share for the result attributable to owners of the
parent, EUR
Basic and diluted 0.10 0.10 0.11 0.05 0.42
Only H1 and FY published
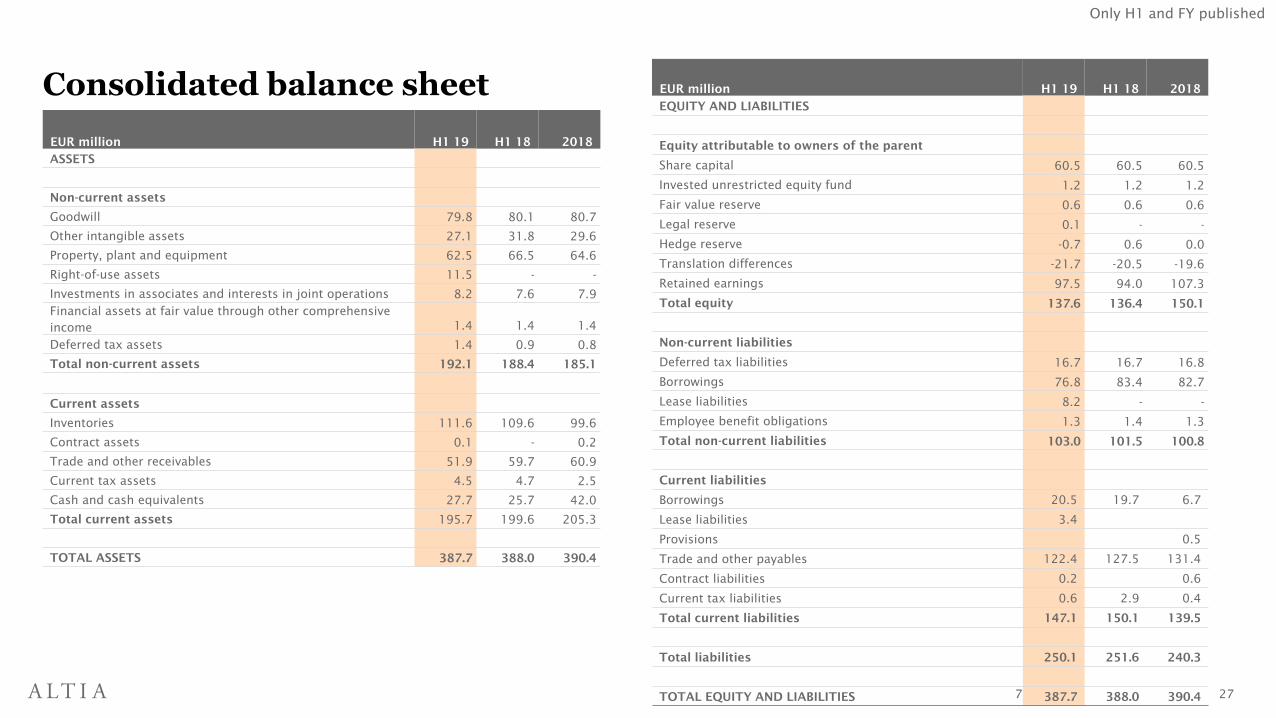
Consolidated balance sheet
7.11.2019 27
EUR million H1 19 H1 18 2018
ASSETS
Non-current assets
Goodwill 79.8 80.1 80.7
Other intangible assets 27.1 31.8 29.6
Property, plant and equipment 62.5 66.5 64.6
Right-of-use assets 11.5 - -
Investments in associates and interests in joint operations 8.2 7.6 7.9
Financial assets at fair value through other comprehensive
income 1.4 1.4 1.4
Deferred tax assets 1.4 0.9 0.8
Total non-current assets 192.1 188.4 185.1
Current assets
Inventories 111.6 109.6 99.6
Contract assets 0.1 - 0.2
Trade and other receivables 51.9 59.7 60.9
Current tax assets 4.5 4.7 2.5
Cash and cash equivalents 27.7 25.7 42.0
Total current assets 195.7 199.6 205.3
TOTAL ASSETS 387.7 388.0 390.4
EUR million H1 19 H1 18 2018
EQUITY AND LIABILITIES
Equity attributable to owners of the parent
Share capital 60.5 60.5 60.5
Invested unrestricted equity fund 1.2 1.2 1.2
Fair value reserve 0.6 0.6 0.6
Legal reserve 0.1 - -
Hedge reserve -0.7 0.6 0.0
Translation differences -21.7 -20.5 -19.6
Retained earnings 97.5 94.0 107.3
Total equity 137.6 136.4 150.1
Non-current liabilities
Deferred tax liabilities 16.7 16.7 16.8
Borrowings 76.8 83.4 82.7
Lease liabilities 8.2 - -
Employee benefit obligations 1.3 1.4 1.3
Total non-current liabilities 103.0 101.5 100.8
Current liabilities
Borrowings 20.5 19.7 6.7
Lease liabilities 3.4
Provisions 0.5
Trade and other payables 122.4 127.5 131.4
Contract liabilities 0.2 0.6
Current tax liabilities 0.6 2.9 0.4
Total current liabilities 147.1 150.1 139.5
Total liabilities 250.1 251.6 240.3
TOTAL EQUITY AND LIABILITIES 387.7 388.0 390.4
Only H1 and FY published

Cash flow from operations
7.11.2019 28
EUR million Q2 19 Q2 18 H1 19 H1 18 2018
CASH FLOW FROM OPERATING ACTIVITIES
Result before taxes 4.5 4.2 4.7 2.0 18.6
Adjustments
Depreciation, amortisation and impairment 4.5 3.5 9.0 7.0 14.4
Share of profit in associates and income from investments in joint
operations -0.2 -0.0 -1.2 -0.9 -1.2
Net gain on sale of non-current assets -0.0 -0.4 -0.0 -0.5 -0.5
Finance income and costs 0.5 0.6 1.1 1.2 2.3
Other adjustments -0.4 -0.0 -0.4 0.1 0.8
4.3 3.6 8.3 6.8 15.7
Change in working capital
Change in inventories, increase (-) / decrease (+) -2.9 -8.8 -12.2 -15.6 -5.5
Change in contract assets, trade and other receivables, increase (-) /
decrease (+) 5.8 -6.3 8.8 -4.6 -7.4
Change in contract liabilities, trade and other payables, increase (+) /
decrease (-) 15.5 9.1 -8.7 -9.7 -4.3
Change in working capital 18.4 -6.0 -12.1 -29.8 -17.2
Interest paid -0.3 -0.4 -0.8 -0.6 -1.4
Interest received 0.1 0.0 0.1 0.1 0.1
Other finance income and expenses paid -0.6 -0.0 -1.3 -0.8 -1.4
Income taxes paid -1.6 -1.2 -2.9 -4.4 -8.0
Financial items and taxes -2.5 -1.6 -4.9 -5.7 -10.6
NET CASH FLOW FROM OPERATING ACTIVITIES 24.7 0.3 -4.0 -26.7 6.5
Only H1 and FY published

Quarterly net sales and comparable EBITDA by segment
7.11.2019 29
Net sales by segment
Comparable EBITDA by segment
EUR million Q3 19 Q2 19 Q1 19 Q4 18 Q3 18 Q2 18 Q1 18 Q4 17 Q3 17 Q2 17 Q1 17 Q4 16 Q3 16 Q2 16 Q1 16
Finland &
Exports
31.2 34.7 25.0 39.5 31.8 35.4 27.1 40.7 31.4 35.7 26.0 41.1 31.6 33.9 27.3
Scandinavia 25.6 29.0 21.7 42.8 25.0 27.4 22.5 44.4 26.5 29.7 23.2 45.9 26.7 30.0 25.0
Altia Industrial 27.7 27.5 27.1 28.6 28.9 24.2 24.0 24.7 26.5 25.9 24.2 24.0 25.6 22.7 22.9
Total 84.5 91.2 73.8 110.9 85.7 87.1 73.5 109.8 84.5 91.3 73.4 111.0 83.9 86.6 75.1
EUR million Q3 19 Q2 19 Q1 19 Q4 18 Q3 18 Q2 18 Q1 18 Q4 17 Q3 17 Q2 17 Q1 17 Q4 16 Q3 16 Q2 16 Q1 16
Finland & Exports 5.0 5.3 3.0 6.2 4.9 4.6 3.4 7.2 4.0 5.2 3.1 7.7 4.5 4.3 3.6
Scandinavia 1.3 2.0 -0.3 8.0 0.8 1.5 -0.1 8.9 1.0 2.1 -0.5 9.0 1.0 0.7 -0.3
Altia Industrial 3.6 2.3 1.0 2.2 4.8 2.5 1.4 3.7 4.5 2.6 1.6 2.6 3.4 2.6 -0.2
Other 1.5 -0.2 0.6 -0.6 -0.3 0.2 0.4 -1.3 0.9 -0.8 0.1 -0.5 1.6 0.2 0.6
TOTAL comparable EBITDA 11.4 9.4 4.3 15.9 10.3 8.7 5.2 18.5 10.4 9.2 4.3 18.9 10.5 7.8 3.6
Items affecting comparability -1.6 -0.2 - -1.5 0.0 -0.4 -4.1 -2.2 0.7 -0.2 -0.5 15.7 1.6 2.8 -0.1
EBITDA 9.8 9.2 4.3 14.4 10.3 8.3 1.1 16.3 11.1 9.0 3.8 34.6 12.1 10.6 3.6
Depreciation, amortisation and
impairment-4.5 -4.5 -4.5 -3.7 -3.6 -3.5 -3.5 -3.6 -3.6 -3.5 -3.5 -3.7 -3.6 -3.6 -3.6
Operating result 5.3 4.8 -0.3 10.7 6.6 4.8 -2.5 12.7 7.6 5.4 0.3 30.9 8.5 7.0 -0.0
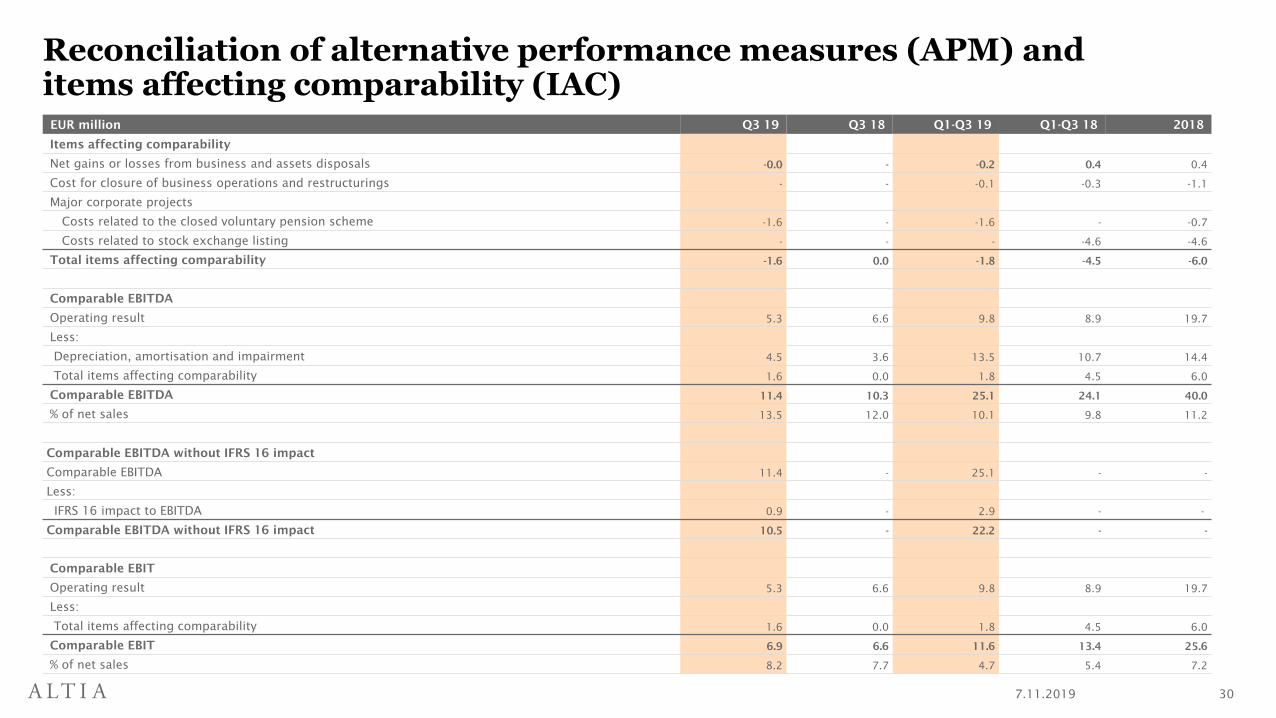
Reconciliation of alternative performance measures (APM) and items affecting comparability (IAC)
7.11.2019 30
EUR million Q3 19 Q3 18 Q1-Q3 19 Q1-Q3 18 2018
Items affecting comparability
Net gains or losses from business and assets disposals -0.0 - -0.2 0.4 0.4
Cost for closure of business operations and restructurings - - -0.1 -0.3 -1.1
Major corporate projects
Costs related to the closed voluntary pension scheme -1.6 - -1.6 - -0.7
Costs related to stock exchange listing - - - -4.6 -4.6
Total items affecting comparability -1.6 0.0 -1.8 -4.5 -6.0
Comparable EBITDA
Operating result 5.3 6.6 9.8 8.9 19.7
Less:
Depreciation, amortisation and impairment 4.5 3.6 13.5 10.7 14.4
Total items affecting comparability 1.6 0.0 1.8 4.5 6.0
Comparable EBITDA 11.4 10.3 25.1 24.1 40.0
% of net sales 13.5 12.0 10.1 9.8 11.2
Comparable EBITDA without IFRS 16 impact
Comparable EBITDA 11.4 - 25.1 - -
Less:
IFRS 16 impact to EBITDA 0.9 - 2.9 - -
Comparable EBITDA without IFRS 16 impact 10.5 - 22.2 - -
Comparable EBIT
Operating result 5.3 6.6 9.8 8.9 19.7
Less:
Total items affecting comparability 1.6 0.0 1.8 4.5 6.0
Comparable EBIT 6.9 6.6 11.6 13.4 25.6
% of net sales 8.2 7.7 4.7 5.4 7.2

Shareholder structure
7.11.2019 31
AS AT 31 OCTOBER 2019
ShareholdersNumber of
shares% of shares
1 Valtion Kehitysyhtiö Vake Oy 13 097 481 36.2
2 Varma Mutual Pension Insurance Company 1 550 000 4.3
3 Ilmarinen Mutual Pension Insurance Company 973 300 2.7
4 OP-Finland Small Firms Fund 579 516 1.6
5 Veritas Pension Insurance Company Ltd. 420 000 1.2
6 Mandatum Life Insurance Company Limited 178 842 0.5
7 FIM Fenno Sijoitusrahasto 160 931 0.4
8 Sijoitusrahasto Taaleritehdas Arvo Markka Osake 150 000 0.4
9 Säästöpankki Kotimaa 150 000 0.4
10 Säästöpankki Pienyhtiöt 149 424 0.4
Top 10 total 17 409 494 48.2
Nominee-registered shares 9 146 245 25.3
Public
sector
44 %
Financial and
insurance
corporations
29 %
Households
19 %
Non-financial
corporations
5 %
Non-profit
institutions
2 %
Rest of the
world
1 %
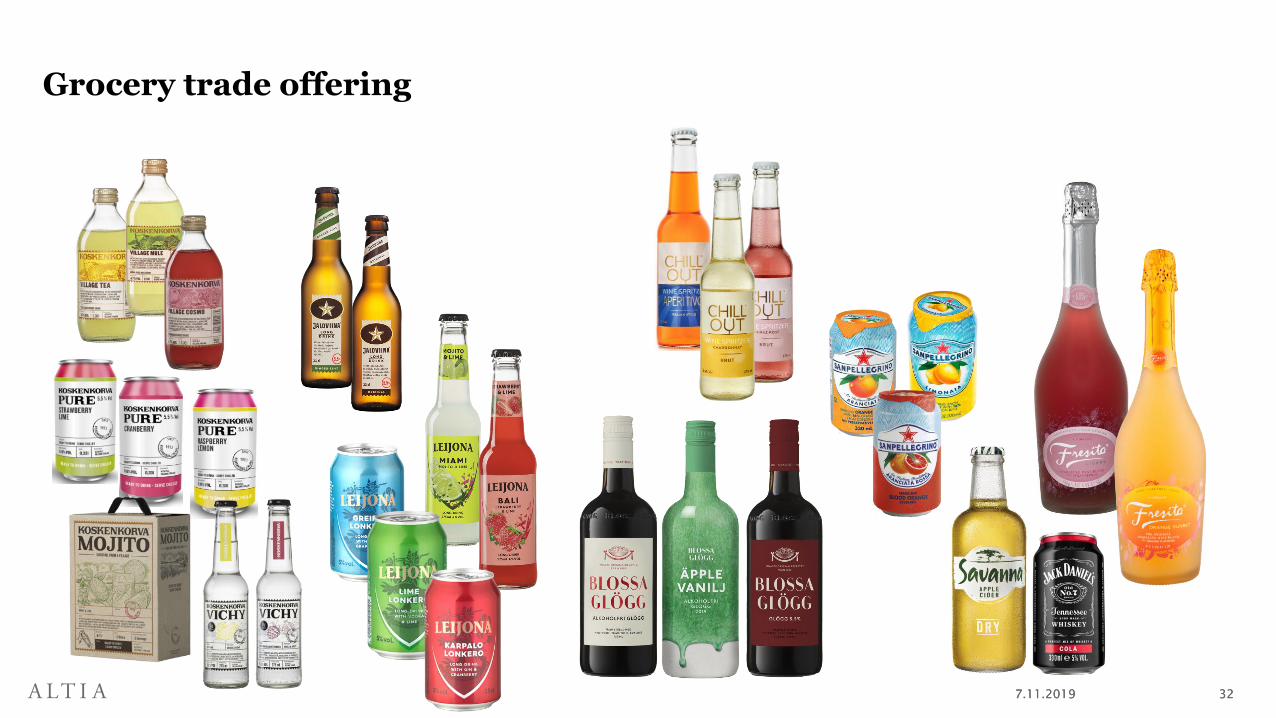
Grocery trade offering
7.11.2019 327.11.2019 32