results of the user satisfaction survey, 2019
TRANSCRIPT

The Statistical Office of the Republic of Serbia
Results of the User satisfaction survey, 2019 Survey period: October 15-November 12, 2019
Belgrade, December 2019

1
Contents
Introduction ............................................................................................................................................................................ 2
Survey results .......................................................................................................................................................................... 3
2. Data access and use ............................................................................................................................................................ 6
3. Statistical data quality ......................................................................................................................................................... 9
4. Dissemination.................................................................................................................................................................... 10
6. Users’ recommendations .................................................................................................................................................. 14
7. Comparative review of 2019 and 2017 surveys ................................................................................................................ 15
7.1. Socio- economic structure of survey participants ..................................................................................................... 15
7.2. Data access and use ................................................................................................................................................... 17
7.3. Statistical data quality ................................................................................................................................................ 18
7.4. Dissemination............................................................................................................................................................. 19
7.5. Communication with SORS ........................................................................................................................................ 21
8. Conclusion ......................................................................................................................................................................... 21

2
Introduction
The Statistical Office of the Republic of Serbia (SORS) conducted in the period October 15- November 12, 2019,
for the fifth time, the User satisfaction survey. The Survey is conducted in two-year periodicity. The aim of the
Survey is to gain the information on users’ needs, their satisfaction with SORS data and services, as well as
providing information on quality of data and services offered by SORS.
The questionnaire consisted of the following segments: general aspect of data access and use, statistical data
quality, data dissemination, communication and activity of SORS and information on the respondents in the
survey.
The Survey was conducted via web questionnaire in Serbian and English language. The banner was placed on the
homepage of the website and SORS twitter account. The registered users were sent the e-mail with the invitation
to participate in the Survey, and seven days before the end of the Survey, the reminder was sent.
469 users participated in the Survey; compared to 2017 Survey (when 725 users participated), this interviewing
records fall of 256 users.
Results of the Users satisfaction survey will enable improvement of the quality of data and services provided by
SORS, primarily regarding the segments in which lower level of satisfaction was expressed. Additionally, the
answers to some questions may serve to better targeting of appropriate SORS activities in the area of quality
management policy. Based on the results obtained, and in accordance with the resources available, SORS will
implement measures to improve the current situation.

3
Survey results

4
1. Socio-economic structure of survey participants
Based on the conducted survey, obtained were the data on demographic characteristics of participants in the
survey, i.e. users of statistical data and services.
The majority of users belong to the age group of 30-49 years (64%), the majority of users are females (58%), and
the users are mostly with university education (93%) and employed (85%). Every fourth user works in bodies/
organizations within public administration (25%), then in business entities (21%) and local self-government bodies
/ organizations (17%).
Looking at the users according to the activity in which they work, the most numerous users are from the section
of Education, science, innovation (21%), Public administration and local administration (19%) and Information and
Communication (9%).
1.1. Age structure 1.2. Gender structure
1.3. Highest level of school completed 1.4. Working status
0%
14%
32%
32%
17%
5%
0% 10% 20% 30% 40%
Under 20
20-29
30-39
40-49
50-59
60 and over
58%
42% Female
Male
Secondary, 7%
Tertiary, 43%Master/
Bachelor, 38%
PhD, 13%
85%
6%5% 2%2%
Employed
Student/pupil
Unemployed
Pensioner
Other

5
1.5. Users group
1.6. Activity
1.7 Users by regions (NUTS2)
94% of users from the Republic of Serbia
participated in the survey, while 6% consisted of
users from abroad - 1% each from Bosnia and
Herzegovina, Bulgaria, Germany and Romania,
while 2% were from other countries.
The largest number of users who participated in
the survey is from Beogradski region (52%).
25%
21%
17%
7%
7%
5%
18%
Public administration
Business entity (except media)
Local self-government
Media (printed, electronic, etc.)
Organisation/Chamber/Association (NGO, foreign, sports, andother association)
International organization/ institution
Other
21%
19%
9%
7%
6%
6%
5%
5%
4%
3%
2%
1%
Education, science, innovations
Public administration (state government and local self-…
Information and communication
Agriculture, fishing and forestry
Industry, mining and quarrying, energy
Human health and social work activities
Finance and insurance
Trade
Tourism and catering trade
Construction
Transport and storage
Arts, entertainment and recreation
52%
23%
13%
12%
0%
Beogradski region
Region Vojvodine
Region Šumadije i ZapadneSrbije
Region Južne i Istočne Srbije
Region Kosova

6
2. Data access and use
The most frequently required data are from population statistics (12%), labour market statistics (10%), census of
population, households and dwellings (10%), price statistics (7%), education statistics (6%), and statistics on
consumption, income and living conditions (6%).
The data from the mentioned six statistical areas present somewhat over 50% of the used data.
2.1. From which statistical areas do you use data the most frequently?
Review of data usage grouped by statistics
12%
10%
10%
7%
6%
6%
5%
4%
4%
4%
3%
3%
3%
3%
3%
2%
2%
2%
2%
2%
2%
2%
1%
1%
1%
Construction
o Labour market (unemployment, employment, earnings)
Census of population, households and dwellings
Prices
Education
Consumption, income and living conditions
Agriculture, forestry and fishery
Industry
Catering trade and tourism
External trade
Environment
Population
National accounts
Science, technology, innovations
Elections
Structural business statistics
Culture
Transport and telecommunications
Use of information – communication technologies
Descriptive indicators and econometric analysis
Domestic trade
Register of spatial units and GIS
Energy
Judiciary
Classification units’ register and Statistical business register
44%
17%
30%
10%
Social statistics National accounts, price andagriculture
Bussiness statistics Labour market statistics

7
The purpose of data using is mostly analysis creation (16%), and research projects (15%), personal information
(14%), and scientific papers creation (12%).
2.2. For what purpose do you use the statistical data?
Dynamics of data using is most frequently monthly (29%), weekly (20%) and daily (9%), meaning that almost a
third of users (29%) need statistical data on weekly and daily level.
2.3. How often do you use the statistical data?
16%
15%
14%
12%
12%
8%
7%
7%
8%
Market analysis and business analysis
Research projects
Personal information
Scientific papers creation
Making business decisions
Downloading data for the purpose of further publishing…
Seminar and other papers creation
Modelling and forecasting
Other
29%
20%
19%
13%
10%
9%
Monthly
Weekly
Quarterly
Annually or more rarely
Semi-annually
Daily
8
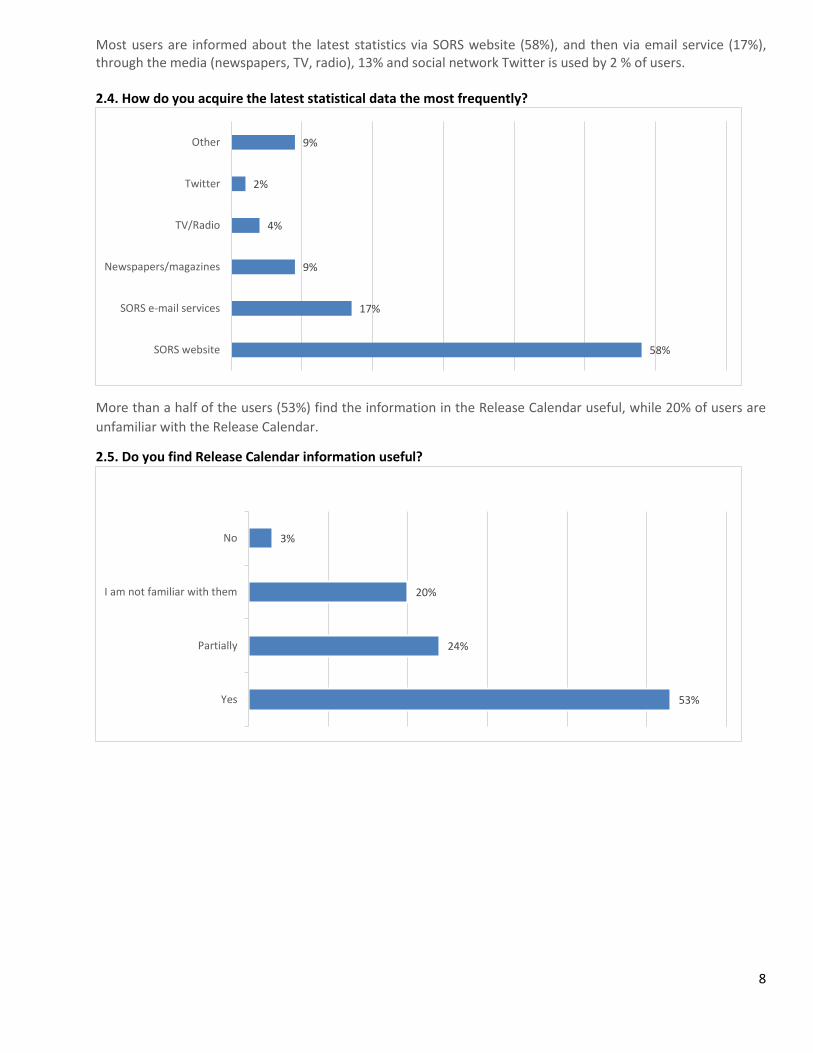
Most users are informed about the latest statistics via SORS website (58%), and then via email service (17%), through the media (newspapers, TV, radio), 13% and social network Twitter is used by 2 % of users. 2.4. How do you acquire the latest statistical data the most frequently?
More than a half of the users (53%) find the information in the Release Calendar useful, while 20% of users are
unfamiliar with the Release Calendar.
2.5. Do you find Release Calendar information useful?
58%
17%
9%
4%
2%
9%
SORS website
SORS e-mail services
Newspapers/magazines
TV/Radio
Other
53%
24%
20%
3%
Yes
Partially
I am not familiar with them
No

9
3. Statistical data quality
Alost a half of users consider the statistics produced by SORS to be sufficiently detailed, easy to understand,
comparable, reliable and updated, while the percentage of those who expressed agreement regarding accuracy,
timeliness, ease of finding and release from political influence is somewhat lower.
3.1. To what extent do you agree that the statistics produced by SORS is
Overall quality of statistical data was estimated with the average of 4.16; over 50% of users agree that the statistics
produced by SORS are sufficiently detailed, easy to understand, comparable, reliable and updated.
3.2. How do you estimate total quality of statistical data provided by SORS?
53%
53%
55%
41%
42%
56%
44%
56%
46%
40%
40%
35%
31%
42%
35%
39%
35%
41%
3%
3%
5%
13%
13%
6%
10%
6%
7%
4%
4%
5%
15%
3%
3%
6%
3%
6%
Accurate
Reliable
Comparable
Released of political influence
Easy to find
Easy to understand
Timely (published on time)
Detailed enough
Updated
Agree Partially agree Disagree No opinion
0%2%
19%
39% 40%
3%
1 2 3 4 5 6
Very bad Bad Satisfying Good Very good No opinion

10
4. Dissemination
Every second user consider that SORS website satisfy their needs. Most users would recommend the website to
the others (64%), and somewhat less than a half of users found the website attracting and easy to use. 53% of
users can find the required information on SORS website, and only 2% of users cannot find the information they
are looking for. The language used on the website was rated as easy to use (47%), while 3% said it was too
professional/ expert.
4.1. How much do you agree or disagree with the following statements regarding SORS website?
4.2. How would you describe the language used on
SORS website?
4.3. Can you, generally, find the searched information on SORS website?
52%
46%
42%
64%
41%
40%
37%
25%
4%
11%
13%
5%
3%
3%
8%
6%
It satisfies my needs
It is easy to use
It is visually attracting
I would recommend this page to the others
Agree Partially agree Disagree No opinion
Simple for
understanding, 47%
Satisfying, 49%
Too professional/ expert, 3%
Yes, 53%Partially,
45%
No, 2%

11
With an average rating of 4.15 users estimated their overall experience in using SORS website, that is, 45% of users
rated their experience of using the site as "good" and 35% of users rated it as "very good". Only 2% of users rated
their experience as "bad".
4.4. How would you rate overall experience in using SORS website?
Every third user downloads statistics through the database, 19% of users download data through tables, 17% use
electronic publications and 16% use statistical releases. DevInfo database is used by 7% of users, Open Data portal
and Portal of Sustainable Development Goals, by 5% of users.
4.5. How do you acquire statistical data from SORS website the most frequently?
0%2%
15%
45%
35%
3%
Very bad Bad Satisfying Good Very good No opinion
1 2 3 4 5 6
30%
19%
17%
16%
7%
6%
4%
1%
Database
Tables available on the website by statistical areas
Electronic publications
Statistical releases
DevInfo database
Other
SORS Open Data Portal
Portal of Sustainable development goals

12
4.6. Average estimates of database, DevInfo base, Open Data Portal and Portal of Sustainable development goals
4.7. Average estimates of statistical releases and electronic publications
4.8. Estimate the quality of additional information (definitions, classifications, methodological explanations,
referent metadata)
4.083.88 3.95
4.22 4.13 4.054.033.85 3.88
4.50 4.584.42
Contents Design Structure
Database DevInfo database SORS Open Data Portal Portal of Sustainable development goals
4.153.95 4.02 4.054.16
3.99 4.07 4.11
Contents Design Structure Writing style
Statistical releases Electronic publications
3.89 4.02 3.97
Ease of finding Intelligibility Level of details
13
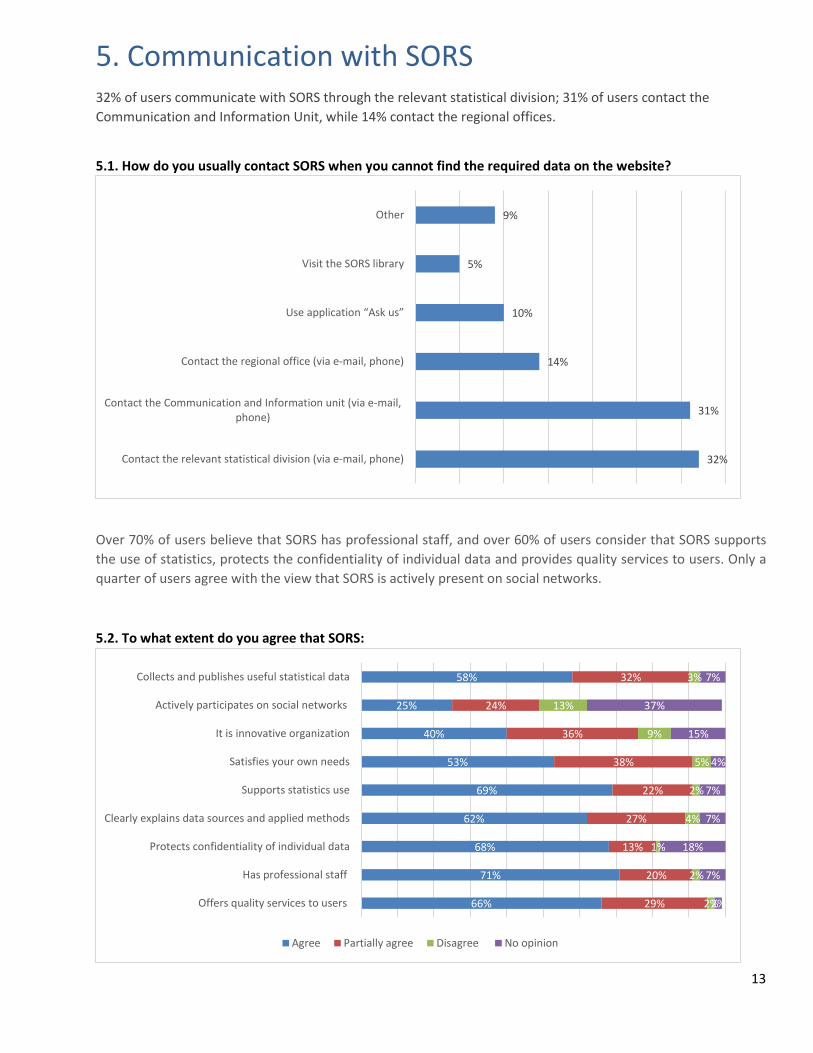
5. Communication with SORS 32% of users communicate with SORS through the relevant statistical division; 31% of users contact the
Communication and Information Unit, while 14% contact the regional offices.
5.1. How do you usually contact SORS when you cannot find the required data on the website?
Over 70% of users believe that SORS has professional staff, and over 60% of users consider that SORS supports
the use of statistics, protects the confidentiality of individual data and provides quality services to users. Only a
quarter of users agree with the view that SORS is actively present on social networks.
5.2. To what extent do you agree that SORS:
32%
31%
14%
10%
5%
9%
Contact the relevant statistical division (via e-mail, phone)
Contact the Communication and Information unit (via e-mail,phone)
Contact the regional office (via e-mail, phone)
Use application “Ask us”
Visit the SORS library
Other
66%
71%
68%
62%
69%
53%
40%
25%
58%
29%
20%
13%
27%
22%
38%
36%
24%
32%
2%
2%
1%
4%
2%
5%
9%
13%
3%
2%
7%
18%
7%
7%
4%
15%
37%
7%
Offers quality services to users
Has professional staff
Protects confidentiality of individual data
Clearly explains data sources and applied methods
Supports statistics use
Satisfies your own needs
It is innovative organization
Actively participates on social networks
Collects and publishes useful statistical data
Agree Partially agree Disagree No opinion

14
6. Users’ recommendations Users had the opportunity to answer three open-ended questions in the survey. The first question related to
information that users could not find on SORS website, the second one to a proposal to improve the website, and
the third to the work of SORS. Based on the answers received, a list of the most frequent proposals was formed.
The information users need but have not been able to find on the website mostly refers to:
• Data on the municipal level (tourism, transport, unemployment rate, economic growth rate),
• Demographic indicators on the level of settlement (even at grid level)
• Foreign trade data by customs tariff (although such search is enabled in the database)
• Information on social network usage, way of usage, online media usage
Knowing that the largest number of users obtain statistics through our website, users believe that the promotion
of the website should focus on:
• Improving keyword search
• Holding the header while using the slider
• Expanding the web presentation by magnifying glass without increasing the font
• Linking news / information to the previous ones
• Modernizing graphic display
Critics, praise and suggestions regarding the work of SORS expressed by the users in the survey:
Critics:
• The processing and publishing of data from certain statistical fields should be accelerated so as to improve
timeliness - it was stated that the Monthly Bulletin was published two months and 10 days after the reference
period, that the Judiciary Bulletin publication is issued only in December of the current year for the previous year,
etc.
• Users find that survey methodologies are quite complicated to understand and should be simplified and
“brought closer” to the average user
Praise:
• The users praised the efficiency and timeliness of SORS activities and users- oriented communication
• Professionalism and kindness of employees
• Trust in employee’s data and proficiency
• SORS has been declared as a good example of how modern public administration should look like nowadays in
Serbia
• The professional work and data published and disseminated by SORS conveys confidence in statistics
Suggestions:

15
• Proposal to occasionally organize meetings (training sessions) with users who frequently use statistics but do
not have sufficient expertise or sufficient knowledge to understand statistics
• Regular cooperation with data sources
• Business entities generally do not have research and analysis staff, so they need ready-made economic and
demographic reports instead of “bare” data.
• Innovation in the work of an institution when presenting the data is necessary - for example, through analysis,
i.e. deeper analytical review
• A very rich production of publications should be brought closer to interested users, as much as possible
• Adjust content so as to be readable on your mobile phone
• Digitization of older data
• Improve and simplify the publication of information on public competitions and highlight them separately on
the website (as a separate page or similar)
• Ability to cross data from multiple surveys
7. Comparative review of 2019 and 2017 surveys Comparative overview of 2019 and 2017 surveys’ data is given only for those questions that remained the same
in both surveys. For the questions “Most used statistical areas” and “Most common way of downloading data
from the website”, comparisons were made, although the statistical areas or the ability of data downloading from
the website are not exactly the same in both surveys. The reason is the opening of new portals that did not exist
in 2017 and changes in the statistical areas on the new website.
7.1. Socio- economic structure of survey participants
19%
30%
25%
19%
7%
14%
32% 32%
17%
5%
20-29 30-39 40-49 50-59 60 and over
Age structure
2017 2019

16
59% 58%
41% 42%
2017 2019
Gender
Female Male
7%
46%
34%
13%
7%
43%
38%
13%
Secondary Tertiary Master/ Bachelor PhD
Educational level
2017 2019

17
7.2. Data access and use
0% 2% 4% 6% 8% 10% 12% 14% 16%
Population
Prices
Consumption, income and living conditions
Industry
External trade
Construction
Science, technology, innovations
Structural business statistics
Transport and telecommunications
Domestic trade
Judiciary
Descriptive indicators and econometric analysis
Classification units’ register and Statistical business register
The most frequently used statistical areas
2019 2017
0% 5% 10% 15% 20% 25% 30%
Market analysis and business analysis
Research projects
Personal information
Scientific papers creation
Making business decisions
Downloading data for the purpose of further publishing…
Seminar and other papers creation
Modelling and forecasting
Other
The purpose of useing the statistical data
2019 2017

18
7.3. Statistical data quality
30%
17%19%
14%11%
9%
29%
20% 19%
13%10% 9%
Monthly Weekly Quarterly Annually or morerarely
Semi-annually Daily
The frequency of using the statistical data
2017 2019
38% 36%
21%
5%
53%
24%20%
3%
Yes Partially I am not familiar with them No
Do you find Press Calendar information useful?
2017 2019
1%4%
14%
42%
36%
4%0%
2%
19%
39% 40%
3%
Very bad Bad Satisfying Good Very goodNoopinion
No opinion
Assessment of total data quality
2017 2019

19
7.4. Dissemination
3.894.1 4.16
2015 2017 2019
Average assessment of total quality
28%
21% 20%
13%7% 6% 5%
30%
19% 17% 16%
7% 6% 4%1%
Database Tablesavailable on
the website bystatistical areas
Electronicpublications
Statisticalreleases
DevInfodatabase
Other SORS OpenData Portal
Portal ofSustainable
developmentgoals
Printedpublications
The most frequently data download from the website
2017 2019
0%
6%
23%
40%
26%
5%
0%2%
15%
45%
35%
3%
Very bad Bad Satisfying Good Very good No opinion
Assessment of the overall experience in using SORS website
2017 2019

20
1%5%
13%
27%
50%
4%0% 0%
17%
43%40%
0%
Very bad Bad Satisfying Good Very good No opinion
Assessment of the contents of DevInfo database
2017 2019
4.11 4.16
Average assessment of the electronic publications
2017 2019
3.744.05
3.853.89 4.02 3.97
Ease of finding Intelligibility Level of details
Estimation of the additional information
2017 2019

21
7.5. Communication with SORS
8. Conclusion Comparing the results of this survey with the previous ones (from 2017), it can be concluded that users expressed
somewhat higher level of satisfaction with the statistical data and services provided by SORS.
The greatest shift in user satisfaction is noted in the field of data dissemination. This result was expected given
that in 2018 SORS launched the new website and redesigned database. By comparing the results in this area with
the results of the previous survey, we come to the conclusion that estimation "very good", which refers to the
overall experience with using the website, increased by 9 p. p. while the estimation "good" increased by 5 p.p.
Comparing the results related to the database, the estimates "very good" and "good" increased by 5 p. p., while
the Release Calendar was rated as useful by 15 p. p. more than in the previous survey.
The overall quality score has not been significantly increased, although slight upward trend can be noticed,
especially if 2015 data is observed, amounting to 0.27 p. p. relative to 2019 data.
A very significant contribution to the work and improvement of SORS presentation data is in the comments
received and which, in a very clear and constructive way, provide us with the opportunity to consider the various
issues from the perspective of our services’ users.
In the following two years, SORS will endeavour to include in the work plan the suggestions of the users obtained
by this survey.
37%34%
13%
5%
11%
32% 31%
14%10%
5%9%
Contact the relevantstatistical division(via e-mail, phone)
Contact theCommunication andInformation unit (via
e-mail, phone)
Contact the regionaloffice (via e-mail,
phone)
Use application “Ask us”
Visit the SORS library Other
How do you usually contact SORS when you cannot find the required data on the website?
2017 2019