employee well-being and satisfaction survey results 2015 · employee well-being and satisfaction...
TRANSCRIPT

Employee Well-Being and Satisfaction Survey Results
2015
Dr. Terry Beehr, Alex Stemer, & Annie Simpson
November 30th, 2015

Table of Contents
Employee Well-Being and Satisfaction Survey Results 2015 3
Comparison of CMU data to Employees from Other Organizations 3
External Comparisons of the Nature of the Job and Employee Reactions 4
External Comparisons of Health Culture 5
Comparison of Results for CMU Employees over Time 6
Employee Reactions and the Nature of the Job 6
Autonomy 7
CMU Climate 8
Leadership at CMU 9
CMU Health Culture 10
Appendix A 12

Employee Well-Being and Satisfaction Survey Results 2015
A survey evaluating employee well-being and satisfaction was administered on behalf of the
Human Resources Department (HR) at CMU. The purpose of the survey was to assess the staff’s
(non-faculty) well-being and identify any areas that were strengths and areas that could use
improvement. Additionally, comparisons are made with the results of surveys from previous
years and with employees at other organizations. The survey, with some variations, has been
administered since 2004, and this is the 8th administration. Examining survey responses and
changes throughout the years will help HR ensure that the CMU staff continues to have positive
perceptions of the workplace.
In the next section, participation rates and demographics are briefly discussed. The remainder of
the report details the comparison of the results over time and comparisons with employees at
other organizations.
Participation
A total of 524 CMU staff members completed, or nearly completed, the entire survey, for a
32.3% response rate. Although some respondents did not complete the entire survey, their
responses were used for the scales that they did complete, as they provide valuable information.
Therefore there are slightly different sample sizes for different variables. Of those who
responded, 70.1% were female and 29.3% were male. Regarding ethnic background, 95.4% were
Caucasian, 1.2% were Hispanic, 1.3% were African-American, .4% were Asian-Americans, .2%
were American Indian, and 1.5% were multi-cultural. The average age of the sample was 44.91
years and 10.67 was the average length of employment at CMU. Lastly, 43.9% indicated that
they supervise one or more employees.
Comparison of CMU Data to Employees from Other Organizations
Most of the scales in the study are widely used, and therefore there are comparison data available
from previous survey projects in other organizations, available in various publications. These
external “benchmarks” ranged from about 5 to 11 other organizations and from about 1,000 to
30,000 employees. The variables compared with these available benchmarks are job satisfaction,
turnover intentions, role conflict, autonomy, emotional exhaustion, citizenship behaviors,
organizational commitment, and work engagement.

External Comparisons of the Nature of the Job and Employees Reactions to It
Figure 1 compares CMU employees against others on employee experiences and suggests that,
compared to other employees, CMU employees generally report more favorable outcomes. One
notable exception is for emotion exhaustion, which CMU employees report slightly more of
compared to others. Figure 2 compares CMU employees against others on the nature of the job
and suggests that CMU employees report slightly less role conflict and slightly more autonomy
compared to other employees. These comparison data suggest that CMU employees generally
experience comparable if not somewhat more favorable impressions of work and their reactions
to work than other employees. An interpretation of these results is that CMU employees may be
a little more active and enthused about their jobs than the comparison samples, but there may be
a “cost” to this in the form of feeling more exhausted by their jobs.
Figure 1: Comparison Data – Employee Reactions
Note. See Appendix for breakdown of source and sample size used to construct comparison data.
0
1
2
3
4
5
6
7
Employee Reactions
CMU Employees (2015) Comparison Data
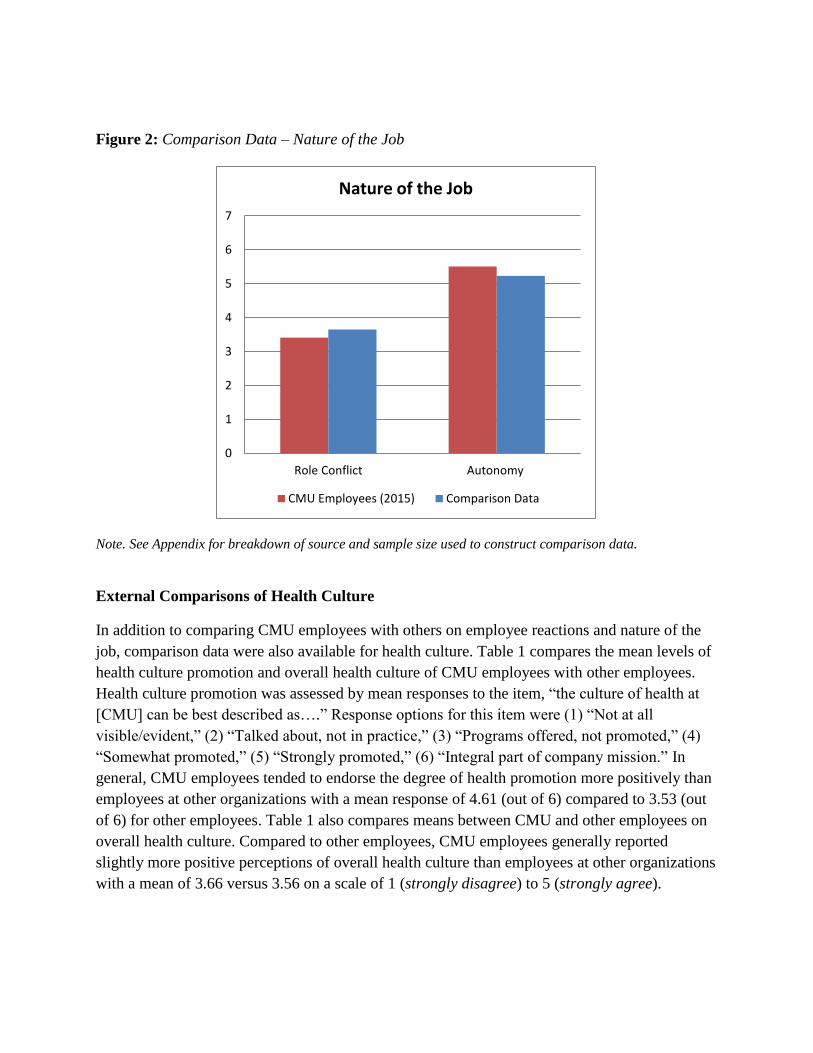
Figure 2: Comparison Data – Nature of the Job
Note. See Appendix for breakdown of source and sample size used to construct comparison data.
External Comparisons of Health Culture
In addition to comparing CMU employees with others on employee reactions and nature of the
job, comparison data were also available for health culture. Table 1 compares the mean levels of
health culture promotion and overall health culture of CMU employees with other employees.
Health culture promotion was assessed by mean responses to the item, “the culture of health at
[CMU] can be best described as….” Response options for this item were (1) “Not at all
visible/evident,” (2) “Talked about, not in practice,” (3) “Programs offered, not promoted,” (4)
“Somewhat promoted,” (5) “Strongly promoted,” (6) “Integral part of company mission.” In
general, CMU employees tended to endorse the degree of health promotion more positively than
employees at other organizations with a mean response of 4.61 (out of 6) compared to 3.53 (out
of 6) for other employees. Table 1 also compares means between CMU and other employees on
overall health culture. Compared to other employees, CMU employees generally reported
slightly more positive perceptions of overall health culture than employees at other organizations
with a mean of 3.66 versus 3.56 on a scale of 1 (strongly disagree) to 5 (strongly agree).
0
1
2
3
4
5
6
7
Role Conflict Autonomy
Nature of the Job
CMU Employees (2015) Comparison Data

Table 1: Comparison of Health Culture
Variable CMU 2015
Mean
Comparison Data
Mean
Health Culture Promotion 4.61 3.53
Overall Health Culture 3.66 3.56
Note. N of CMU Employees=526 in 2015. N of Comparison Data for “Health Culture Promotion” = 3,007 full time
employees from a variety of large companies. N of Comparison Data for “Overall Health Culture” = 2,837
employees primarily from manufacturing, government, and lower and higher education.
Comparison of Results for CMU Employees over Time
Employee Reactions and the Nature of the Job
Several questions in the survey measured employees’ reactions towards their jobs, shown in
Table 2, as well as perceptions of the nature of the job, shown in Table 3. Each of these variables
was measured by a set of items that were averaged to obtain a more comprehensive score.
Because the survey changed over the years, data from earlier years were not available for all
variables. For example, citizenship behavior was not added until 2013, and so there is no
information on this factor for 2006 or 2008.
Looking at the employee reaction variables in Table 2, it appears that most employee reactions
remained relatively unchanged since 2013. Compared to 2006 and 2008 though, the average for
job satisfaction in 2015 is higher. Organizational commitment was a new variable that was added
to the survey in 2015. This variable assesses employee’s positive emotional attachment to the
organization. Overall, employees indicated that they felt committed to CMU (as indicated by the
mean of 5.74 on a 7-point scale). A measure of work engagement was also added to the survey
for the 2015 administration. Employees at CMU were slightly engaged with their work, meaning
that they found their work to be somewhat engaging and lively (as indicated by the mean of 5.03
on a 7-point scale). The means for the employees’ work reactions across the years are shown in
Table 2 below.

Table 2: Comparison of Descriptive Statistics for Employee Reactions
Variable 2006 Mean 2008 Mean 2013 Mean 2015 Mean
Job Satisfaction 5.17 5.51 5.62 5.61
Turnover Intentions 2.68 2.70 2.52 2.60
Emotional Exhaustion 3.04 3.00 3.25 3.06
Citizenship Behavior (I) -- -- 5.83 5.85
Citizenship Behavior (O) -- -- 6.31 6.34
Organizational Commitment -- -- -- 5.74
Work Engagement -- -- -- 5.03 Note. N = 403 for 2006. N = 392 for 2008. N = 400 to 441 for 2013. N = 527 to 572 for 2015. All variables were
scored on a 1 to 7 scale. ”—“ indicates that no score was available for that year. Citizenship behaviors (I) refers
to good behaviors targeted at individuals, and (O) refers to good behaviors targeted at the organization.
Regarding the nature of the jobs at CMU, compared to 2013, workload and role conflict are
about the same in 2015. Workload is down from 2008 when it was very high (note from the
benchmark data above, the CMU workload scores in 2008 were extremely high and may be
returning to normal). The averages across years for the nature of the job variables are displayed
in Table 3.
Table 3: Comparison of Descriptive Statistics for the Nature of the Job
Variable 2008 Mean 2013 Mean 2015 Mean
Workload 5.48 3.92 4.05
Role Conflict 3.20 3.38 3.41 Note. N = 403 for 2006. N = 392 for 2008. N = 400 to 441 for 2013. N = 527 to 572 for 2015. All
variables were scored on a 1 to 7 scale.
Autonomy
Autonomy is a job characteristic that is reported separately because it was measured in a more
inconsistent way. It was assessed by three items in 2015, only one of which was used in 2013.
The use of three items allowed a comparison with external employees (above). The mean for the
single item that was also used in 2013 is shown in Table 4. Responses ranged from 1 to 7, and
employees overall indicated that they felt autonomous in their job. However, the average for the
item is slightly lower compared to 2013.
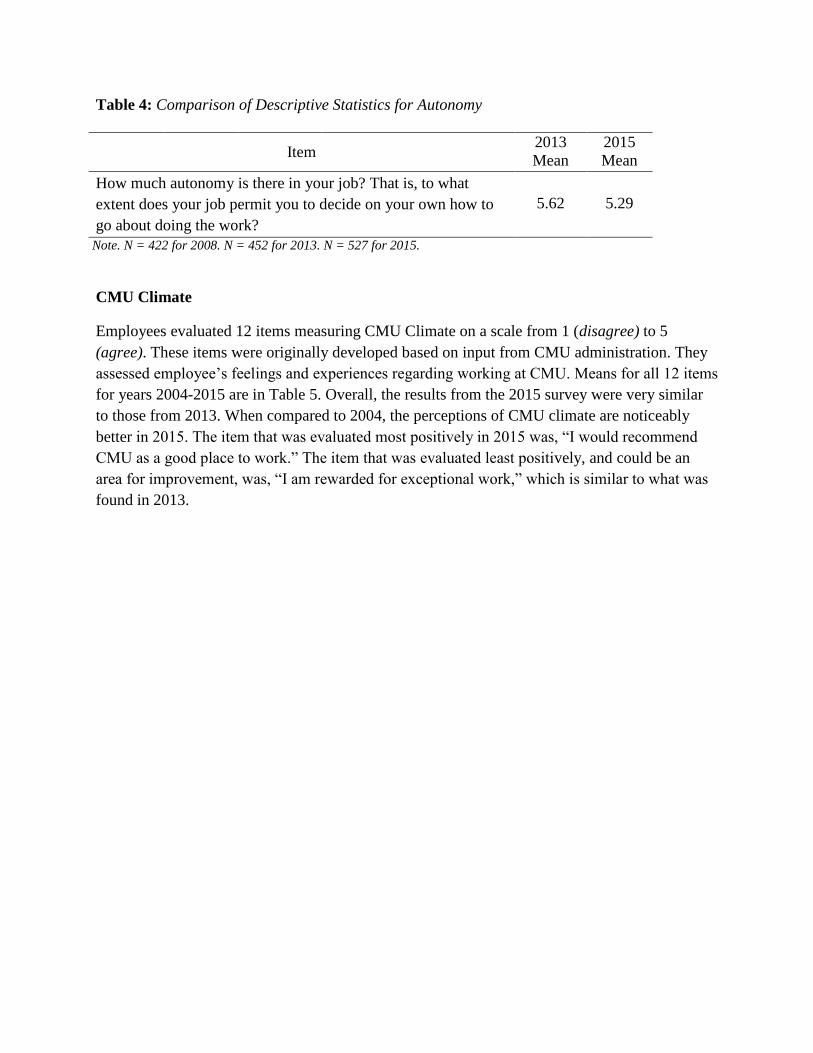
Table 4: Comparison of Descriptive Statistics for Autonomy
Item 2013
Mean
2015
Mean
How much autonomy is there in your job? That is, to what
extent does your job permit you to decide on your own how to
go about doing the work?
5.62 5.29
Note. N = 422 for 2008. N = 452 for 2013. N = 527 for 2015.
CMU Climate
Employees evaluated 12 items measuring CMU Climate on a scale from 1 (disagree) to 5
(agree). These items were originally developed based on input from CMU administration. They
assessed employee’s feelings and experiences regarding working at CMU. Means for all 12 items
for years 2004-2015 are in Table 5. Overall, the results from the 2015 survey were very similar
to those from 2013. When compared to 2004, the perceptions of CMU climate are noticeably
better in 2015. The item that was evaluated most positively in 2015 was, “I would recommend
CMU as a good place to work.” The item that was evaluated least positively, and could be an
area for improvement, was, “I am rewarded for exceptional work,” which is similar to what was
found in 2013.

Table 5: Comparison of Descriptive Statistics for CMU Climate Items
Item 2004
Mean
2006
Mean
2008
Mean
2013
Mean
2015
Mean
I trust CMU’s management/administrators to make
good decisions 3.12 3.56 3.66 3.75 3.65
I would recommend CMU as a good place to work 3.97 4.30 4.40 4.42 4.42
I am actively seeking employment outside of CMU 2.07 1.98 1.95 1.86 1.90
I am rewarded for exceptional work 2.57 2.68 2.67 2.75 2.71
I fit in comfortably as a member of this organization 4.05 4.03 4.00 4.06 4.15
I feel inhibited to express my personal individuality at
work 2.46 2.58 2.55 2.52 2.57
CMU is an exceptional place to earn a degree 3.85 3.99 4.02 4.09 4.12
CMU employees are caring and helpful 4.04 4.22 4.25 4.31 4.29
CMU employees follow through on their
commitments to me 4.12 4.02 4.07 4.03 4.01
CMU employees are knowledgeable about their jobs 4.09 4.18 4.26 4.20 4.21
CMU employees are available when I need them to
assist me 2.26 4.11 4.14 4.17 4.18
It is difficult to form social ties with my coworkers 4.22 2.46 2.36 2.44 2.46
I am provided opportunities for professional
development -- -- -- 3.86 3.88
Note. N = 466 for 2004. N = 403 for 2006. N = 422 for 2008. N = 452 for 2013. N = 601 for 2015. Possible range is
from 1 (disagree) to 5 (agree). The last item in the table was used for the first time in 2013.
Leadership at CMU
A set of 15 items assessing leadership expectations were included in the survey as well. These
items were added in the 2013 version of the survey and were based on the Senior Leadership
Team Expectations document created by a presidential committee in 2010. Five different areas of
expectations were assessed, each measured by three items. All items were answered on a scale
from 1 (strongly disagree) to 7 (strongly agree). Table 6 displays the means for all items for the
years 2013 and 2015.
Overall, in 2015 employees indicated they slightly agreed that their supervisors were meeting
leadership expectations. The total average for all items was slightly lower than that of 2013. All
of the items were rated lower in 2015 compared to 2013. The item showing the biggest decrease
since 2013 was, “my supervisor treats people fairly.” Similar to 2013, the item receiving the
lowest ratings was, “my supervisor manages by motiving people.” Also consistent with 2013
results, the item receiving the highest ratings in 2015 was, “my supervisor considers the views of
those who come from different backgrounds.”
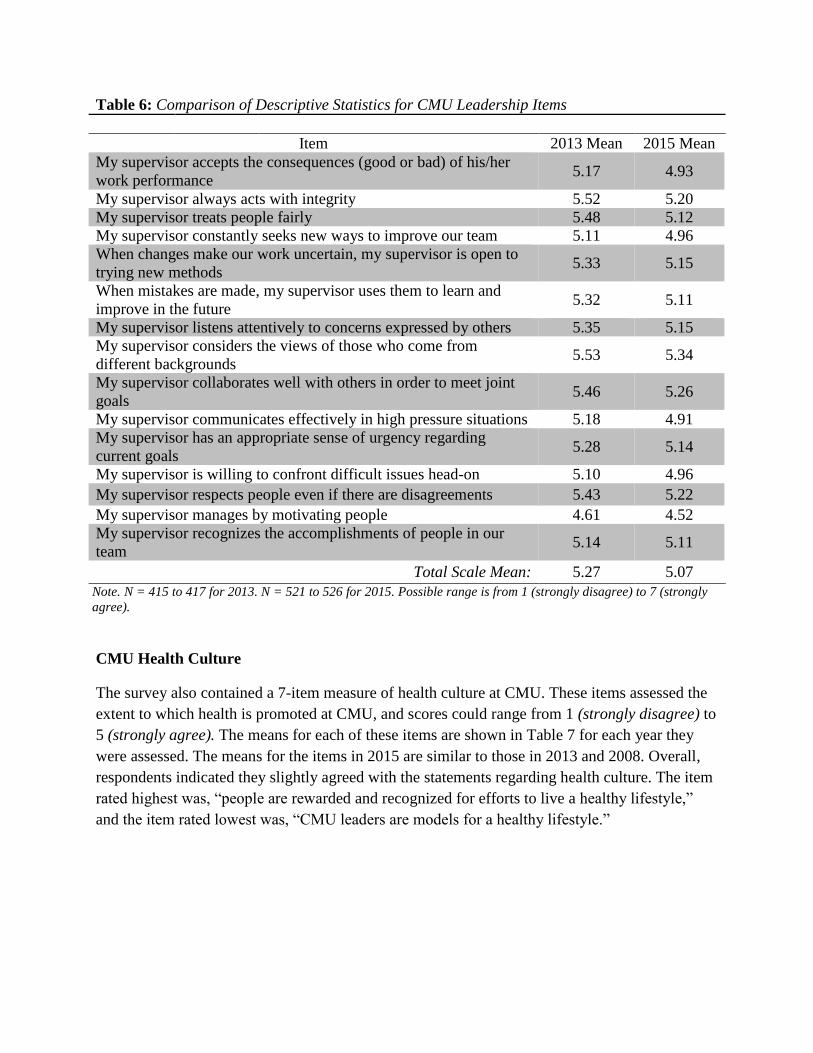
Table 6: Comparison of Descriptive Statistics for CMU Leadership Items
Item 2013 Mean 2015 Mean
My supervisor accepts the consequences (good or bad) of his/her
work performance 5.17 4.93
My supervisor always acts with integrity 5.52 5.20
My supervisor treats people fairly 5.48 5.12
My supervisor constantly seeks new ways to improve our team 5.11 4.96
When changes make our work uncertain, my supervisor is open to
trying new methods 5.33 5.15
When mistakes are made, my supervisor uses them to learn and
improve in the future 5.32 5.11
My supervisor listens attentively to concerns expressed by others 5.35 5.15
My supervisor considers the views of those who come from
different backgrounds 5.53 5.34
My supervisor collaborates well with others in order to meet joint
goals 5.46 5.26
My supervisor communicates effectively in high pressure situations 5.18 4.91
My supervisor has an appropriate sense of urgency regarding
current goals 5.28 5.14
My supervisor is willing to confront difficult issues head-on 5.10 4.96
My supervisor respects people even if there are disagreements 5.43 5.22
My supervisor manages by motivating people 4.61 4.52
My supervisor recognizes the accomplishments of people in our
team 5.14 5.11
Total Scale Mean: 5.27 5.07
Note. N = 415 to 417 for 2013. N = 521 to 526 for 2015. Possible range is from 1 (strongly disagree) to 7 (strongly
agree).
CMU Health Culture
The survey also contained a 7-item measure of health culture at CMU. These items assessed the
extent to which health is promoted at CMU, and scores could range from 1 (strongly disagree) to
5 (strongly agree). The means for each of these items are shown in Table 7 for each year they
were assessed. The means for the items in 2015 are similar to those in 2013 and 2008. Overall,
respondents indicated they slightly agreed with the statements regarding health culture. The item
rated highest was, “people are rewarded and recognized for efforts to live a healthy lifestyle,”
and the item rated lowest was, “CMU leaders are models for a healthy lifestyle.”

Table 7: Comparison of Descriptive Statistics for CMU Health Culture Items
Item 2008
Mean
2013
Mean
2015
Mean
My immediate supervisor supports my efforts to adopt healthy
lifestyle practices 3.53 3.59 3.56
People are rewarded and recognized for efforts to live a healthy
lifestyle 3.98 4.07 3.98
New employees at CMU are made aware of the university's
support for healthy lifestyles 3.51 3.77 3.77
People at CMU are taught skills needed to achieve a healthy
lifestyle 3.57 3.62 3.59
CMU demonstrates its commitment to supporting healthy
lifestyles through its resources such as time. space and money 3.58 3.63 3.60
CMU leaders are models for a healthy lifestyle 3.24 3.28 3.26
Coworkers support one another in efforts to adopt healthy
lifestyle practices 3.63 3.72 3.80
Note. N = 422 for 2008. N = 452 for 2013. N = 526 for 2015.
In addition to the 7 specific items described above assessing health culture, a single item about
implementation of an “overall health culture” was also included. This item asked, “the culture of
health at CMU can best be described as…” The means for this item, along with the total mean
for the 7 items in Table 7, are shown in Table 8 for years 2008, 2013, and 2015. There was little
change over time, but employees felt the program was generally promoted, and many felt it was
strongly promoted.
Table 8: Comparison of Descriptive Statistics for Health Culture Variables
Variable 2008 Mean 2013 Mean 2015 Mean
Health Culture Promotion (7 items) 4.74 4.70 4.61
Overall Health Culture Item 3.58 3.67 3.66 Note. N = 403 for 2006. N = 392 for 2008. N = 400 to 441 for 2013. N = 527 to 572 for 2015. Health
Promotion scored on a 1 to 6 scale. Overall Health Culture scored on a 1 to 5 scale.

Appendix A
Sources and sample sizes used to construct comparison data:
Job Satisfaction. N = 15,234 employees from large-scale study of employees in various
industries.
Turnover Intentions. N = 949 from 5 studies representing nurses, university faculty, and
municipal employees.
Emotional Exhaustion. N = 32,672 from 11 studies representing workers primarily in the
medical field (i.e., nurses, hospital staff, lab technicians, and managers) as well as social
workers, teachers, salespeople, and other professionals.
Citizenship Behavior (I). N = 2,185 from 6 studies representing employees and supervisors in
diverse industries including education (secondary and post-secondary), medicine, skilled labor,
community and social work, and sales.
Citizenship Behaviors (O). N=1,558 from 5 studies representing employees and supervisors
from various industries including education (secondary and post-secondary), medicine, skilled
labor and trade, sales, and private administration.
Organizational Commitment. N = 1,932 from 7 studies representing employees from various
industries including post-secondary education, information-technology, medicine, science and
engineering, and retail.
Work Engagement. N = 15,208 from 6 studies of employees from various sources including a
large-scale study of employees from a variety of organizations as well as nurses, military, law-
enforcement, information-technology, and employed students.
Role Conflict. N = 1,131 from 5 studies representing employees from a variety of industries,
including education, medicine (nurses and physicians), skilled labor, social work, and public
administration
Autonomy. N = 1,092 from 5 studies of individuals employed in a variety of settings including
post-secondary education and human resources.
Health Culture Promotion. N = 3,007 full time employees from a variety of large companies.
Overall Health Culture. N = 2,837 employees primarily from manufacturing, government, and
lower and higher education.