results obtained with db-8 and liulin-iss …wrmiss.org/workshops/ninth/calibration/benghin.pdf ·...
TRANSCRIPT

RESULTS OBTAINED WITH DB-8 AND LIULIN-ISS INSTRUMENTS
DURING ICCHIBAN-5 SESSION AT THE NIRS, HIMAC
V.V.Benghin1, V.M.Petrov1, V.A.Shurshakov1, V.I.Redko1, I.V.Tchernykh1, R.S.Bogdasarov1, M.I.Panasyuk2, Yu.V.Kutuzov2, A.I.Myasnikov2, Ts.Dachev3
1) State Research Center of the Russian Federation Institute for Biomedical Problems RAS, Moscow, Russia2) Nuclear Physics Institute at MSU, Moscow, Russia 3) Solar-Terrestrial Influences Laboratory BAS, Sofia, Bulgaria
WRMISS - 9 Vienna, Austria, 8-10 September 2004
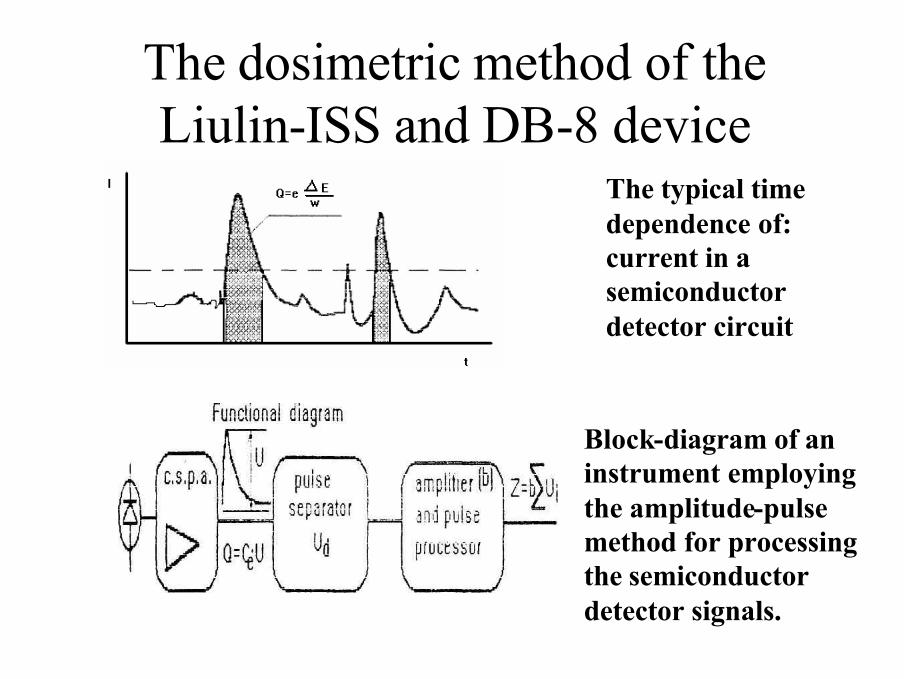
The dosimetric method of the Liulin-ISS and DB-8 device
The typical time dependence of: current in a semiconductor detector circuit
Block-diagram of an instrument employing the amplitude-pulse method for processing the semiconductor detector signals.

∑∑ ×=×××
×∆×=×
== KVKem
CUm
eq
mED i
i
ηωω
where D is the absorbed dose;E is the energy absorbed by the sensitive volumem is the sensitive volume mass;ωi is the NP pair formation energy;e is the electron’s chargeq is the electric charge generated in the detector
sensitive volume;K is the analog-digital converter output signal;? is the input capacitance of the detector-
preamplifier system;η overall multiplication factor of signal before
the ADC;∆U is the quantization step of the ADC;

The Experiment Schedule
• February 16, 2004 - Liulin-ISS jointly with Liulin-4 experiment carried out by Dr. Uchihori.
• February 17, 2004 - DB-8 jointly with Liulin-ISS.

MDU of Liulin-ISS deviceDetector side
Liulin–ISS device was designed in Solar-Terr. Influence Laboratory – BAS, Sofia Bulgaria. The device consists of 4 Mobile Dosimetry Units (MDU) and one Control and Interface Unit. MDU is a miniature spectrometer-dosimeter containing: one semiconductor detector, charge-sensitive preamplifier, ADC, microcontrollers, flash memory and battery.

LIULIN-ISS units
WRMISS - 9 Vienna, Austria, 8-10 September 2004
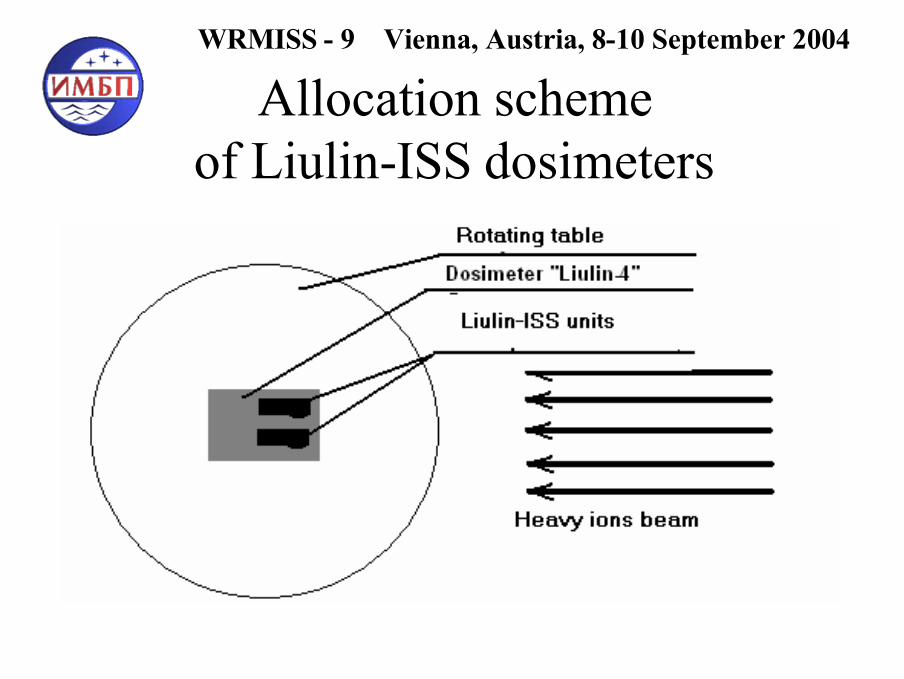
Allocation scheme of Liulin-ISS dosimeters
WRMISS - 9 Vienna, Austria, 8-10 September 2004

View of Liulin-ISS dosimeters placed together with the Liulin-4 dosimeter on the rotating table
in the experimental hall of the HIMAC accelerator
WRMISS - 9 Vienna, Austria, 8-10 September 2004
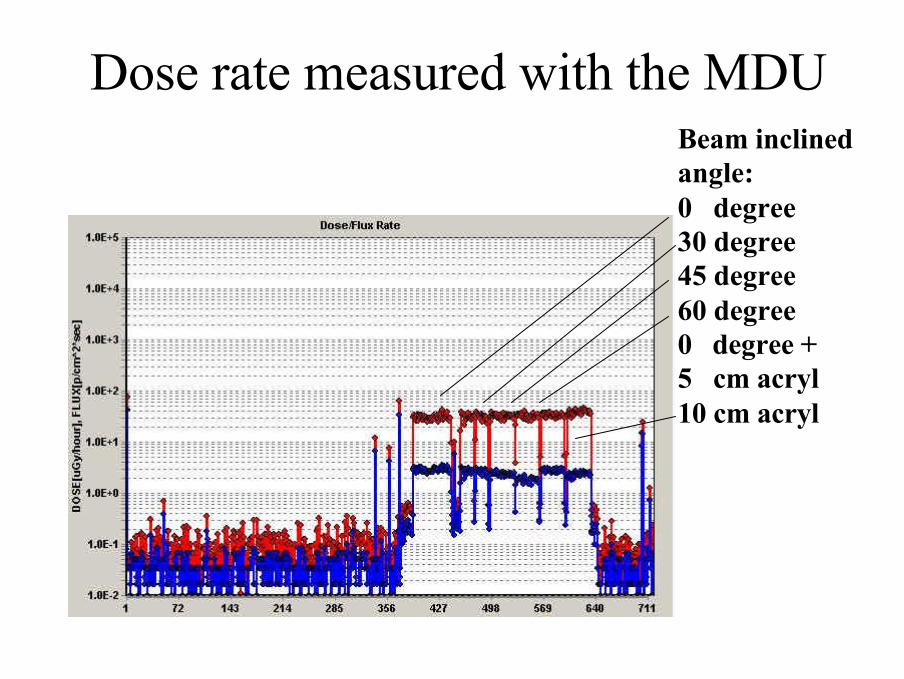
Dose rate measured with the MDUBeam inclined angle:0 degree30 degree45 degree60 degree0 degree +5 cm acryl10 cm acryl
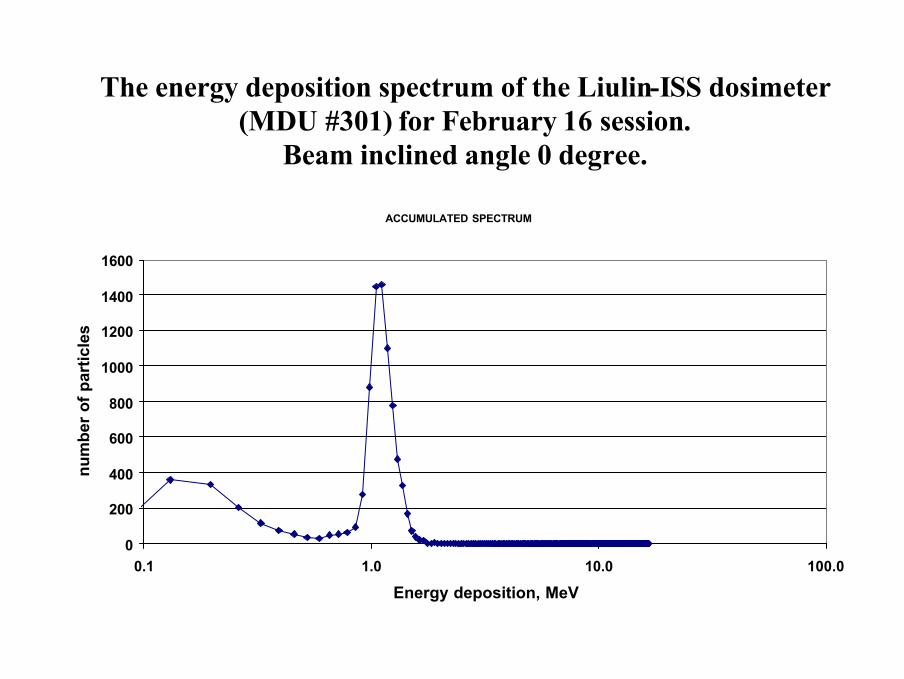
The energy deposition spectrum of the Liulin-ISS dosimeter(MDU #301) for February 16 session.
Beam inclined angle 0 degree.
ACCUMULATED SPECTRUM
0
200
400
600
800
1000
1200
1400
1600
0.1 1.0 10.0 100.0
Energy deposition, MeV
nu
mb
er o
f p
artic
les

Method of the calibration coefficient estimation using the energy deposition spectrum
Where:? - one particle average energy deposition in the detector D – one particle dose in the detector.Ns – analog-to-digital converter code value corresponding to the particle∆? – energetic equivalent of one quantum of analog-to-digital converter.dE/dX – average ionization loss of incident particles.h – thickness of the detector sensitive area.m – mass of the detector sensitive area.S –the detector sensitive area.ρ - matter density of the detector sensitive area.
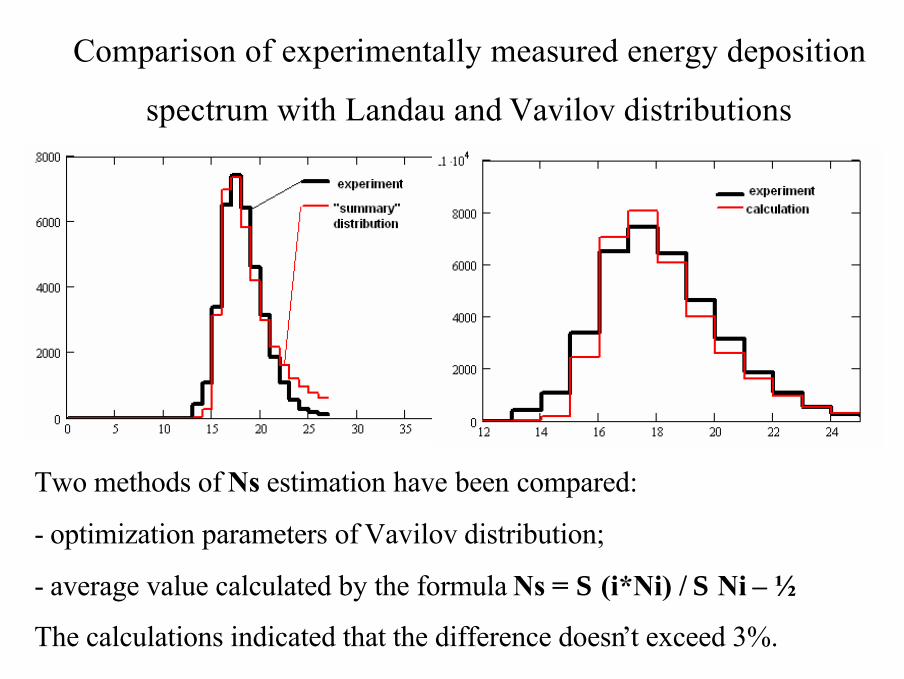
Comparison of experimentally measured energy deposition
spectrum with Landau and Vavilov distributions
Two methods of Ns estimation have been compared:
- optimization parameters of Vavilov distribution;
- average value calculated by the formula Ns = Σ (i*Ni) / Σ Ni – ½
The calculations indicated that the difference doesn’t exceed 3%.

Comparison of dose rate values calculated by Bulgarian program of the Liulin-ISS data handling and estimated by
the energy deposition spectrum
0
5
10
15
20
25
30
35
40
45
0 10 20 30 40 50 60 70
Beam inclined angle, degree
Dose
rate
, uG
y/hour
Beam conditions 0 30 45 60 5 cm Acr 10 cm AcrCalc. by Bulgarian programm 30.1 30.6 32.3 32.0 33.6 38.6 MDU
#301
Estimated by spectrum 31.3 30.7 33.4 34.7 34.6 39.9 Calc. by Bulgarian programm 30.3 30.6 30.3 32.0 34.0 38.1 MDU
# 302
Estimated by spectrum 31.1 30.2 31.6 33.9 34.6 39.9
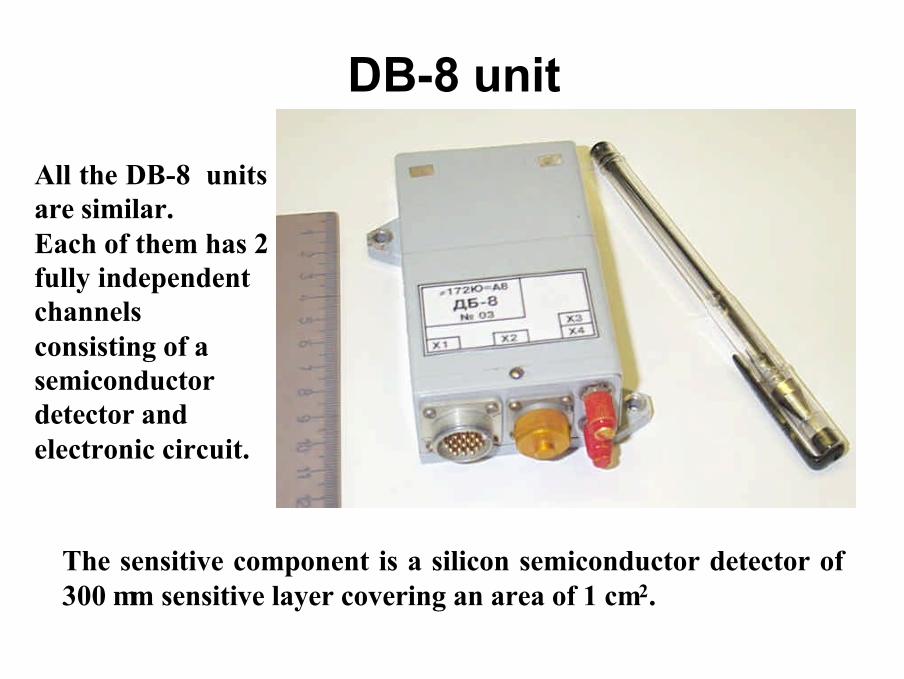
DB-8 unit
All the DB-8 units are similar. Each of them has 2 fully independent channels consisting of a semiconductor detector and electronic circuit.
The sensitive component is a silicon semiconductor detector of 300 µm sensitive layer covering an area of 1 cm2.

The DB-8 unit without coverUnshielded detectorShielded detector
The difference between the two channels is that one of the detectors has an additional lead shielding. The shielding is a sphere surrounding the detector.
The sphere wall thickness is 3 g/cm2 Pb
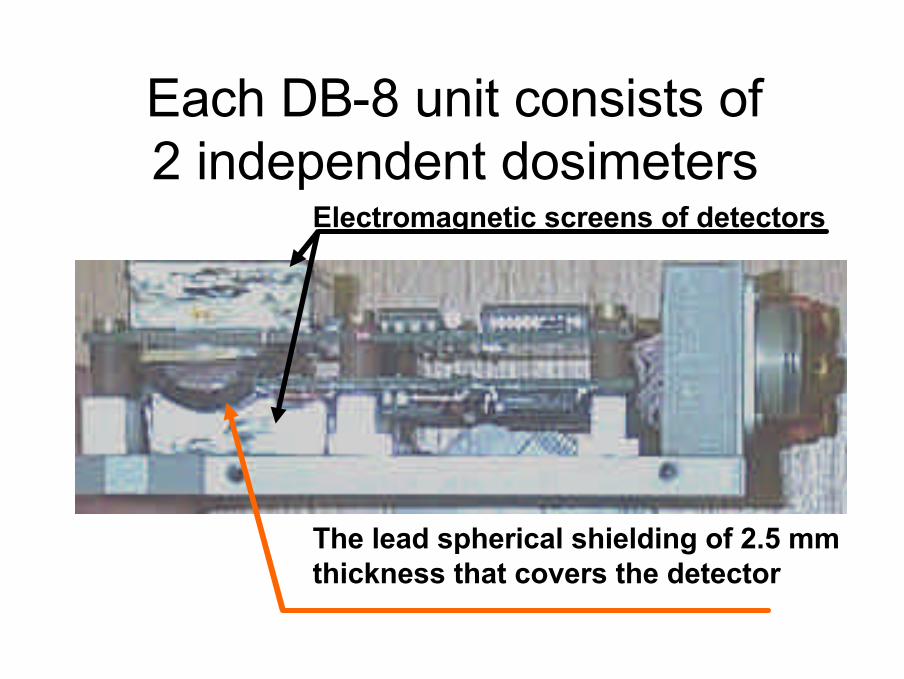
Each DB-8 unit consists of 2 independent dosimeters
Electromagnetic screens of detectors
The lead spherical shielding of 2.5 mm thickness that covers the detector

The flowchart of DB-8

If we neglect the system noise and round off errors then the absorbed dose is proportional to the sum of the ADC output signal. There are two ways to obtain the dose. The first way, output signal from the ADC is added to the total dose counter. After power-up of the RMS this 32-bit counter resets and then accumulates signals until overflow after which the cycle loops. The second way is based on summing up the number of particles in spectrum channels with respective weighting factors. This way allows increasing of the dynamical range of measurements based on the correction of the calculating errors caused by the dead time of the discriminator and ADC. Dosimetric information obtained by these two ways is presented on the next slide.

Distribution of energy bordaries for the channels of the DB-8.
0.01
0.1
1
10
100
0 5 10 15 20
Number of the channel.
Low
ene
rgy
boun
dary
of
the
chan
nel
, MeV

∑∑ =
=
•×××
−=
19
119
1
)(1 j
jj
jj
p
pnu
n
N
TNV
D τ
where D is the absorbed dose;V is calibrated factorNp is a number in the counter of particlest is a dead time of the discriminatorT is a duration of the interval of
measurementj is a number of spectrum channelnj is a number of counting in the channel juj is the weighting coefficient for the
channel j

Block-diagram of devices for DB-8 self-contained tests
WRMISS - 9 Vienna, Austria, 8-10 September 2004

The scheme of mutual location of the DB-8 unit and the Liulin-ISS dosimeters
WRMISS - 9 Vienna, Austria, 8-10 September 2004

The mutual location of the DB-8 unit and the Liulin-ISS dosimeters

Slip of peak in the Liulin-ISS energy deposition spectrum when behind the DB-8 unit
Irradiation conditions Value
on Feb 16.
Behind unshielded detector
Behind shielded detector
Ns, MDU #301 17.64 17.87 20.93 Ns, MDU #302 17.58 17.84 20.79 Estimation of relative increasing of energy deposition behind DB-8 unit.
1.014 1.18
Per cent of relative increasing of energy deposition for DB-8 detectors.
0.7 % 9 %
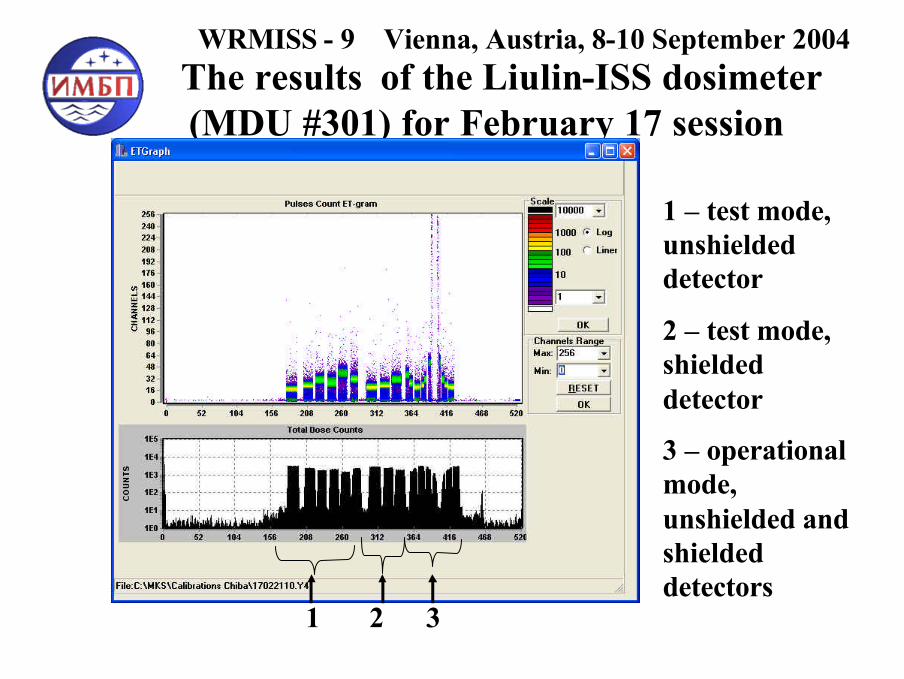
The results of the Liulin-ISS dosimeter (MDU #301) for February 17 session
WRMISS - 9 Vienna, Austria, 8-10 September 2004
1 2 3
1 – test mode, unshielded detector
2 – test mode, shielded detector
3 – operational mode, unshielded and shielded detectors

The energy deposition spectrum of the DB-8 unshielded detector for February 17 session.
Beam inclined angle 0 and 60 degree.
WRMISS - 9 Vienna, Austria, 8-10 September 2004
0
500
1000
1500
2000
2500
3000
3500
4000
4500
0.01 0.10 1.00 10.00 100.00Energy, MeV
Nu
mb
er o
f p
uls
es in
ch
ann
el Angle 0 degree
Angle 60 degree
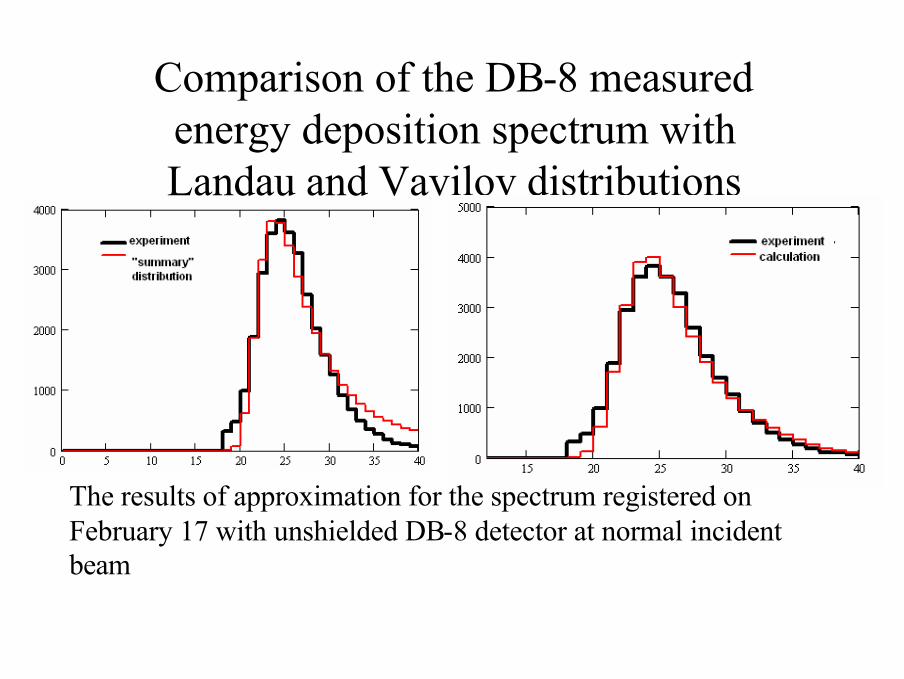
Comparison of the DB-8 measured energy deposition spectrum with Landau and Vavilov distributions
The results of approximation for the spectrum registered on February 17 with unshielded DB-8 detector at normal incident beam

Dose rate versus beam inclined angle. DB-8 test mode
WRMISS - 9 Vienna, Austria, 8-10 September 2004
0100200300400500600700800900
1000
-60 -30 0 30 60
Beam inclined angle, degree
Do
se r
ate,
uG
r/h
ou
r
Unshielded detectorShielded detector

Dose rate versus beam inclined angle.
DB-8 operational mode, unshielded detector
WRMISS - 9 Vienna, Austria, 8-10 September 2004
0
100
200
300
400
500
600
700
800
900
-90 -60 -30 0 30 60 90 120 150 180Beam inclined angle, degree
Dos
e ra
te, u
Gy/
hour
Dosa counter
Calc. By spectrum
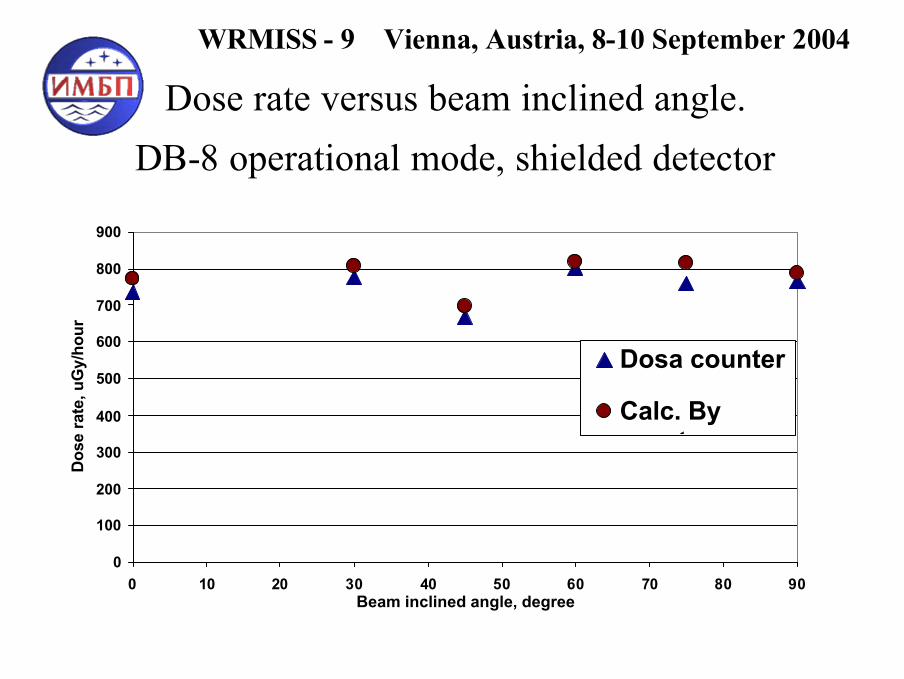
Dose rate versus beam inclined angle.
DB-8 operational mode, shielded detector
WRMISS - 9 Vienna, Austria, 8-10 September 2004
0
100
200
300
400
500
600
700
800
900
0 10 20 30 40 50 60 70 80 90Beam inclined angle, degree
Dos
e ra
te, u
Gy/
hour
Dosa counter
Calc. Byspectrum

Energy deposition spectrum. DB-8 operational mode. Unshielded detector. Beam inclined angle 0 degree.
0
10000
20000
30000
40000
50000
60000
0.01 0.10 1.00 10.00 100.00
Energy deposition, MeV
Nu
mb
er o
f p
arti
cles
per
MeV

Energy deposition spectrum. DB-8 operational mode. Unshielded detector. Beam inclined angle 45 degree.
0
5000
10000
15000
20000
25000
0.01 0.10 1.00 10.00 100.00
Energy deposition, MeV
Nu
mb
er o
f p
arti
cles
per
MeV

Energy deposition spectrum. DB-8 operational mode. Unshielded detector. Beam inclined angle 60 degree.
0
1000
2000
3000
4000
5000
6000
7000
8000
0.01 0.10 1.00 10.00 100.00
Energy deposition, MeV
Nu
mb
er o
f p
arti
cles
per
MeV

Energy deposition spectrum. DB-8 operational mode. Unshielded detector. Beam inclined angle 75 degree.
0
500
1000
1500
2000
2500
3000
3500
4000
4500
5000
0.01 0.10 1.00 10.00 100.00
Energy deposition, MeV
Nu
mb
er o
f p
arti
cles
per
MeV

Energy deposition spectrum. DB-8 operational mode. Unshielded detector. Beam inclined angle 90 degree.
0
500
1000
1500
2000
2500
3000
3500
4000
0.01 0.10 1.00 10.00 100.00
Energy deposition, MeV
Nu
mb
er o
f p
arti
cles
per
MeV

Energy deposition spectrum. DB-8 operational mode. Unshielded detector. Beam inclined angle 135 degree.
0
2000
4000
6000
8000
10000
12000
14000
16000
18000
20000
0.01 0.10 1.00 10.00 100.00
Energy deposition, MeV
Nu
mb
er o
f p
arti
cles
per
MeV

Energy deposition spectrum. DB-8 operational mode. Unshielded detector. Beam inclined angle 180 degree.
0
5000
10000
15000
20000
25000
30000
35000
40000
45000
0.01 0.10 1.00 10.00 100.00
Energy deposition, MeV
Nu
mb
er o
f p
arti
cles
per
MeV

Conclusion• The ICCHIBAN-5 studies with DB-8 and Liulin-ISS
silicon detector instruments were carried out in the 150 MeV helium ion beam in February 2004.
• The data analysis shows:- dose rate and flux data measured with the DB-8 and Liulin-ISS are different one from the other not more than 15 – 20%.- No significant difference was noted between the dose rate registered with the DB-8 device in the testing and operational modes.- No significant dose rate changing was noted at different beam inclined angles. It indicates that, in this case, the detector dose sensitivity is close to isotropic.
• The above results approve the possibility to use the LIULIN-ISS and DB-8 instruments for space radiation dosimetry applications.

AcknowledgementWRMISS - 9 Vienna, Austria, 8-10 September 2004
This experiment was performed as a part of the ICCHIBAN research project using Heavy ions at the NIRS HIMAC. The authors would like to gratefully acknowledge the NIRS, the HIMAC facility operation group for this research opportunity.
The authors would like to gratefully acknowledge personally Dr. K. Fujitaka and Dr. Yu. Uchihory for their support of our participation and grand hospitality.