results-framework document (rfd) 2011-12 · 2016-06-30 · for cold chain development (nccd) in ppp...
TRANSCRIPT
Department of Agriculture and Cooperation | RFD for 2011-12 1
Results-Framework Document (RFD) 2011-12
(Period: From April 1, 2011 – March 31, 2012)
Department of Agriculture & Cooperation
Part – I
Section 1 : Department’s vision, mission, objectives, and functions
1. Vision
To enhance productivity and production of agricultural commodities to ensure the food security of the nation
and also to make agriculture a sustainable and viable vocation for livelihood support by 2020.
2. Mission
To achieve targetted growth rate for agriculture sector with the help of various State Governments and other
Departments concerned in the Government of India by enhancing agriculture production and improving income level
of all farmers by successful implementation of various new initiatives and agriculture schemes such as National Food
Security Mission, Rashtriya Krishi Vikas Yojana, Macro Management of Agriculture, Integrated Scheme on Oilseeds
Pulses Oilpalm and Maize (ISOPOM), Extension Reforms etc.
3. OBJECTIVES

Department of Agriculture and Cooperation | RFD for 2011-12 2
1. Increasing Crop production and Productivity thereby ensuring food security and enhanced income level to farmers
2. Incentivizing states to enhance public investment in Agriculture & allied sectors to sustain and maintain capital
formation and agriculture infrastructure
3. Diversification in Agriculture for increased income generation
4. Ensuring supply of agricultural inputs for enhanced production and productivity
5. Plant Protection, Quarantine and Residue Management
6. Dissemination of technology / information to farmers
7. Enhancing Soil health and promotion of resource conservation technology for sustainable agriculture
8. Improving credit flow, market infrastructure, empowerment of cooperatives and risk mitigation
9. Maintaining Agricultural statistics to aid policy development
10. Drought Preparedness and Grant of relief under State Disaster Response Fund (SDRF) /National Disaster
Response Fund (NDRF)
4 FUNCTIONS
1. Endeavoring for adequate and timely supply of inputs and services such as agricultural credit, fertilizers,
pesticides, seeds and implements to farmers
2. Administering the National Agriculture Insurance Scheme (NAIS) to provide relief to farmers in the event of crop
failure
3. Laying down Minimum Support Prices (MSPs) for select key agricultural commodities to ensure food security in
India and remunerative prices for farmers.
Department of Agriculture and Cooperation | RFD for 2011-12 3
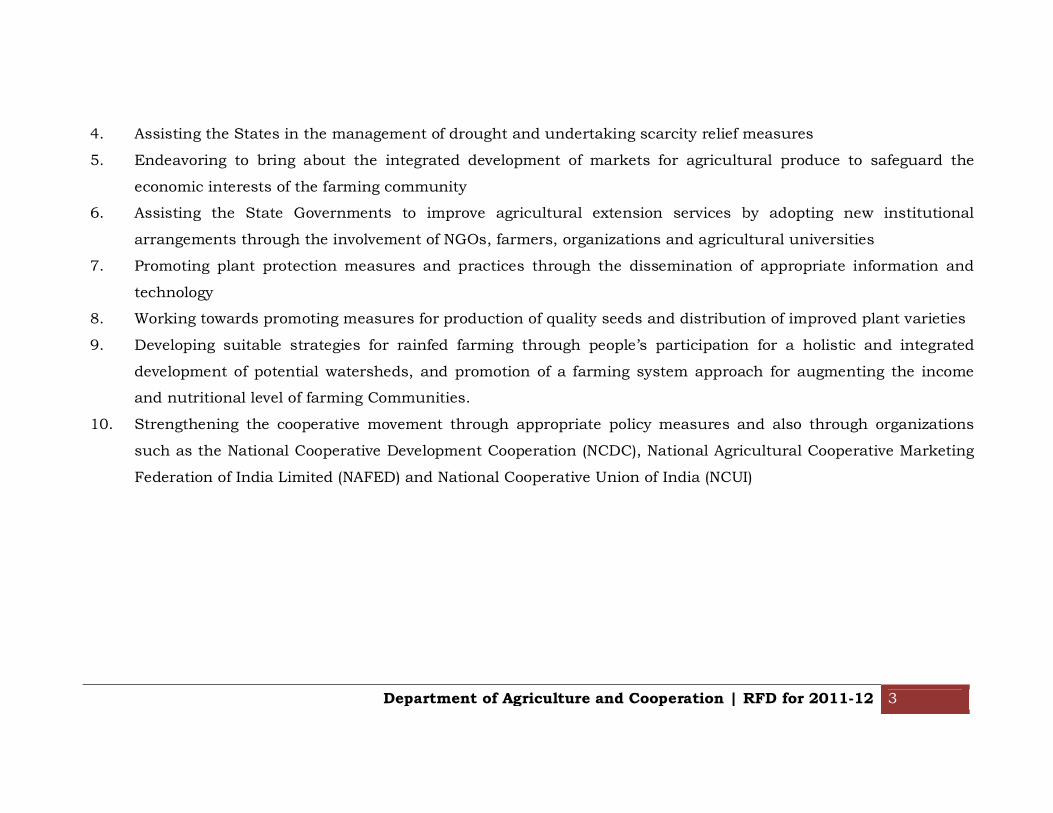
4. Assisting the States in the management of drought and undertaking scarcity relief measures
5. Endeavoring to bring about the integrated development of markets for agricultural produce to safeguard the
economic interests of the farming community
6. Assisting the State Governments to improve agricultural extension services by adopting new institutional
arrangements through the involvement of NGOs, farmers, organizations and agricultural universities
7. Promoting plant protection measures and practices through the dissemination of appropriate information and
technology
8. Working towards promoting measures for production of quality seeds and distribution of improved plant varieties
9. Developing suitable strategies for rainfed farming through people’s participation for a holistic and integrated
development of potential watersheds, and promotion of a farming system approach for augmenting the income
and nutritional level of farming Communities.
10. Strengthening the cooperative movement through appropriate policy measures and also through organizations
such as the National Cooperative Development Cooperation (NCDC), National Agricultural Cooperative Marketing
Federation of India Limited (NAFED) and National Cooperative Union of India (NCUI)
Department of Agriculture and Cooperation | RFD for 2011-12 4
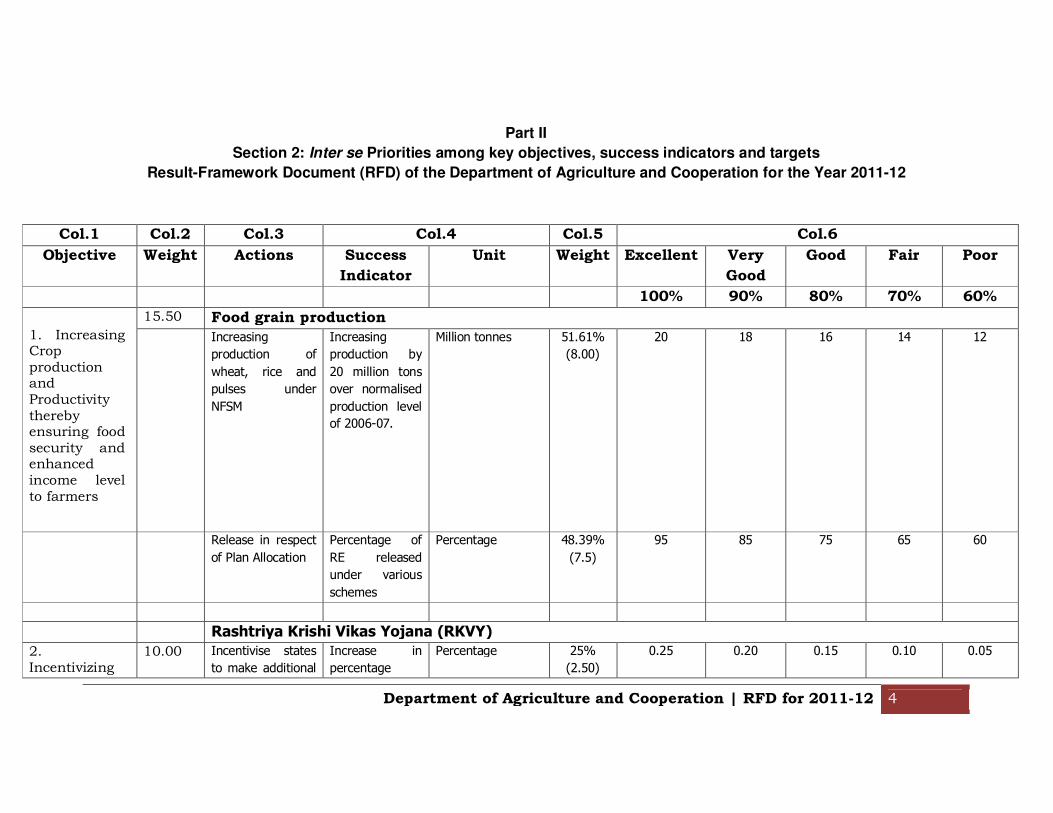
Part II
Section 2: Inter se Priorities among key objectives, success indicators and targets
Result-Framework Document (RFD) of the Department of Agriculture and Cooperation for the Year 2011-12
Col.1 Col.2 Col.3 Col.4 Col.5 Col.6
Objective Weight Actions Success
Indicator
Unit Weight Excellent Very
Good
Good Fair Poor
100% 90% 80% 70% 60%
1. Increasing Crop production and Productivity thereby ensuring food security and enhanced income level to farmers
15.50 Food grain production
Increasing
production of
wheat, rice and
pulses under
NFSM
Increasing
production by
20 million tons
over normalised
production level
of 2006-07.
Million tonnes 51.61%
(8.00)
20 18 16 14 12
Release in respect
of Plan Allocation
Percentage of
RE released
under various
schemes
Percentage 48.39%
(7.5)
95 85 75 65 60
Rashtriya Krishi Vikas Yojana (RKVY)
2. Incentivizing
10.00 Incentivise states
to make additional
Increase in
percentage
Percentage 25%
(2.50)
0.25 0.20 0.15 0.10 0.05

Department of Agriculture and Cooperation | RFD for 2011-12 5
states to enhance public investment in Agriculture & allied sectors to sustain and maintain capital formation and agriculture infrastructure
allocation in
Agriculture &
Allied sectors
points of States'
Plan
expenditure in
Agriculture and
allied sectors as
per Point No. 3
of Annexure-II
of RKVY
Guidelines
Monitoring
performance of
States: completion
of project data
entries in RKVY
Database &
Information System
(RDIMS)
Performance of
66.67% of States
reviewed at the
Centre and
33.33% by visits
to the states.
Continued
updating of
RKVY stream 1
Projects data from
inception to
current status in
the databases
from States.
Weight of 3 will
be split in the
ratio 1:1:1 for
monitoring at
Central & State
levels & RDIMS
Number 30%
(3.00)
26 23 20 18 16
Department of Agriculture and Cooperation | RFD for 2011-12 6
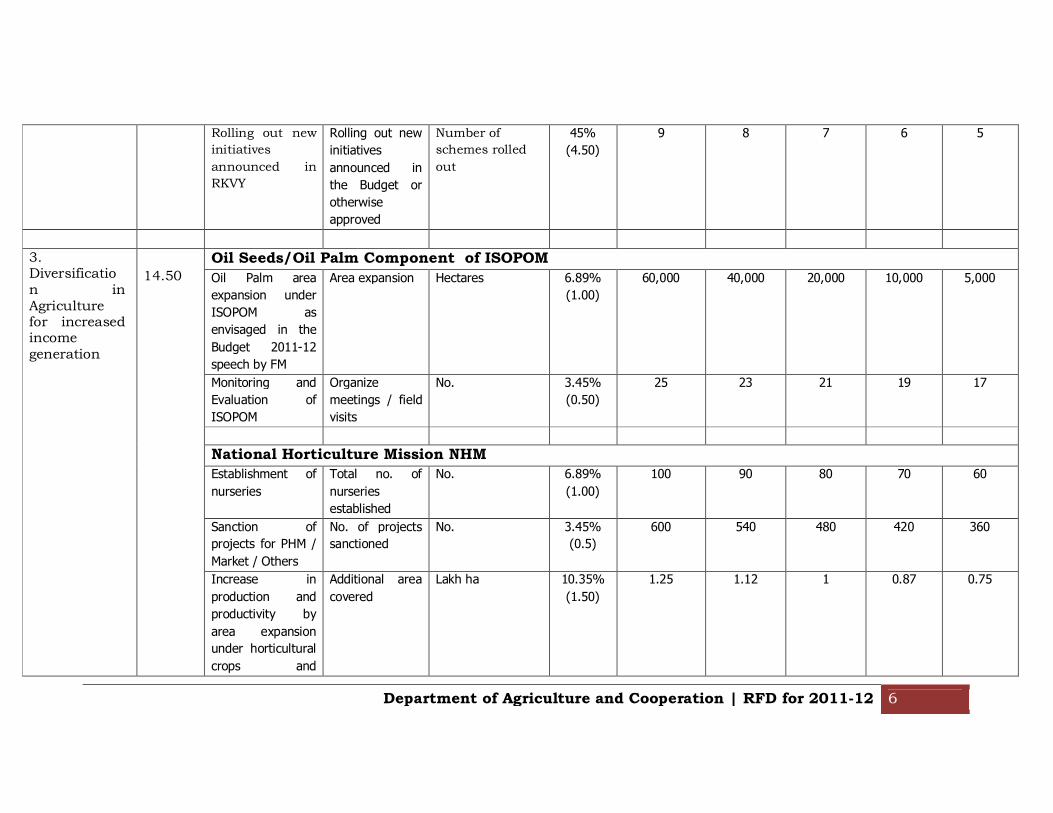
Rolling out new
initiatives
announced in
RKVY
Rolling out new
initiatives
announced in
the Budget or
otherwise
approved
Number of
schemes rolled
out
45%
(4.50)
9 8 7 6 5
3. Diversification in Agriculture for increased income generation
14.50
Oil Seeds/Oil Palm Component of ISOPOM
Oil Palm area
expansion under
ISOPOM as
envisaged in the
Budget 2011-12
speech by FM
Area expansion Hectares 6.89%
(1.00)
60,000 40,000 20,000 10,000 5,000
Monitoring and
Evaluation of
ISOPOM
Organize
meetings / field
visits
No. 3.45%
(0.50)
25 23 21 19 17
National Horticulture Mission NHM
Establishment of
nurseries
Total no. of
nurseries
established
No. 6.89%
(1.00)
100 90 80 70 60
Sanction of
projects for PHM /
Market / Others
No. of projects
sanctioned
No. 3.45%
(0.5)
600 540 480 420 360
Increase in
production and
productivity by
area expansion
under horticultural
crops and
Additional area
covered
Lakh ha 10.35%
(1.50)
1.25 1.12 1 0.87 0.75
Department of Agriculture and Cooperation | RFD for 2011-12 7
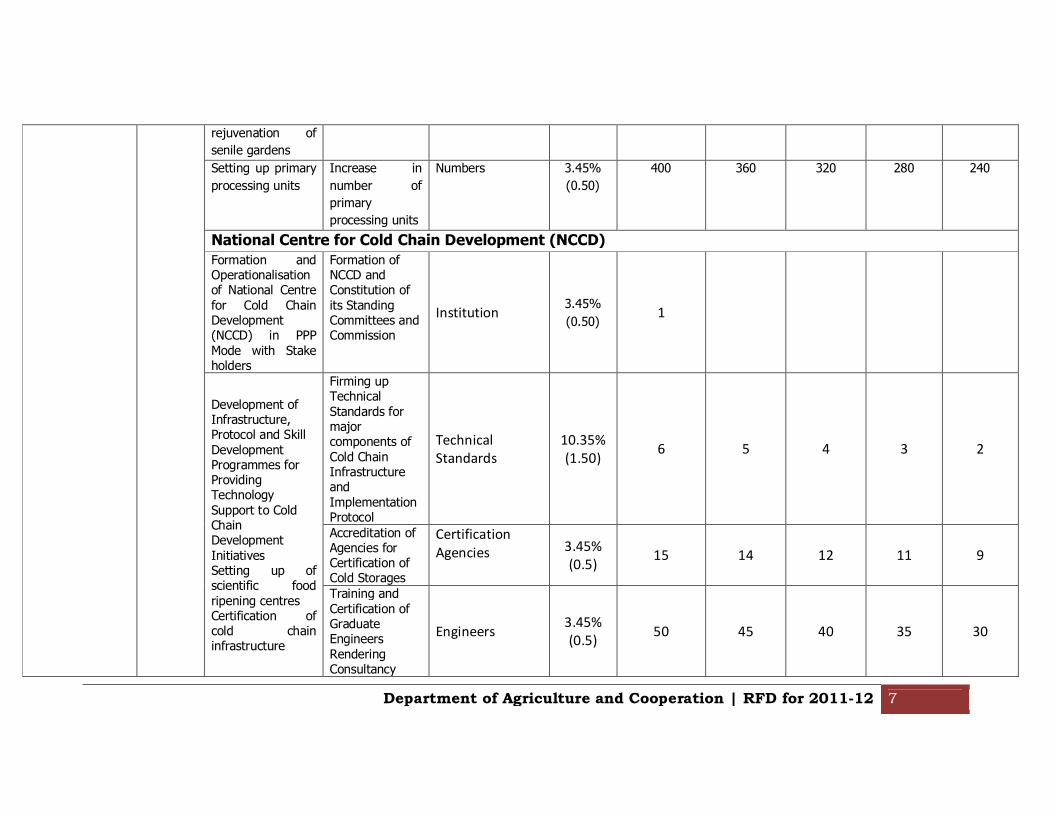
rejuvenation of
senile gardens
Setting up primary
processing units
Increase in
number of
primary
processing units
Numbers 3.45%
(0.50)
400 360 320 280 240
National Centre for Cold Chain Development (NCCD)
Formation and Operationalisation of National Centre
for Cold Chain Development (NCCD) in PPP
Mode with Stake holders
Formation of NCCD and Constitution of
its Standing Committees and Commission
Institution 3.45%
(0.50) 1
Development of Infrastructure, Protocol and Skill
Development Programmes for Providing Technology
Support to Cold Chain Development
Initiatives Setting up of scientific food
ripening centres Certification of cold chain infrastructure
Firming up Technical
Standards for major components of
Cold Chain Infrastructure and
Implementation Protocol
Technical
Standards
10.35%
(1.50) 6 5 4 3 2
Accreditation of Agencies for Certification of Cold Storages
Certification
Agencies 3.45%
(0.5) 15 14 12 11 9
Training and
Certification of Graduate Engineers
Rendering Consultancy
Engineers 3.45%
(0.5) 50 45 40 35 30
Department of Agriculture and Cooperation | RFD for 2011-12 8
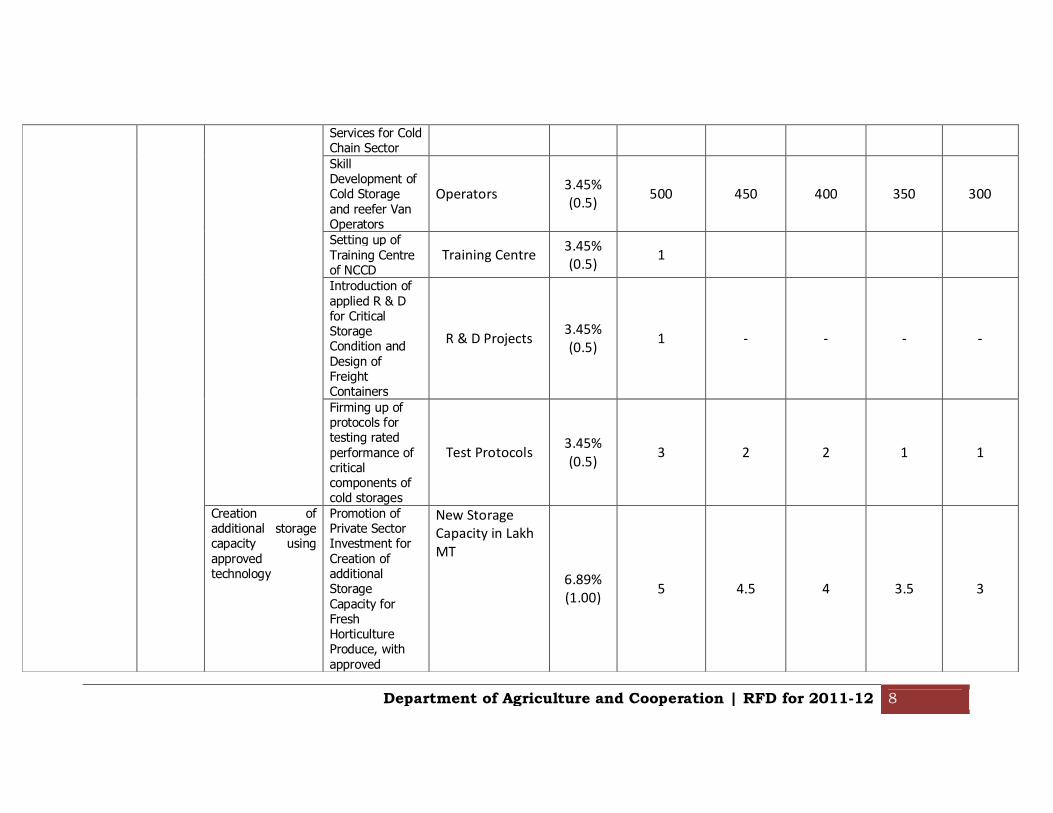
Services for Cold Chain Sector
Skill Development of Cold Storage
and reefer Van Operators
Operators 3.45%
(0.5) 500 450 400 350 300
Setting up of
Training Centre of NCCD
Training Centre 3.45%
(0.5) 1
Introduction of
applied R & D for Critical Storage Condition and
Design of Freight Containers
R & D Projects 3.45%
(0.5) 1 - - - -
Firming up of protocols for testing rated
performance of critical components of cold storages
Test Protocols 3.45%
(0.5) 3 2 2 1 1
Creation of additional storage capacity using
approved technology
Promotion of Private Sector Investment for
Creation of additional Storage
Capacity for Fresh Horticulture Produce, with
approved
New Storage
Capacity in Lakh
MT
6.89%
(1.00) 5 4.5 4 3.5 3
Department of Agriculture and Cooperation | RFD for 2011-12 9
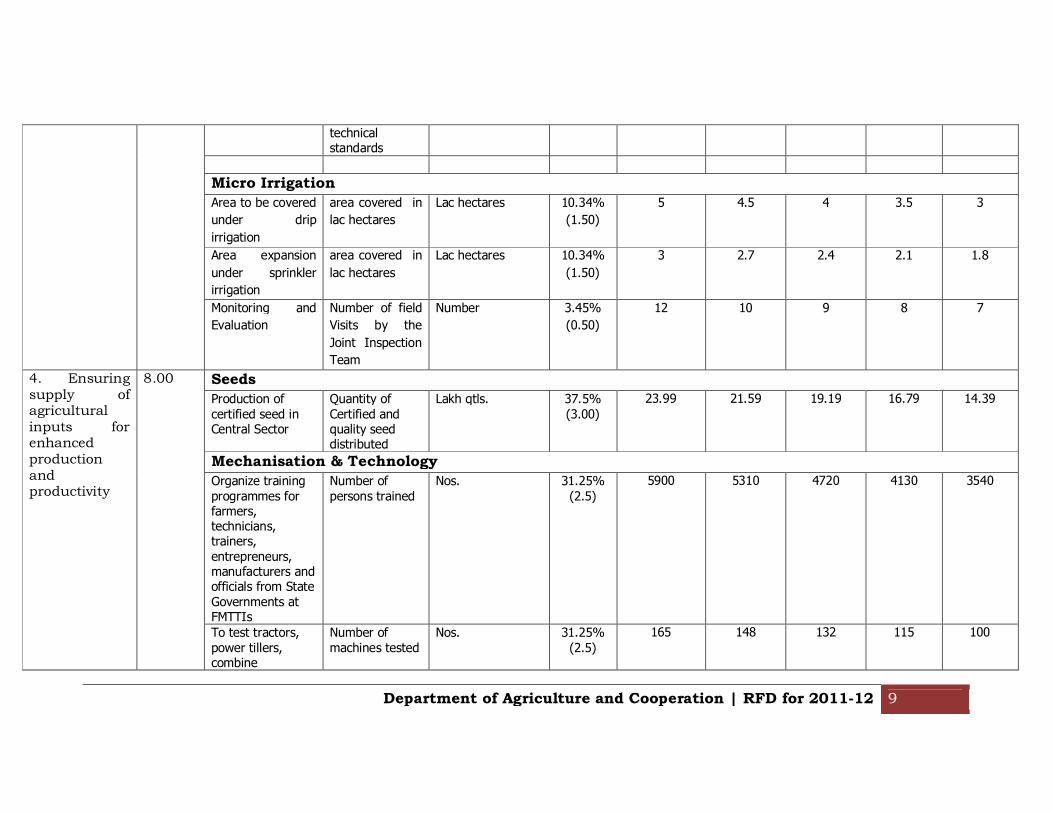
technical standards
Micro Irrigation
Area to be covered
under drip
irrigation
area covered in
lac hectares
Lac hectares 10.34%
(1.50)
5 4.5 4 3.5 3
Area expansion
under sprinkler
irrigation
area covered in
lac hectares
Lac hectares 10.34%
(1.50)
3 2.7 2.4 2.1 1.8
Monitoring and
Evaluation
Number of field
Visits by the
Joint Inspection
Team
Number 3.45%
(0.50)
12 10 9 8 7
4. Ensuring supply of agricultural inputs for enhanced production and productivity
8.00 Seeds
Production of
certified seed in Central Sector
Quantity of
Certified and quality seed distributed
Lakh qtls. 37.5%
(3.00)
23.99 21.59 19.19 16.79 14.39
Mechanisation & Technology
Organize training
programmes for farmers, technicians, trainers,
entrepreneurs, manufacturers and officials from State
Governments at FMTTIs
Number of
persons trained
Nos. 31.25%
(2.5)
5900 5310 4720 4130 3540
To test tractors,
power tillers, combine
Number of
machines tested
Nos. 31.25%
(2.5)
165 148 132 115 100
Department of Agriculture and Cooperation | RFD for 2011-12 10
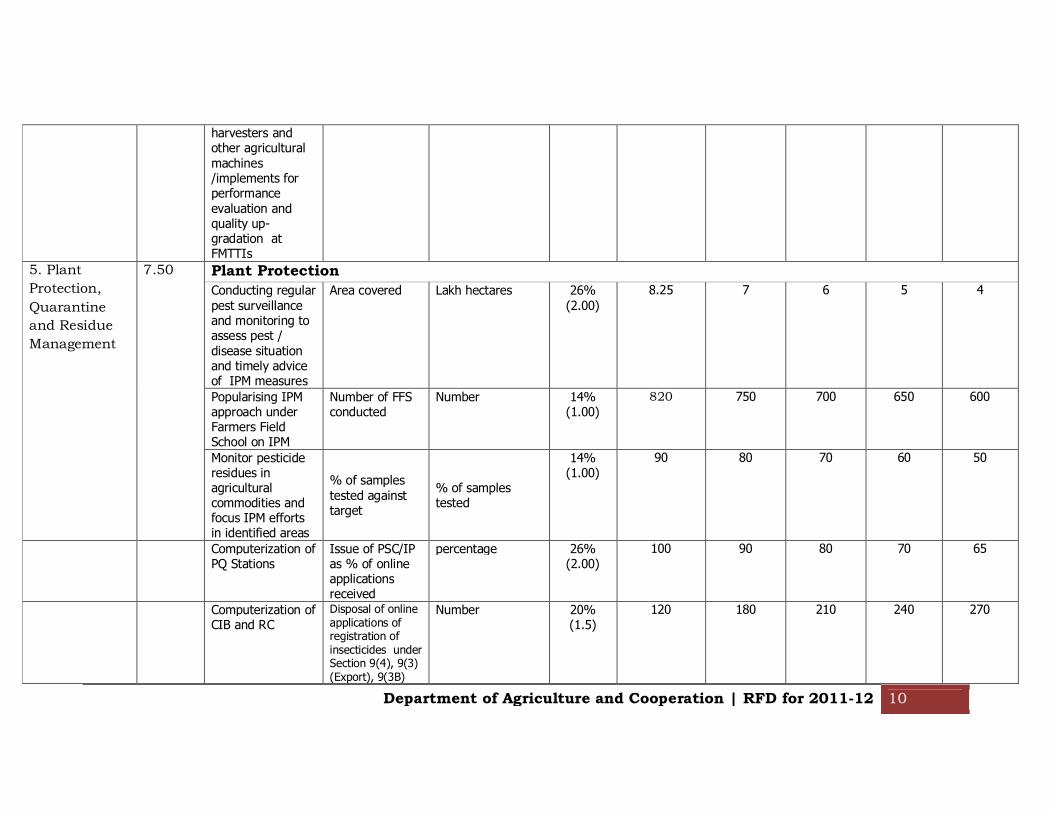
harvesters and other agricultural
machines /implements for performance
evaluation and quality up-gradation at FMTTIs
5. Plant
Protection,
Quarantine
and Residue
Management
7.50 Plant Protection
Conducting regular
pest surveillance and monitoring to assess pest /
disease situation and timely advice of IPM measures
Area covered Lakh hectares 26%
(2.00)
8.25 7 6 5 4
Popularising IPM approach under Farmers Field School on IPM
Number of FFS conducted
Number 14% (1.00)
820 750 700 650 600
Monitor pesticide residues in agricultural commodities and focus IPM efforts in identified areas
% of samples
tested against target
% of samples tested
14% (1.00)
90 80 70 60 50
Computerization of PQ Stations
Issue of PSC/IP as % of online applications received
percentage 26% (2.00)
100 90 80 70 65
Computerization of CIB and RC
Disposal of online applications of registration of insecticides under Section 9(4), 9(3) (Export), 9(3B)
Number 20% (1.5)
120 180 210 240 270
Department of Agriculture and Cooperation | RFD for 2011-12 11
(Biopesticides)
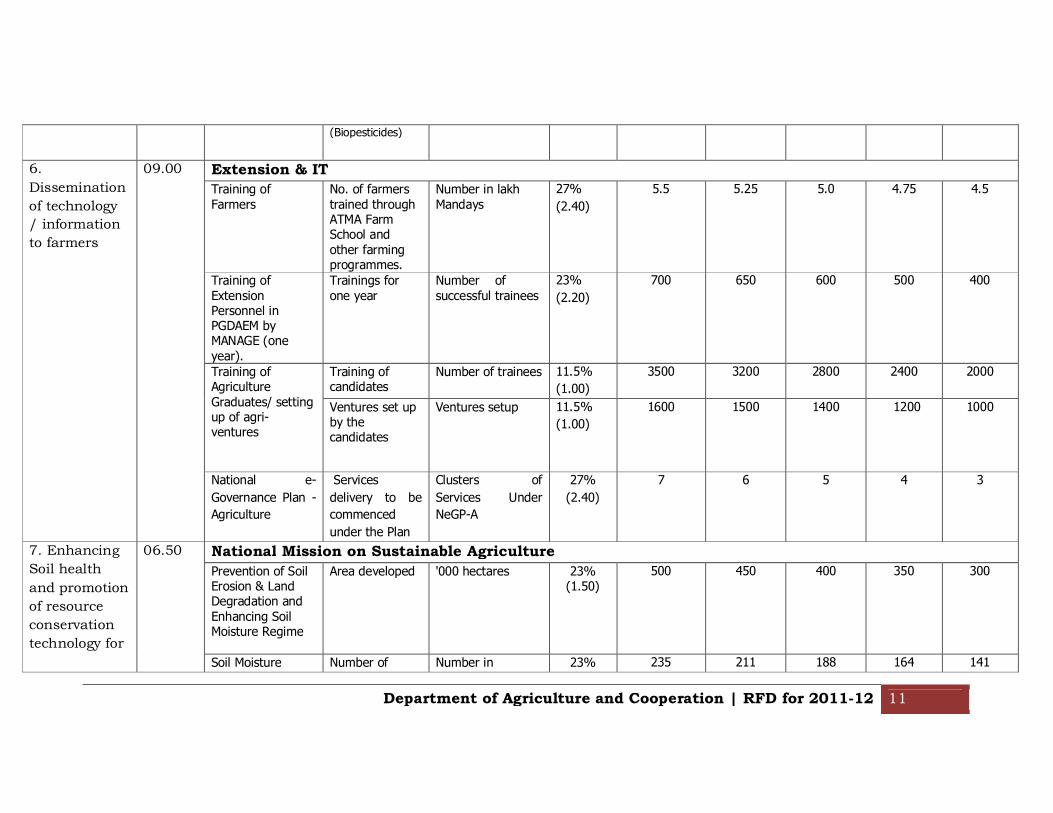
6.
Dissemination
of technology
/ information
to farmers
09.00 Extension & IT
Training of
Farmers
No. of farmers
trained through ATMA Farm School and
other farming programmes.
Number in lakh
Mandays
27%
(2.40)
5.5 5.25 5.0 4.75 4.5
Training of
Extension Personnel in PGDAEM by MANAGE (one
year).
Trainings for
one year
Number of
successful trainees
23%
(2.20)
700 650 600 500 400
Training of Agriculture
Graduates/ setting up of agri-ventures
Training of candidates
Number of trainees 11.5%
(1.00) 3500 3200 2800 2400 2000
Ventures set up by the candidates
Ventures setup 11.5%
(1.00) 1600 1500 1400 1200 1000
National e-
Governance Plan -
Agriculture
Services
delivery to be
commenced
under the Plan
Clusters of
Services Under
NeGP-A
27%
(2.40)
7 6 5 4 3
7. Enhancing
Soil health
and promotion
of resource
conservation
technology for
06.50 National Mission on Sustainable Agriculture
Prevention of Soil Erosion & Land Degradation and
Enhancing Soil Moisture Regime
Area developed '000 hectares 23% (1.50)
500 450 400 350 300
Soil Moisture Number of Number in 23% 235 211 188 164 141
Department of Agriculture and Cooperation | RFD for 2011-12 12
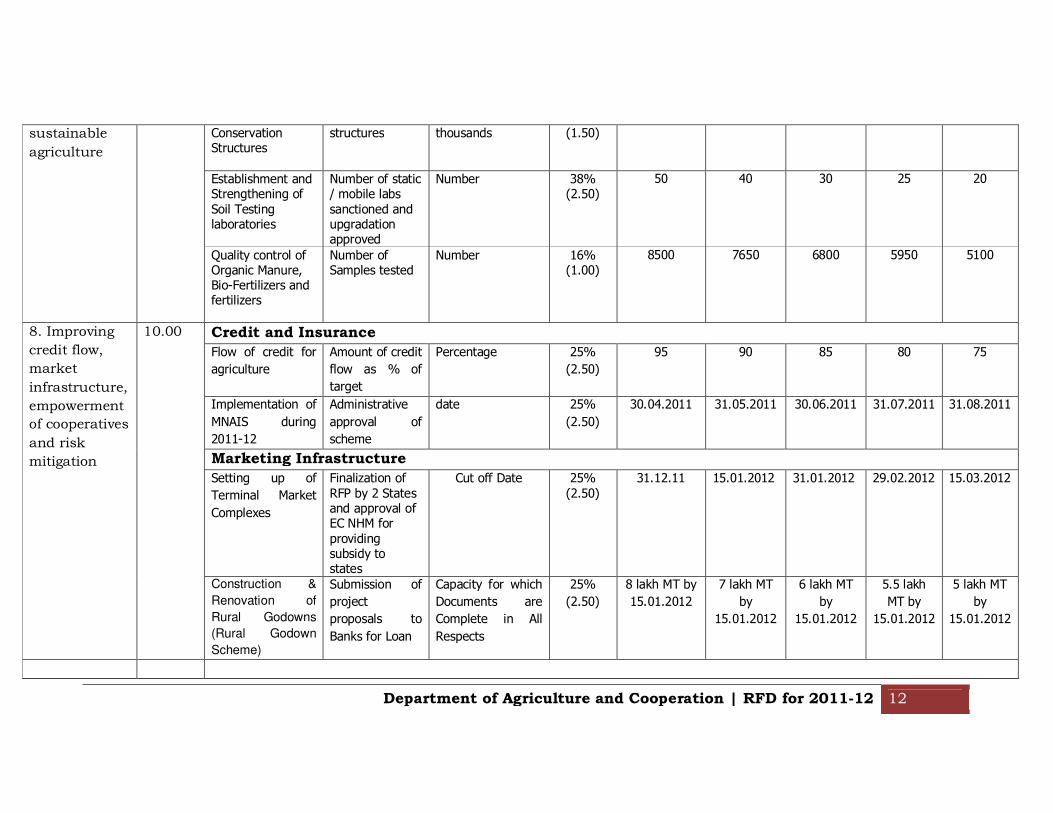
sustainable
agriculture
Conservation Structures
structures thousands (1.50)
Establishment and Strengthening of
Soil Testing laboratories
Number of static / mobile labs
sanctioned and upgradation approved
Number 38% (2.50)
50 40 30 25 20
Quality control of Organic Manure, Bio-Fertilizers and fertilizers
Number of Samples tested
Number 16% (1.00)
8500 7650 6800 5950 5100
8. Improving
credit flow,
market
infrastructure,
empowerment
of cooperatives
and risk
mitigation
10.00
Credit and Insurance
Flow of credit for
agriculture
Amount of credit
flow as % of
target
Percentage 25%
(2.50)
95 90 85 80 75
Implementation of
MNAIS during
2011-12
Administrative
approval of
scheme
date 25%
(2.50)
30.04.2011 31.05.2011 30.06.2011 31.07.2011 31.08.2011
Marketing Infrastructure
Setting up of
Terminal Market
Complexes
Finalization of
RFP by 2 States and approval of EC NHM for
providing subsidy to states
Cut off Date 25%
(2.50)
31.12.11 15.01.2012 31.01.2012 29.02.2012 15.03.2012
Construction &
Renovation of
Rural Godowns
(Rural Godown
Scheme)
Submission of
project
proposals to
Banks for Loan
Capacity for which
Documents are
Complete in All
Respects
25%
(2.50)
8 lakh MT by
15.01.2012
7 lakh MT
by
15.01.2012
6 lakh MT
by
15.01.2012
5.5 lakh
MT by
15.01.2012
5 lakh MT
by
15.01.2012
Department of Agriculture and Cooperation | RFD for 2011-12 13
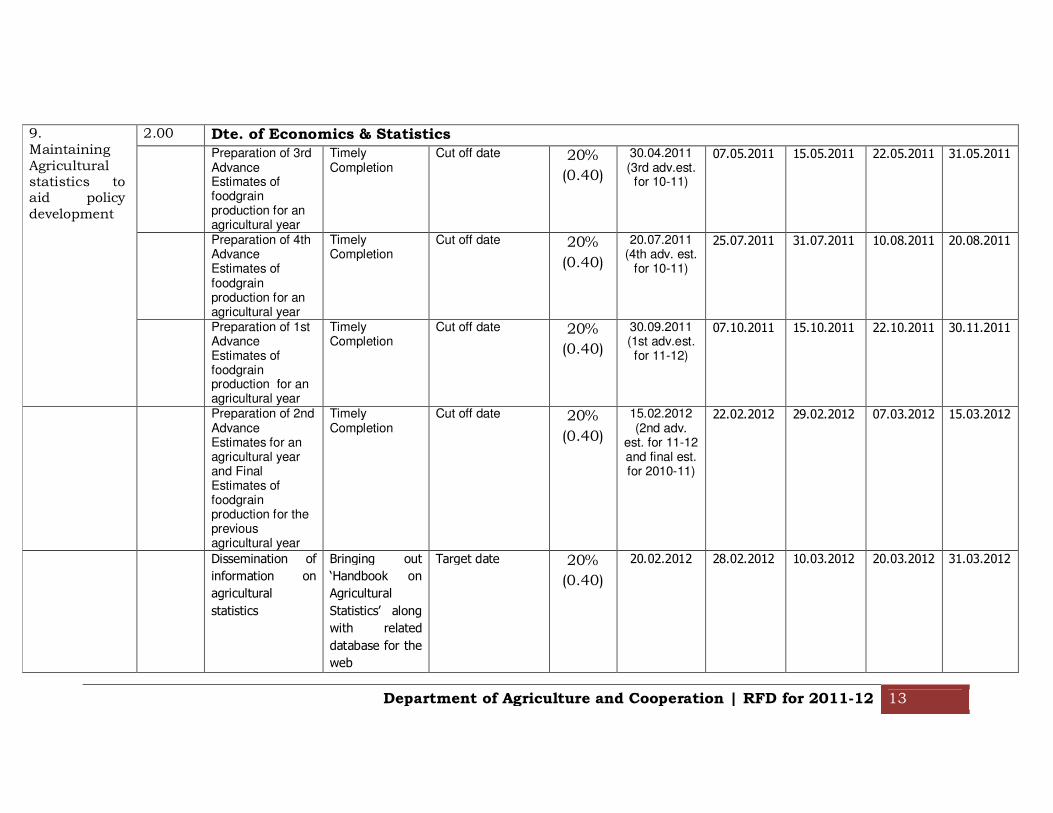
9. Maintaining Agricultural statistics to aid policy development
2.00 Dte. of Economics & Statistics
Preparation of 3rd Advance Estimates of foodgrain production for an agricultural year
Timely Completion
Cut off date 20%
(0.40)
30.04.2011 (3rd adv.est.
for 10-11)
07.05.2011 15.05.2011 22.05.2011 31.05.2011
Preparation of 4th Advance Estimates of foodgrain production for an agricultural year
Timely Completion
Cut off date 20%
(0.40)
20.07.2011 (4th adv. est.
for 10-11)
25.07.2011 31.07.2011 10.08.2011 20.08.2011
Preparation of 1st Advance Estimates of foodgrain production for an agricultural year
Timely Completion
Cut off date 20%
(0.40)
30.09.2011 (1st adv.est. for 11-12)
07.10.2011 15.10.2011 22.10.2011 30.11.2011
Preparation of 2nd Advance Estimates for an agricultural year and Final Estimates of foodgrain production for the previous agricultural year
Timely Completion
Cut off date 20%
(0.40)
15.02.2012 (2nd adv.
est. for 11-12 and final est. for 2010-11)
22.02.2012 29.02.2012 07.03.2012 15.03.2012
Dissemination of
information on
agricultural
statistics
Bringing out
‘Handbook on
Agricultural
Statistics’ along
with related
database for the
web
Target date 20%
(0.40)
20.02.2012 28.02.2012 10.03.2012 20.03.2012 31.03.2012
Department of Agriculture and Cooperation | RFD for 2011-12 14
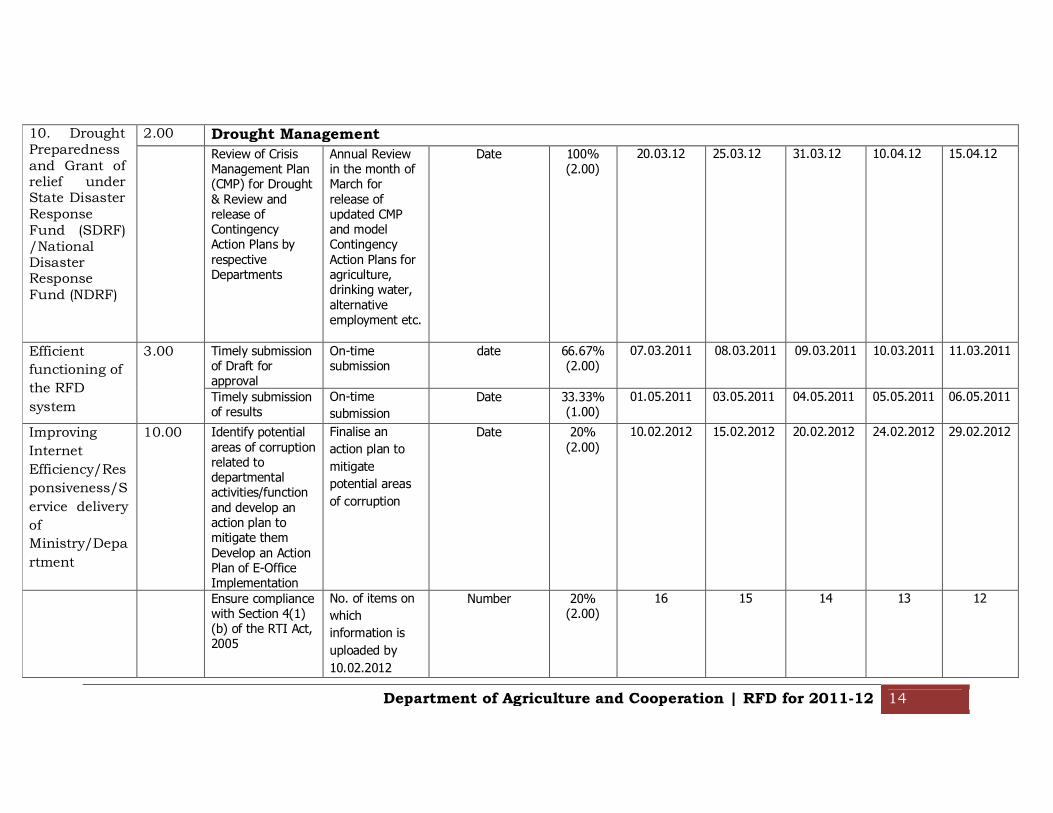
10. Drought Preparedness and Grant of relief under State Disaster Response Fund (SDRF) /National Disaster Response Fund (NDRF)
2.00 Drought Management
Review of Crisis Management Plan (CMP) for Drought
& Review and release of Contingency Action Plans by
respective Departments
Annual Review in the month of March for
release of updated CMP and model Contingency
Action Plans for agriculture, drinking water,
alternative employment etc.
Date 100% (2.00)
20.03.12 25.03.12 31.03.12 10.04.12 15.04.12
Efficient
functioning of
the RFD
system
3.00 Timely submission of Draft for approval
On-time submission
date 66.67% (2.00)
07.03.2011 08.03.2011 09.03.2011 10.03.2011 11.03.2011
Timely submission of results
On-time
submission
Date 33.33% (1.00)
01.05.2011 03.05.2011 04.05.2011 05.05.2011 06.05.2011
Improving
Internet
Efficiency/Res
ponsiveness/S
ervice delivery
of
Ministry/Depa
rtment
10.00 Identify potential
areas of corruption related to departmental activities/function
and develop an action plan to mitigate them
Develop an Action Plan of E-Office Implementation
Finalise an
action plan to
mitigate
potential areas
of corruption
Date 20%
(2.00)
10.02.2012 15.02.2012 20.02.2012 24.02.2012 29.02.2012
Ensure compliance with Section 4(1) (b) of the RTI Act, 2005
No. of items on
which
information is
uploaded by
10.02.2012
Number 20% (2.00)
16 15 14 13 12

Department of Agriculture and Cooperation | RFD for 2011-12 15
Develop an action plan to implement
ISO 9001 certification
Finalise an
action plan to
implement ISO
9001
Date 20% (2.00)
10.02.2012 15.02.2012 20.02.2012 24.02.2012 29.02.2012
Implementation of Sevottam
Resubmission of
revised draft of
Citizens / Clients
Charter
Date 20% (2.00)
15.12.2011 20.12.2011 25.12.2011 28.12.2011 31.12.2011
Independent
audit of
implementation
of Public
Grievance
Redressal
system
Percentage 20% (2.00)
100 95 90 85 80
Ensuring
compliance to
the Financial
Accountability
Framework
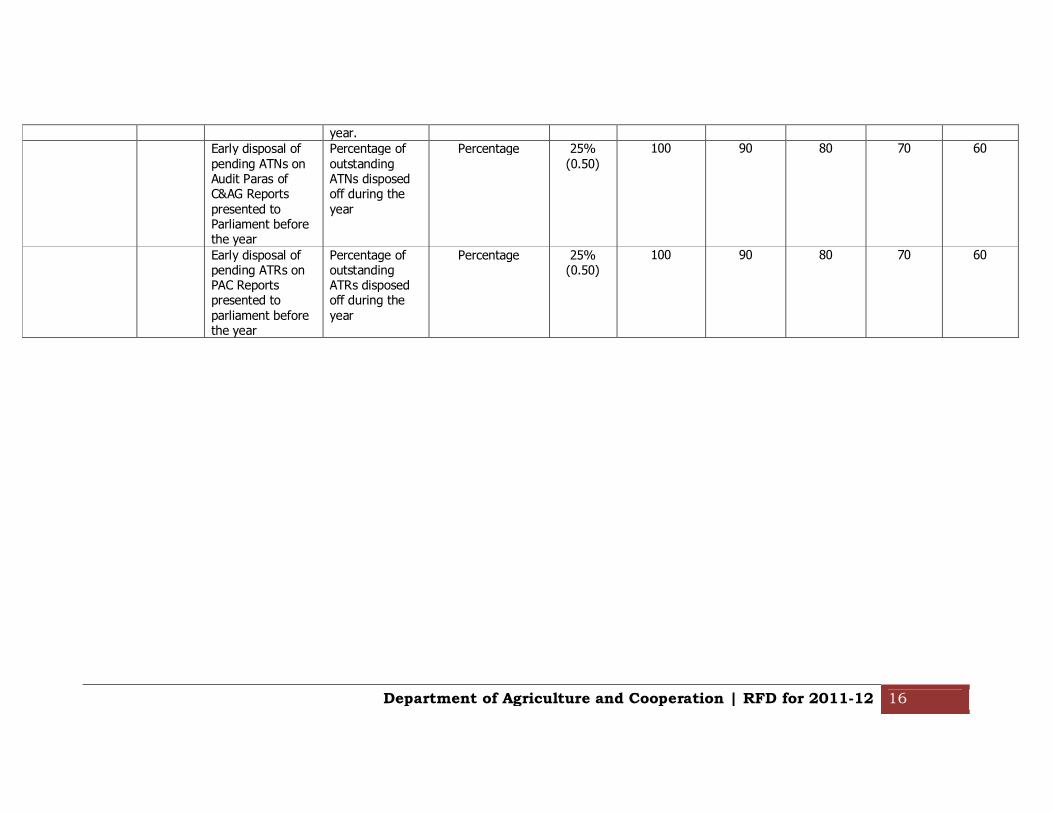
2.00 Timely submission of ATNS on Audit Paras of C&AG
Percentage of ATNs submitted within due date
(4 months) from date of presentation of
Reports to parliament by CAG during the
year.
Percentage 25% (0.50)
100 90 80 70 60
Timely submission of ATRs to the PAC Sectt. on PAC
Reports
Percentage of ATRs submitted within due date
(6 months) from date of presentation of
Reports to parliament by PAC during the
Percentage 25% (0.50)
100 90 80 70 60
Department of Agriculture and Cooperation | RFD for 2011-12 16
year.
Early disposal of
pending ATNs on Audit Paras of C&AG Reports
presented to Parliament before the year
Percentage of
outstanding ATNs disposed off during the
year
Percentage 25%
(0.50)
100 90 80 70 60
Early disposal of pending ATRs on PAC Reports presented to
parliament before the year
Percentage of outstanding ATRs disposed off during the
year
Percentage 25% (0.50)
100 90 80 70 60
Department of Agriculture and Cooperation | RFD for 2011-12 17
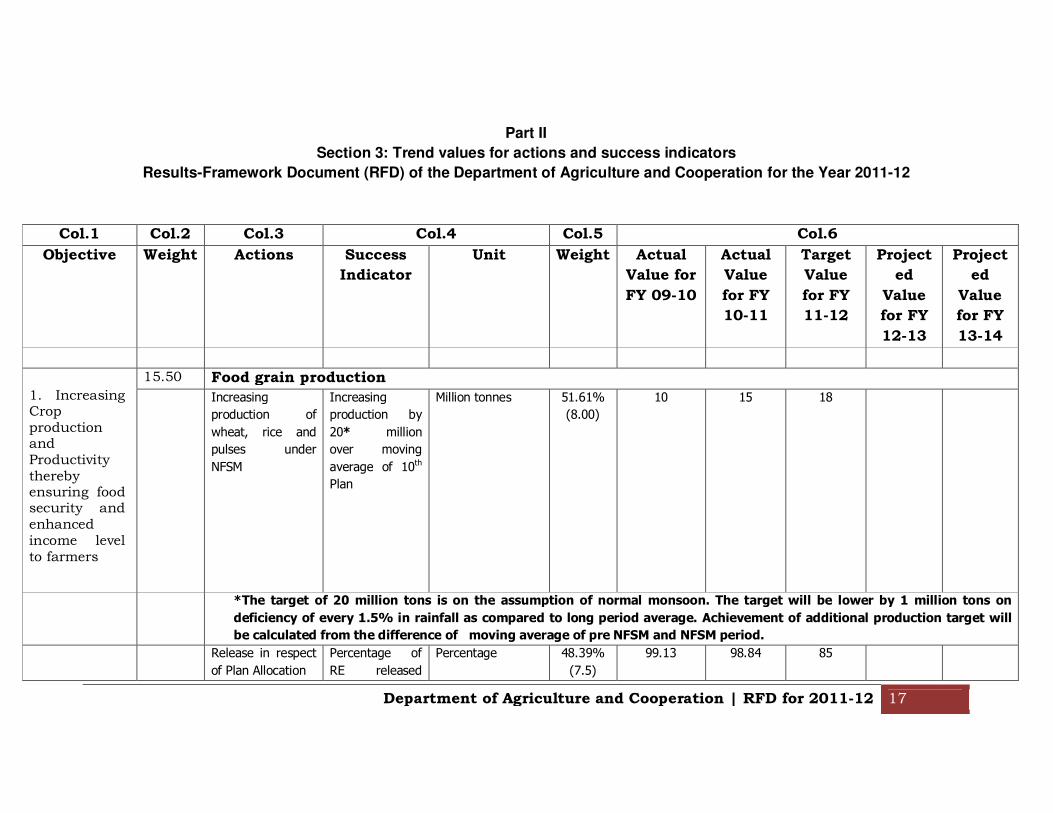
Part II
Section 3: Trend values for actions and success indicators
Results-Framework Document (RFD) of the Department of Agriculture and Cooperation for the Year 2011-12
Col.1 Col.2 Col.3 Col.4 Col.5 Col.6
Objective Weight Actions Success
Indicator
Unit Weight Actual
Value for
FY 09-10
Actual
Value
for FY
10-11
Target
Value
for FY
11-12
Project
ed
Value
for FY
12-13
Project
ed
Value
for FY
13-14
1. Increasing Crop production and Productivity thereby ensuring food security and enhanced income level to farmers
15.50 Food grain production
Increasing
production of
wheat, rice and
pulses under
NFSM
Increasing
production by
20* million
over moving
average of 10th
Plan
Million tonnes 51.61%
(8.00)
10 15 18
*The target of 20 million tons is on the assumption of normal monsoon. The target will be lower by 1 million tons on
deficiency of every 1.5% in rainfall as compared to long period average. Achievement of additional production target will
be calculated from the difference of moving average of pre NFSM and NFSM period.
Release in respect
of Plan Allocation
Percentage of
RE released
Percentage 48.39%
(7.5)
99.13 98.84 85
Department of Agriculture and Cooperation | RFD for 2011-12 18
under various
schemes
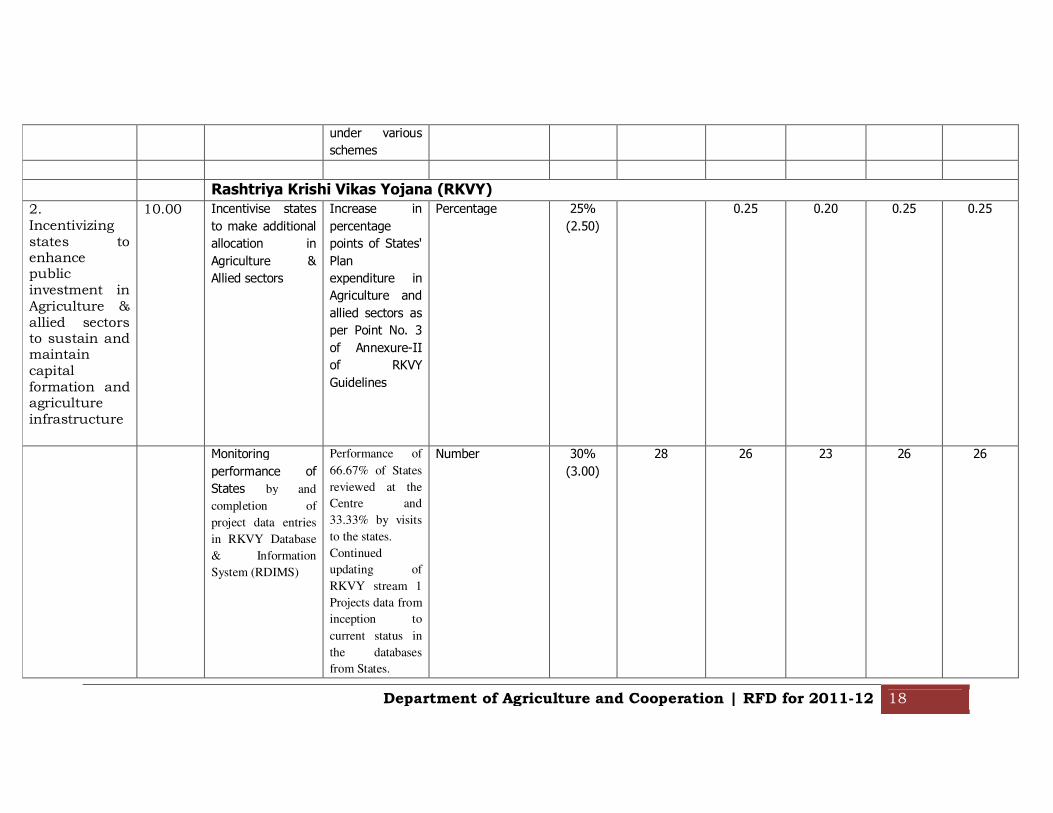
Rashtriya Krishi Vikas Yojana (RKVY)
2. Incentivizing states to enhance public investment in Agriculture & allied sectors to sustain and maintain capital formation and agriculture infrastructure
10.00 Incentivise states
to make additional
allocation in
Agriculture &
Allied sectors
Increase in
percentage
points of States'
Plan
expenditure in
Agriculture and
allied sectors as
per Point No. 3
of Annexure-II
of RKVY
Guidelines
Percentage 25%
(2.50)
0.25 0.20 0.25 0.25
Monitoring
performance of
States by and
completion of
project data entries
in RKVY Database
& Information
System (RDIMS)
Performance of
66.67% of States
reviewed at the
Centre and
33.33% by visits
to the states.
Continued
updating of
RKVY stream 1
Projects data from
inception to
current status in
the databases
from States.
Number 30%
(3.00)
28 26 23 26 26

Department of Agriculture and Cooperation | RFD for 2011-12 19
Weight of 3 will
be split in the
ratio 1:1:1 for
monitoring at
Central & State
levels & RDIMS
Rolling out new
initiatives
announced in
RKVY
Rolling out new
initiatives
announced in
the Budget or
otherwise
approved
Number of
schemes rolled
out
45%
(4.50)
3 8 - -
3. Diversification in Agriculture for increased income generation
14.50
Oil Seeds Component of ISOPOM
Area expansion
under ISOPOM as
envisaged in the
Budget 2011-12
speech by FM
Area expansion Hectares 6.89%
(1.00)
- - 40,000 - -
Monitoring and
Evaluation of
ISOPOM
Organize
meetings / field
visits
No. 3.45%
(0.5)
30 23 23 23 23
National Horticulture Mission NHM
Establishment of
nurseries
Total no. of
nurseries
established
No. 6.89%
(1.00)
- 115 90 125 100
Sanction of
projects for PHM /
Market / Others
No. of projects
sanctioned
No. 3.45%
(0.5)
600 540 600 600
Increase in Additional area Lakh ha 10.35% - 1.80 1.12 1.50 1.50
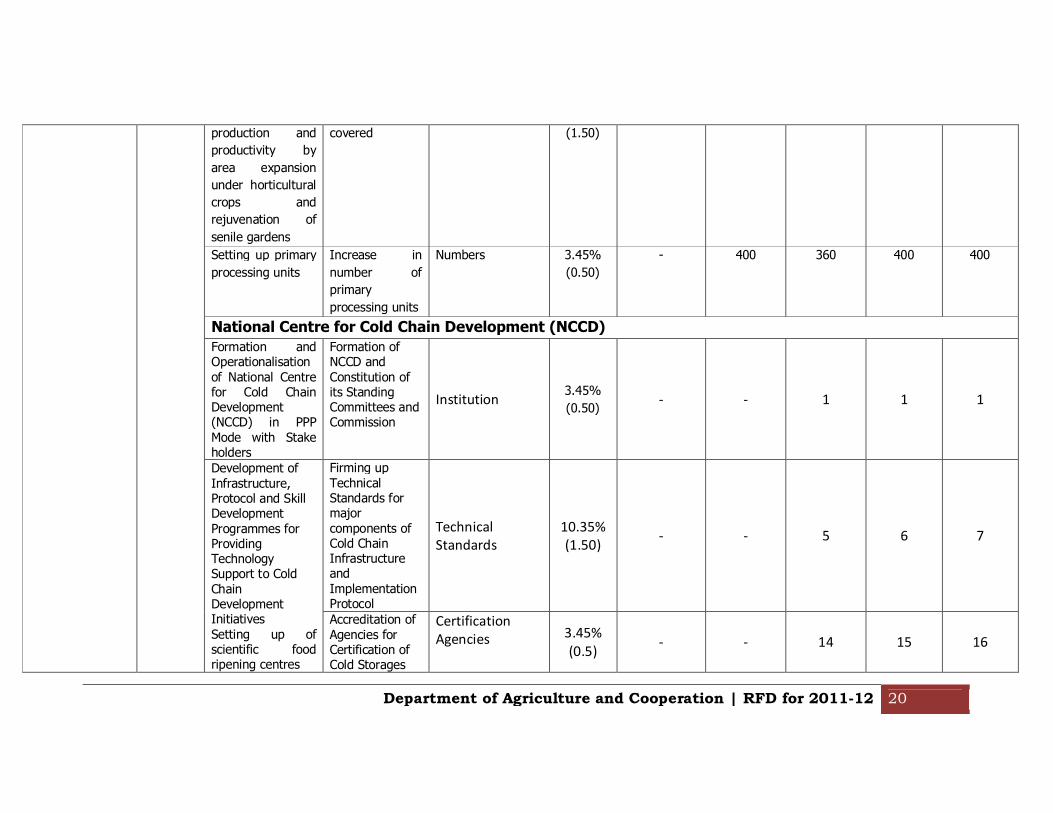
Department of Agriculture and Cooperation | RFD for 2011-12 20
production and
productivity by
area expansion
under horticultural
crops and
rejuvenation of
senile gardens
covered (1.50)
Setting up primary
processing units
Increase in
number of
primary
processing units
Numbers 3.45%
(0.50)
- 400 360 400 400
National Centre for Cold Chain Development (NCCD)
Formation and Operationalisation
of National Centre for Cold Chain Development (NCCD) in PPP
Mode with Stake holders
Formation of NCCD and
Constitution of its Standing Committees and Commission
Institution 3.45%
(0.50) - - 1 1 1
Development of
Infrastructure, Protocol and Skill Development
Programmes for Providing Technology Support to Cold
Chain Development Initiatives
Setting up of scientific food ripening centres
Firming up
Technical Standards for major
components of Cold Chain Infrastructure and
Implementation Protocol
Technical
Standards
10.35%
(1.50) - - 5 6 7
Accreditation of
Agencies for Certification of Cold Storages
Certification
Agencies 3.45%
(0.5) - - 14 15 16

Department of Agriculture and Cooperation | RFD for 2011-12 21
Certification of cold chain
infrastructure
Training and Certification of
Graduate Engineers Rendering
Consultancy Services for Cold Chain Sector
Engineers 3.45%
(0.5) - - 45 50 50
Skill Development of Cold Storage and reefer Van
Operators
Operators 3.45%
(0.5) - - 450 500 500
Setting up of Training Centre
of NCCD Training Centre
3.45%
(0.5)
1 1 1
Introduction of applied R & D
for Critical Storage Condition and Design of
Freight Containers
R & D Projects 3.45%
(0.5)
1 1 1
Firming up of protocols for testing rated performance of
critical components of cold storages
Test Protocols 3.45%
(0.5) - - 2 4 5
Creation of additional storage capacity using approved
technology
Promotion of Private Sector Investment for Creation of
additional
New Storage
Capacity in Lakh
MT
6.89%
(1.00) - - 4.5 5 5
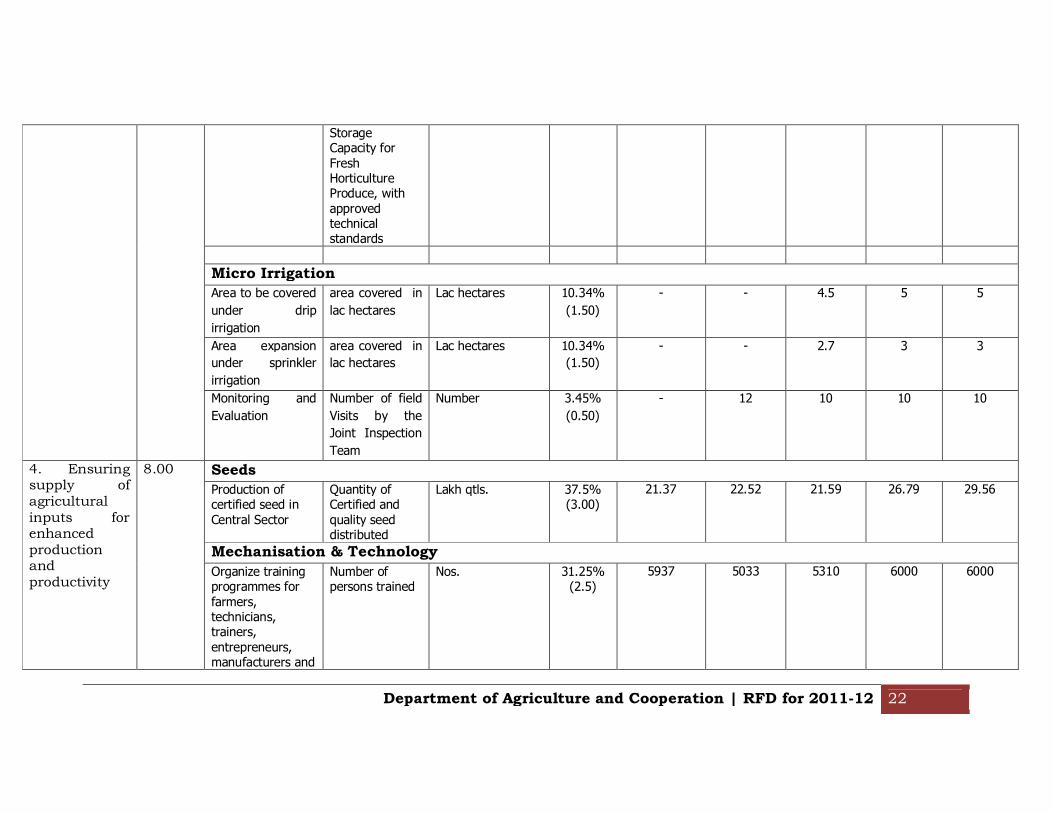
Department of Agriculture and Cooperation | RFD for 2011-12 22
Storage Capacity for
Fresh Horticulture Produce, with
approved technical standards
Micro Irrigation
Area to be covered
under drip
irrigation
area covered in
lac hectares
Lac hectares 10.34%
(1.50)
- - 4.5 5 5
Area expansion
under sprinkler
irrigation
area covered in
lac hectares
Lac hectares 10.34%
(1.50)
- - 2.7 3 3
Monitoring and
Evaluation
Number of field
Visits by the
Joint Inspection
Team
Number 3.45%
(0.50)
- 12 10 10 10
4. Ensuring supply of agricultural inputs for enhanced production and productivity
8.00 Seeds
Production of certified seed in
Central Sector
Quantity of Certified and
quality seed distributed
Lakh qtls. 37.5% (3.00)
21.37 22.52 21.59 26.79 29.56
Mechanisation & Technology
Organize training programmes for
farmers, technicians, trainers,
entrepreneurs, manufacturers and
Number of persons trained
Nos. 31.25% (2.5)
5937 5033 5310 6000 6000

Department of Agriculture and Cooperation | RFD for 2011-12 23
officials from State Governments at
FMTTIs
To test tractors, power tillers,
combine harvesters and other agricultural
machines /implements for performance evaluation and
quality up-gradation at FMTTIs
Number of machines tested
Nos. 31.25% (2.5)
231 204 148 165 165
5. Plant
Protection,
Quarantine
and Residue
Management
7.50 Plant Protection
Conducting regular
pest surveillance and monitoring to assess pest / disease situation
and timely advice of IPM measures
Area covered Lakh hectares 26%
(2.00)
8.16 8.16 7 8.50 8.50
Popularising IPM approach under Farmers Field School on IPM
Number of FFS conducted
Number 14% (1.00)
812 816 750 825 825
Monitor pesticide residues in agricultural commodities and
focus IPM efforts in identified areas
% of samples tested against
target
% of samples tested
14% (1.00)
88.80 85 80 85 85
Computerization of
PQ Stations
Issue of PSC/IP
as % of online applications
percentage 26%
(2.00)
90
Department of Agriculture and Cooperation | RFD for 2011-12 24
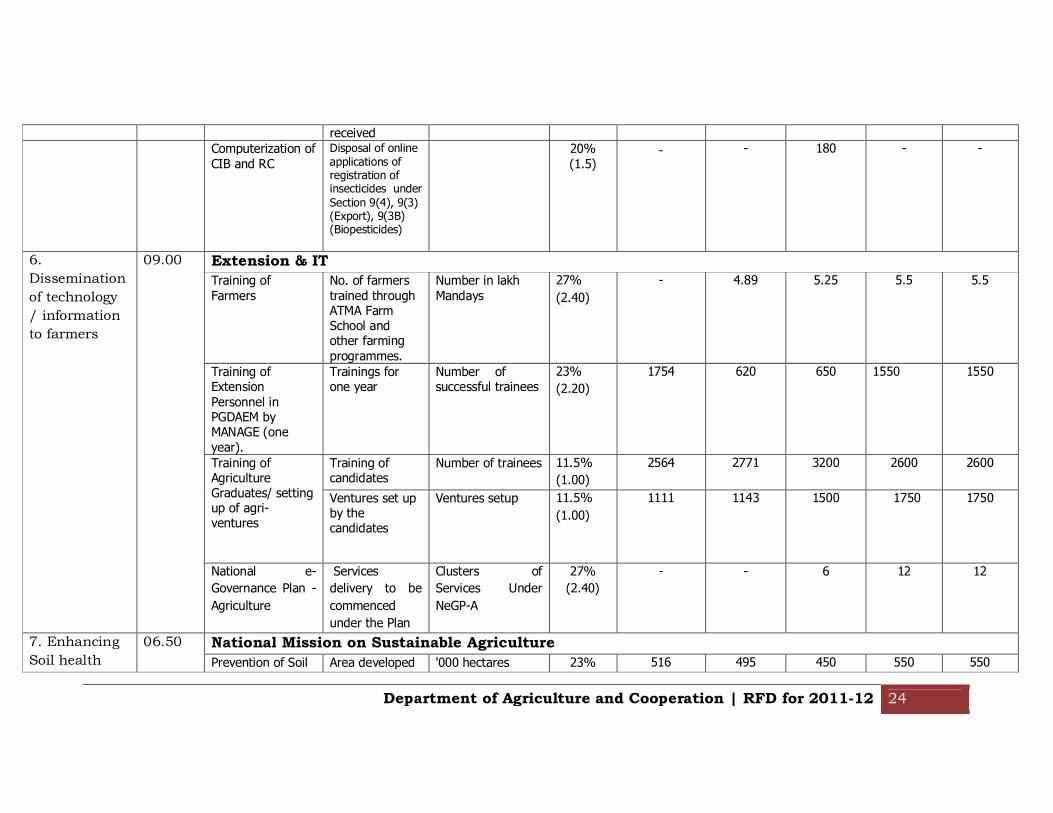
received
Computerization of
CIB and RC
Disposal of online applications of registration of insecticides under
Section 9(4), 9(3) (Export), 9(3B) (Biopesticides)
20%
(1.5) - - 180 - -
6.
Dissemination
of technology
/ information
to farmers
09.00 Extension & IT
Training of
Farmers
No. of farmers
trained through ATMA Farm School and other farming
programmes.
Number in lakh
Mandays
27%
(2.40)
- 4.89 5.25 5.5 5.5
Training of Extension
Personnel in PGDAEM by MANAGE (one
year).
Trainings for one year
Number of successful trainees
23%
(2.20)
1754 620 650 1550 1550
Training of Agriculture Graduates/ setting up of agri-ventures
Training of candidates
Number of trainees 11.5%
(1.00) 2564 2771 3200 2600 2600
Ventures set up by the candidates
Ventures setup 11.5%
(1.00) 1111 1143 1500 1750 1750
National e-
Governance Plan -
Agriculture
Services
delivery to be
commenced
under the Plan
Clusters of
Services Under
NeGP-A
27%
(2.40)
- - 6 12 12
7. Enhancing
Soil health
06.50 National Mission on Sustainable Agriculture
Prevention of Soil Area developed '000 hectares 23% 516 495 450 550 550
Department of Agriculture and Cooperation | RFD for 2011-12 25
and promotion
of resource
conservation
technology for
sustainable
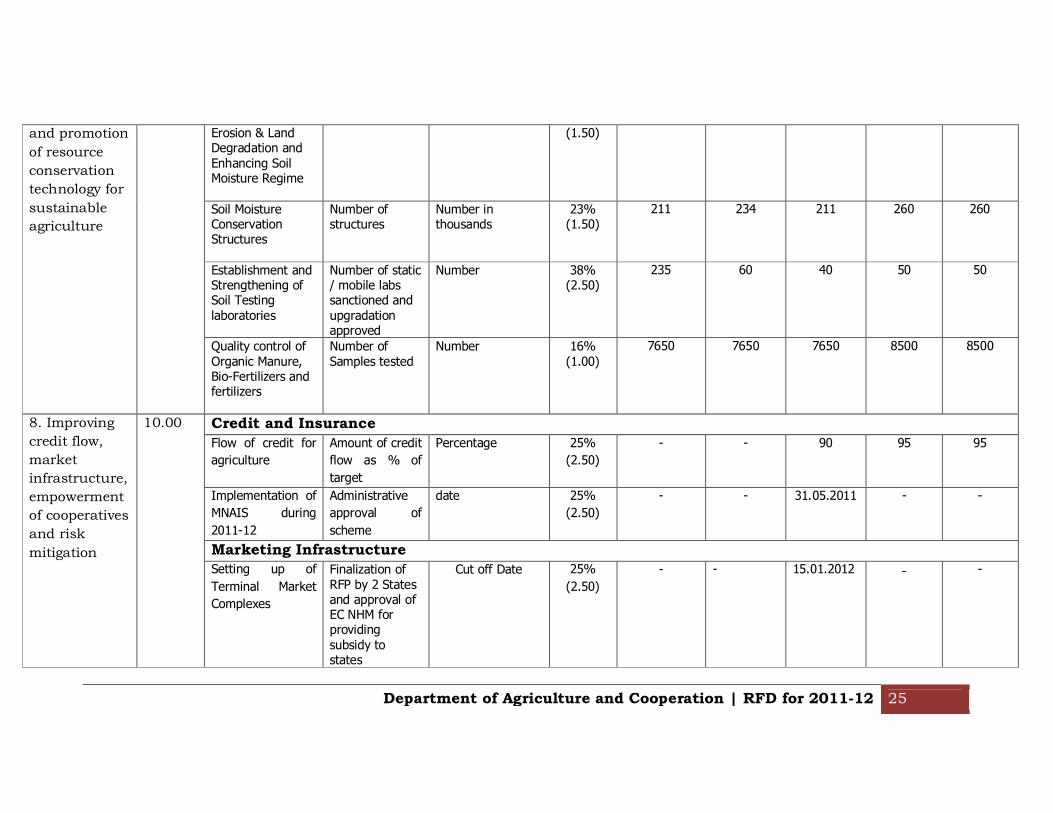
agriculture
Erosion & Land Degradation and
Enhancing Soil Moisture Regime
(1.50)
Soil Moisture Conservation Structures
Number of structures
Number in thousands
23% (1.50)
211 234 211 260 260
Establishment and Strengthening of Soil Testing
laboratories
Number of static / mobile labs sanctioned and
upgradation approved
Number 38% (2.50)
235 60 40 50 50
Quality control of
Organic Manure, Bio-Fertilizers and fertilizers
Number of
Samples tested
Number 16%
(1.00)
7650 7650 7650 8500 8500
8. Improving
credit flow,
market
infrastructure,
empowerment
of cooperatives
and risk
mitigation
10.00
Credit and Insurance
Flow of credit for
agriculture
Amount of credit
flow as % of
target
Percentage 25%
(2.50)
- - 90 95 95
Implementation of
MNAIS during
2011-12
Administrative
approval of
scheme
date 25%
(2.50)
- - 31.05.2011 - -
Marketing Infrastructure
Setting up of
Terminal Market
Complexes
Finalization of
RFP by 2 States and approval of EC NHM for providing
subsidy to states
Cut off Date 25%
(2.50)
- - 15.01.2012 - -
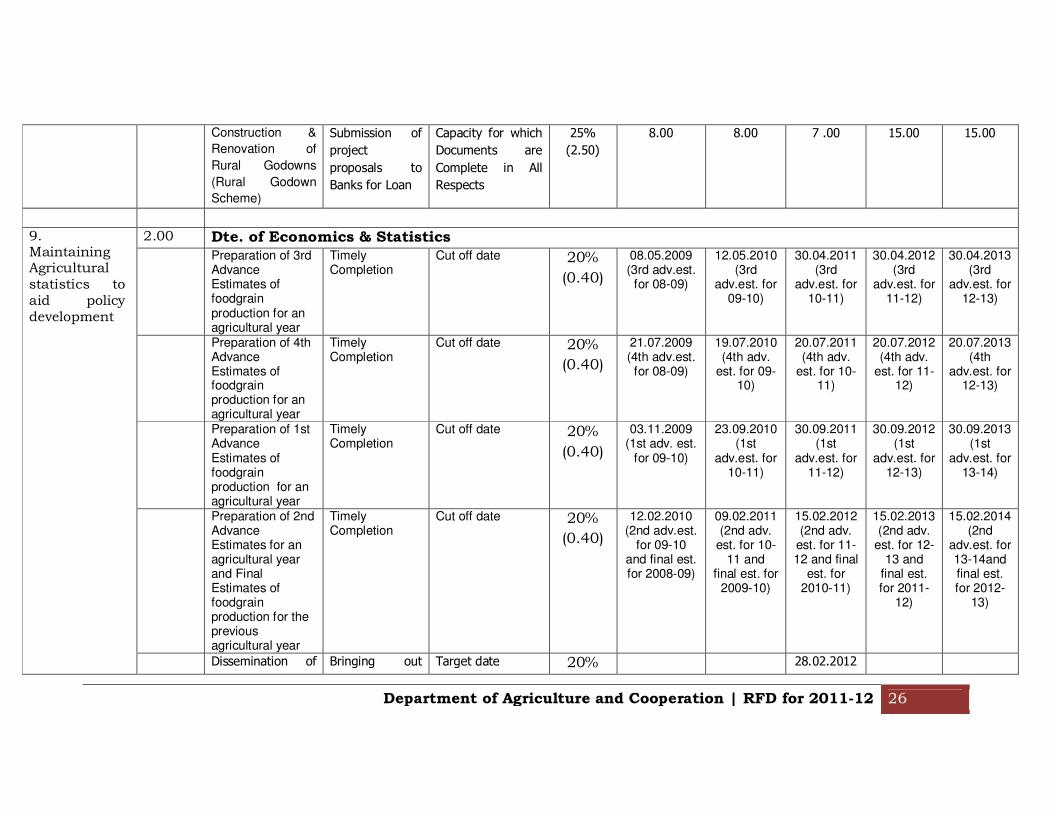
Department of Agriculture and Cooperation | RFD for 2011-12 26
Construction &
Renovation of
Rural Godowns
(Rural Godown
Scheme)
Submission of
project
proposals to
Banks for Loan
Capacity for which
Documents are
Complete in All
Respects
25%
(2.50) 8.00 8.00 7 .00 15.00 15.00
9. Maintaining Agricultural statistics to aid policy development
2.00 Dte. of Economics & Statistics
Preparation of 3rd Advance Estimates of foodgrain production for an agricultural year
Timely Completion
Cut off date 20%
(0.40)
08.05.2009 (3rd adv.est.
for 08-09)
12.05.2010 (3rd
adv.est. for 09-10)
30.04.2011 (3rd
adv.est. for 10-11)
30.04.2012(3rd
adv.est. for 11-12)
30.04.2013(3rd
adv.est. for 12-13)
Preparation of 4th Advance Estimates of foodgrain production for an agricultural year
Timely Completion
Cut off date 20%
(0.40)
21.07.2009 (4th adv.est.
for 08-09)
19.07.2010 (4th adv.
est. for 09-10)
20.07.2011 (4th adv.
est. for 10-11)
20.07.2012 (4th adv.
est. for 11-12)
20.07.2013 (4th
adv.est. for 12-13)
Preparation of 1st Advance Estimates of foodgrain production for an agricultural year
Timely Completion
Cut off date 20%
(0.40)
03.11.2009 (1st adv. est.
for 09-10)
23.09.2010 (1st
adv.est. for 10-11)
30.09.2011 (1st
adv.est. for 11-12)
30.09.2012 (1st
adv.est. for 12-13)
30.09.2013 (1st
adv.est. for 13-14)
Preparation of 2nd Advance Estimates for an agricultural year and Final Estimates of foodgrain production for the previous agricultural year
Timely Completion
Cut off date 20%
(0.40)
12.02.2010 (2nd adv.est.
for 09-10 and final est. for 2008-09)
09.02.2011 (2nd adv.
est. for 10-11 and
final est. for 2009-10)
15.02.2012 (2nd adv.
est. for 11-12 and final
est. for 2010-11)
15.02.2013 (2nd adv.
est. for 12-13 and
final est. for 2011-
12)
15.02.2014 (2nd
adv.est. for 13-14and final est. for 2012-
13)
Dissemination of Bringing out Target date 20% 28.02.2012

Department of Agriculture and Cooperation | RFD for 2011-12 27
information on
agricultural
statistics
‘Handbook on
Agricultural
Statistics’ along
with related
database for the
web
(0.40)
10. Drought Preparedness and Grant of relief under State Disaster Response Fund (SDRF) /National Disaster Response Fund (NDRF)
2.00 Drought Management
Review of Crisis Management Plan (CMP) for Drought
& Review and release of Contingency Action Plans by
respective Departments
Annual Review in the month of March for
release of updated CMP and model Contingency
Action Plans for agriculture, drinking water,
alternative employment etc.
Date 100% (2.00)
20.03.11 25.03.12 20.03.13 20.03.14
Efficient
functioning of
the RFD
system
3.00 Timely submission of Draft for approval
On-time submission
date - 08.03.2010 07.03.2011 05.03.1012 05.03.2013
Timely submission of results
On-time
submission
Date - 03.05.2011 03.05.2012 03.05.2013 03.05.2014
Improving
Internet
Efficiency/Res
ponsiveness/S
ervice delivery
10.00 Develop an Action Plan of E-Office
Implementation
Target date 31.12.2011

Department of Agriculture and Cooperation | RFD for 2011-12 28
of
Ministry/Depa
rtment
Identify and implement 3 major recommendations
of ARC-II relevant to the department that have not been
implemented thus far
On-time
submission
31.12.2011
Identify potential areas of corruption
related to departmental activities/function
and develop an action plan to mitigate them
On-time
submission
31.12.2011
Develop an action plan to implement ISO 9001
certification
On-time
submission
31.12.2011
Ensuring
compliance to
the Financial
Accountability
Framework
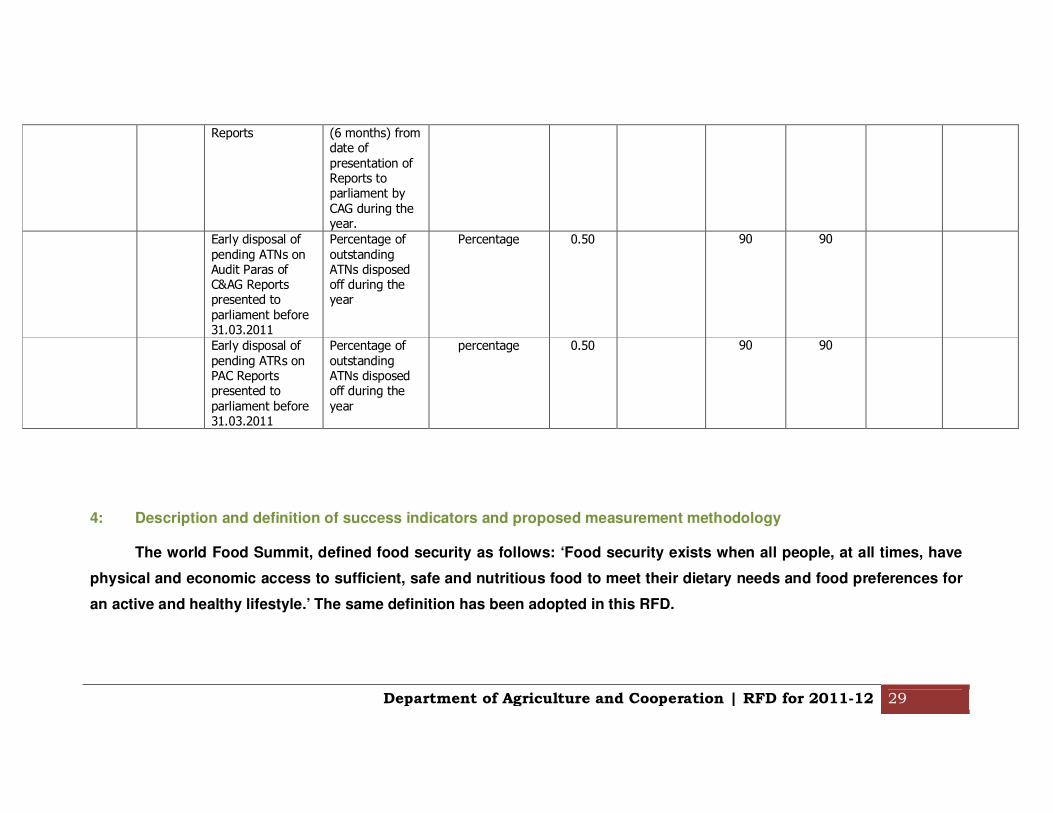
2.00 Timely submission of ATNS on Audit Paras of C&AG
Percentage of ATNS submitted within due date
(4 months) from date of presentation of
Reports to parliament by CAG during the
year.
Percentage 0.50 90 90
Timely submission of ATRs to the PAC Sectt. On PAC
Percentage of ATRS submitted within due date
percentage 0.50 90 90
Department of Agriculture and Cooperation | RFD for 2011-12 29
Reports (6 months) from date of
presentation of Reports to parliament by
CAG during the year.
Early disposal of
pending ATNs on Audit Paras of C&AG Reports presented to
parliament before 31.03.2011
Percentage of
outstanding ATNs disposed off during the year
Percentage 0.50 90 90
Early disposal of
pending ATRs on PAC Reports presented to
parliament before 31.03.2011
Percentage of
outstanding ATNs disposed off during the
year
percentage 0.50 90 90
4: Description and definition of success indicators and proposed measurement methodology
The world Food Summit, defined food security as follows: ‘Food security exists when all people, at all times, have
physical and economic access to sufficient, safe and nutritious food to meet their dietary needs and food preferences for
an active and healthy lifestyle.’ The same definition has been adopted in this RFD.
Department of Agriculture and Cooperation | RFD for 2011-12 30
The Success Indicators in Section 2 and Section 3 supra range from numbers, to cut-off dates, to time taken to
percentage utilisation. The numbers have been kept realistic in keeping with trend analysis of the past and commitments
already made by the Department of Agriculture & Cooperation during the current Five Year Plan. All these success
indicators are easily measurable as various success indicators can be confirmed from the official records maintained in
the Department of Agriculture & Cooperation and its field offices. Only those aspects of various objectives have been kept
as success indicators for which the Department of Agriculture can be held accountable. Thus, for various reasons given
in Section 5 below, the outputs and outcomes, which depend primarily on State Governments’ performance in utilisation
of funds and in physical progress under various schemes, have not been included.
Under Objective 1 of Section 2 of the RFD, the target of additional production of 20 million tons is on the
assumption of normal monsoon. The target will be lower by 1 million tons on deficiency of every 1.5% in rainfall as
compared to long period average. Achievement of additional production target will be calculated from the difference of
moving average of pre NFSM and NFSM period.
Section-5: Specific performance requirement from other departments that are critical for delivering agreed results
Agriculture is a State subject. Almost all Centrally Sponsored or Centrally Shared schemes are implemented through States.
The performance of the Department of Agriculture & Cooperation therefore largely depends on the States which are independent
constitutional entities. Production figures also largely depend on vicissitudes of weather. The role of the Department of Agriculture
& Cooperation gets mostly confined to formulation of a comprehensive perspective plan, immediate response to a crisis on account
of vagaries of weather, release of funds in a time bound manner, monitoring of progress and evaluation of outcomes. The
Department of Agriculture & Cooperation is heavily dependent on various Central Ministries/Organisations also as follows:

Department of Agriculture and Cooperation | RFD for 2011-12 31
DEPTT. / ORGANISATION LINKAGE
Planning Commission For allocation of requisite funds to ensure unhindered implementation.
Ministry of Water Resources Creation and utilisation of irrigation potential.
Ministry of Power Allocation of power from Central Grid to various States.
Department of Fertilizers Provision of different grades and types of fertilisers as per the farmers requirements from time to time.
Department of Financial Services
Flow of credit to the farmers.
Hence, various physical targets which find place in our Outcome Budget, are thus not controllable fully by the Department of
Agriculture and Cooperation. The Department can only pursue the machinery of the State Governments for timely and optimum
implementation. The illustrative list of items under NFSM and NHM are being enclosed at Annexures I and II to emphasise the point
that while specific physical objectives and success indicators are available, yet success depends mainly on the State Governments.
Hence, such items have not been included in Section 2 and 3 for the reasons given above.

Department of Agriculture and Cooperation | RFD for 2011-12 32
Section 6: Outcome / Impact of activities of Department / Ministry
S.
No
Outcome / Impact of
Department / Ministry
Jointly with Success
Indicator (s)
2009-
2010
2010-
2011
2011-
2012
2012-
2013
2013-
2014
1 Increasing agricultural
and horticulture
production for food and
nutritional security
RCs under
DAC, State
Governments,
Farmers,
Stake holder
Ministries/
Departments
and corporate
sector
Increase in food
grain production
in Million Tonnes
10 15 20
Increase in
horticulture
production in
Million Tonnes
8 11 11 12 13
2 Incentivizing states to
enhance public
investment in agriculture
RCs under
DAC, State
Governments,
Farmers,
Stake holder
Ministries/
Departments
and corporate
sector
Increase in
percentage points
in state plan
expenditure
0.25 0.20 0.25 0.25
3 Ensuring growth of
agriculture sector to
facilitate growth of overall
economy
RCs under
DAC, State
Governments,
Farmers,
Stake holder
Growth in GDP for
agriculture sector
-0.1 6.5 1.5 2.5 2.5
Department of Agriculture and Cooperation | RFD for 2011-12 33
Ministries/
Departments
and corporate
sector
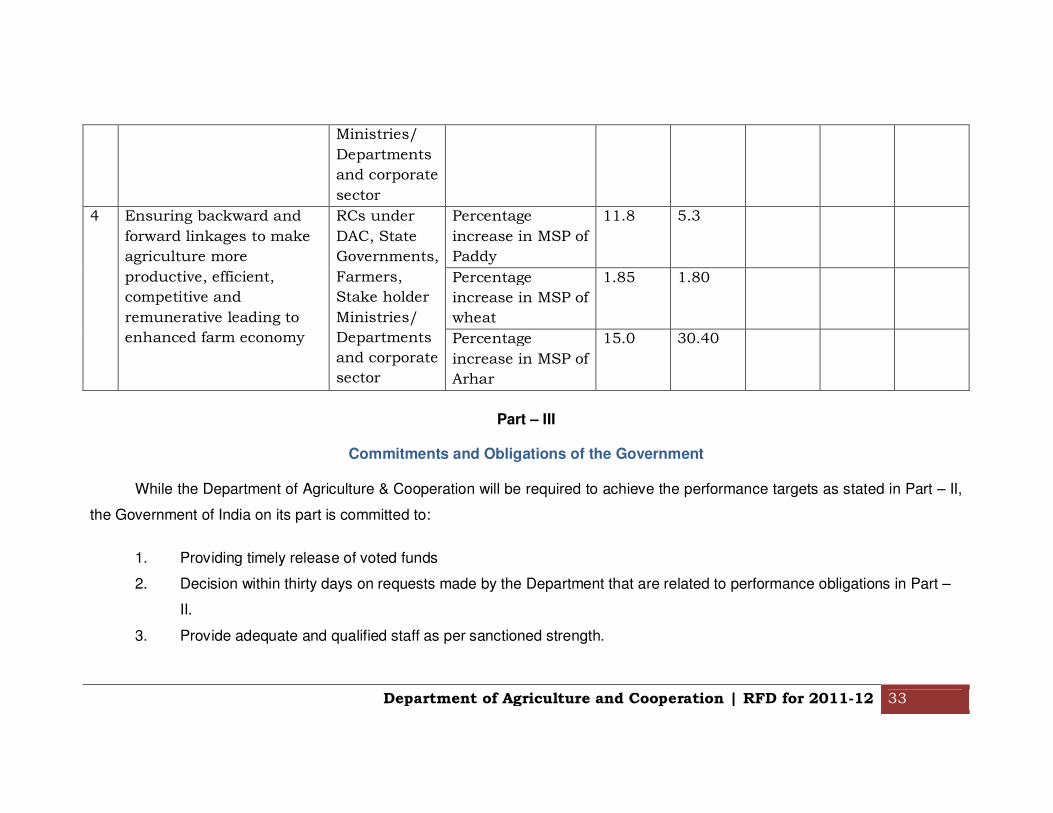
4 Ensuring backward and
forward linkages to make
agriculture more
productive, efficient,
competitive and
remunerative leading to
enhanced farm economy
RCs under
DAC, State
Governments,
Farmers,
Stake holder
Ministries/
Departments
and corporate
sector
Percentage
increase in MSP of
Paddy
11.8 5.3
Percentage
increase in MSP of
wheat
1.85 1.80
Percentage
increase in MSP of
Arhar
15.0 30.40
Part – III
Commitments and Obligations of the Government
While the Department of Agriculture & Cooperation will be required to achieve the performance targets as stated in Part – II,
the Government of India on its part is committed to:
1. Providing timely release of voted funds
2. Decision within thirty days on requests made by the Department that are related to performance obligations in Part –
II.
3. Provide adequate and qualified staff as per sanctioned strength.
Department of Agriculture and Cooperation | RFD for 2011-12 34
Part – IV
Frequency of Monitoring and Information Flow
The Department of Agriculture & Cooperation shall submit quarterly and annual performance reports to Cabinet Secretary
against the performance obligations made in Part-II. These reports will be due within 30 days after the close of the quarter.
SIGNED:
__________________________________ ______________________________ P.K. Basu Date Secretary, Department of Agriculture & Cooperation