results and applications of a space suit range-of-motion
TRANSCRIPT

NASA
NASA Technical Memorandum 102204
U ”
Results and Applications of a Space Suit Range-of-Motion Study AI Reinhardt
{NASA-Tn- 102204) RESULTS A N D APPLICATIONS ~ a 9 - 2 6 3 9 8 OF A SPACE SUIT E A N G E - O F - H O T I O N STUDY ( N A S A . Arnes Research Cater) 16 p CSCL 058
Unclas G3/54 3223913
July 1989
National Aeronautics and Space Administration
https://ntrs.nasa.gov/search.jsp?R=19890017027 2020-03-20T01:27:37+00:00Zbrought to you by COREView metadata, citation and similar papers at core.ac.uk
provided by NASA Technical Reports Server

~~~~ ~ ~~ ~
NASA Technical Memorandum 102204
Results and Applications of a Space Suit Range-of-Motion Study
AI Reinhardt U.S. Air Force Office of Scientific Research, Ames Research Center, Moffett Field, California
July 1989
NASA National Aeronautics and Space Administration
Ames Research Center Moffett Field, California 94035

ABSTRACT assesses the value-added potential of the overall technique to the madmachine design process.
The range of motion of space suits has traditionally been described using limited two-dimensional mapping of limb, torso, or arm movements performed in front of an orthogonal grid. A new technique for recovering extra- vehicular (EVA) space suit range-of-motion data during underwater testing was described in a paper presented by the author at the 1988 conference. The new technique uses digitized data which is automatically acquired from video images of the subject. Three-dimensional trajectories are recovered from these data, and can be displayed using two- dimensional computer graphics. Results of using this tech- nique in a study of the current shuttle EVA suit during underwater simulated weightlessness testing are discussed. Application of the data for use in animating anthropometric computer models is highlighted.
DIFFERENT METHODS OF MEASURING
The range of motion of a subject wearing a space suit during underwater simulated weightlessness testing was discussed by Reinhardt and Walton in “The Recovery and Use of Space Suit Range-of-Motion Data” (I).* One of the systems described in that paper was the Motion Analysis ExpertVisionm system (2). The Expenvision system was used to describe the range of motion of the current space shuttle extravehicular activity (EVA) suit in a study con- ducted at Marshall Space Flight Center’s (MSFC) Neutral Buoyancy Simulator (NBS) in August 1988.
This paper consists of two sections. The first section describes the experiment setup, discusses the results, and offers suggestions on how to improve the procedure for collecting space suit range-of-motion data during under- water testing. The second section of this paper discusses applications of the data to an animated computer model and
*Numbers in parentheses denote references at end of paper.
SECTION ONE: THE STUDY
MOTION ANALYSIS EXPERTVISION SYSTEM
Expertvision is described in detail in Ref. 1. Briefly, the system uses passive, retroreflective targets which can be attached to isolated landmarks. Data are collected using four standard industrial video cameras which are precisely placed within underwater housings to compensate for refraction. The four camera housings are mounted in the underwater test facility so that any two of the four cameras can always “see” the targets to be tracked. Video signals from each of the cameras are fed to a video processor (VP310) at the surface where the outlines of the various targets are extracted and passed to the system host (SUN 3/110C workstation).
Target identification is achieved by contrast. Using on-axis, underwater lighting, the retroreflective targets attached to the space suit are, theoretically, considerably brighter than other elements of the image. The video pro- cessor describes the location of each target by generating a list of pixels which form the outline of each spot in the video images. This is done at standard video rates (60 frames per second from each of the four cameras) and can be sustained for 20 to 25 seconds.
When the raw (pixel) coordinates have been passed to the SUN host, they are manipulated by the system software which incorporates the photogrammetric algorithms described by Walton (3) to produce the required three- dimensional (3-D) trajectories of the landmarks. Actual target position is defined as the centroid of the outline described by the pixels. With 3-D histories available, the standard system software can be used to manipulate and display results in various forms, including component time

histories (x vs t. y vs t, z vs t), orthographic projections of reach envelopes (x vs y, x vs z, y vs z), and stick figures. The raw trajectories can also be converted to ASCII files, which can be ported to another host system if desired.
---I
EXPERIMENT SETUP
‘ I
The system was set up in MSFC’s NBS. The NBS is a cylindrical water tank 70 feet in diameter and 40 feet deep. Descriptions of the experiment setup and of the problems overcome during installation follow.
Subject Position -- A mockup of the shuttle cargo bay was placed in the bottom of the NBS. Shuttle foot restraints were mounted on a crossbar of the cargo bay and positioned so that the foot restraints were in the center of the tank. The foot restraints were thus approximately 11 feet above the bottom of the tank.
Camera Position -- Four NEC CCD cameras (Model #TI-22A) with 17-mm lenses were mounted inside rectan- gular watertight aluminum housings which contained an optical quality dome at one end (Fig. 1). The cameras were positioned inside the housings to eliminate refraction using techniques described by Walton (4). ~
The housings were then mounted on simple support brackets which allowed for swivel and tilt adjustment. The four camera housings and brackets were bolted to the sides of the NBS at 90” intervals as shown in Fig. 2.
The cameras were mounted 8 feet above and 35 feet away from the subject’s foot restraints. Once the camera position was verified, the adjustments on the mounting brackets were secured to prevent camera movement. The video signals were linked, as described earlier, to the video processor (VP310) located on the topside deck of the tank with the SUN host system.
, r 1 2 ’ ‘ - I d
Fig. 1 Underwater camera housing
Fig. 2 Experiment setup
Target Selection -- During camera installation, it was determined that the size of the facility and the lighting con- ditions were not conducive to using on-axis camera lighting and the bright remoreflective targets as planned. The study had originally been planned for Johnson Space Center (JSC), but was switched to MSFC due to schedule constraints.
The cameras and targets were originally selected for a distance of 24 feet between camera and subject at JSC. The additional 11 feet at MSFC caused the illuminative power of the single on-axis light to fall by a factor of 4 while the relative target size was reduced by a factor of 1.5. In addi- tion, relative light losses due to scatter are far greater under water than in air. Thus, the single on-axis underwater light was not strong enough to illuminate the targets for consis- tent data tracking.
Furthermore, the NBS is housed in a large building which has an overhead skylight above the tank. This caused the lighting conditions to vary with weather conditions during the test. During camera installation, it was noted that the support divers’ flippers tracked clearly at the other end of the contrast spectrum (i.e., dark targets on a bright back- ground.) A decision was made to use dark targets for the study so ordinary black racquet balls were chosen. Fifteen of these “targets” were affixed to the current shuttle EVA suit in the positions shown in Fig. 3. The on-axis under- water lights were removed from the cameras and were not used.
System Calibration -- An 8-foot cubic aluminum framework with targets suspended at known distances was centered over the foot restraints. Once positioned, the structure was filmed by the system to establish a coordinate reference system around the foot restraints. Once this was
2

Fig. 3 Suited subject target location
complete, the framework structure was removed and the range-of-motion study began.
TEST PROTOCOL
Fourteen motions were recorded of a subject in the foot restraints wearing the shuttle EVA suit with targets attached as described above. The motions performed were taken from the current NASA test plan for evaluating range-of- motion performance of advanced suits and are listed below (5).
1. Neutral or reference position
2. Upward reach right arm
3. Upward reach left arm
4. Overhead reach from side of body
5. Inboard reach
6. Side-to-side reach
7. Torso rotation
8. Torso bend-windmill
9. Straight front kick, left leg
10. Hip abduction, left leg
11. Straight front kick. right leg
12. Hip abduction, right leg
13. Forward torso bending
14. Backward torso bending
The same protocol was used for two different suited subjects. The first subject repeated the procedure on differ- ent days for a total of three trials.
TEST RESULTS
OVERVIEW -- Target outlines as acquired by Expertvision appear on the monitor screen as in Fig. 4. The target outlines are described visually as small, closed, irregular polygons. Each of the four cameras has a similar view of the targets, but from the viewpoint of the camera's position. To simplify the data analysis of the study, targets of interest for a given motion were specifically selected for tracking, while miscellaneous targets were blocked out through the editing system of the SUN host. Thus for upward reach, right arm, only the three targets of the right arm were tracked by the processor. For full body motions, this editing feature was not used.
-I
4 F: ce w >
- r
* t
1.1 '.I *
-.-.-
a ,- -, i
- 6 HORIZONTAL POSITION, pixels
Fig. 4 Target outlines
Data from the first trial were unusable due to weather conditions. The weather was partly cloudy, which caused the NBS lighting conditions to vary significantly and resulted in extremely noisy data. Noisy data, in this study, is defined as unclear target identification. If target contrast was not clear due to lighting conditions, reflections, and shadows, the system had difficulty tracking and identifying the targets during movement.
The second and third trials, however, were run under much better conditions for data tracking, because the weather was sunny. Of the 14 motions studied, only 3 were not digitized. These were.side-to-side reach, torso rotation, and torso bend-windmill. The raw data in these three motions contained too much noise for accurate 3-D digi- tizing. The remaining motions were edited from the third
3

mal, except for motion #1 (neutral position) and motion #14 (backward torso bending). These two motions were processed from the second mal..
RANGE-OF-MOTION GRAPHS
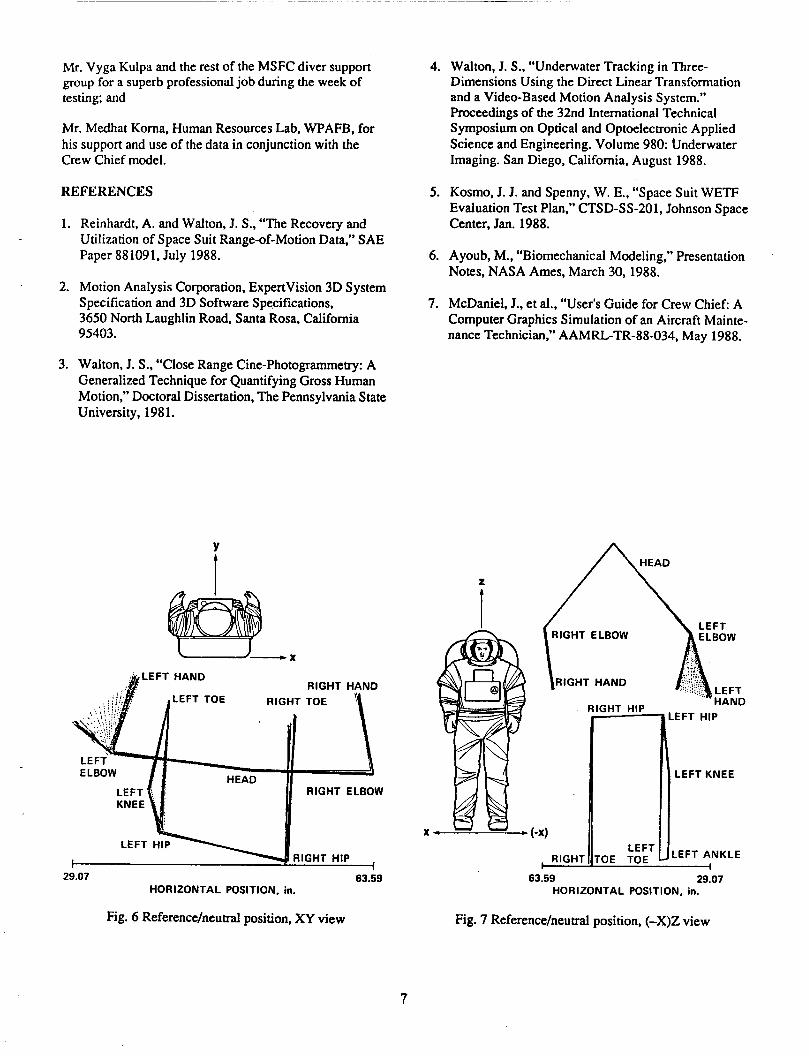
Graphic plots of the motions that were successfully tracked and digitized are discussed in the following section. The coordinate axes used for data editing are provided in Fig. 5. The suited subject is facing forward along the y-axis. The right side of the space suit (facing forward) is in the positive x-axis, while the left side is in the negative x direction. The positive z-axis then follows the right-hand thumb rule. Thus, an XY plot is a top-down view of the subject, while YZ provides a sagittal view. An XZ view is a view of the subject from the rear. (-X)Z views provide the subject’s motion from the perspective of a viewer directly in front of the subject. A simple stick figure construction is used to connect target positions in all of the plots. To aid in understanding the graphic plots, a small reference model was added to each plot to visualize the orientation of the printout.
Y
Fig. 5 Coordinate axes reference system
Each plot represents a significant amount of data. As shown in Table 1, for every 1 second of data, each target’s position is described at the rate of 60 Hertz (Hz). or 60 frames per second on each camera. For 9 seconds of a typi- cal motion, this equates to 540 individual frames of x,y, and z data for each target after digitizing. For the full body shots where 15 targets are tracked, this corresponds to 8100 lines of x,y, and z data for each camera view. Thus,
4 c
the graphic plots represent a more easily understood inter- pretation of the data.
The reference or neutral body position is recorded in Figs. 6 and 7. This motion or position is the position the suited subject’s body assumes when relaxed in the foot restraints. Upward reach right arm is shown in Figs. 8 and 9, while upward reach left arm is shown in Figs. 10 and 11.
Overhead reach from side of body is shown from three different viewpoints in Figs. 12 through 14. The (-X)Z view of this motion defines the envelope for this particular motion. The axis provides a measurement of the envelope. An exact measurement can be obtained by referring to the tabular x,y,z target data in the ASCII files. In Fig. 14, for example, the maximum span along the x-axis, which corresponds to the two hand-held targets, is approximately 69 inches, while the maximum z-span for the same two targets are 40 inches for the right hand and 42 inches for the left hand.
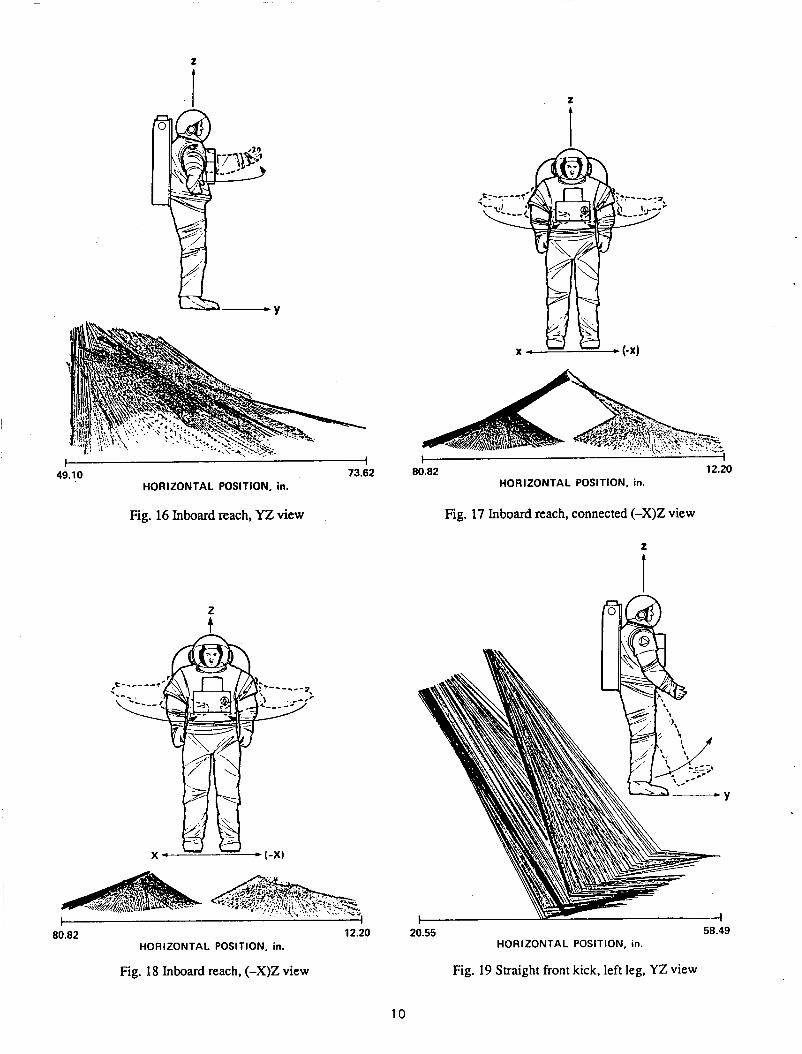
Inboard reach is viewed in Figs. 15 through 18. Note that Figs. 17 and 18 are from the same viewpoint. The dif- ference is that Fig. 17 connects the elbow target to the head, while Fig. 18 does not.
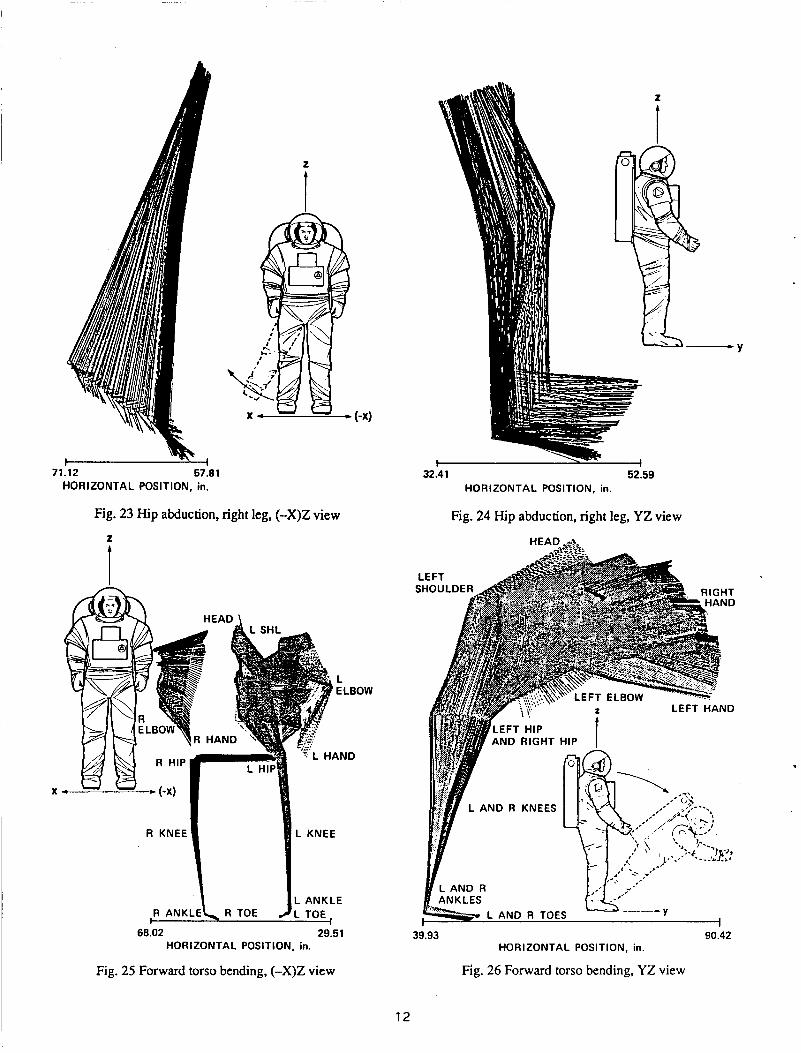
Two views of straight front kick, left leg are provided in Figs. 19 and 20. Hip abduction, left leg is shown in Figs. 21 and 22. The extreme reversed knee angle indicates that tar- get identification was reversed during editing. This example was intentionally left reversed to illustrate an example of what errors can occur during digitizing the target informa- tion and how readily they’re identified. A correct plot of hip abduction is provided in Figs. 23 and 24 for the right leg. Note how limited this particular motion is for the current shuttle suit.
A test of the system’s capability to track all 15 targets is provided in forward torso bending (Figs. 25-27). Figure 26 vividly shows the limitations of the current EVA suit in bending forward at the hips. Another demonstration of tracking all 15 targets is shown in backward torso bending (Figs. 28 and 29).
SUGGESTED IMPROVEMENTS FOR DATA COLLECTION
As demonstrated in the preceding section, the Motion Analysis Expertvision system was able to successfully track and digitize targets for 11 of 14 motions of a space- suited subject during underwater testing. The editing and analysis effort was made more difficult than necessary because of variations in ambient lighting during the test. Reducing this noise level will improve the tracking capa- bility of the processor and simplify the digitizing process.

~ ~~
Path number
Object name:
1 1 1 1 1 1 1 1 1 1 1 1 1 1 1 1 1 1 1 1 1 1 1 1
~~
TABLE 1. AN EXAMPLE OF DIGITIZED TARGET DATA
Frame number
1. elbow
1 2 3 4 5 6 7 8 9
10 11 12 13 14 15 16 17 18 19 20 21 22 23 24
Time (seconds)
0. 0.167e-01 0.333e-01 0.500e-01 0.667e-01 0.833e-01 0.100 0.1 17 0.133 0.150 0.167 0.183 0.200 0.217 0.233 0.250 0.267 0.283 0.300 0.317 0.333 0.350 0.367 0.383
Based on the experience gained during this study, the fol- lowing improvements are suggested:
a) Facility lighting: All light sources should be noted and controlled to maximize the contrast desired. Sky- lights and windows shouId be covered to eliminate sources of light variation. Underwater lights should be kept at a constant setting. In-tank hardware, such as mockups, is a source of reflection and contrast and should be removed. The field of view for each camera should be maintained as uniform as possible.
b) Target selection: Spherical markers, as opposed to ring-banded markers, should be used where possible to maintain a consistent target outline for the processor. When possible, remove extraneous targets before a par- ticular motion study rather than having all targets pres- ent for all studies. This will reduce the chances of incorrect target identification.
c) Camera placement and selection: Lower the camera placement to achieve a more head-on field of view and record each camera’s view on videotape, even though the data is transferred directly to the host system. This will provide a reference to resolve target identification problems during the data analysis phase. Care should be used if underwater lights are used with bright targets to avoid shining a light in an opposing camera.
X (inches)
26.5837 26.6229 26.6348 26.6573 26.6565 26.6800 26.6254 26.71 19 26.6054 26.7048 26.7056 26.5594 26.7790 26.6829 26.5862 26.7 139 26.6902 26.5807 26.6449 26.624 1 26.727 1 26.6432 26.6363 26.3561
Y (inches)
4 1.9279 42.1478 42.0609 42.08 18 42.0847 42.0044 42.0554 42.0307 42.1 145 42.3059 42.3028 42.1807 42.2252 42.3650 42.2176 42.3278 42.3890 42.2885 42.3266 42.4262 42.5492 42.6915 42.6809 42.5467
Z (inches)
41.9139 42.0096 41.9376 41.9545 4 1.9403 4 1.922 1 41.9561 41.9205 42.03 13 42.0854 42.1006 42.1666 42.2807 42.3749 42.4401 42.5586 42.6303 42.67 5 9 42.8429 42.9722 43.129 1 43.3462 43.3913 43.6346
d) Data acquisition rate: Consider a tradeoff between reducing the data acquisition rate and running a partic- ular motion longer. A 60-Hz rate is faster than neces- sary when capturing voluntary human motion, encum- bered by a space suit and limited by the underwater environment. The rate could possibly be reduced to 30 Hz or less without losing critical data. This would allow analysis of longer duration motions.
SECTION TWO: DATA APPLICATIONS
DIGITIZED PLOTS
The digitized plots generated by ExpertVision are use- ful for comparative purposes. Possible uses for a space suit designer include a comparison of reach performance of dif- ferent suit designs for the same.subject, or the effect on reach performance of a modification to an existing suit design. As mentioned in Ref. 1, the ExpertVision approach has the potential to improve the accuracy over the existing grid method of measuring reach performance, from f3.0 inches to M. 1 inches.
COMPUTER ANIMATION
Perhaps a more visually descriptive use of the data and one that is currently the subject of much interest, is the application of the data to aid or drive the animation of an
5

anthropometric computer model. Dr. M. Ayoub, of Texas Technical University, has used the Expertvision system to drive the animation of simple stick figures performing lift- ing tasks (6). He also incorporates complex force, accelera- tion, and velocity equations in his model of back forces during lifting. The equations are driven by the coordinate data obtained from Expertvision.
The data files themselves can be readily viewed as raw animated files. At 60 Hz, there is more than enough data for use as an animated script. In fact, for a goal-oriented model such as POSIT, the data could be filtered down to approxi- mately 20 Hz to achieve animation and thus save computer time (1).
Another use for the data is as an aid in animating more detailed anthropometric models. One such model, Crew Chief, developed by J. McDaniel, et al. at the U.S. Air Force Harry G. Armstrong Aerospace Medical Laboratory, Wright-Patterson AFB, achieves animation through pro- grammed algorithms (7). The strategy for the Expertvision data is as a check and refinement of the motions generated by Crew Chief. Thus a program for overhead reach of a space-suited model is created by Crew Chief, and then refined by the data generated by Expertvision of a human subject performing the same task.
VALUE-ADDED POTENTIAL
One key question which requires discussion might be phrased as, “What does the value-added capability of Expertvision, and the use of the data files created by Expertvision for animating computer models, represent to the overall system-design process?”
As stated earlier, Expertvision provides an increase in accuracy over the current grid method for describing space suit range-of-motion performance. In addition, it is believed that once a system like Expertvision is set up and properly adjusted, that the time and labor required to generate the plots of interest would decrease, thus realizing a savings.
The intriguing application from a systems viewpoint is the possibility of animating computer models based on data collected directly from a human subject. Such a capability, when finally realized, might offer the following benefits:
1) The animated files created from a subject offer a direct way for the computer modeler to validate animation algorithms. This is the method currently under study with the Crew Chief model.
2) The animated files provide an interactive tool for the workstation designer to verify human reach restriction requirements. For EVA workstations and space suits this is extremely important. Providing the designer with files of
EVA work tasks based on suited-subject data would pro- vide the capability to assess the effect of proposed work- station design changes on reach capability.
3) Crew Chief includes key anthropometric data such as strength capabilities for various tasks (7). Coupling the motion data with strength data obtained from instruments like the Cybex Dynamometer used in current space suit tests would define a functional reach and strength envelope for the computer model. Thus a workstation designer could evaluate the effects of a proposed change to the workstation by using an animated model to assess if the range of expected users could reach the required task, and, more importantly, perform the task.
4) The approach does not have to be limited to EVA workstations. The same technique could be applied to any madmachine interface to optimize a workstation with regard to human performance.
SUMMARY
An experiment was conducted which assessed the capability of the Expertvision system to describe space suit range of motion during underwater testing. The results of the experiment indicate the system successfully tracked tar- gets during the test for two different subjects. Suggestions were made on how to improve the data collection technique during underwater testing. With a properly calibrated system, this experiment demonstrates the validity of the approach for quantifying space suit reach performance and the use of Expertvision as a comparative measurement tool for space suit designers. A discussion of the application of the data files to animated computer models indicated sig- nificant areas of potential benefit to the system design pro- cess. The technique described could be applied to any madmachine interface to optimize human performance during the design phase of the system process.
ACKNOWLEDGMENT
The success of this experiment was the direct result of a dedicated and enthusiastic support team, which spanned government agencies and contractors alike. The following people bear special mention:
Dr. Jim Walton, President of 4-D Video, Sebastopol, CA, whose “on-the-fly” adjustments salvaged the experiment;
Mr. Shelbome Fung, Vice President of Engineering, Motion Analysis Corporation, Santa Rosa, CA, for com- pleting the data analysis and graphic display portions of the experiment;
6
Mr. Vyga Kulpa and the rest of the MSFC diver support group for a superb professional job during the week of testing; and
LEFT
Mr. Medhat Korna, Human Resources Lab, WPAFB, for his support and use of the data in conjunction with the Crew Chief model.
REFERENCES
1. Reinhardt, A. and Walton, J. S., “The Recovery and Utilization of Space Suit Range-of-Motion Data,” SAE Paper 881091, July 1988.
2. Motion Analysis Corporation, Expertvision 3D System Specification and 3D Software Specifications, 3650 North Laughlin Road, Santa Rosa, California 95403.
3. Walton, J. S., “Close Range Cine-Photogrammetry: A Generalized Technique for Quantifying Gross Human Motion,” Doctoral Dissertation, The Pennsylvania State University, 1981.
Y
LEFT HAND
RIGHT TOE
29.07 63.59 HORIZONTAL POSITION, in.
Fig. 6 Referencdneutral position, XY view
4. Walton, J. S., “Underwater Tracking in Three- Dimensions Using the Direct Linear Transformation and a Video-Based Motion Analysis System.” Proceedings of the 32nd International Technical Symposium on Optical and Optoelectronic Applied Science and Engineering. Volume 980: Underwater Imaging. San Diego, California, August 1988.
5. Kosmo, J. J. and Spenny, W. E., “Space Suit WETF Evaluation Test Plan,” CTSD-SS-201, Johnson Space Center, Jan. 1988.
6. Ayoub, M., “Biomechanical Modeling,” Presentation Notes, NASA Ames, March 30, 1988.
7. McDaniel, J., et al.. “User’s Guide for Crew Chief A Computer Graphics Simulation of an Aircraft Mainte- nance Technician,” AAMRL-TR-88-034, May 1988.
RIGHT
63.59
EFT HIP
LEFT KNEE
.EFT ANKLE
29.07 HORIZONTAL POSITION, in.
Fig. 7 Reference/neutral position, (-X)Z view
7

z
I ORIGINAL PAGE IS OF POOR QUAUTY
z
I
15.19 61.83 HORIZONTAL POSITION, in.
Fig. 8 Upward reach right arm, YZ view
71.87 55.35 HORIZONTAL POSITION, in.
Fig. 9 Upward reach right arm (-X)Z view
I . . I
30.63 61.31 HORIZONTAL POSITION, in.
Fig. 10 Upward reach left arm, YZ view
2
t
44.20 23.07 HORIZONTAL POSITION, in.
Fig. 11 Upward reach left arm, (-X)Z view
8

Y ORIGINAL OF POOR
13.51 82.2 HORIZONTAL POSITION. in.
'Fig. 12 Overhead reach from side of body, XY view
2
t
PAGE QUAL1
'3
- Y r ~~~ I
37.12 60.43 HORIZONTAL POSITION, in.
Fig. 13 Overhead reach from side of body, YZ view
82.n 13.51 12.20 80.82 HORIZONTAL POSITION, in. HORIZONTAL POSITION, in.
Fig. 14 Overhead reach from side of body, (-X)Z view Fig. 15 Inboard reach, XY view
9
t i 49.10 73.62
HORIZONTAL POSITION, in.
Fig. 16 Inboard reach, YZ view
I . . I
80.82 12.20 HORIZONTAL POSITION, in.
Fig. 18 Inboard reach, (-X)Z view
I 80.82 12.20
HORIZONTAL POSITION, in.
Fig. 17 Inboard reach, connected (-X)Z view
20.55 58.49 HORIZONTAL POSITION, in.
Fig. 19 Straight front kick, left leg, YZ view
10

z
33.75 45.26 HORIZONTAL POSITION, in.
ORIGINAL PAGE IS OF POOR QUALITY
Y
I I / A I
45.43 25.72 HORIZONTAL POSITION, in.
Fig. 21 Hip abduction, left leg, (-X)Z view
'Y
Fig. 20 Straight front kick, left leg, XY view
30.25 52.01 HORIZONTAL POSITION, in.
Fig. 22 Hip abduction, left leg, YZ view
11
57:81 HORIZONTAL POSITION, in.
z
I n
Fig. 23 Hip abduction, right leg, (-X)Z view
z
L ANKLE L TOE
29.51
J 68.02
HORIZONTAL POSITION, in.
Fig. 25 Forward torso bending, (-X)Z view
12
- Y
32.41 52.59 HORIZONTAL POSITION, in.
Fig. 24 Hip abduction, right leg, YZ view
39.93 90.42 HORIZONTAL POSITION, in.
Fig. 26 Forward torso bending, YZ view

I LEFT HAND GHT HAND
29.51 68.02 HORIZONTAL POSITION, in.
Fig. 27 Forward torso bending, XY view
-19.08 +46.73 HORIZONTAL POSITION, in.
Fig. 28 Backward torso bending, YZ view
20.85 64.08 HORIZONTAL POSITION, in.
Fig. 29 Backward torso bending, XY view
13

Nalonl runsn Awmubci M d Report Documentation Page Spa Admnt.b.lim
1. Report No.
NASA TM-102204 2. Government Accession No. 3. Recipient's Catalog No.
4. Title and Subtitle
Results and Applications of a Space Suit Range-of-Motion Study
7. Author@)
A1 Reinhardt
National Aeronautics and Space Administration Washington, DC 20546-0001
5. Report Date
July 1989 6. Performing Organization Code
8. Performing Organization Report No.
A-89164
10. Work Unit No.
14. Sponsoring Agency Code c 9. Performing Organization Name and Address
Ames Research Center Moffett Field, CA 94035
2. Sponsoring Agency Name and Address
I 5. Supplementary Notes
Point of Contact: A1 Reinhardt, Ames Research Center, MS 239-15, Moffett Field, CA 94035 (415) 694-6728or FI'S 464-6728
Report submitted as meeting paper for SAE Intersociety Conference on Environmental Systems,
11. Contract or Grant No.
13. Type of Report and Period Covered
Technical Memorandum
July 24-27, 1989 6. Abstract
7. Key Words (Suggested by Author(s))
Space suit
The range of motion of space suits has traditionally been described using limited two-dimensional mapping of limb, torso, or arm movements performed in front of an orthogonal grid. A new technique for recovering extra-vehicular (EVA) space suit range-of-motion data during underwater testing was .
described in a paper presented by the author at the 1988 conference. The new technique uses digitized data which is automatically acquired from video images of the subject. Three-dimensional trajectories are recovered from these data, and can be displayed using two-dimensional computer graphics. Results of using this technique in a study of the current shuttle EVA suit during underwater simulated weight- lessness testing are discussed. Application of the data for use in animating anthropometric computer models is highlighted.
18. Distribution Statement
Unclassified-Unlimited
9. Security Classif. (of this report)
Unclassified
Range of motion Study results and applications
20. Security Classif. (of this page) 21. No. of Pages
Unclassified 14
Subject Category - 54
I 1
\SA FORM 1626 OCT 86 For sale by the National Technical Information Service, Springfield, Virginia 221 61
22. Price
A02