result - seb group · 2014-09-18 · nordics in h1 2010 best brokerage firm nordic countries...
TRANSCRIPT
Investor presentation
Result
2010

22
Stable earnings from a diversified platform
Net credit losses back to pre-crisis levels
Strategic alignment – German retail business divested
HighlightsIncome
Provisions for credit losses
Strategic alignment

3
Operating profit (SEK bn)
Profit and loss trendProfit and loss development Q2-08 – Q2-10 (SEK bn)
2.6
Q2-08 Q3-08 Q4-08 Q1-09 Q2-09 Q3-09 Q4-09 Q1-10 Q2-10
9.8
6.6
0.6
Operating income Operating expenses Net credit lossesQ2-10 Q2-10 Q2-10
Note: Shaded areas refer to gain on buy-back of subordinated debt and goodwill write-offs, respectively

4
Income statement Q2 2010 Q2-10 Q1-10 % H1-10 H1-09 %
Total operating income 9,821 9,372 5 19,193 23,304 -18Total operating expenses -6,619 -6,367 +4 -12,986 -13,267 -2Profit bef credit losses & GW 3,202 3,005 7 6,207 10,037 -38Goodwill & capital gain -1,688Profit before credit losses 3,202 3,005 7 6,207 8,348 -26Net credit losses etc -622 -1,930 -68 -2,552 -5,928 -57Operating profit 2,580 1,075 +140 3,655 2,420 51
0.81.0
3.94.1
0.91.0
3.53.9+6% +13%
3% -12%
9%10%
Q1-10 Q2-10 Q1-10 Q2-10 Q1-10 Q2-10 Q1-10 Q2-10
Profit and loss (SEK m)
Net interestincome
Net fees and commissions
Net financialincome
Net life insuranceincome
41%
37%
9%10%
Operating income by type, Q2 vs. Q1 (SEK bn)

5
Funding & other
0.4
Q1-08
Q2 Q3 Q4 Q1-09
Q2 Q3 Q4 Q1-10
Q2
Deposits
3.1
Q1-08
Q2 Q3 Q4 Q1-09
Q2 Q3 Q4 Q1-10
Q2
Net interest income development NII 2008 – 2010 (SEK bn)
NII by income type 2008 – 2010 (SEK bn)
5
0.6
Q1-08
Q2 Q3 Q4 Q1-09
Q2 Q3 Q4 Q1-10
Q2
Lending
0
1
2
3
4
5
6
Q1-08 Q2 Q3 Q4 Q1-09 Q2 Q3 Q4 Q1-10 Q2-10
6
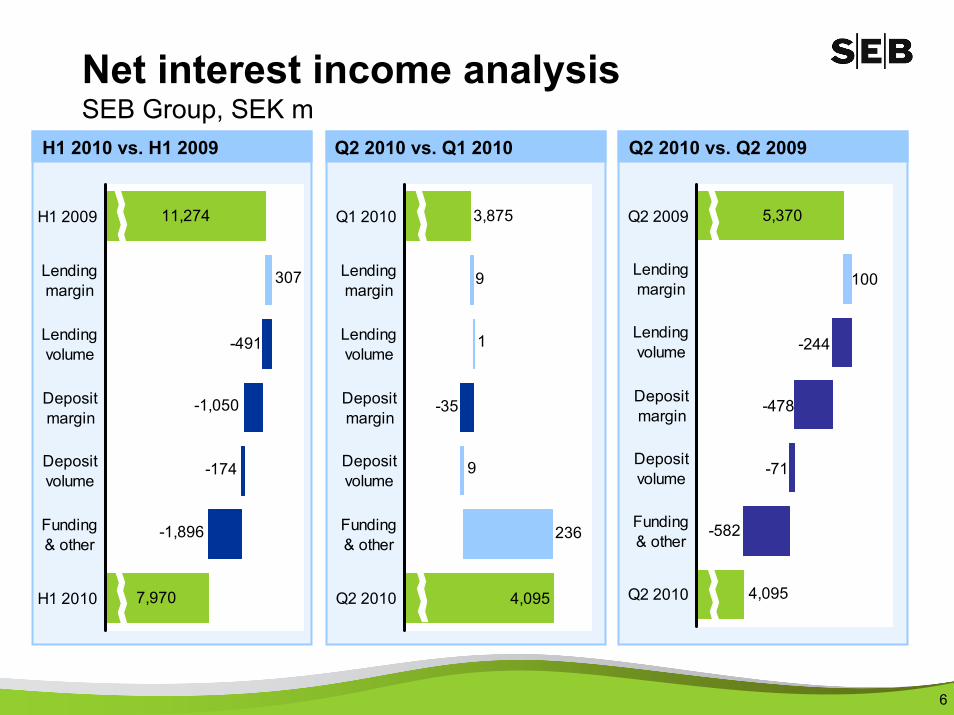
Net interest income analysisSEB Group, SEK m
-582
-71
-478
-244
100
5,370
4,095
Q2 2009
Lendingmargin
Lendingvolume
Depositmargin
Depositvolume
Funding& other
Q2 2010
Q2 2010 vs. Q2 2009
4,095
3,875
9
1
-35
9
236
Q1 2010
Lendingmargin
Lendingvolume
Depositmargin
Depositvolume
Funding& other
Q2 2010
Q2 2010 vs. Q1 2010H1 2010 vs. H1 2009
11,274
7,970
-1,896
-174
-1,050
-491
307
H1 2009
Lendingmargin
Lendingvolume
Depositmargin
Depositvolume
Funding& other
H1 2010
7
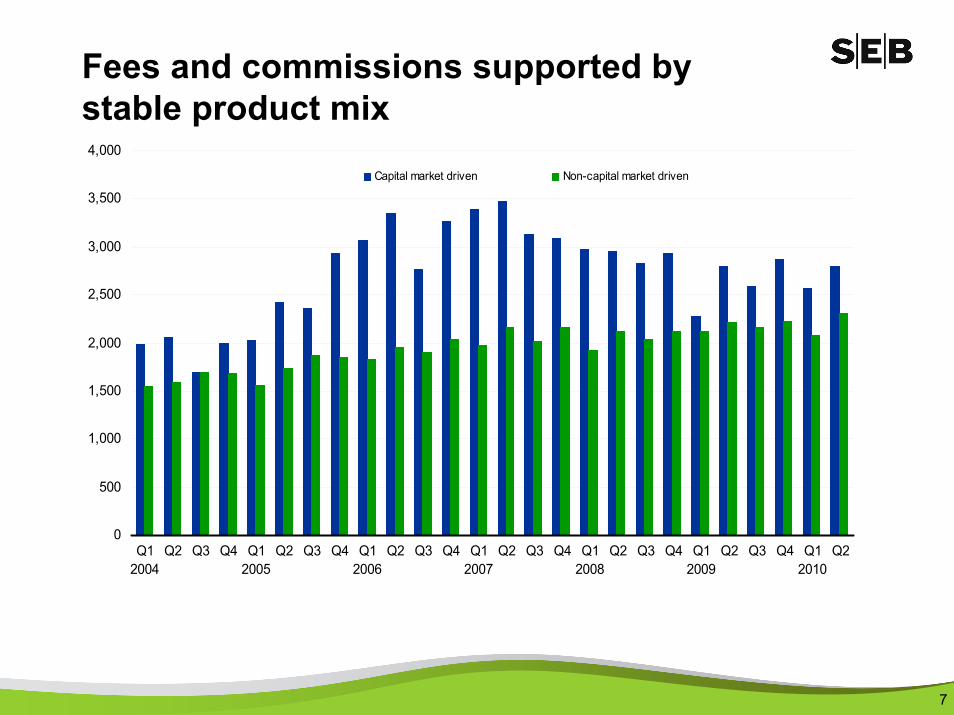
Fees and commissions supported by stable product mix
0
500
1,000
1,500
2,000
2,500
3,000
3,500
4,000
Q12004
Q2 Q3 Q4 Q12005
Q2 Q3 Q4 Q12006
Q2 Q3 Q4 Q12007
Q2 Q3 Q4 Q12008
Q2 Q3 Q4 Q12009
Q2 Q3 Q4 Q12010
Q2
Capital market driven Non-capital market driven
8
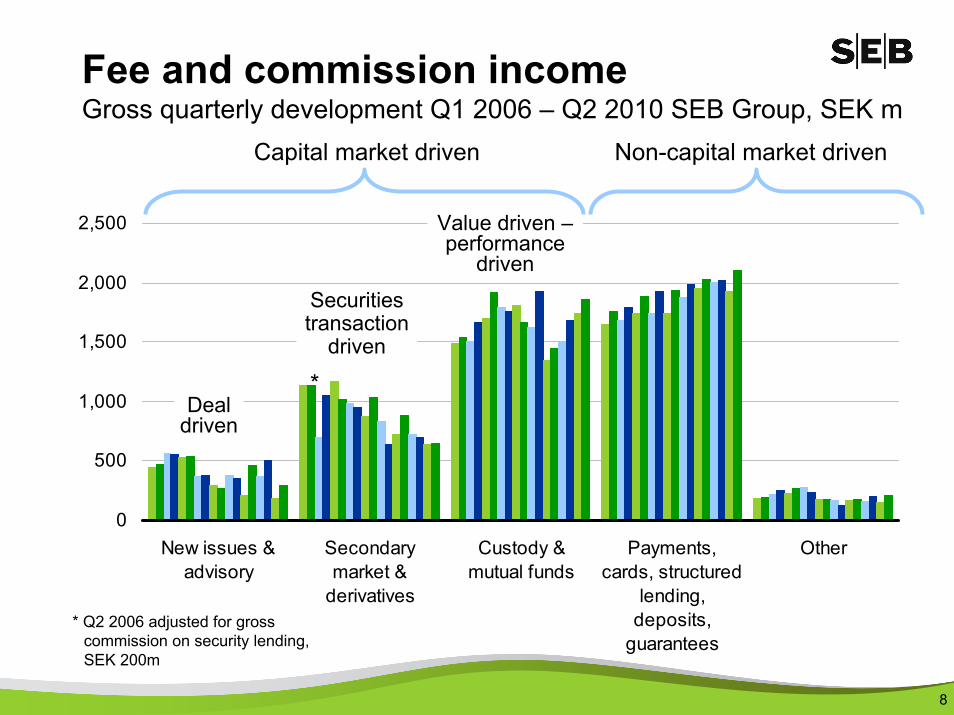
Fee and commission incomeGross quarterly development Q1 2006 – Q2 2010 SEB Group, SEK m
0
500
1,000
1,500
2,000
2,500
New issues &advisory
Secondarymarket &
derivatives
Custody &mutual funds
Payments,cards, structured
lending,deposits,
guarantees
Other
Deal driven
Securitiestransaction
driven
Value driven –performance
driven
Capital market driven
*
* Q2 2006 adjusted for gross commission on security lending, SEK 200m
Non-capital market driven

9
Number of FTEs
Cost development
1) Excluding goodwill write-offs
H1-09 H1-10
13,267 12,986
Staff cost
IT & Admin
Productivity/efficiency H1 vs. H1 IT infrastructure
First milestone reached – new core banking system implemented in LithuaniaImproves product development and efficiencyInvestments to enable new Group-wide IT infrastructure
-2%
19,912 19,56219,032 19,091
20,430
Q2-09 Q3 Q4 Q1-10 Q2
Cost per transaction
No. of transactions
-15%
+13%
Operating expenses1 (SEK bn)
Transactions per FTE +18%
10
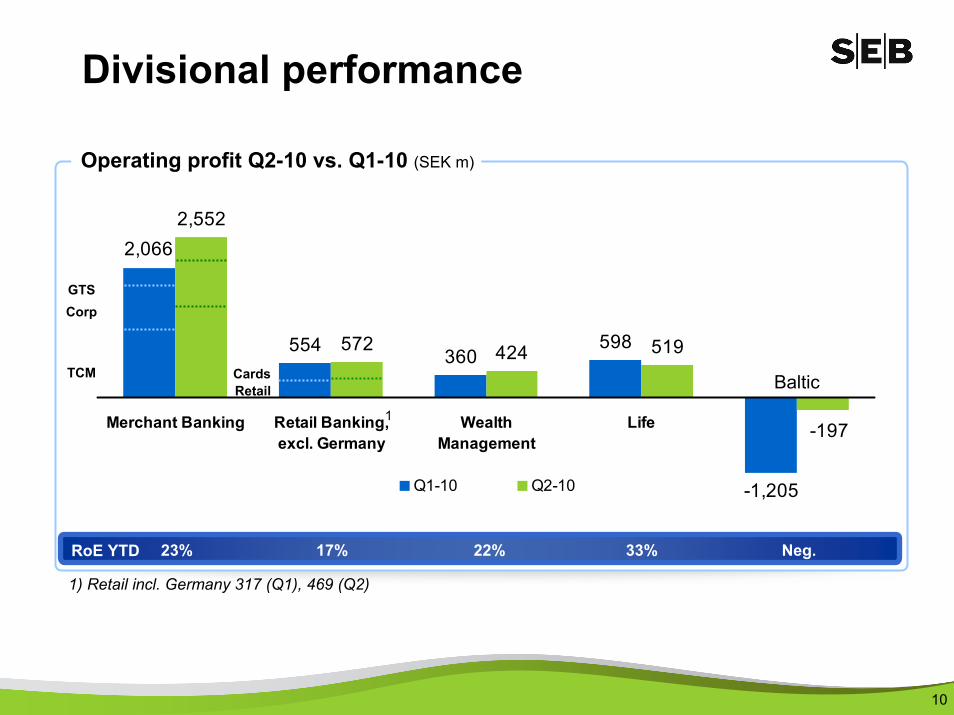
Divisional performance
554 360598
-1,205
2,552
572 424 519
2,066
-197Merchant Banking Retail Banking,excl. Germany
WealthManagement
Life
Q1-10 Q2-10
Neg.RoE YTD 17% 22% 33%
Operating profit Q2-10 vs. Q1-10 (SEK m)
23%
1
1) Retail incl. Germany 317 (Q1), 469 (Q2)
TCM
CorpGTS
RetailCards Baltic

11
TCM income split, excluding investment portfolio
Low risk trading orientation
Jan-07
Mar-07
Jun-07
Sep-07
Nov-07
Feb-08
Apr-08
Jul-08
Sep-08
Dec-08
Mar-09
May-09
Aug-09
Oct-09
Jan-10
Mar-10
Jun-10
* Excluding Investment Portfolio
Daily trading income 2007 – 2ndQ 2010. 35 negative out of 872 trading days. Average loss SEK 15m
Robust TCM incomeIncome growth thanks to higher activity and volatility
38%36%41%38%34%46%
44%36%26% 28% 33% 38% 41%
63%29%
30%30%22%24%
21%
46%50%44% 46% 59% 44%
45%
19% 29%
28%22%34%
34%30%
12%8%22% 15% 11%3%
6%
21% 4%
6%7%
6%
8%3%
6%11%8% 7%
5%8%
Q1 - 07 Q2 Q3 Q4 Q1 - 08 Q2 Q3 Q4 Q1 - 09 Q2 Q3 Q4 Q1 - 10 Q2
FX EquitiesCapital Markets SD and Other TCM
-2%
-3%

12
Lead arrangerUSD 2.1bn acquisition of Intergraph July 2010
Nordic expansion gaining momentum
Lead managerNOK 4bn rights issue May 2010
Joint bookrunnerDKK 5.5bn rights issue June 2010
Lead managerSEK 600-700m IPO June 2010
12
Over 40 new large corporateclients
Hired 40 new professionals
Leading advisor in the Nordic IPO market during 2010
Largest market share (9.1%) on the Nordic Stock Exchange
Development outside Sweden

13
Inst
itutio
nsC
orpo
rate
s
No.1 equities market share in Nordics & Baltics
Strong net sales within Wealth
Best Trade Bank Western Europe
3.8%4.8%
6.2%
6.6%
9.1%
No. 1 ECM bank in the Nordics in H1 2010
Best Brokerage Firm Nordic Countries
Customers in focusLarge corporates and institutions
SEB’s The Benche.com
10.214.1 17.2
H1-08 H1-09 H1-10
SEK bn
World Expo China
1,2571,266
1,4952,378
1,048
EUR m
Best performance in German real estate funds
Best investment bank in Finland
13

14
SMEs
Customers in focusPrivate and SME customers in Sweden
Priv
ate
323,000 customers in “Enklavardagen” (+7%)
Number of card transactions up 11%
iPhone application launched
Increased availability
Increased market share on net sales Swedish Mutual Funds: 12% (10% FY 2009)589 new private banking clients YTD“Modern” Investment Programmes continue to attract new volumes
Established corporate centersin Stockholm, Gothenburg and Malmö
Increased market share to 11% (10.7): 3,000 net new corporate payment customers
SEK 76bn in lending (+9%)1
Assisting new entrepreneurs
14
1) Including real estate-related lending, excluding one man businesses
15
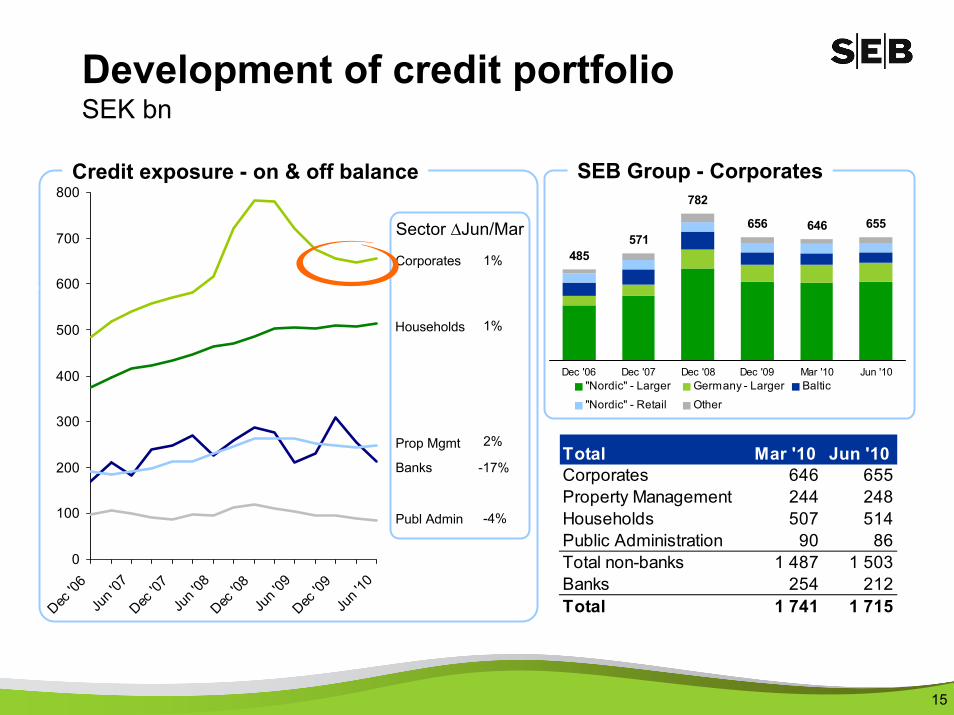
485571
782
656 646 655
Dec '06 Dec '07 Dec '08 Dec '09 Mar '10 Jun '10"Nordic" - Larger Germany - Larger Baltic
"Nordic" - Retail Other
Households
Banks
Prop Mgmt
Publ Admin
Corporates
Credit exposure - on & off balance
Sector ∆Jun/Mar
1%
1%
-17%
2%
-4%
SEB Group - Corporates
Total Mar '10 Jun '10Corporates 646 655Property Management 244 248Households 507 514Public Administration 90 86Total non-banks 1 487 1 503Banks 254 212Total 1 741 1 715
0
100
200
300
400
500
600
700
800
Dec '0
6Ju
n '07
Dec '0
7Ju
n '08
Dec '0
8Ju
n '09
Dec '0
9Ju
n '10
Ass
et Q
ualit
y
Development of credit portfolioSEK bn

16
Swedish asset qualityPrivate CorporateSEB mortgage lending (SEK bn)
218 229 247 260
Q4-08 Q2-09 Q4-09 Q2-10
7% interest rate stress test 80% first lien capStricter amortisation policy
Stricter mortgage policy since Q4-09
0-50% 76%
51-80% 21%
>80% 3%Loan-to-value Share of portfolio
Robust domestic marketStrong export trend Shifting gears and hiring people
Turnaround in corporate sentiment
Corporate bankruptcies in Sweden1)
1) Source: UC
16
2,534 2,5943,848 3,305
H1-07 H1-08 H1-09 H1-10
-14%
SEB corporate lending (SEK bn)
Swedish credit loss level at 5 bps
265 256 221 222
Q4-08 Q2-09 Q4-09 Q2-10

17
528
21
1,716
873994
403
35296
28
1,154
52
602
1,923
117
-226
2,381
433127
Collective Provisions Specific Provisions Net Write-offs
Q1 '09 Q2 '09 Q3 '09Q4 '09 Q1 '10 Q2 '10
By type, SEK m
Baltic net credit losses2009 – 2010
Q3-09
Previous communication on asset quality
Q4-09
Reasons for lower credit lossesFurther macroeconomic stabilisationHousehold repayment capacity better than expectedEstonian Euro accession a morale boosterPositioned for a more normalised economic climate

18
Development of NPLsSEK bn
0
2
4
6
8
10
12
14
16
18
20
Q1 '09 Q2 Q3 Q4 Q1 '10 Q2 Q1 '09 Q2 Q3 Q4 Q1 '10 Q2 Q1 '09 Q2 Q3 Q4 Q1 '10 Q2
Nordic Germany Baltics
Individually assessedPortfolio assessed
Non-performing loans
13.8% of lending
0.4% of lending
1.0% of lending
19
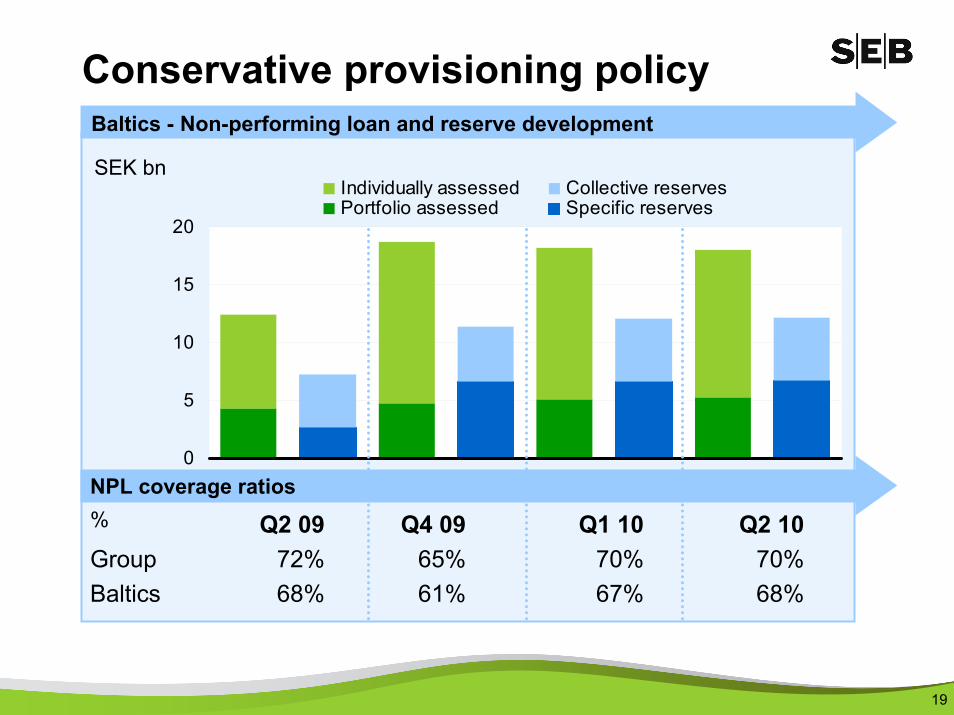
Conservative provisioning policy
Q2 09 Q4 09 Q1 10 Q2 10Group 72% 65% 70% 70%Baltics 68% 61% 67% 68%
NPL coverage ratios%
Baltics - Non-performing loan and reserve development
0
5
10
15
20
SEK bnIndividually assessed Collective reservesPortfolio assessed Specific reserves

20
NPLs & reservesSEB Baltic, June 2010, SEK m
Estonia Latvia Lithuania Total Δ Q2
Individually assessed loansImpaired loans, gross 1 773 3 409 7 561 12 743 -307Specific reserves 1 126 1 720 3 912 6 759 125Collective reserves 398 1 119 1 225 2 741 -172Specific reserve ratio 63,5% 50,5% 51,7% 53,0% 2,2%Total reserve ratio 85,9% 83,3% 67,9% 74,5% 1,3%
Portfolio assessed loansLoans past due > 60 days, gross* 1 091 2 377 1 792 5 260 161Collective reserves 581 1 287 772 2 640 133Reserve ratio 53,2% 54,2% 43,1% 50,2% 1,0%
Non-performing loans 2 864 5 786 9 353 18 003 -146Total reserves 2 107 4 143 5 977 12 227 91NPL coverage ratio 73,6% 71,6% 63,9% 67,9% 1,0%
Reserve ratio high and stable
*including restructured loans SEK 555m

21
Dec '09 Mar '10 Jun '10 ∆ Q2
Individually assessed loans Impaired loans, gross 13 932 13 050 12 743 -307Specific reserves 6 632 6 634 6 759 125Collective reserves 2 467 2 913 2 741 -172Specific reserve ratio 47,6% 50,8% 53,0% 2,2%Total reserve ratio 65,3% 73,2% 74,5% 1,3%
Portfolio assessed loans Loans past due > 60 days* 4 752 5 099 5 260 161
Collective reserves 2 267 2 507 2 640 133Reserve ratio 47,7% 49,2% 50,2% 1,0%
Non-performing loans 18 684 18 149 18 003 -146
Total reserves 11 416 12 136 12 227 91NPL coverage ratio 61,1% 66,9% 67,9% 1,0%
NPLs & reservesSEB Baltic, SEK m
*including restructured loans SEK 555m
22
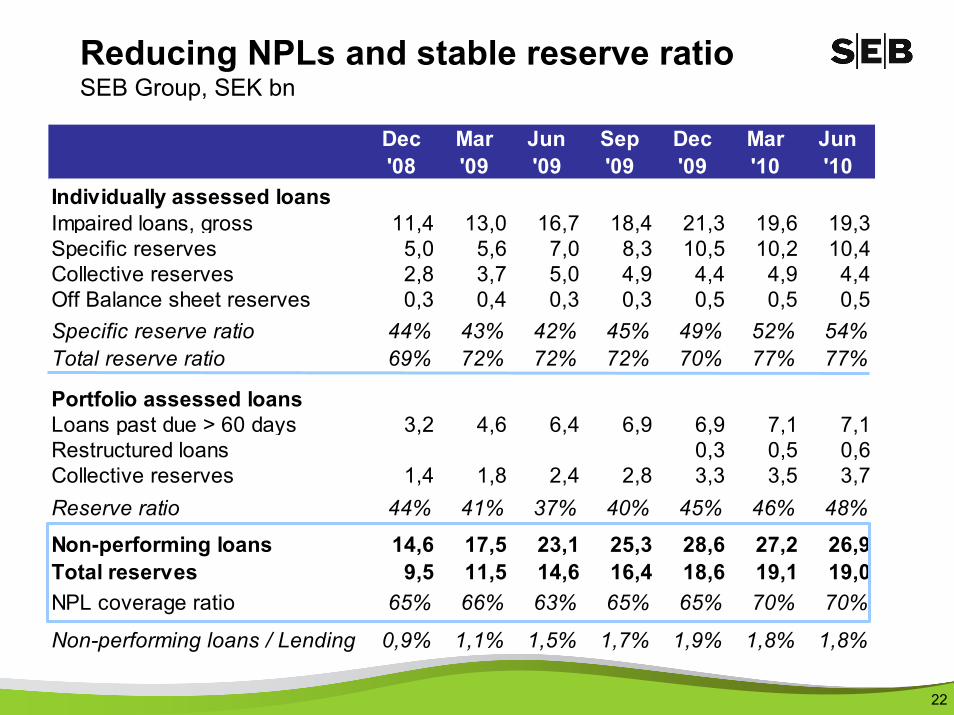
Dec '08
Mar '09
Jun '09
Sep '09
Dec '09
Mar '10
Jun '10
Individually assessed loansImpaired loans, gross 11,4 13,0 16,7 18,4 21,3 19,6 19,3Specific reserves 5,0 5,6 7,0 8,3 10,5 10,2 10,4Collective reserves 2,8 3,7 5,0 4,9 4,4 4,9 4,4Off Balance sheet reserves 0,3 0,4 0,3 0,3 0,5 0,5 0,5Specific reserve ratio 44% 43% 42% 45% 49% 52% 54%Total reserve ratio 69% 72% 72% 72% 70% 77% 77%
Portfolio assessed loansLoans past due > 60 days 3,2 4,6 6,4 6,9 6,9 7,1 7,1Restructured loans 0,3 0,5 0,6Collective reserves 1,4 1,8 2,4 2,8 3,3 3,5 3,7Reserve ratio 44% 41% 37% 40% 45% 46% 48%
Non-performing loans 14,6 17,5 23,1 25,3 28,6 27,2 26,9Total reserves 9,5 11,5 14,6 16,4 18,6 19,1 19,0NPL coverage ratio 65% 66% 63% 65% 65% 70% 70%
Non-performing loans / Lending 0,9% 1,1% 1,5% 1,7% 1,9% 1,8% 1,8%
Reducing NPLs and stable reserve ratioSEB Group, SEK bn
23
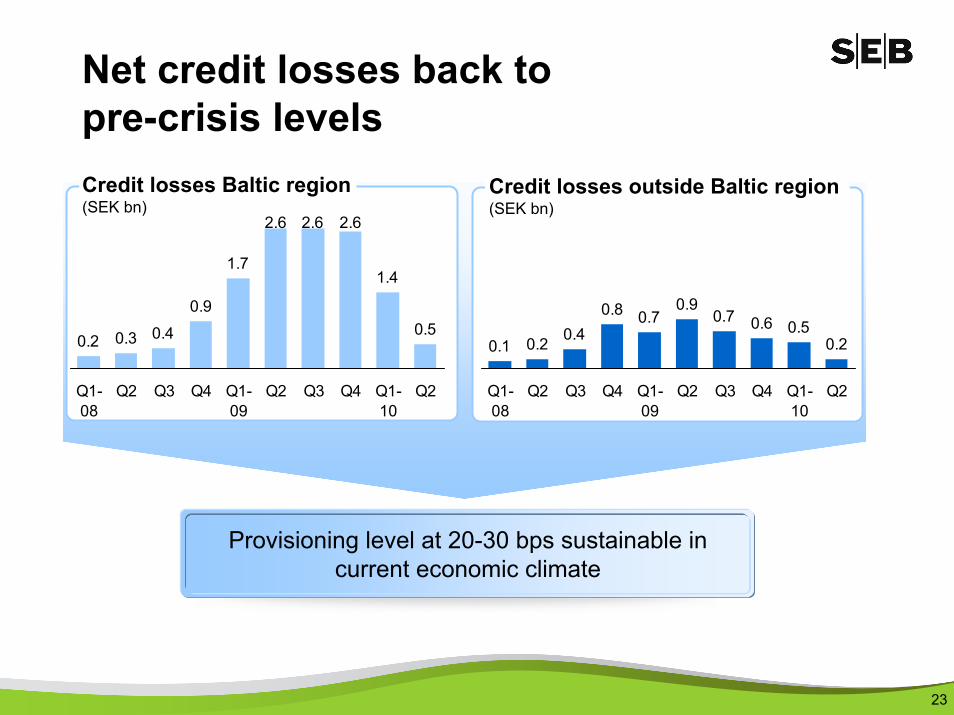
Net credit losses back to pre-crisis levels
Provisioning level at 20-30 bps sustainable in current economic climate
0.2 0.3 0.4
0.9
1.7
2.6 2.6 2.6
1.4
0.5
Q1-08
Q2 Q3 Q4 Q1-09
Q2 Q3 Q4 Q1-10
Q2
0.1 0.2 0.40.8 0.7
0.90.7 0.6 0.5
0.2
Q1-08
Q2 Q3 Q4 Q1-09
Q2 Q3 Q4 Q1-10
Q2
Credit losses Baltic region(SEK bn)
Credit losses outside Baltic region (SEK bn)
24
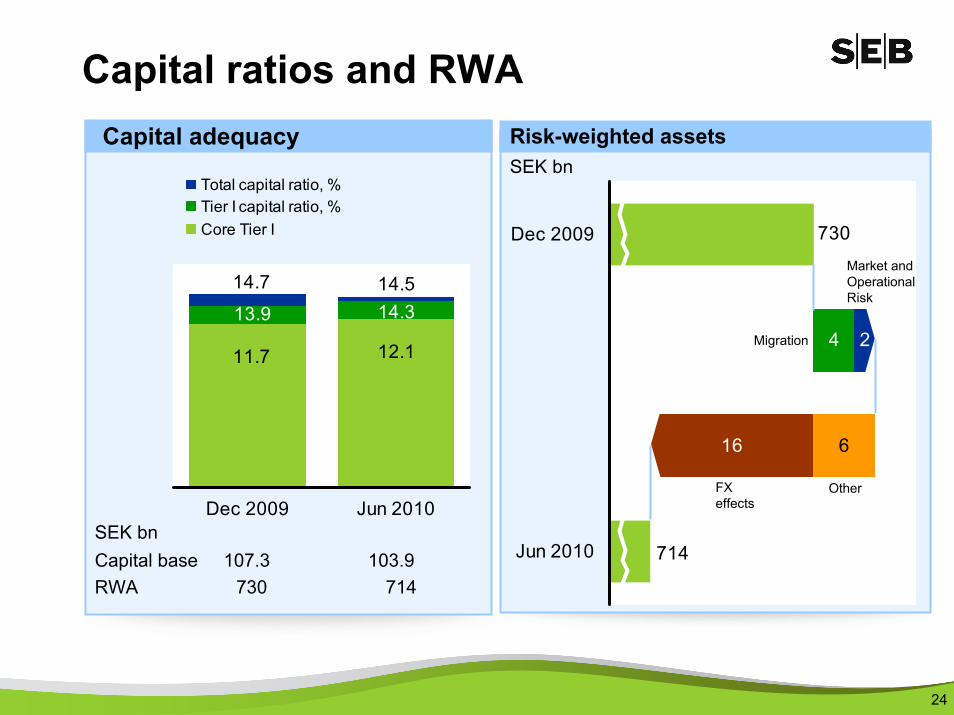
Capital ratios and RWA
13.9 14.3
12.111.7
14.514.7
Dec 2009 Jun 2010
Total capital ratio, %Tier I capital ratio, %Core Tier I
Capital adequacy
SEK bnCapital base 107.3 103.9RWA 730 714
Risk-weighted assetsSEK bn
4
6
714
730
16
2
Dec 2009
Jun 2010
Migration
Market and OperationalRisk
FX effects
Other

25
Loans to deposits ratio; %*
Net liquidity position
SEB’s matched funding horizonMonths
100%120%140%160%180%200%
2001 2003 2005 2007 2009 Q22010
155%
NB: Increased due to volatile repo volumes
0
5
10
15
20
25
Q4-07
Q2-08
Q4-08
Q2-09
Q4-09
Q2-10
Loans to deposit ratio excl repos, %*
100%120%140%160%180%200%
2001 2003 2005 2007 2009 Q22010
142%
*excl re-classified bonds

26
Diversified wholesale funding structureSEB Group, SEK 589bn, June 2010
Senior debt Sweden 16%
Public Covered Bonds Germany
12%
Mortgage Covered Bonds Germany 7%
Subordinated debt 6%
SSD and Reg Bonds Germany
3%
Senior debt Germany 1%
Mortgage Covered Bonds Sweden 26%
CPs/CDs 29%

27
Long-term fundingMaturity profile
-120
-100
-80
-60
-40
-20
0<1Y 1-2Y 2-3Y 3-4Y 4-5Y 5-7Y 7-10Y >10Y
Subordinated Debt Senior Unsecured Covered Bonds non SEK, Swe Mortgage Pfandbriefe, GerCovered Bonds SEK, Swe Public Pfandbriefe, Ger
SEK bn
Actions● <1yr maturities of sub and senior unsecured debt prefinanced in 2009● <1yr maturities of SEK covered bonds are gradually bought back and new bonds are issued● New funding markets ● Marketing of Swedish covered bonds outside of Sweden jointly with our friendly competitors

28
Funding raised with original maturity > 1 year SEK bn
Instrument 2008 2009 Q1 2010 Q2 2010 Q3 2010*Yankee CD 5.9 3.05 0.0 1.2 0.7Senior unsecured SEB AG 2 5.2 0.2 0.0 0.0Senior unsecured SEB AB 37.4 60.4 3.7 0.0 7.1Structured bonds 13.4 8.3 1.1 1.8 0.1Covered bonds SEB AG 29.7 24.4 4.2 0.7 0.5Covered bonds SEB AB 72.9 25.7 0.0 22.9 13.0Hybrid tier 1 4.7 3.3 0.0 0.0 0.0Total 166.0 130.4 9.1 26.6 21.4
*Until August 27

29
Strategic alignment of SEB’sGerman business
Strategicrationale
Financial ratios will improve
Retail banking business
discontinued
173 branches
1 million customers
~2,000 employees
C/I: +4 units
Core Tier 1: +50 bps
ROE: +60bps
Subject to regulatory approvals, expected closing around year-end 2010
Completes strategic alignment
Santander ideal partner
29

30
Targeting selected Mittelstandclients
Build on strong real estate track-record and Merchant Banking to increase customer acquisition
Increased productivity, e.g. IT integration with SEB Group
3030
SEB Germany after divestmentFinancials are expected to improve significantly in the medium term
Merchant Banking
AssetMgmt
Supportfunctions
Pro-forma operating profit (SEKbn)
Pro-forma effects on continuing business
Focus going forward
1.0 1.3 1.10.7
2007 2008 2009 H1 2010
0.6
0.9
Pro-forma
Actual
Cost/income ratio
10%
0%
Pro-forma
Actual
Return on business equity
3131
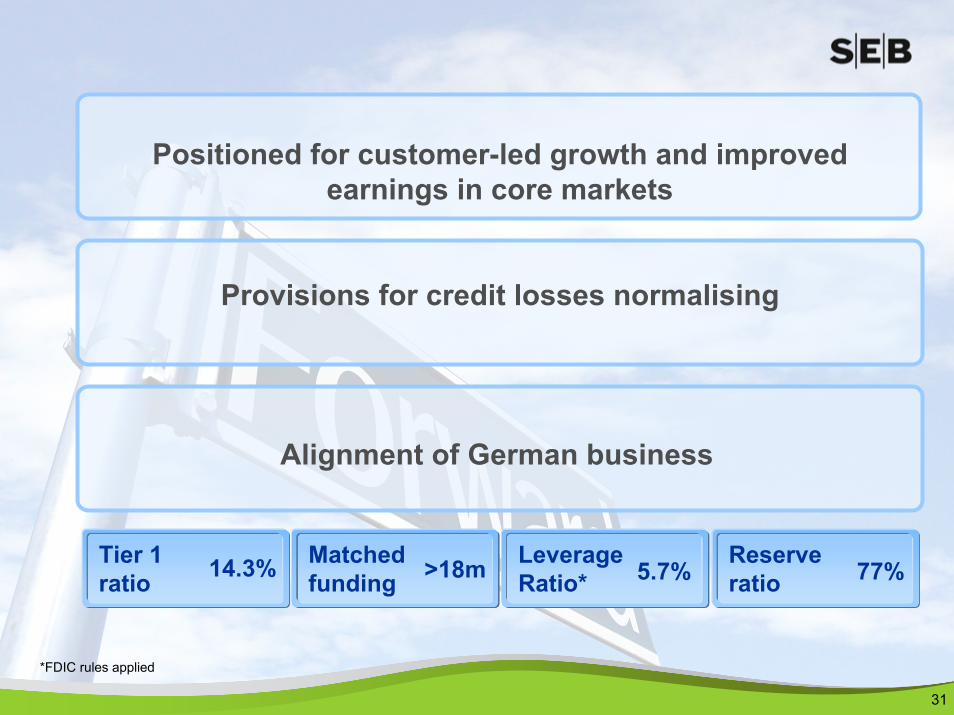
Alignment of German business
Provisions for credit losses normalising
Positioned for customer-led growth and improved earnings in core markets
Tier 1Tier 1 ratio
Tier 1Matched funding
Tier 1Leverage Ratio*
Tier 1Reserve ratio14.3% >18m 77%5.7%
*FDIC rules applied

3232