restarts of venture capital-backed firms: evidence …
TRANSCRIPT
RESTARTS OF VENTURE CAPITAL-BACKED FIRMS:
EVIDENCE FROM THE US SOFTWARE INDUSTRY
By
JEANA LOBDELL
A THESIS
Presented to the Lundquist College of Business
and the Robert D. Clark Honors College in partial fulfillment of the requirements for the degree of
Bachelor of Arts
June 2014
An Abstract of the Thesis of
Jeana Lobdell for the degree of Bachelor of Arts in the Lundquist College of Business to be taken June 2014
Title: Restarts of Venture Capital-Backed Finns: Evidence from the US Software Industry
Approved: ltar£lt?,t.~~~i Professor Rosemarie H. Ziedonis
The venture capital (VC} industry is a game of"home runs," with a few
lucrative exits compensating investors for the many ~'strike outs" along the way
(Gompers and Lerner 2001}. Consistent with this view, finance scholars report that
VCs aggressively prune weaker startups in their investment portfolios to re-allocate
resources to their more likely winners (Puri and Zarutski 2012}. Using data on VC
backed software startups, I nonetheless find many numerous instances where distressed
startups "restart" rather than cease operations. I investigate broader trends affecting the
financing opportunities of software startups and compare characteristics of restart and
non-restart finns within the sector. To complement this quantitative analysis, I conduct
three case studies that illuminate the factors that could lead finns to be in a "restart
situation" and the actions taken to tum around these fledgling companies.
ii

iii
Acknowledgements
I would like to thank both Professor Rosemarie Ziedonis and Professor Arvids
Ziedonis for helping be shape and examine the topic of restarts throughout this entire
process. Their wealth of knowledge, patience, and constant consideration is something
I will be eternally grateful for. I would also like to thank Professor Casey Shoop for his
willingness to serve as my CHC Representative for this thesis. Finally, I am grateful to
all my friends and family who helped support me through this entire process. This
would not have been possible without any of your time and support.
iv
Table of Contents
I. Introduction 1
II. Background 3
Failure of Entrepreneurial Ventures 3
Internal Sources of Failure 5
External Indicators of Failure 6
III. Quantitative Analysis 8
Analysis of Internet Bubble and Effects on VC Investments in Software Startups 8
Startup-Level Data and Sample Construction 9
Geographic Distribution of Software Startups and Restarts 11
Analysis of Exit Outcomes 13
Comparison of Restart and Non-Restart Firms 14
V. Qualitative Analysis 17
Constant Contact 18
Qpass 20
Omneon Video Networks 21
VI. Discussion and Conclusion 23
Summary of Findings 23
Limitations and Further Research 25
Conclusion 26
VIII. Tables and Figures 28
Table 1. Distribution of Overall Sample 28
Table 2. Restart and Non-Restart Initial Comparison 28
Table 3. Non-Restart Firms: Initial Descriptive Statistics 28
Table 4. Restart Firms: Initial Descriptive Statistics 28
Table 5. Non-Restart Firms: Geographic Statistics 29
Table 6. Restart Firms: Geographic Statistics 29
Table 7. Geographic Distribution Concentrating in California 29
Table 8. Non-Restart: Founding Year Statistics 29
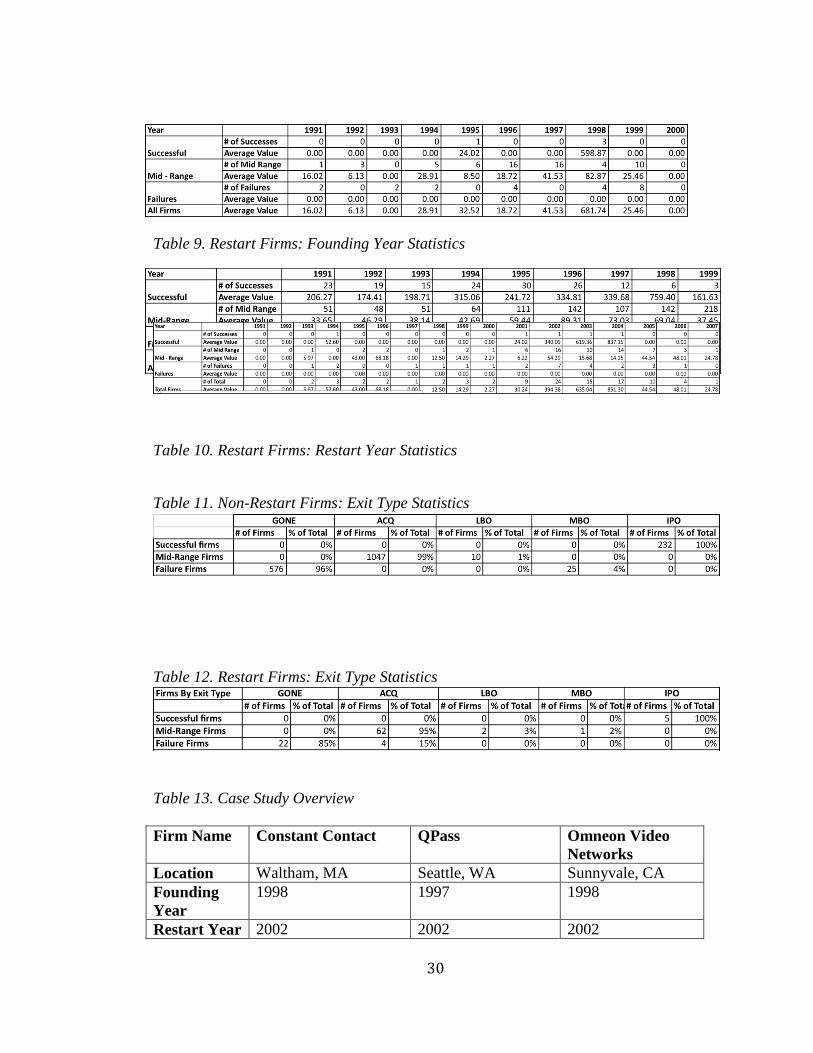
Table 9. Restart Firms: Founding Year Statistics 30
Table 10. Restart Firms: Restart Year Statistics 30

v
Table 11. Non-Restart Firms: Exit Type Statistics 30
Table 12. Restart Firms: Exit Type Statistics 30
Table 13. Case Study Overview 30
Figure 1. The “Internet Bubble” as Evidenced by the Nasdaq Index 32
Figure 2. US Venture Capital Investments in Software Startups, 1995-2012 32
Figure 3. Annual Percentage Change in VC Investments in Software Startups, 1995-2011 33
Figure 4. VC-backed Software Startups by Year Established, 1991-1999 33
Figure 5. Software “Restarts” in the Sample, 1991-2009 34
Figure 6. Silicon Valley vs. All California Venture Capital Investments 34
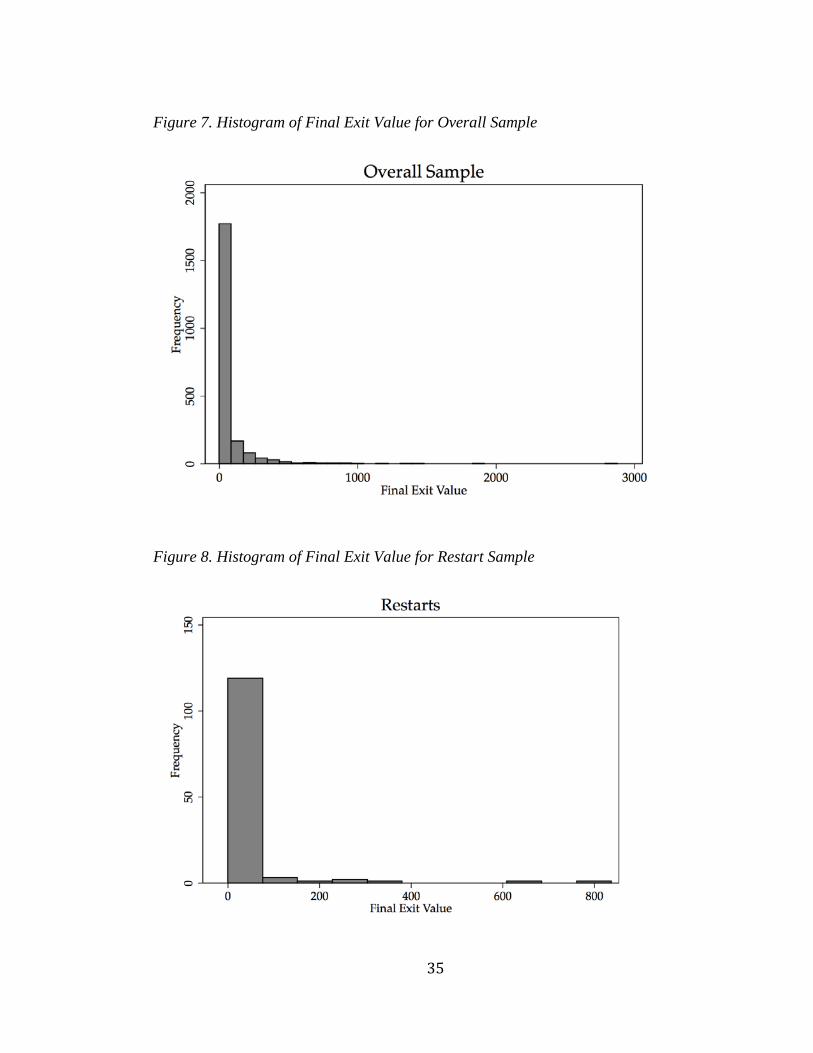
Figure 7. Histogram of Final Exit Value for Overall Sample 35
Figure 8. Histogram of Final Exit Value for Restart Sample 35
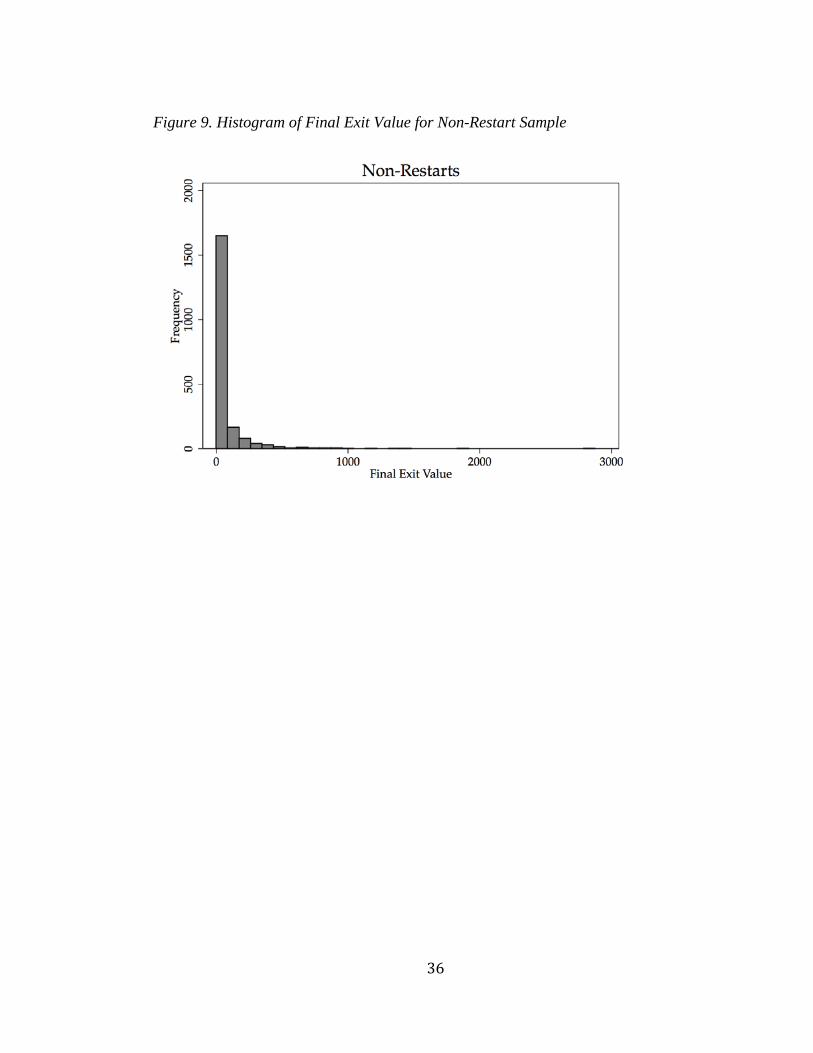
Figure 9. Histogram of Final Exit Value for Non-Restart Sample 36
VII. Bibliography 37

I. Introduction
In the troubled economic times of the 1930s, Joseph Schumpeter extolled the
entrepreneur as the “hero” of capitalism. The eminent economist concluded that,
entrepreneurs—through their innovative activities and “new combinations” of
resources—were responsible for the “creative destruction” of existing industries and
played a vital role in the dynamism of capitalistic economies (Schumpter 1950). Eighty
years later entrepreneurs are seen as no less critical to the economy, especially in
technology intensive industries (Kauffman 2013).
Despite the vital role of entrepreneurship at the economy-level, founding a new
firm and navigating the pitfalls of the market remains a risky and challenging endeavor.
Failure is an ever-present shadow. Of particular importance, entrepreneurs can find it
difficult to secure the capital required to bring new ideas to market. In science and
technology-based industries, where the path to commercialization is uncertain and
costly, entrepreneurs depend critically on venture capital (VC) investors for sources of
funding (Gompers and Lerner 2004). Even then, the venture capital industry is
commonly portrayed as a game of “home runs,” with a few lucrative exits compensating
investors for many “strike-outs” along the way (Gompers and Lerner 2001). Consistent
with this view, finance scholars report that VCs aggressively prune weaker startups in
their investment portfolios to re-allocate resources to their more likely winners (Puri
and Zarutskie 2012).
This thesis investigates an under-explored phenomenon within the
entrepreneurship literature: VC-backed startups seemingly en route to failure that
“restart” rather than cease their operations. Using data on VC-backed software startups,
2
I find many numerous instances where distressed startups restart rather than disband. I
investigate broader trends affecting the financing opportunities of software startups and
compare characteristics of restart and non-restart firms within the sector. To
complement this quantitative analysis, I conduct three case studies that illuminate the
factors that could lead firms to be in a “restart situation” and the actions taken to turn
around these fledgling companies.
The thesis is organized as follows. Section II provides background information
on the entrepreneurial process and highlights sources of potential friction between
entrepreneurs and their VC investors. Section III reports my quantitative analysis. The
Internet bubble and its subsequent collapse was a pivotal economic event affecting
technology startups, including but not limited to VC-backed software companies. To set
the stage for the analysis that follows, I investigate this event and consider its
implications for the supply of venture capital available for software startups. I then turn
to my firm-level analysis, where I compare restart and non-restart firms on several
observable dimensions and analyze potential differences in the ultimate fates of these
companies.
To gain additional insights on why a software company might become a “restart”
(i.e., encounter a severe devaluation event yet continue operations in new form) and to
illustrate actions taken in the post-restart period, I supplement the quantitative analysis
with three case studies in Section IV. I discuss the main findings from my study and the
opportunities they provide for future research in Section V, the concluding section.

3
II. Background
Failure of Entrepreneurial Ventures
Entrepreneurship has been defined as an activity that
“Involves the discovery, evaluation, and exploitation of opportunities to introduce new goods and serves, ways of organizing markets, processes, and raw materials through organizing efforts that previously had not existed…”
in short, entrepreneurship involves exploiting the unknown (Shane 2003, p. 4). A
critical step in the entrepreneurial process is the recognition of viable economic
opportunities within this unknown. Where do these opportunities come from? One
perspective, originally espoused by Hayek (1945), views these opportunities as arising
from an individual’s unique access to information. Entrepreneurs’ “local knowledge,”
or access to industry specific or opportunity specific information that is not readily
available allows them to exploit opportunities that would be unrecognized by others
without such information (Shane 2003). On the other hand, Schumpeter argued that
changes in the technological, political, and economic environments are necessary to
create an entrepreneurial opportunities (Shane 2003). Schumpeter’s perspective views
entrepreneurship as a rare occurrence as these environmental changes occur less
frequently than do opportunities through the availability of local information.
Notwithstanding the origins of an entrepreneurial opportunity, once formed,
entrepreneurial firms must secure the capital and resources required to grow the
business, a task that can be especially difficult in technology-intensive industries.
Investors may be reluctant to invest in such companies for several reasons. A prime
4
cause is it may be difficult to secure outside financing is that entrepreneurship often
results in failure, as “failure and entrepreneurship are natural siblings” (Mantere 2013).
The prevalence of entrepreneurial failure has been documented in numerous studies.
For example, in a study of 1,091 Canadian inventors seeking to commercialize their
inventions, Åstebro (2003) found that only seven percent achieved commercialization.
This success rate is in contrast to the twenty-seven percent probability of commercial
success of research and development projects in established firms (Mansfield et al.
1977).
Even if investors are knowledgeable of the likelihood of failure and willing to
embrace this risk, information gaps between the entrepreneur and the potential investor
may make it difficult to raise funds. One deterrent is the classic “lemons” problem
(Akerlof 1970)—if an entrepreneur is better informed about an opportunity than a
potential investor, investors will be concerned that the opportunity is a “lemon,” and be
either unwilling to invest or expect a premium on their returns. This, in turn, will
discourage entrepreneurs, even with promising opportunities, from seeking outside
investment.
Investors may also be concerned about “moral hazard,” or deleterious actions
that entrepreneurs make take after receive funding that would be counter to their
original agreement or expectations (Gompers and Lerner 2001).
One market mechanism that has arisen to address these “failures” in the market
for new venture financing is the rise of the venture capital firm. According to Mason
and Harrison (1995), venture capital is “an activity by which corporate investors
provide long-term equity finance, supported by business skills, to unquoted companies

5
with the potential to grow rapidly with the aim of making an eventual capital gain
commensurate with the high risk and illiquidity involved in the investment rather than
interest income or dividend yield.”
Venture capital firms possess expertise and resources that enable them to
critically understand the investment opportunity and reduce asymmetric information
between the entrepreneur and investor. VCs monitoring the activities of entrepreneurial
firms in their investment portfolios through several means, including membership on
the board and frequent site visits (Gompers and Lerner, 2001; Hellmann and Puri, 2002).
To motivate teams while also safeguarding against actions that could devalue their
investments, VCs also sequence their investments across rounds of financing—waiting
to release additional funds until milestones have been met (Gompers 1995). By using
these mechanisms to overcome many of problems inherent in the new-venture financing
process, venture capital firms play a critical role in realization of entrepreneurial
opportunity (Metrick and Uasyda 2010).
Despite these advantages that venture capitalists possess in the evaluation and
financing of entrepreneurial opportunities, almost two out of every three firms with
venture capital funding either do not generate positive revenue or ever break even
Hadzima (2007). Furthermore in a study of 22,000 VC-backed from 1987 to 2008,
fifteen percent were liquidated or went bankrupt, and another nineteen percent expected
no return to investors (Kauffman 2013).
Internal Sources of Failure
As discussed above, entrepreneurial firms, even those backed by venture capital
firms, face low success rates. Nevertheless, determined individuals frequently pursue
6
their entrepreneurial goals despite these low odds, and for them, entrepreneurship often
represents a personal journey. Identifying successful entrepreneurs based on their
personal traits, however, is difficult, as those who fail often possess similar traits to
those who succeed (Ucbasaran 2008). Whether successful or not, however, these traits
can play a role in the development of the entrepreneurial team that works cohesively
and effectively. Problematic internal dynamics or behavioral issues are often major
contributors to the decline and failure of entrepreneurial firms.
Overconfidence and the presence of asymmetric information between insiders
and external constituencies are two other problems often common among failed firms.
Optimism is a widely recognized as a necessary trait for successful entrepreneurship:
“Realists will have withdrawn from entrepreneurship…though not all optimists necessarily become entrepreneurs, all entrepreneurs will be optimists” (Arabsheibani, et al. 2000).
While the confidence by entrepreneurs is often essential to overcome the many
obstacles that they often face, it can also lead to their downfall (Lowe and Ziedonis
2006). Åstebro (2003) found that fully half of 1,091 Canadian inventors creating
inventions of low quality persisted in developing projects despite negative expert
recommendations to abandon the commercialization effort.
External Indicators of Failure
External and environmental factors can also put pressure on entrepreneurial
firms and lead to failure. A prominent example is the “money chasing deals” era of the
late 1990s, when an unprecedented amount of funding flowed into VC investing
(Gompers and Lerner 2001). The widespread availability of VC funding make it easier

7
for firms to secure capital and remain in business. In the quantitative analysis below, I
explore, in more detail, a related event—the Internet bubble and its subsequent
collapse—and consider its implications for the software startups in my sample.
8
III. Quantitative Analysis
The Internet bubble and its subsequent collapse was a pivotal economic event
affecting technology startups, including but not limited to VC-backed software
companies. To set the stage for the analysis that follows, I therefore first investigate
this event more closely and consider its implications for the supply of venture capital
available for software startups. I then define my data sources, explain the types of firms
included in the sample, and clarify the method used to identify the subset of “restarts.”
After describing overall trends within the sample, I compare restart and non-
restart firms on several observable dimensions and analyze potential differences in the
ultimate fates of these companies. To gain additional insights on why a software
company might become a “restart” (i.e., encounter a severe devaluation event yet
continue operations in new form) and to illustrate actions taken in the post-restart period,
I supplement the quantitative analysis with three case studies in the section that follows.
Analysis of Internet Bubble and Effects on VC Investments in Software Startups
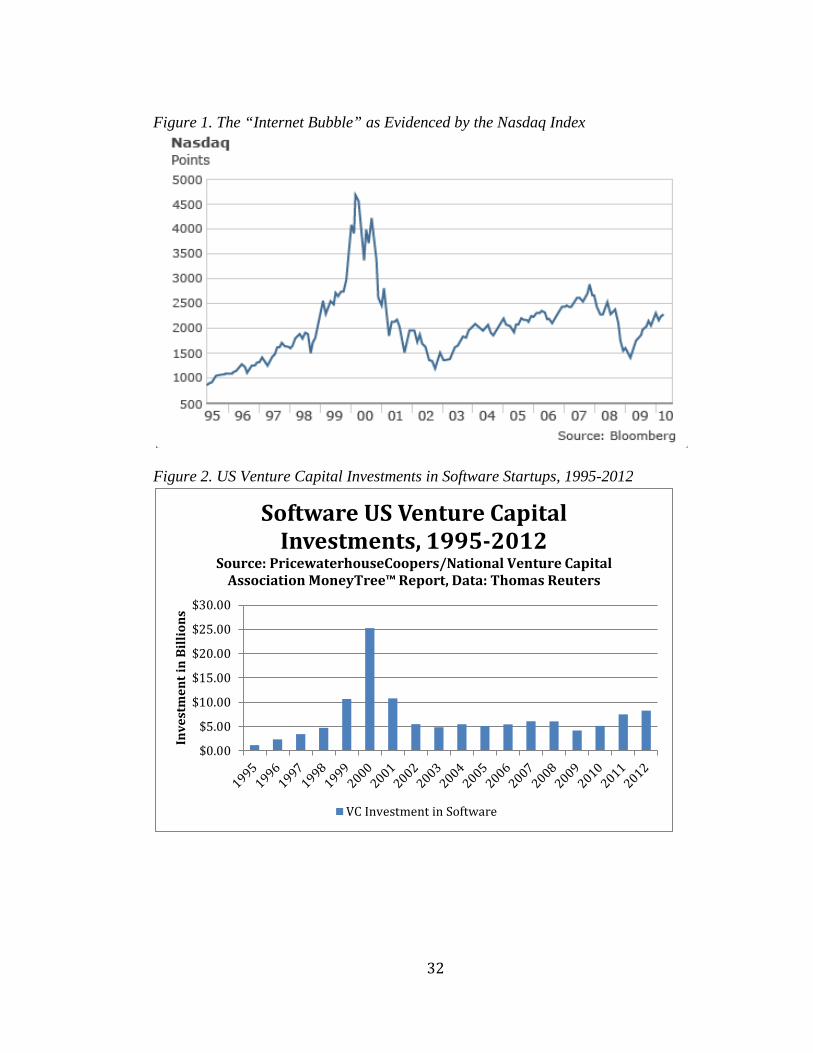
The collapse of the Internet “boom years” is often evidenced by trends in the
Nasdaq index, where shares of leading technology companies such as Apple Inc. and
Google Inc. are traded (e.g., see Madsien 2008). As shown in Figure 1, the Nasdaq
index climbed steeply in the late 1990s to a height of 4691 on March 24, 2000. By
2002, however, most of those gains had been lost.
Figure 2 reveals even larger swings in annual VC investments in the software
sector during the 1998-2002 period. Between 1998 and 2000, annual VC investments in
software surged from $5B to a peak of $26B in 2000, a more than five-fold increase.
9
The annual supply of VC funds to software startups fell back to pre-boom levels of $5B
by 2002, where it remained through the end of that decade.
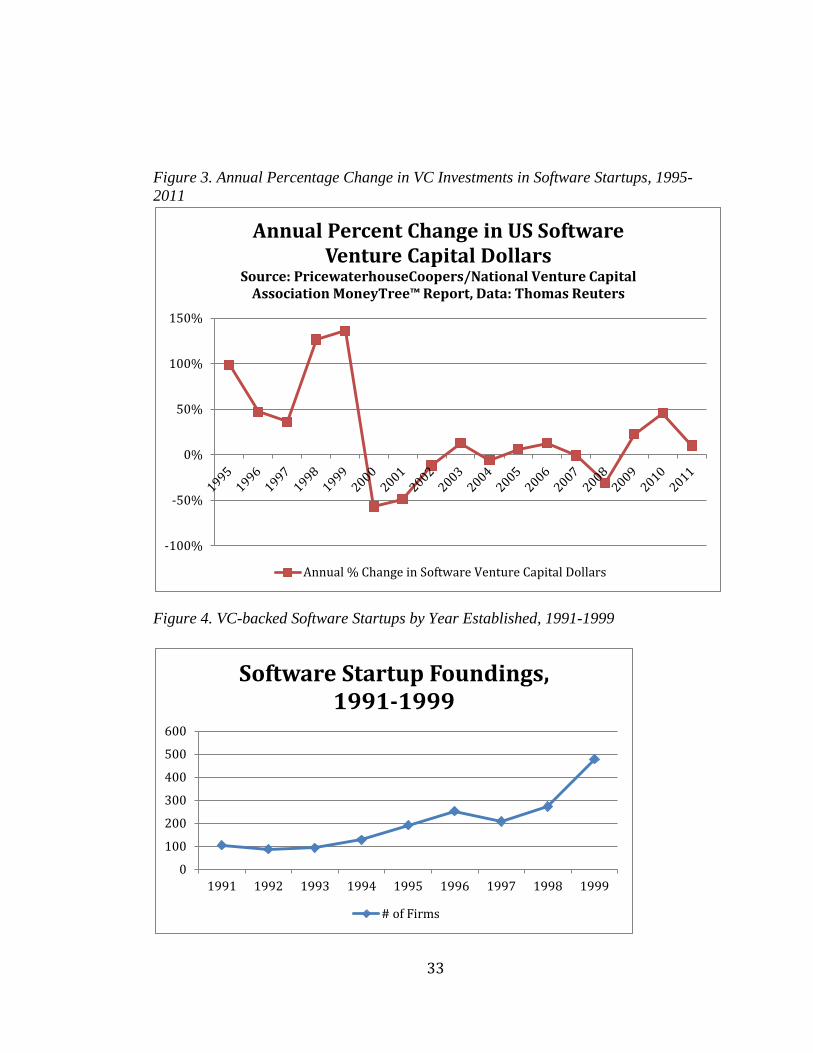
The volatility in annual VC spending in software is particularly striking in
Figure 3, which plots annual percentage changes in investment levels. After large
increases prior the year 2000, the supply of VC funding to software startups declined by
over 50% in this year alone, followed by another 50% decline in the following year. A
large-scale study by Gompers et al. (2008) finds a high correlation between the value of
shares in public equity markets and levels of VC investments. The authors also report
that trends in VC investing tend to follow public equity markets with a short lag but
with steeper up-and-down patterns. In combination, the evidence from Figures 1-3
mirrors these prior findings.
Startup-Level Data and Sample Construction
I now turn to my firm-level quantitative analysis. Data for this study comes from
Dow Jones VentureSource, an agency that monitors the funding of venture capital
activity of all VC-backed firms in the United States1. Data provided to me for purposes
of this thesis covers VC-backed software startups founded between 1987 and 1999 that
received at least one round of venture capital by 2008.
VentureSource was first established in 1986. Although the agency provides
information about startups founded prior to 1986, Gompers and Lerner (2004)
recommend omitting observations prior to 1987 when use of VentureSource data due to
under-reporting bias. Restricting attention to startups founded prior to 2000 provides an
1 Professors Rosemarie and Arvids Ziedonis provided me access to these data through a research-use agreement with VentureSource.
10
8-year “window” to trace what happens to these firms both before and following the
collapse of the Internet bubble.
For each company, I observe its founding year, the state in which its headquarter
locations is based, the year of a “restart” round (if any), and information about the
company’s status as of 2008 (e.g., failed? had IPO? acquired?) and its reported value at
exit.2 The sample consists of 2,133 US-based software startups founded between 1987
and 1999, all of which had exited in some fashion (whether via IPO/acquisition or
liquidation) by 2008.
To identify “restarts,” I rely on categories from VentureSource. More
specifically, the vendor defines restarts as firms suffering a “significant” decline in
value at the funding round, or a “down round.” VentureSource does not disclose the
threshold of “significant” in this context, but reports that the value of existing shares in
the company is typically “washed out.” Based on VentureSource’s classification, I find
that 128 firms with “restarts,” which represents 6% of all firms within the sample.
Despite significant devaluations, these firms continue operations in new form rather
than closing down and disbanding outright.
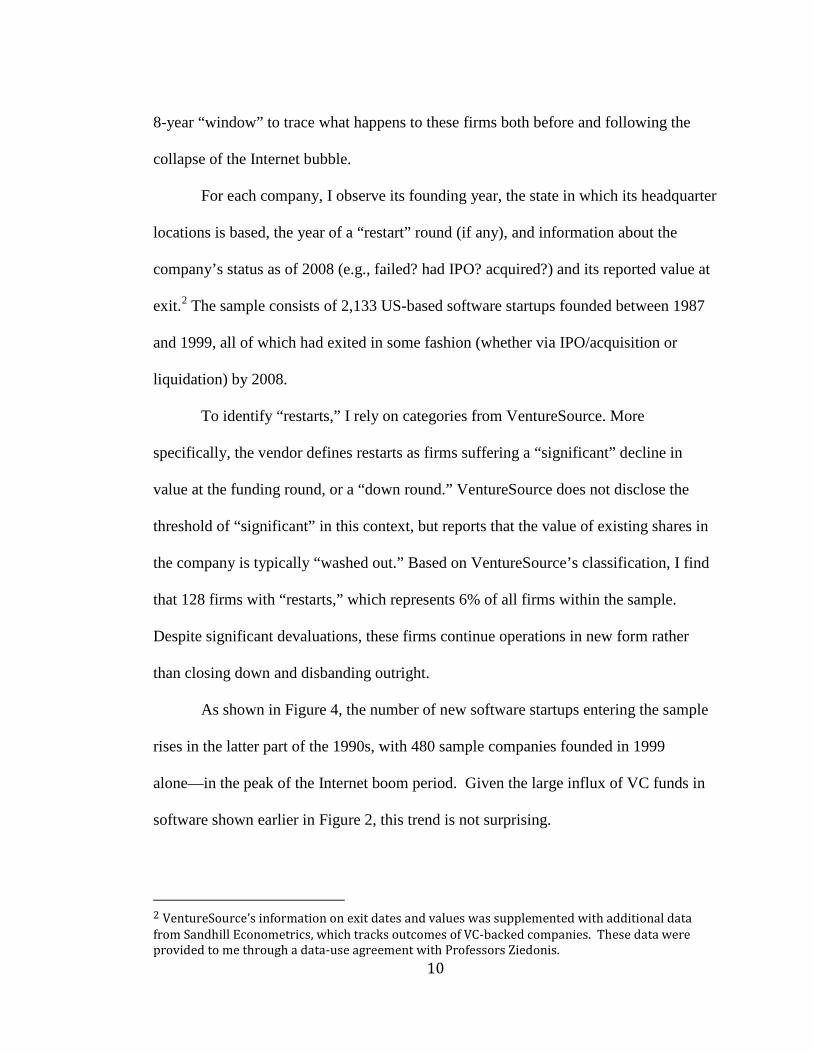
As shown in Figure 4, the number of new software startups entering the sample
rises in the latter part of the 1990s, with 480 sample companies founded in 1999
alone—in the peak of the Internet boom period. Given the large influx of VC funds in
software shown earlier in Figure 2, this trend is not surprising.
2 VentureSource’s information on exit dates and values was supplemented with additional data from Sandhill Econometrics, which tracks outcomes of VC-backed companies. These data were provided to me through a data-use agreement with Professors Ziedonis.
11
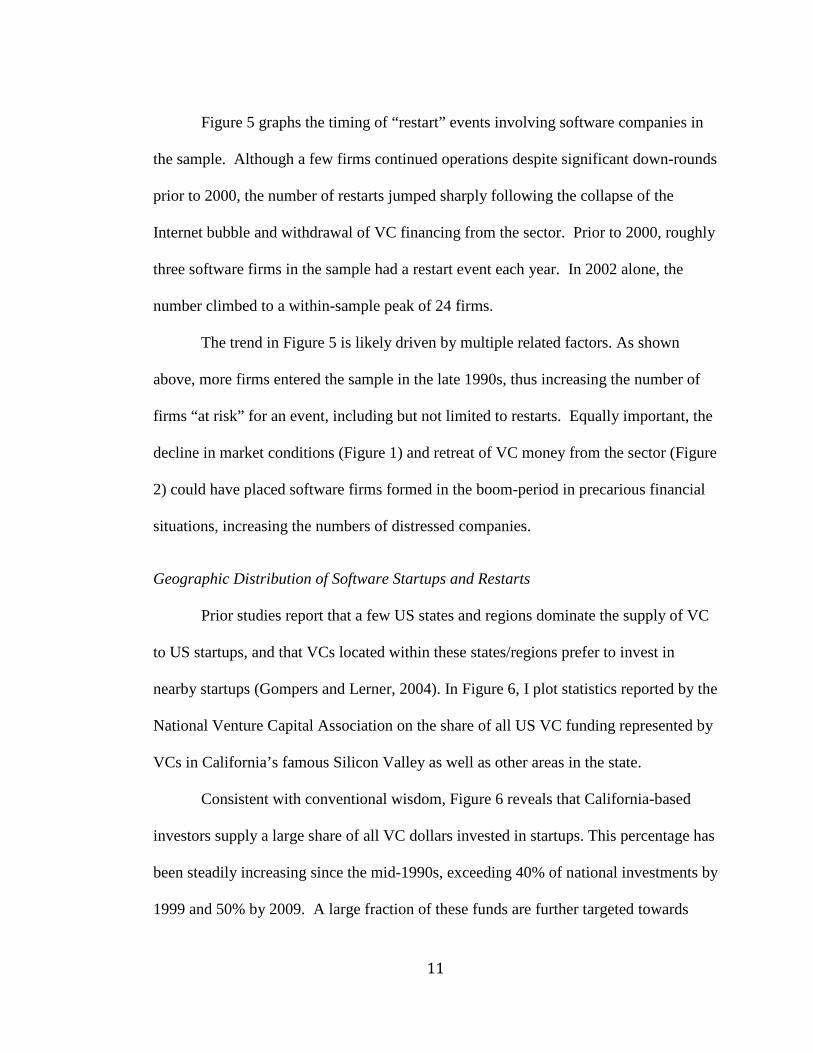
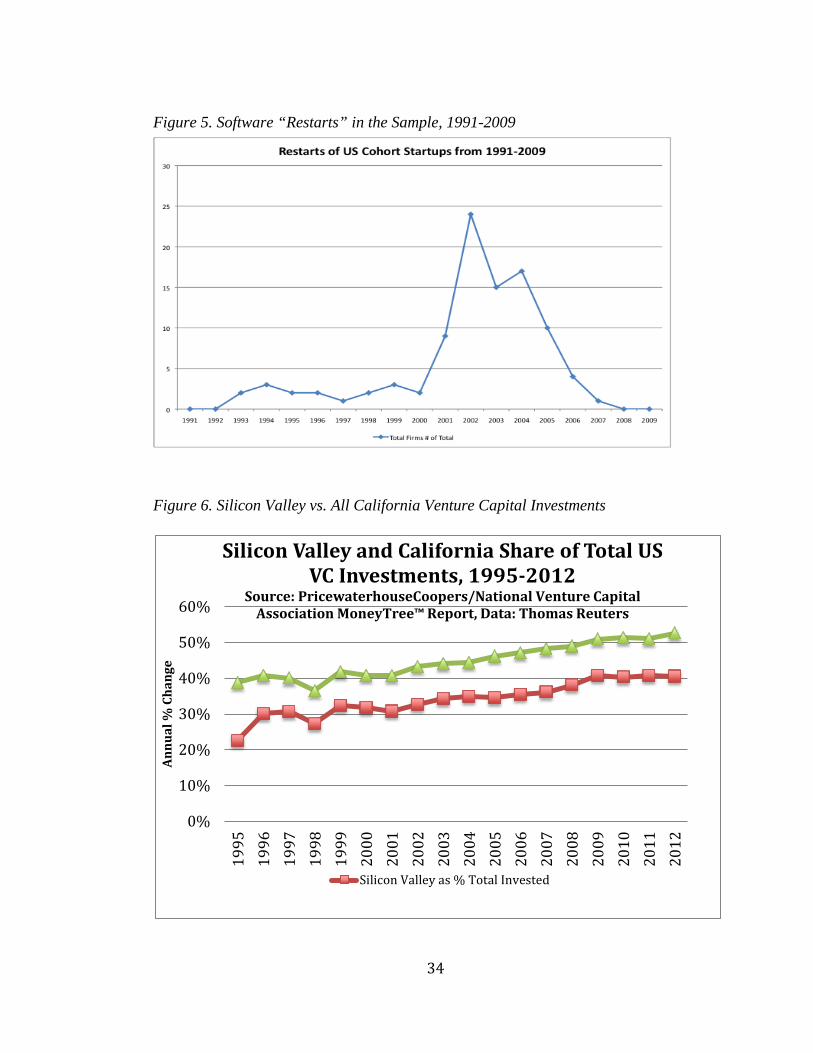
Figure 5 graphs the timing of “restart” events involving software companies in
the sample. Although a few firms continued operations despite significant down-rounds
prior to 2000, the number of restarts jumped sharply following the collapse of the
Internet bubble and withdrawal of VC financing from the sector. Prior to 2000, roughly
three software firms in the sample had a restart event each year. In 2002 alone, the
number climbed to a within-sample peak of 24 firms.
The trend in Figure 5 is likely driven by multiple related factors. As shown
above, more firms entered the sample in the late 1990s, thus increasing the number of
firms “at risk” for an event, including but not limited to restarts. Equally important, the
decline in market conditions (Figure 1) and retreat of VC money from the sector (Figure
2) could have placed software firms formed in the boom-period in precarious financial
situations, increasing the numbers of distressed companies.
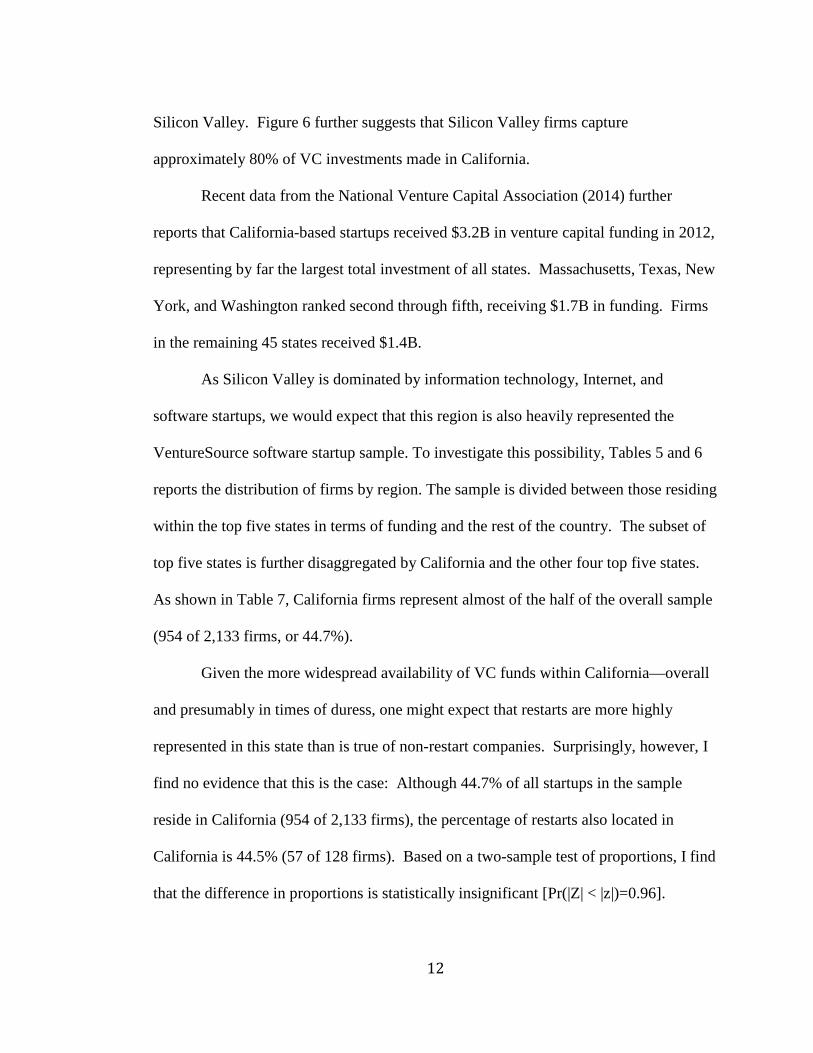
Geographic Distribution of Software Startups and Restarts
Prior studies report that a few US states and regions dominate the supply of VC
to US startups, and that VCs located within these states/regions prefer to invest in
nearby startups (Gompers and Lerner, 2004). In Figure 6, I plot statistics reported by the
National Venture Capital Association on the share of all US VC funding represented by
VCs in California’s famous Silicon Valley as well as other areas in the state.
Consistent with conventional wisdom, Figure 6 reveals that California-based
investors supply a large share of all VC dollars invested in startups. This percentage has
been steadily increasing since the mid-1990s, exceeding 40% of national investments by
1999 and 50% by 2009. A large fraction of these funds are further targeted towards
12
Silicon Valley. Figure 6 further suggests that Silicon Valley firms capture
approximately 80% of VC investments made in California.
Recent data from the National Venture Capital Association (2014) further
reports that California-based startups received $3.2B in venture capital funding in 2012,
representing by far the largest total investment of all states. Massachusetts, Texas, New
York, and Washington ranked second through fifth, receiving $1.7B in funding. Firms
in the remaining 45 states received $1.4B.
As Silicon Valley is dominated by information technology, Internet, and
software startups, we would expect that this region is also heavily represented the
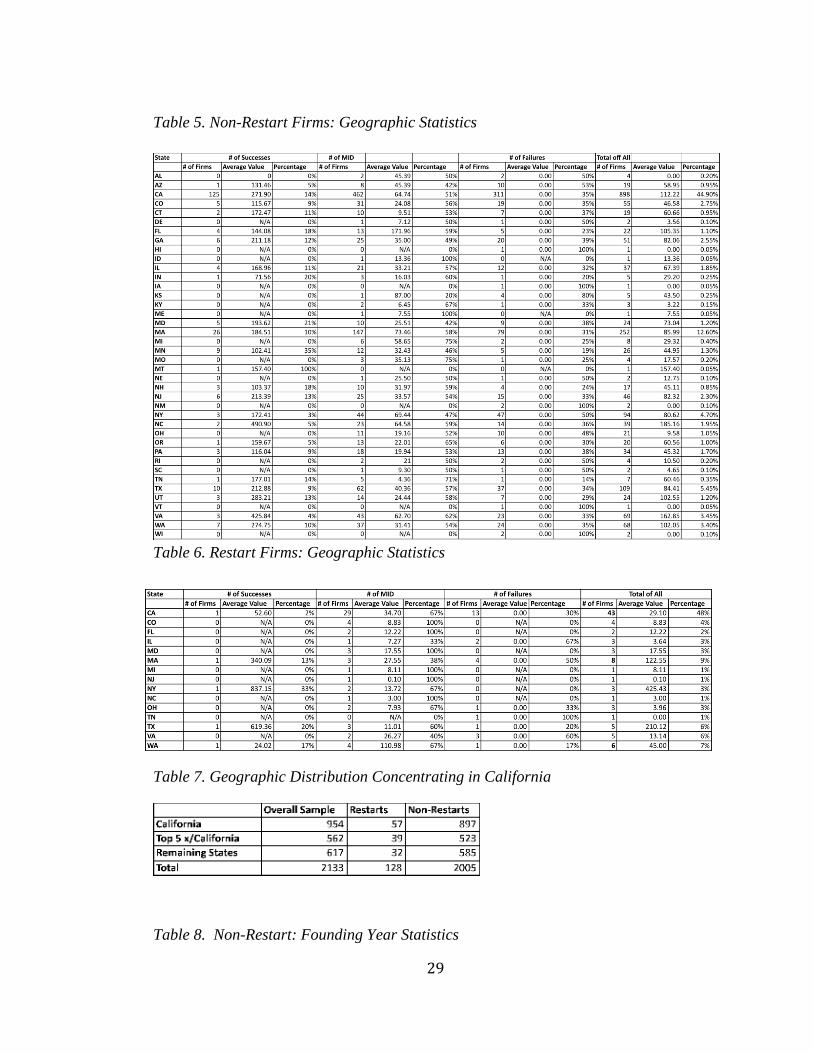
VentureSource software startup sample. To investigate this possibility, Tables 5 and 6
reports the distribution of firms by region. The sample is divided between those residing
within the top five states in terms of funding and the rest of the country. The subset of
top five states is further disaggregated by California and the other four top five states.
As shown in Table 7, California firms represent almost of the half of the overall sample
(954 of 2,133 firms, or 44.7%).
Given the more widespread availability of VC funds within California—overall
and presumably in times of duress, one might expect that restarts are more highly
represented in this state than is true of non-restart companies. Surprisingly, however, I
find no evidence that this is the case: Although 44.7% of all startups in the sample
reside in California (954 of 2,133 firms), the percentage of restarts also located in
California is 44.5% (57 of 128 firms). Based on a two-sample test of proportions, I find
that the difference in proportions is statistically insignificant [Pr(|Z| < |z|)=0.96].
13
At first glance, this result is puzzling. Restarts face significant set backs yet
somehow are able to secure the funds required to continue operations. Since VC funds
are more plentiful in CA relative to other states, it is reasonable to expect that restart
firms are more likely to reside within this resource-rich state relative to the broader
population of startups. My inability to discern this effect could be due to superior
capabilities of CA-based VCs in the early pruning of potential strikeouts, as
documented in prior studies (e.g., Hellmann and Puri, 2002; Puri and Zarutski, 2012).
In principle, one could disentangle these explanations if characteristics of these
companies could be better tracked at common intervals in time. For example, one could
estimate whether a startup backed by CA investors is more likely to fail outright rather
than having an opportunity to “restart” relative to comparable startups backed by VCs
from other states. Since my data provided information at only certain snapshots in time,
such an analysis is infeasible in the context of this study.
Analysis of Exit Outcomes
In the final part of my quantitative analysis, I trace the ultimate outcomes of
restart companies and compare them with non-restart firms within the sample.
VentureSource reports several types of “exits” for startups, ranging from outright
“failure,” or termination of operations, to exits via acquisition (ACQ) and other forms
of buy-out, to the filing of initial public offerings (IPO).
For non-restarts, identifying the exit event is straightforward as type of exit and
value is clearly identified in the VentureSource data. For restarts however, identifying
final value is less straightforward. Although VentureSource identifies these firms, they
are coded as terminated at the “first” exit event. The data include however, histories
14
subsequent to the initial exit. One-hundred twenty-seven restarts report a second “exit”
event and exit value at this time, and one restart went through a second restart event and
reports a third exit value. For restarts, therefore, I utilize the value of the firm at the
second or (third) exit event as the final exit value.
Although it is possible that startups may remain private, VCs funds tend to
liquidate and return funds to investors within ten years of the establishment of a fund
(Puri and Zarutskie 2012). Thus, it is unusual that a VC-backed firm would not exit
within ten years. Indeed, in my sample, there are no firms that remain private at the end
of 2008—all firms have exited the sample in one of the modes discussed above.
To make more direct comparisons among firms, I create three categories of exit
outcomes: (a) “successful,” (b) “mid-range,” and (c) “failed” firms based on their final
valuation at exit. Successful firms are defined as those that exit with an IPO filing. An
IPO is the goal of most VCs and typically results in the greatest value for founders and
investors (Gompers and Lerner 2004). “Mid-range” firms, or firms deemed moderately
successful, are defined as those with positive exit values (typically through an
acquisition) but that did not have an IPO. Finally, failed firms are defined as those that
disbanded or that had a final exit value of zero.
Comparison of Restart and Non-Restart Firms
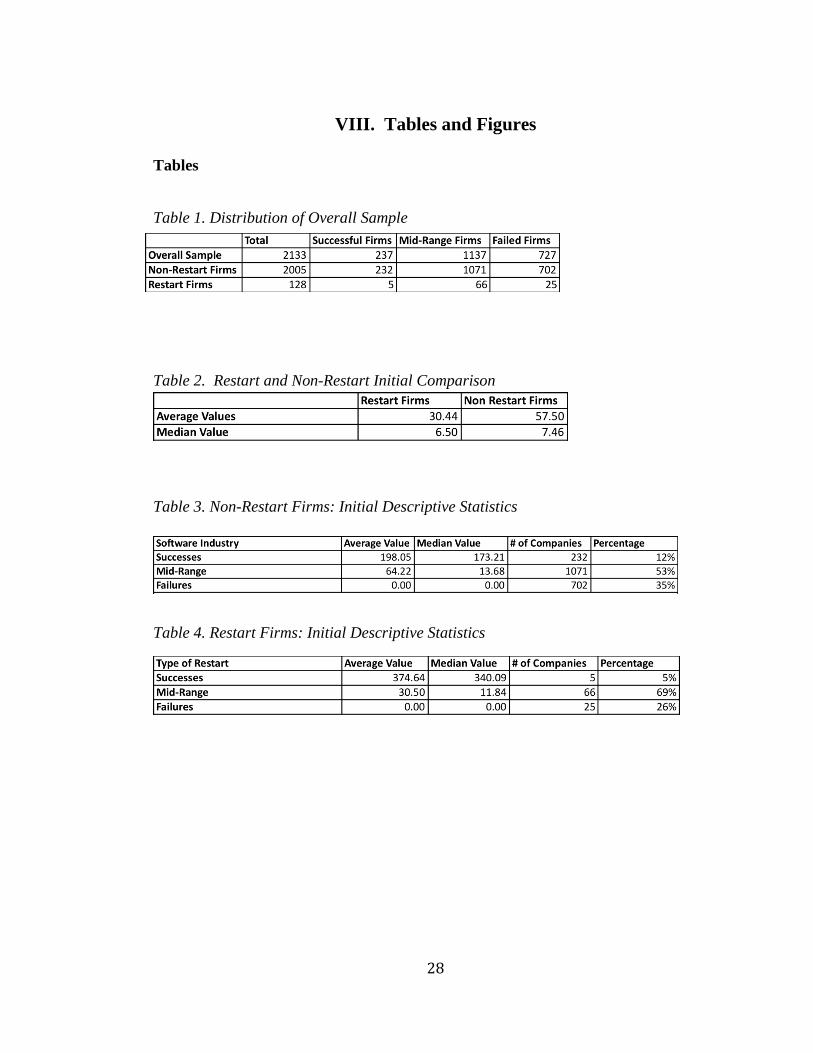
Of the 2,133 software startups in my sample, more than half of the firms (1,137,
or 53%) exited with “mid-range” outcomes, typically through acquisition. Of the
remainder, 727 firms (34%) failed while 237 (11.1%) reached IPO.
Tables 11 and 12 compare the exit success of restarts with non-restarts. The
most obvious difference between the groups is in IPO outcomes. Among non-restarts in
15
the sample, over 11% had IPOs. In contrast, IPOs were far more rare among restarts,
representing the ultimate outcome for only 3.9% of the restart sample. A two-sample
test of proportions reveals that this difference is highly significant [Pr(|Z| < |z|)=0.008].
This is the first indication that restart firms as a group do less well on average than
firms that do not undergo a restart.
Turning next to valuation, the mean exit value of the entire sample of firms is
$55.88M. The 2,005 non-restart firms report a higher mean value of $57.50 million at
exit while restarts averaged a value of $30.44M. This difference is statistically
significant at the 5% level based on a two-tailed t-test assuming unequal variances.
Figure 7 shows a histogram of final exit values for the entire sample, and reveals
a highly skewed distribution. Numerous firms exit the sample with a final value of zero
while a few firms exit with values exceeding $1M. Figures 8 and 9 show similar
patterns for restart and non-restart firms. These patterns are consistent with the notion
that VC investing is a game with few “home runs” and many “strike-outs” (Gompers
and Lerner 2001). This pattern is also consistent with the low fraction of successfully
commercialized inventions reported by Åstebro (2003).3
Given the skewed nature of the exit-value distribution, I test for differences in
median exit values since mean values could be misleading. Median tests are also less
affected by outlier observations, such as the few home-run successes visible in my
sample. As reported in Table 2, median exit value for both the entire sample and for
non-restarts is $7.00M. For restarts, the median exit value is much lower, at only
3 Skewed value distributions have been shown to exist in many innovative contexts. For example Scherer and Harhoff (2000) examined various proxies of value for a sample of 994 US and German patents and found that depending on the measure, just 10% of the sample generated between 48% and 93% of total value.
16
$3.70M. A two-sample Wilcoxon rank-sum test reveals that this difference between
restarts and non-restarts in median exit value is statistically significant at the 1% level
(Pr > |z| =0.001).
Based on these tests, it appears that restart firms tend to do less well than do
firms that have not suffered a significant down round in value during financing rounds.
On the one hand, this result could stem from “selection” (Furman and Stern 2011). By
definition, restarts are firms that have encountered significant devaluations. Given this
fact, it is logical to conclude that these firms are in more precarious financial situations
than the broader pool of startups from which they are drawn. On the other hand, there
could be something about the restart process itself, such as a change in management,
onerous financial terms imposed by new investors, or another artifact of the procedure
that hinders the firm going forward. Although I am unable to test between these
explanations with my data, these results suggest interesting questions that could be
explored more fully in follow-on studies.
17
V. Qualitative Analysis
The quantitative analysis presented in the previous section found that restarts are
found in the most active areas of venture capital funding of startups, but are equally
well represented throughout the country. Despite the sophistication of California VCs,
restarts appear to be no more likely to occur in that state than elsewhere. Restarts,
however, were found to exit at a lower median value than did non-restarts. The analysis
was unable, however, to identify factors that could contribute to this lower final exit
value. The purpose of the qualitative analysis conducted in this section is to examine
more closely several cases within the data to identify factors that could have led to their
distress and subsequent outcomes.
Ideally, such an inductive approach would select cases that represent both
successes and failures of restarts. Selecting only successful restarts could impose a
“selection bias” and result in erroneously attributing a particular factor or action to a
successful outcome (Eisenhardt 1989). Unfortunately, obtaining information on “failed”
restarts has proven to be difficult. News reports and documentation of successful
restarts is much more readily available. The three selected cases are those for which I
was able to find information. The case studies are based upon a compilation and
analysis of the news articles, company statements, narrative accounts and other public
information.
The three companies selected for analysis are Constant Contact of
Massachusetts, QPass from Washington, and Omneon Video Networks of California.
Geographically, they collectively represent three of the top five states that received
venture capital. Each firm was able to avoid termination as an ultimate fate. Constant

18
Contact achieved an IPO of $340M while the other two firms were acquired at
valuations near $275M.
Despite the large valuations at exit, each of these three firms faced challenges
that led to a value decline and subsequent restart. And each was able to undertake
actions that allowed it to “turn things around.” Table 13 summarizes the challenges and
responses by each firm. Below I discuss the three restarts in more detail.
Constant Contact
Constant Contact is a restart firm based in Waltham, Massachusetts. The idea
underpinning this entrepreneurial venture is the insight by Gail Goodman, the founder
and CEO, that the rise of social media would spur demand by small businesses for a
modern print shop that manages marketing communications and customer relationships
(“Globe 100”). As Constant Contact’s mission statement states,
“Constant Contact®, Inc. wrote the book on Engagement Marketing™ — the new marketing success formula that helps small organizations create and grow customer relationships in today's socially connected world. Through its unique combination of online marketing tools and free personalized coaching, Constant Contact helps small businesses, associations, and nonprofits connect and engage with their next great customer, client, or member” (“About Constant Contact”).
According to Goodman, Constant Contact targets small businesses, typically around 10
employees. These customer firms pay a monthly subscription for access to Constant
Contact’s software-based tools to organize their social media and conduct online
marketing (“Globe 100”).
In a speech at the TedxBeaconStreet event in December 2013, Goodman
described several of the challenges that Constant Contact encountered in growing the
19
company. She highlighted significant obstacles in creating an effective leadership style,
learning how to effectively scale-up the business, and how to find and exploit
competitive advantages (Goodman 2013b). She further outlined the need for founders
to reevaluate their contribution styles and roles, as their current styles often impeded the
growth of the company. She argued that as the firm grows, the founders (and especially
the CEO), needed to be able to switch focus and see the larger picture. Goodman found
that she often was preoccupied on areas of the business that were already operating
smoothly while neglecting other areas needing her attention. To combat this tendency,
Goodman instituted an anonymous unfiltered feedback system. This feedback allowed
her to become aware of the areas that others saw to be lacking and bridge the
informational gap between not only herself and her employees, but with the company’s
investors as well.
Constant Contact also needed to reevaluate its business plan in order to succeed
within the marketplace and establish profitable margins. Prior to receiving venture
capital, Constant Contact expected to sell shares at a price point of fifteen dollars, which
would have left slim margins, and a very high breakeven point. By following the
advice of investors, however, Constant Contact was able to build an increasingly sound
plan to achieve profitability over time (Goodman 2013a). Before the correction, this
major flaw in their financial analysis caused the firm to twice come close to disbanding
(Kirsner). By revising its business plan and improving informational flow with its
investors, Constant Contact was able to avoid failure, however. These changes
eventually led to an initial public offering of the company for $340M. Achieving an
IPO could only be accomplished by bridging internal as well as external informational
20
and strategic problems, thus attracting new investors such as Greylock Partners, who
funded Constant Contact’s restart with an investment of $10 million (Garland).
Qpass
Constant Contact’s challenges consisted primarily of lack of informational flow
among the leadership and a flawed business model. QPass, a Seattle-based software
firm, faced similar issues but on a much different scale. Bo Wandell founded QPass in
1997 as a platform for media firms to sell content over the Internet (Soto 2002).
According to its website:
“QPass solutions and services are the critical infrastructure required to operate premium services businesses profitably, with the agility required to fully capture new opportunities, and with the sound business controls and processes required to scale operations efficiently.”
QPass saw a growing opportunity as the rise of the digital music industry generated
demand for selling and exchanging this music over the Internet. A difficult economic
environment, however, almost resulted in QPass’ failure.
QPass experienced both the exuberance running up to Internet bubble and the
deflation after it burst. In the late 1990s QPass gained significant investor funding only
to be impelled to lay off 75% of its workforce a short time later (Thurm 2004). This
drastic step resulted from the loss of almost 90% of its revenue and 28 out of 32 of its
dot-com clients in 2000 and 2001 due to the bursting of the Internet bubble (Soto 2002).
Due to this massive shock to the industry, QPass was forced to reevaluate its business
model and find a viable position within a devastated market. While the firm first hit
rock bottom in revenues and human capital losses, QPass managed to refocus its

21
offerings to a more profitable and diverse segment, providing business systems to
network operators (Duryee 2005).
The major shift in direction produced significant challenges in the time and
effort it took to redirect the company’s vision (Duryee 2005). QPass was also forced to
recapitalize and convince many of its existing investors to support this redirection while
simultaneously seeking additional financing from other investors. Over the course of a
difficult two years and through the drive and determination of it employees as well as a
complete shift in direction, QPass successfully restructured, recapitalized, and narrowed
its scope to a stable more profitable position following the shakeout of the internet
bubble. Qpass was eventually be acquired by Amdocs for $275 million in 2006
(Amdocs Inc. 2006).
Omneon Video Networks
The strategic shifts that helped to propel QPass into a profitable sector and away
from failure also played a significant role in the journey of Omneon Video Networks.
Three former Sony executives, Larry Kaplan, Ed Hobson, and Mike Gilbert, founded
Omneon in 1998, a software company that markets storage and networking servers to
television broadcasters to record, store, and edit news feeds for their clients (Business
Wire 2002).
Although pursuing a promising opportunity, Omneon faced complications with
delivery of its services. Initially after Omneon’s founding the company faced
significant delays in product development. A prototype was not ready for testing until
2000 (Dickson 2008). This delay caused considerable concern among investors and
other stakeholders, causing them to doubt the future success of Omneon.
22
The slow product development process stemmed from the inability of Omneon
to produce key components that would increase the attractiveness of its products in the
marketplace. For example, the firm faced difficulties in developing features that
enabled editing on multi channel servers, which was a key component of its product
value proposition (Business Wire 2003). Omneon eventually overcame its product
development difficulties by forming strategic alliances to obtain the necessary
development capabilities. For example, it formed an alliance with Editware to obtain
multichannel editing features (Business Wire 2003). Partnerships such as the one with
Editware allowed Omneon to reach beyond its existing capabilities to produce a unique
and superior product. The partnership with Editware is only one of the many alliances
Omneon created in order to overcome industry barriers and compensate for its own
weaknesses. As it gained capabilities, Omneon was finally able to overcome the costly
product development cycle that had been limiting its prospects. Media 100 acquired
Omneon in 2002 for $273M (Reuters 2002).
23
VI. Discussion and Conclusion
Summary of Findings
Throughout this study, the risky nature of entrepreneurship remains a constant
despite its vital role of entrepreneurship at the economy-level. For entrepreneurs,
failure remains a constant shadow causing the role of VC firms to become critical
sources for funding and guidance. Yet even the VC industry is filled with many “strike-
outs” and few “homeruns” (Gompers and Lerner 2001). Due to this reality, VC firms
often prune their portfolio to reallocate their resources to more promising firms (Puri
and Zarutskie 2012). By studying these pruned out firms, one encounters the
phenomenon of ‘restart’ firms. Rather than disband, following this significant loss of
capital, in numerous cases, as seen in the VentureSource data, these firms “restart” with
the backing of new investors and/or new management.
In order to investigate this under-explored phenomenon of ‘restart’ firms, this
thesis combines the use of both quantitative and qualitative analysis. The quantitative
analysis further investigates the impact of the “Internet bubble” and its subsequent
collapse as well as firm level dimensions which point to unique differences within these
firms. As previously stated the collapse of the Internet “boom” years led to a large
amount of volatility in annual VC investments as well, particularly in the software
industry. Within the sample of firms, the greatest amount of firms was established
during the peak of the Internet boom, 1999 (Figure 4). Furthermore, the greatest
number of “restarts” occurred following the collapse of the Internet bubble and the
withdrawal of VC investments, in 2002 (Figure 5).
24
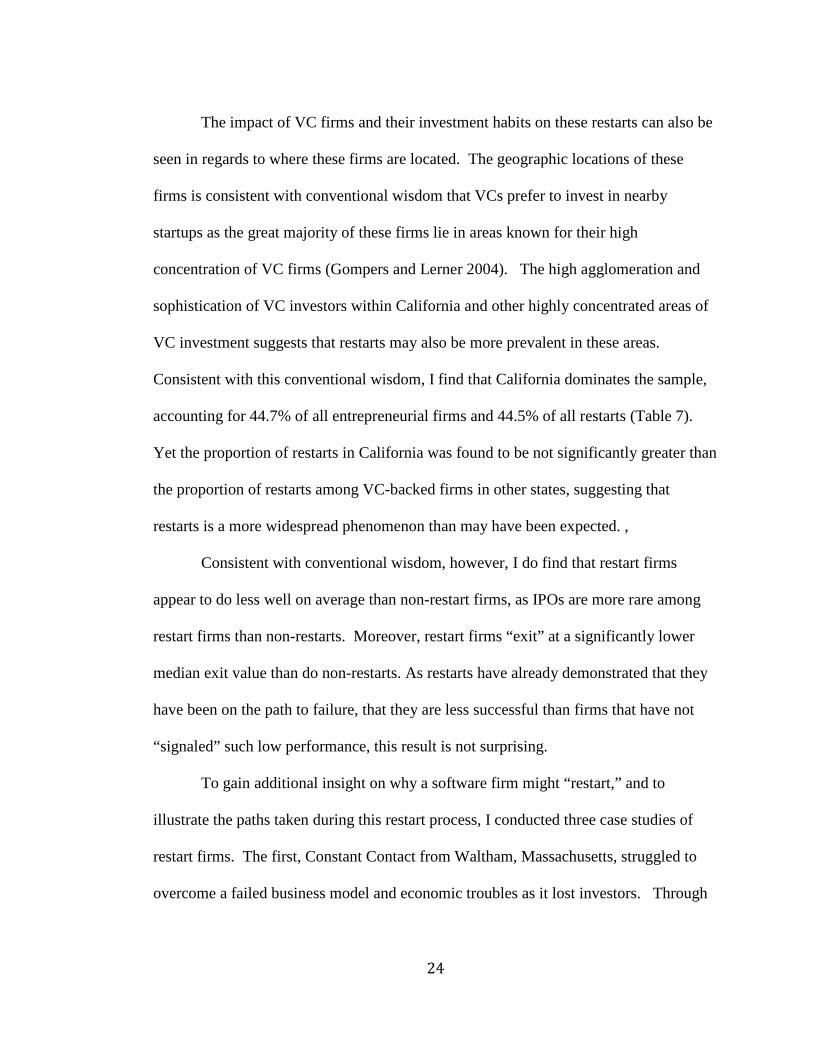
The impact of VC firms and their investment habits on these restarts can also be
seen in regards to where these firms are located. The geographic locations of these
firms is consistent with conventional wisdom that VCs prefer to invest in nearby
startups as the great majority of these firms lie in areas known for their high
concentration of VC firms (Gompers and Lerner 2004). The high agglomeration and
sophistication of VC investors within California and other highly concentrated areas of
VC investment suggests that restarts may also be more prevalent in these areas.
Consistent with this conventional wisdom, I find that California dominates the sample,
accounting for 44.7% of all entrepreneurial firms and 44.5% of all restarts (Table 7).
Yet the proportion of restarts in California was found to be not significantly greater than
the proportion of restarts among VC-backed firms in other states, suggesting that
restarts is a more widespread phenomenon than may have been expected. ,
Consistent with conventional wisdom, however, I do find that restart firms
appear to do less well on average than non-restart firms, as IPOs are more rare among
restart firms than non-restarts. Moreover, restart firms “exit” at a significantly lower
median exit value than do non-restarts. As restarts have already demonstrated that they
have been on the path to failure, that they are less successful than firms that have not
“signaled” such low performance, this result is not surprising.
To gain additional insight on why a software firm might “restart,” and to
illustrate the paths taken during this restart process, I conducted three case studies of
restart firms. The first, Constant Contact from Waltham, Massachusetts, struggled to
overcome a failed business model and economic troubles as it lost investors. Through

25
a change of leadership style and a refocused business model, however, Constant Contact
eventually rebounded and successfully completed an IPO for $340 million.
QPass from Seattle, Washington was the focus of the second case study. QPass’
troubles stemmed from maintaining too broad a product scope, and were exacerbated by
the collapse of the Internet bubble. Despite reaching rock bottom, however, QPass was
able to narrow its scope, undergo additional reforms, and as a result gain new investors.
Eventually Amdocs acquired the company for $275 million (Amdocs Inc. 2006).
Finally, Omneon Video Networks of Sunnyvale, CA faced significant product
development setbacks and subsequent loss of investors, initially due to poor
communication with investors and other stakeholders. Through strategic partnerships
and increased efforts on communication, Omneon was able to develop a marketable
product. Media 100 Inc. subsequently acquired the company for $273 million (Reuters
2002).
Limitations and Further Research
This investigation of restart firms is subject to several limitations. While my
quantitative analysis has illuminated similarities and differences between restart and
non-restart firms, I am unable to identify causal factors that may account for these
differences. To do so would require the identification and testing of explanatory
variables.
The qualitative case studies, while informative, also require caution in arriving
at any conclusions regarding effective actions that may “turn around” a failing restart.
First, the studies represent a small sample of only three firms. It is not clear how
generalizable their experience is to the population of restarts. Furthermore, due to the
26
difficulty of obtaining information on failing restarts, investigating only relatively
successful restarts constitutes a “selection on the outcome,” thus introducing bias.
Other limitations include the necessity to impose an arbitrary taxonomy of
performance levels. “Successful” firms were classified as those who achieved an IPO,
while “mid-range” firms were defined as those having final exit values above zero, but
without reaching an IPO. Many mid-range firms were acquired for “pennies on the
dollar,” while some were purchased for substantial premiums (including both QPass and
Omneon Video Networks). This category therefore, includes some firms that are
similar to “failed” firms while others that could arguably be considered a “success.”
Future research could look more closely at these mid-range firms and improve the
classification used in this analysis.
Other promising avenues of future study include investigating whether a startup
backed by a VC in one area is more likely to fail, or lose their investors, than a firm in
another state. Such a study could provide insight into the psychological environment
that these ‘restart firms’ face, and how this affects their development.
Conclusion
Once again, according to entrepreneurship scholar Scott Shane, entrepreneurs
“introduce new goods and serves, ways of organizing markets, processes, and raw
materials through organizing efforts that previously had not existed,” they also face risk
at each stage of the process (Shane 2002). These risks often result in entrepreneurial
failure, as has been well documented. Some seemingly failed entrepreneurs get a
“second chance” through a restart. Despite this important mechanism within the
entrepreneurial process, little is known about restarts. In order to better understand this

27
phenomenon, this thesis investigates the incidence of restarts, their geographic
concentration, and how they perform relative to non-restart firms. I also explore the
restart process through a detailed investigation of three restart firms.
I find similarities among their potential relationship to economic events, such as
the Internet Bubble, and their geographic proximity to areas of venture capital financing.
I also observe that restart firms tend to perform less well than non-restart firms. Finally,
I identify actions undertaken by entrepreneurs who “turned things around” and survived
the restart process. The two-part analysis contained in this thesis helps to shed light on
the restart phenomenon as well as providing a basis for further research.
28
VIII. Tables and Figures
Tables
Table 1. Distribution of Overall Sample
Table 2. Restart and Non-Restart Initial Comparison
Table 3. Non-Restart Firms: Initial Descriptive Statistics
Table 4. Restart Firms: Initial Descriptive Statistics
29
Table 5. Non-Restart Firms: Geographic Statistics
Table 6. Restart Firms: Geographic Statistics
Table 7. Geographic Distribution Concentrating in California
Table 8. Non-Restart: Founding Year Statistics
30
Table 9. Restart Firms: Founding Year Statistics
Table 10. Restart Firms: Restart Year Statistics
Table 11. Non-Restart Firms: Exit Type Statistics
Table 12. Restart Firms: Exit Type Statistics
Table 13. Case Study Overview
Firm Name Constant Contact QPass Omneon Video Networks
Location Waltham, MA Seattle, WA Sunnyvale, CA Founding Year
1998 1997 1998
Restart Year 2002 2002 2002

31
Industry Sector
Business Applications Software
Vertical Market Applications Software
Multimedia Networking Software
Core Weaknesses
- Founders’ leadership weaknesses - Flawed Business Model and Financial Plan - Lack of ability to exploit competitive advantages - Susceptible to major economic changes: the Internet bubble
- Susceptible to major economic changes: the Internet bubble - Too broad of a scope for their capabilities through a flawed business model
- Significant product development delays - Inability to initially overcome industry barriers as well as their expertise barriers
Solutions - Instituting a unfiltered feedback system to point out informational gaps and improve leadership styles
- Redirecting their scope on a narrower sector of the market - Maintaining a constant flow of information among stakeholders to successfully recapitalize and redirect their business
- Actively utilized and created strategic alliances in order to produce superior product and value - Assuring and remaining in constant contact with stakeholders remain funded throughout the development process
Exit Type Initial Public Offering Acquisition Acquisition Final Valuation
$340 million $275 million $273 million
Figures
32
Figure 1. The “Internet Bubble” as Evidenced by the Nasdaq Index
Figure 2. US Venture Capital Investments in Software Startups, 1995-2012
$0.00
$5.00
$10.00
$15.00
$20.00
$25.00
$30.00
Inve
stm
ent i
n Bi
llion
s
Software US Venture Capital Investments, 1995-2012
Source: PricewaterhouseCoopers/National Venture Capital Association MoneyTree™ Report, Data: Thomas Reuters
VC Investment in Software
33
Figure 3. Annual Percentage Change in VC Investments in Software Startups, 1995-2011
Figure 4. VC-backed Software Startups by Year Established, 1991-1999
-100%
-50%
0%
50%
100%
150%
Annual Percent Change in US Software Venture Capital Dollars
Source: PricewaterhouseCoopers/National Venture Capital Association MoneyTree™ Report, Data: Thomas Reuters
Annual % Change in Software Venture Capital Dollars
0
100
200
300
400
500
600
1991 1992 1993 1994 1995 1996 1997 1998 1999
Software Startup Foundings, 1991-1999
# of Firms
34
Figure 5. Software “Restarts” in the Sample, 1991-2009
Figure 6. Silicon Valley vs. All California Venture Capital Investments
0%
10%
20%
30%
40%
50%
60%
1995
1996
1997
1998
1999
2000
2001
2002
2003
2004
2005
2006
2007
2008
2009
2010
2011
2012
Annu
al %
Cha
nge
Silicon Valley and California Share of Total US VC Investments, 1995-2012
Source: PricewaterhouseCoopers/National Venture Capital Association MoneyTree™ Report, Data: Thomas Reuters
Silicon Valley as % Total Invested
35
Figure 7. Histogram of Final Exit Value for Overall Sample
Figure 8. Histogram of Final Exit Value for Restart Sample
36
Figure 9. Histogram of Final Exit Value for Non-Restart Sample
37
VII. Bibliography
"About Constant Contact, Inc.." Constant Contact, Inc. <http://www.constantcontact.com/about-constant-contact/index.jsp>.
"About Us." QPass, Inc. <http://web.archive.org/web/20051125084619/http://www.qpass.com/us/ company.html>.
Amdocs Inc. "Amdocs Agrees to Acquire QPass for $275 Million." Amdocs.com. Amdocs Inc., 18 Apr. 2006. <http://www.amdocs.com/News/Pages/Amdocs%20Agrees%20to%20Acquire%20Qpass.aspx
Arabsheibani, Gholamreza, David De Meza, John Maloney, and Bernard Pearson. "And a vision appeared unto them of a great profit: evidence of self-deception among the self employed." Economics Letters. 67 (2000): 35-41.
Åstebro, Thomas. "The Return to Independent Invention: Evidence of Unrealistic Optimism, Risk Seeking or Skewness Loving?" The Economic Journal. 113 (2003): 226-239.
Camerer, Colin, and Dan Lovallo. "Overconfidence and Excess Entry: An Experimental Approach." American Economic Review. 89.1 (1999): 306-318.
Carr, David. "The Technology Stock Bubble." Villanova MBA: Spring 2001 (2001). <www3.villanova.edu/.../David%20Carr%20- %20THE%20TECHNOLOGY%20STOCK%20BUBBLE.doc>.
Colombo, Jesse. "The Dot-com Bubble." The Bubble Bubble. 19 Aug. 2012. <http://www.thebubblebubble.com/dot-com-bubble/>.
"Constant Contact Announces $15 Million in Funding; Greylock Partners Joins Current Investors to Fund Growth Opportunities." Business Wire 30 June 2006: Factiva. <http://global.factiva.com/aa/?ref=BWR0000020060630e26u00691&pp=1&fcpil=en&napc=S&sa_from=>.
"Constant Contact, Inc. Constant Contact Ranked on Deloitte Technology Fast 500."Telecommunications Weekly 3 Nov. 2010: Factiva. <http://global.factiva.com/aa/?ref=TELWK00020101029e6b300038&pp=1&fcpil=en&napc=S&sa_from=>.
Cook, John. "QPass sold for $275 million." Seattle PI. Hearst Seattle Media, LLC, 18 Apr. 2006. <http://www.seattlepi.com/business/article/Qpass-sold-for-275-million-1201397.php>.
38
Cope, Jason, Frank Cave, and Sue Eccles. "Attitudes of Venture Capital Investors towards Entrepreneurs with Previous Business Failure." Venture Capital. 6.2/3 (2004): 147-172.
De Bettignies, Jean-Etienne, and James A. Brander. "Financing entrepreneurship: Bank finance versus venture capital." Journal of Business Venturing 22 (2007): 808-832. ScienceDirect.
De Meza, David, and Clive Southey. "The Borrower's Curse: Optimism, Finance, and Entrepreneurship." The Economic Journal. 106 (1996): 375-386.
Dickson, Glen. "Omneon gets Funding, Partner. (Brief Article)." Broadcasting and Cable 18 Dec. 2008: Factiva. <http://global.factiva.com/aa/?ref=bdctca0020010803dwci00383&pp=1&fcpil=en&napc=S&sa_from=>.
Duryee, Tricia. "Solid rebound for QPass." The Seattle Times [Seattle, WA]. The Seattle Times Company, 25 Apr. 2005. <http://seattletimes.com/html/business technology/2002251915_qpass25.html>.
"Editware and Omneon Form Strategic Alliance." Business Wire 7 Apr. 2003:Factiva. <http://global.factiva.com/aa/?ref=bwr0000020030407dz47 003ec&pp=1&fcpil=en&napc=S&sa_from=>.
Fairchild, Richard. "An entrepreneur's choice of venture capitalist or angel-financing: an behavioral game-theoretic approach." Journal of Business Venturing 26 (2011): 359-374. ScienceDirect.
Founder's Can't Scale. Dir. TedXBeaconStreet. TEDx Event, 6 Dec. 2013. TEDxBeaconStreet. <http://www.tedxbeaconstreet.com/speakers/gail- goodman/#tab-id-1>.
Garland, Russell. "SOMETHING VENTURED: Greylock Loses No Steam In Middle Age." Dow Jones News Service 9 Dec. 2009: Factiva. <http://global.factiva.com/aa/?ref=DJ00000020091209e5c9000ee&pp=1&fcpil=en&npc=S&sa_from=>.
Garud, Raghu, and David Ahlstrom. "Technology Assessment: a socio-cognitive perspective." Journal of Engineering and Technology Management. 14 (1997): 25-48.
Gibbs, Colin. "Amdocs to acquire QPass for $275M." RCR Wireless News 24 Apr. 2006: Factiva. <http://global.factiva.com/aa/?ref=RCRR000020060 428e24o0000y&pp=1&fcpil=en&napc=S&sa_from=>.
39
Gibbs, Colin. "VCs, mobile developers weathering financial storms…so far; First-round funding extremely tough to get." RCR Wireless News. 29 Sept. 2008: Factiva. <http://global.factiva.com/aa/?ref=RCRR000020081007e49t00003& pp=1&fcpil=en&napc=S&sa_from=>.
"Globe 100." The Boston Globe [Boston, MA] 22 May 2011: Factiva. <http://global.factiva.com/aa/?ref=BSTNGB0020110523e75m00057&pp=1&fcpl=en&napc=S&sa_from=>.
Gompers, Paul A. "Optimal Investment, Monitoring, and the Staging of Venture Capital." The Journal of Finance 50.5 (1995): 1461-1489. <http://www.jstor.org/stable/2329323>.
Gompers, Paul, and Josh Lerner. "Money chasing deals? The impact of fund inflows on private equity valuations." Journal of Financial Economics 55 (2000): 281-325.
Gompers, Paul A., and Josh Lerner. The Money of Invention: How Venture Capital Creates New Wealth. Boston, MA: Harvard Business School Press, 2001.
Hadzima, Joe. “A Beginner’s Guide to Venture Capital.” MIT Course 15.S21: The Nuts and Bolts of Business Plans. MIT Sloan School, Cambridge, MA. 2007.
Hall, Robert E., and Susan E. Woodward. "The Burden of the Nondiversifiable Risk of Entrepreneurial." American Economic Review. 100 (2010): 1163-1194.
Hellmann, T., Puri, M., 2002. Venture capital and the professionalization of startup firms: empirical evidence. Journal of Finance 57, 169–197
Jenkins, Anna S., Johan Wiklund, and Ethel Brundin. "Individual response to firm failure: Appraisals, grief, and the influence of prior failure experience." Journal of Business Venturing. (2012).
Kauffman: The Foundation of Entrepreneurship, . "2013: State of Entrepreneurship Address."The Ewing Marion Kauffman Foundation (2013): <http://ssrn.com/abstract=2212743>.
Kirsner, Scott. "Keeping it simple for the customer E-mail marketing firm thrives Following Intuit model." The Boston Globe [Boston, MA] 2 Nov. 2008: Factiva. <http://global.factiva.com/aa/?ref=BSTNGB0020081104e4b 20002l&pp=1&fcpil=en&napc=S&sa_from>.
Lowe, Robert A., and Arvids A. Ziedonis. "Overoptimism and the Performance of Entrepreneurial Firms." Management Science. 52.2 (2006): 173-186.
Madsien, Jorn. "Dotcom Bubble burst: 10 years on." BBC News 9 Mar. 2010: BBC News. <http://news.bbc.co.uk/2/hi/business/8558257.stm>.
40
Mantere, Saku, Pekka Aula, and Eero Vaara. "Narrative Attributions of Entrepreneurial Failure." Journal of Business Venturing 28 (2013): 459-473.
Mason, Colin M., and Richard T. Harrison. "Closing the Regional Equity Capital Gap: The Role of Informal Venture Capital." Small Business Economics 7.2 (1995): 153-172. JSTOR. <http://www.jstor.org/stable/40228835>.
"Media 100 Inc. and Omneon Video Networks Enter Partnership." Reuters Significant Developments 13 Mar. 2002: Factiva. <http://global.factiva.com/aa/?ref= MULTI00020050123dy3d0119j&pp=1&fcpil=en&napc=S&sa_from=>.
Metzger, Georg. "Firm Closure, Financial Losses, and the Consequences for an Entrepreneurial Restart." Centre for European Economic Research: Discussion Paper No. 08-094.
"NASDAQ Composite Interactive Chart." Yahoo! Finance. Yahoo! News Network, <https://finance.yahoo.com/echarts?s=%5EIXIC+Interactive#symbol=%5 Eixic;range=20000103,20030102;compare=;ind dicator=volume; charttype=area;crosshair=on;ohlcvalues=0;logscale=off;source=;>.
Navigating the Small Business Environment: Challenges and Opportunities: Hearing Before the Committee on Small Business, House of Representatives, One Hundred Seventh Congress, Second Session, Washington, Dc, April 2, 2002. Washington: U.S. G.P.O, 2002.
"Omneon Expands Company Leadership Team." Business Wire 10 June 2003:Factiva. <http://global.factiva.com/aa/?ref=bwr0000020030610dz6a003l4&pp= 1&fcpil=en&napc=S&sa_from>.
"Omneon Forms Partnership." Televisual 4 Sept. 2001: Factiva. <http://global.factiva.com/aa/?ref=tlvl000020011006dx940005x&pp=1&fcpil=en&napc=S&sa_from=>.
Pounds, Stephen. "Venture Capital's Flow Into State Steady." The Palm Beach Post. 25 July 2006: Factiva. <http://global.factiva.com/aa/?ref=PMBP0000200 60726e27p0002b&pp=1&fcpil=en&napc=S&sa_from=>.
Prive, Tanya. "Angel Investors: How the Rich Invest." Forbes. 12 Mar. 2013. <http://www.forbes.com/sites/tanyaprive/2013/03/12/angels-investors-how-the-rich-invest/>.
"QPass Secures $10.7 Million Round of Funding." Business Wire 30 Dec. 2002: Factiva. <http://global.factiva.com/aa/?ref=bwr0000020021230dycu0025v&pp=1 &fcpil=en&napc=S&sa_from=>.
Scherer, F.M., and Harhoff Dietmar. "Technology Policy for a World of Skew-Distributed Outcomes." Research Policy 29 (2000): 559-566.
41
Shane, Scott. The General Theory of Entrepreneurship: The Individual-Opportunity Nexus. Northampton, MA: Edward Elgar Publishing, 2003.
Soto, Monica. "Seattle Technology Firms Shift Strategies to Survive, Thrive in Tough Times." The Seattle Times [Seattle, WA] 4 Mar. 2002: Factiva. <http://global.factiva.com/aa/?ref=krtbn00020020305dy34001qf&pp=1&fcpil=en&nac=S&sa_from=>.
Peter, Ian. "The History of the Internet-The Dotcom bubble." NetHistory. The Internet History Project, 2004. <http://www.nethistory.info/History%20of% 20the%20Internet/dotcom.html>.
The Long, Slow SaaS Ramp of Death. Dir. Gail Goodman. 26 Feb. 2013. Business of Software. <http://businessofsoftware.org/2013/02/gail-goodman-constant- contact-how-to-negotiate-the-long-slow-saas-ramp-of-death/>.
Thurm, Scott. "Tech Jobs Start to Come Back In U.S. After Three-Year Slump." The Wall Street Journal 29 Apr. 2004: Factiva. <http://global.factiva.com/aa/ ?ref=J000000020040429e04t0003b&pp=1&fcpil=en&napc=S&sa_from=>.
Tyabji, Hatim, and Vijay Sathe. "Venture Capital Firms in America: Their caste system and other secrets." Ivey Business Journal. July/August (2010): <http://iveybusinessjournal.com/topics/the-organization/venture-capital-firms-in america-their-caste-system-and-other-secrets#.UpEm2RbmyCi>.
Ucbasaran, Deniz. “The Fine ‘Science’ of Entrepreneurial Decision Making.” Journal of Management Studies. 45.1 (2008): 221-237. Business Source Complete.
"WSJ.COM: Recent Venture Capital Transactions." Dow Jones News Service 30 Dec. 2002: Factiva. <http://global.factiva.com/aa/?ref=dj00000020021230 dycu001my&pp=1&fcpil=en&napc=S&sa_from=>.