the performance of venture-backed ipos in … · the performance of venture-backed ipos in germany:...
TRANSCRIPT

The Performance of Venture-Backed IPOs in Germany: Exit Strategies, Lock-up Periods, and Bank Ownership
Wolfgang Bessler Andreas Kurth
Center for Finance and Banking
Justus-Liebig-University Giessen
March 2003
Address: Prof. Dr. Wolfgang Bessler, Center for Finance and Banking, Justus-Liebig-University Giessen, Licher Strasse 74, 35394 Giessen. Tel: (49) 641 99 22 461, Fax: (49) 641 99 22 469, email: [email protected]

The Performance of Venture-Backed IPOs in Germany:
Exit Strategies, Lock-up Periods, and Bank Ownership
The objective of this paper is to investigate the stock price performance of Initial Public Offerings (IPOs) in Germany. In the empirical analysis we include 305 firms that went public at the "Neuer Markt", the German stock market for growth companies, during the period from 1998 to 2001. Of special interest is the performance of venture-backed IPOs and here especially the ones in which the venture capitalist is a financial institution. In the German universal banking system banks usually act as both commercial banks and investment banks. Thus, the banks are on one hand equity provider and on the other hand underwriter for the IPO. Moreover, they may have provided bank loans to the firm before it went public. The interesting question is whether the bank acts in its own interest and maximizes the value of the shares for its own exit as a venture capitalist or whether the bank acts in the interest of the firm that went public or even in the interest of the investors. Thus, there are a number of interesting agency problems in these various bank-customer relationships.
The empirical results suggest that there are in fact serious agency problems in the German market for growth firms. During the first six months after the IPO, the owners including management and venture capitalists usually are not allowed to sell their shares (lock-up period). As the agency theory would predict, there is a strong out-performance during the first six months after the IPO and a significant under-performance following the end of the lock-up-period. In case of longer lock-up periods, e.g. 12 or 18 months, the highest stock price usually occurs at these later dates. It appears that management and venture capitalist are able to time their exit perfectly at the highest stock price. The question that is addressed at the end of the paper is whether the banks have certain timing abilities or whether they may use various means of influencing the stock price. There seems to be empirical evidence that banks and management act in their own interest and to the disadvantage of other investors.
JEL Classification: G 14; G15; G24; G32

2
1. Introduction
The relevance of venture capital for the performance of Initial Public Offerings (IPOs) has been investigated in a number of theoretical and empirical studies. The basic argument is that venture capitalists possess certain screening and monitoring abilities in the financing process that positively impact the market value of the firm. This notion can be empirically tested by comparing the performance of ventured-backed and non venture-backed IPOs because the values of both firms are observable daily in the stock market. Most studies confirm the notion that first there is smaller underpricing for venture-backed IPOs and that second the long-run performance is less negative for venture-backed compared to non venture-backed IPOs (e.g. Megginson and Weiss, 1991; Brav and Gompers, 1997). It appears that venture capitalists are in a position to reduce the adverse selection problem for the IPO in that they are able to signal the quality of the IPO. Moreover, venture capitalists perform an important function in the corporate governance of IPOs so that management is forced to work in the interest of shareholders with the objective to maximize the value of the firm in the long run.
With respect to maximizing shareholder value there is an interesting aspect in that the venture capitalist is most interested in the value of the firm for the time of his investment and most importantly for the point in time of the exit. An exit of the venture capitalist is usually possible at the time of the initial public offering (primary market) as well as later on in the secondary market. Lock-up periods may restrict the sale for a certain period. In Germany there exists a required lock-up period of 6 months for IPOs at the “Neuer Markt”. In other countries it is often a voluntary agreement between the firm and the underwriter that may be changed later on. Nevertheless, the venture capitalist is interested in achieving the highest possible value at the time of the exit. From this perspective the rational objective of the venture capitalist to achieve the highest possible value at the time of his exit, i.e. to maximize the return on his investment, suddenly has a different meaning and may lead to additional problems. Due to his special abilities in screening and monitoring the venture capitalist is, on the one hand, usually able to reduce the agency problems. On the other hand, during the time period before his planned exit his objectives may change dramatically to maximize his own value. This may create new agency problems. This time the problems are between the venture capital firm and shareholders.

3
The venture capitalist may positively influence the value of the firm before his exit in that positive information about the firm are published during the time period before the exit. Another possibility is that the underwriter provides price support for the time period up to the exit. The notion for such a behavior is that the underwriter has a self interest in providing a successful exit for the venture capitalist in order to generate new going public business. This behavior in fact may lead to new agency problems. Thus, in our empirical analysis we will investigate the ability of the venture capitalist to optimal time his exit. The conflict of interest is usually even more pronounced when the venture capital firm belongs to a bank. This is due to the various services that banks may provide such as loans, underwriting, stock research and stock recommendations. Thus, it appears interesting to analyze this group of venture capital firms separately. In this paper these various issues will be empirically tested by analyzing the performance of venture-backed IPOs that went public in Germany at the “Neuer Markt” during the period from 1998 to 2001. In this study we consider bank controlled venture capital firms because the agency conflicts as mentioned above may be most pronounced.
The empirical results of our study concerning the long-run performance of IPOs in Germany clearly indicate that an exit at the end of the lock-up period after 6 months is more favorable than an exit either at the time of the IPO or later on. Especially those IPOs in which banks keep their equity stake after the IPO and in addition agree only on the minimum lock-up period of 6 months have a significant run-up and positive BHAR up to the end of that period. The performance of these IPOs, however, does change after 6 months in that we observe a negative performance thereafter and finally insignificant abnormal returns after 18 months. Thus, there appears to be an optimal timing for the exit which happens just after the end of the lock-up period. Consequently, the empirical findings in this study suggest that there are some agency conflicts for bank-backed IPOs in Germany in that there exists a time for an optimal exit from the venture. These empirical findings are to some extend in contrast to the results of Gompers and Lerner (1999) for the USA where some of the potential agency conflicts seem to be anticipated by the investors. This is not the case for the “Neuer Markt”. Our results, however, confirm the findings of Ber, Yafeh and Yosha (2001) for Israel who provide some empirical evidence of the agency problems when one financial institution acts as commercial bank, underwriter as well as mutual fund.
The rest of the paper is organized as follows. In the next section we provide a review of the literature with respect to the performance of IPOs and especially for venture-backed IPOs. The 3rd section contains a description of the data and the methodology

4
that we employ in our empirical analysis. The results are presented in section 4. In this section we separate between venture-backed and bank-financed IPOs as well as between a 6 months lock-up period and a voluntary longer period. The last section concludes the paper.
2. Literature Review
Over the last 25 years Initial Public Offerings have been one of the most important topics in finance as well as in the empirical capital market research literature. Thus, there is a tremendous amount of theoretical and empirical research on this topic available today. This interest is, on the one hand, related to the importance of the IPOs for economic growth and employment. On the other hand, the special interest is related to the specific return behavior or “market anomalies” of IPOs. In particular, empirical studies have investigated the underpricing (Ibbotson, Sindelar and Ritter, 1988) and long-run performance (Ritter, 1991) of Initial Public Offerings (IPOs) with the result that most studies find significant underpricing, e.g. substantial initial returns, and on average substantial underperformance over longer periods. Moreover, there are hot issue markets (Ritter, 1984) and lock-up periods (Field and Hanka, 2001) for which the “Neuer Markt” in Germany is a perfect example. Investigating the IPO market in Germany is of special interest for a number of other reasons. Most importantly, the banking system, the legal system, as well as the corporate governance structure are different from that of the United States so that some different results may be expected. Especially the German universal banking system in which banks perform both commercial and investment banking activities as well as stock research and the mutual fund business may lead to some conflicts of interest.
The German market for IPOs is quite different from markets for growth companies in other countries. Before the opening of the “Neuer Markt” in 1997 there were only a few IPOs every year (Bessler and Thies, 2002, Fig. 1). Moreover, these IPOs were mainly established and profitable companies. For high-tech start-up firms there was hardly any opportunity for raising equity in financial markets in Germany. Consequently, there was also not a reasonable exit opportunity for venture capital firms and therefore there was hardly any venture capital or any risk available. The most heavily involved firms in providing venture capital were financial institutions which hold about 59% of all investments (BVK Jahrbuch 1996, p. 99). Thus, the opening of the “Neuer Markt” in 1997 was another attempt to finance growth firms. The start was very successful. First day returns were on average about 50% (Kiss and

5
Stehle, 2002) which was much higher than the initial returns in other European growth market segments. For example, the Nouveau Marché in France generated on average 17,5% initial returns and the Nuovo Mercato in Italy 23,5% (Giudici and Roosenboom, 2002, Table 4). Given the relatively short history of the “Neuer Markt”, there are hardly any studies that investigate the long-run performance. Exceptions are studies by Kiss and Stehle (2002) as well as by Gerke and Fleischer (2001). They find positive abnormal returns for the first 6 and 12 months. However, the returns seem to decrease when the holding period is extended.
One important factor that may help to explain the performance of IPOs is the ownership structure in general as well as the equity investment by venture capital firms. A higher performance of venture-backed IPOs may be expected due to the special functions that venture capitalists are able to perform such as screening, monitoring, and consulting. In addition they have the ability to signal the quality of the IPO reliably. There seems to be empirical evidence that indicates that the venture capital firms are able time there exit from the venture in such in way that they generate a high return (Lerner, 1994). Moreover, venture-backed IPOs have on average a lower underpricing (Megginson and Weiss, 1991). This also seems to suggest that venture-backed IPOs have a higher quality and that the venture capital firms are able to reduce the information asymmetry and signal this quality to the market. In contrast, Francis and Hasan (2001) find for the USA and Franzke (2001) for the “Neuer Markt” that the underpricing is higher for venture backed IPOs. One explanation for the difference in results is a possible difference in risk of the ventures.
The superior monitoring ability of venture capitalists should also be observable in the secondary market in that these firms have a higher long-run performance. Brav and Gompers (1997) confirm this for the USA. However, the critical issue is whether this out-performance continues after the venture capital firms have sold their equity stakes. Gompers and Lerner (1998) find that venture-backed IPOs have a significant out-performance before the exit and a significant under-performance after the exit of the venture capital firms. Because the superior performance is limited to the first months after the IPO it appears that the venture capital firms have a superior ability to time the exit in that they sell the shares when the company is possibly overvalued. So far there is no study for the German capital market that investigates the behavior of venture capital firms with respect to agency problems and the timing abilities.
One other aspect that is of interest for the German “Neuer Markt” is the required lock-up period of at least 6 months. The results for the United States, the United Kingdom,

6
and the German “Neuer Markt” indicate that there is a negative performance at the end of the lock-up period (Field und Hanka, 2001; Espenlaub, Goergen, Kurshed, 2001 as well as Nowak and Gropp, 2002, respectively). These results suggest that venture capital firms may exit at the end of the lock-up period. However, Brav and Gompers (2003) find an extended lock-up period for those IPOs that may have some severe agency problems. Thus, it is interesting investigate whether longer lock-up periods signal quality.
Over the last decade the Banking Act of 1933 (Glass-Steagal Act) has been slowly abandoned which in fact ended the separation of investment banking and universal banking in the United States. Moreover, investment banks are in a position to take equity stakes in IPOs before the time of the Going Public. Puri (1999) models these agency problems that result from equity shareholdings and underwriter business. In empirical studies Gompers and Lerner (1999), for example, find that IPOs with bank ownership are initially traded at a discount due to some conflict of interest. In the secondary market, however, there is no significant long-run underperformance. For Singapore, Wang, Wang and Lee (2002) detect higher initial returns and a worse long-run performance for bank-backed IPOs. Li and Masulis (2003) find for the USA that the underpricing is reduced when the underwriter keeps some equity stake in the IPO. They conclude that this investment reduces the agency problems between the owners, the underwriter, and the investors. Espenlaub, Garrett and Mun (1999) find for the UK no conflicts of interests between underwriting and venture capital investments by the bank. They conclude that the underpricing is smaller in these instances and that these IPOs have an even superior long-run performance. Although on theoretical ground some agency problems would be expected if the underwriter keeps an equity stake in the IPO there is hardly any significant empirical evidence so far.
In sum, the universal banks can employ different means to influence stock prices of IPOs in the primary and secondary market and therefore impact the short- and long-run performance of these firms. The management of the underwriter or any other bank with an equity stake can, for example, push the analyst to issue too favourable investment reports and buy recommendations. Lin and McNichols (1998) as well as Michaely and Womack (1999) find support for this notion in the USA in that the recommendations by analysts belonging to the underwriter are positively biased. Moreover, price support by the bank or its mutual fund is not easily observeable but very likely. The interest and timing of an extraordinary positive but only temporary market performance is obviously related to the invested capital of the venture capital firm and the equity stake of the bank as well as the length of the lock-up period which

7
determines the first moment of an exit opportunity. All this influences the exit behavior of the institutional investors. In the next section these aspects for venture capital firms and banks will be empirically tested for the German capital market.
3. Data and Methodology
3.1 Data
The “Neuer Markt” segment for high tech growth companies at the Deutsche Boerse AG opened in 1997 and was closed in 2003. The sample includes all IPOs for the German “Neuer Markt” for the period from 1998 to 2001. There were 12 IPOs in 1997. They were excluded because they cannot be described as growth companies and are more similar to the firms that went public before 1997 than to the firms that got listed on the “Neuer Markt”. There was only one IPO in 2002 and none in 2003. Although the market eventually closed and is considered a failure by some, it nevertheless offers a great opportunity to analyze the agency problems that are related to the going public process.
There were 316 IPOs during the period from 1998 to 2001 that went public at the “Neuer Markt”. 7 IPOs had to be excluded from the sample due to the unavailability of data (bankruptcy and take overs). Moreover there were two possible stock manipulations cases so that these firms were excluded as well (COMRoad AG and Infomatec AG). Thus, the final sample consists of 307 companies for which we have all necessary return data for the first 18 months (367 days of trading) in the secondary market.
In this paper we investigate the financing activities and behavior of venture capitalists and banks. Venture capital contains institutional shareholders that focus on start-up financing and are not affiliated with a bank. Bank-financed are these IPOs, which got private equity from a bank before going public. Thus, the sample consists of 75 venture-backed IPOs and 51 bank-financed IPOs out of the total sample of 307 IPOs. The average investment for venture-backed IPOs is about 16% and for bank-financed IPOs 8% with quite some variability.
At the end of the lock-up period the shares can be sold without any restrictions. The firm can fulfill the minimum requirement of six months or the time period can be extended for some time. A voluntary extension of the lock-up period is usually considered as a positive signal about the future prospect of the IPO. Out of 61 IPOs in which the venture capitalist keeps at least 5% ownership, 16 firms extended the lock-

8
up agreement. In the case of banks 17 out of 49 extended the lock-up period. The sample will be divided accordingly in order to investigate the impact of the lock-up agreement later on.
3.2 Methodology
The holding period returns (BHR) for a single stock i for period T are calculated as follows:
( 1 ) ( ) 111
−
+∏==
ti
T
tTi RBHR ,,
where Ri,t is the return of stock i at time t, and T is the time period for which the BHR is determined. For an equally-weighted portfolio of stocks the returns are calculated as:
( 2 ) ∑=
=N
iTiTP BHR
NdBHR
1,,
1
where dBHRP, T is the average BHR of the portfolio, N is the number of stocks in the portfolio, and T is the time period for which the BHR is calculated. In order to calculate the abnormal returns for the portfolio, the “Buy-and-Hold-Abnormal-Returns” (“BHAR”), the return of the benchmark is subtracted from the return of the IPO.
( 3 ) ∑ ∏∏= ==
+−
+=N
i
T
ttM
T
tti RR
NBHAR
1 1,
1, )1()1(1
The advantage of this method is that the terminal values of the two strategies, i.e., investing in an IPO or investing in the benchmark, are directly comparable. To underscore the statistical significance of our results we apply different methods. In order to test whether the mean BHAR differ from zero significantly, we use a simple t test. Alternatively we check whether the number of firms with positive excess returns is larger than the number of firms with negative excess returns conducting a sign test. Furthermore, we compare the mean BHAR of two samples. To test, whether the means of the two samples differ significantly, again a parametric t test for differences between means and a non parametric Mann-Whitney rank sum test are applied.

9
4. Empirical Results
The objective of our analysis is to provide some empirical evidence on the impact of both venture capital and bank involvement on the performance of the IPOs after going public. Because the venture capital firms and especially the banks have their own agenda in maximizing their shareholder value there must be a number of critical agency conflicts in these relationships. This is especially true for the German universal banks when bank not only have equity stakes in IPOs and provide loan services before and after the IPO but also offer full or partial underwriting services. In addition, the German universal banks are involved in mutual fund management as well as in stock recommendations. Consequently, we investigate a number of relationships and interactions in the following sections. The two major areas of our analysis are “Venture capital and IPOs” (4.1) as well as “Bank-relationships and IPOs” (4.2). These two main topics are further subdivided into more testable issues. Due to the limited number of IPOs in Germany, a more detailed differentiation of the data, however, must lead to small sample sizes where statistical significance test are not applicable. Thus, for some issues we can only provide theoretical arguments and show the results of the data without statistical interference.
4.1. Venture Capital and IPOs
In the following section the performance of the venture-backed firms is compared to the non venture-backed IPOs (4.1.1). Furthermore we investigate whether venture capitalists signal the quality of the IPO by extended lock-up periods (4.1.2) or by retaining shares at the IPO (4.1.3).
4.1.1 Performance of Venture-Backed versus non Venture-Backed IPOs
In the empirical analysis we concentrate first on the performance of venture-backed IPOs. There are 75 venture-backed firms in our sample. The results are presented in Table I and Exhibit 1. After 123 days of trading (6 months) the performance (BHAR) of the venture-backed IPOs is 41.3% and exceeds the performance of the non venture-backed IPOs which is 23.8%. The difference, however, narrows and nearly vanishes over time. After 367 days of trading (18 months) the observed performance for the two groups is 18,9% and 7,3%, respectively. A test of the difference in mean returns does not yield any statistically significant result. Thus, the empirical results suggests that for our data there is no apparent positive impact of venture capital financing on the

10
performance of IPOs. It is interesting to notice, however, that a clear return pattern emerges over time in that the difference of BHAR between the two groups increases for the first 6 months and then narrows for the next six months. This highlights the importance of the lock-up period which is examined in the next section.
4.1.2 Impact of the Lock-up Period
The official regulation of the German Stock Exchange requires a non-negotiable lock-up period of six months for the „Neuer Markt“. Although lock-up periods are quite important in signaling the quality of the IPOs in most countries it is voluntary and rests on a contract between the underwriter and the firm. Given the required lock-up period of at least six months in Germany the time window around the expiration date is of special interest. Because this is also the time period during which the required lock-up period for the venture capitalists ends they are now in a position to exit the venture by selling their equity stakes in the secondary market. In some cases, the venture capitalists agree voluntary or involuntary on longer lock-up periods. On one hand, such a behavior could signal a positive outlook for the IPO. On the other hand, it could signal quality problems if the extension was demanded by the underwriter. It is therefore useful to separate the sample into two groups in order to investigate the performance of the IPOs depending on the length of the lock-up period. We exclude those IPOs, where the venture capitalist owns less than 5%. The empirical results are provided in Table II and Exhibit 2.
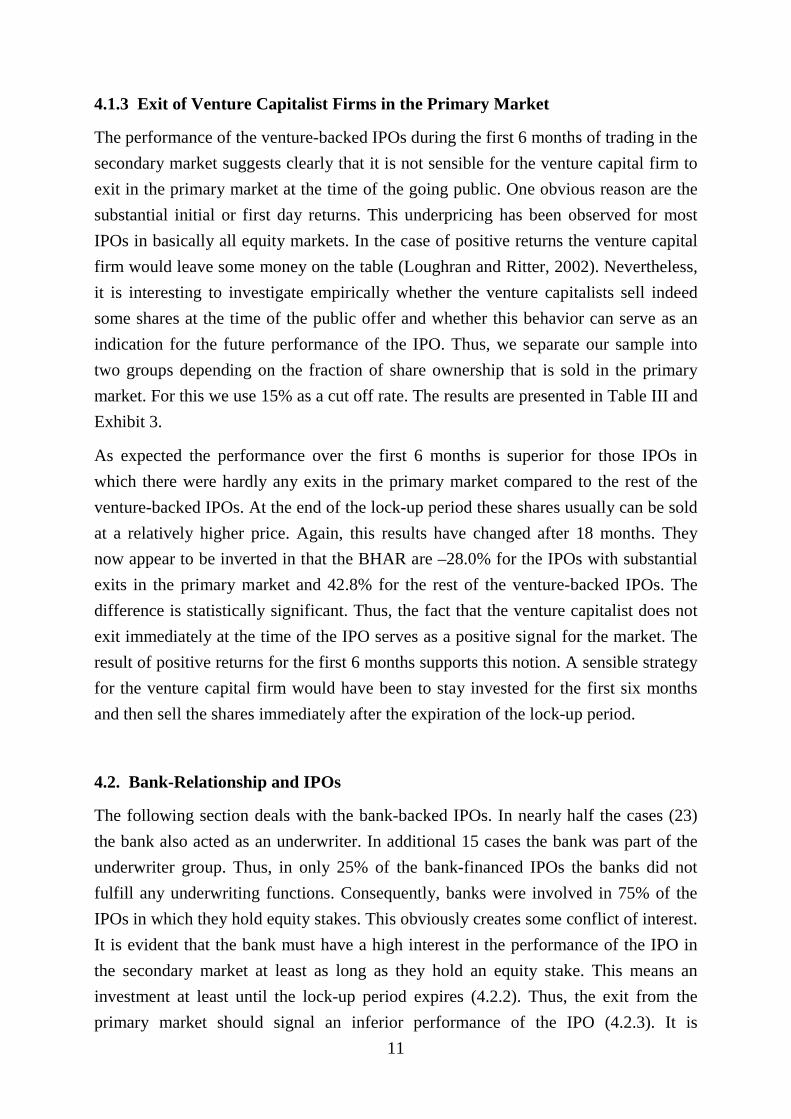
After 123 days of trading (6 months) the BHAR for venture-backed IPOs with extended lock-up periods is 55.3%. This is higher than the 42.6% BHAR for the IPOs with the standard 6 months period. This difference, however, is statistically insignificant. After 367 days (18 months) of trading the difference increases substantially. While the BHAR of the IPOs with the longer lock-up period increases to 59.1%, the BHAR of the other venture-backed IPOs decline to –5.6%. The performance behavior of all venture-backed IPOs as shown in Exhibit 1 clearly results from the performance of this group of IPOs. The difference in mean returns is not statistically significant mainly due to the small sample size. Nevertheless, it appears that the venture capitalist that agrees on a longer lock-up period signals the quality of the IPO. Whether the venture capitalist actually exits at the end of the six months periods is not clear at all because the relevant data is not available in Germany. Most of the studies, however, indicate that it is most likely that the venture capital firm will exit during that time period.
11
4.1.3 Exit of Venture Capitalist Firms in the Primary Market
The performance of the venture-backed IPOs during the first 6 months of trading in the secondary market suggests clearly that it is not sensible for the venture capital firm to exit in the primary market at the time of the going public. One obvious reason are the substantial initial or first day returns. This underpricing has been observed for most IPOs in basically all equity markets. In the case of positive returns the venture capital firm would leave some money on the table (Loughran and Ritter, 2002). Nevertheless, it is interesting to investigate empirically whether the venture capitalists sell indeed some shares at the time of the public offer and whether this behavior can serve as an indication for the future performance of the IPO. Thus, we separate our sample into two groups depending on the fraction of share ownership that is sold in the primary market. For this we use 15% as a cut off rate. The results are presented in Table III and Exhibit 3.
As expected the performance over the first 6 months is superior for those IPOs in which there were hardly any exits in the primary market compared to the rest of the venture-backed IPOs. At the end of the lock-up period these shares usually can be sold at a relatively higher price. Again, this results have changed after 18 months. They now appear to be inverted in that the BHAR are –28.0% for the IPOs with substantial exits in the primary market and 42.8% for the rest of the venture-backed IPOs. The difference is statistically significant. Thus, the fact that the venture capitalist does not exit immediately at the time of the IPO serves as a positive signal for the market. The result of positive returns for the first 6 months supports this notion. A sensible strategy for the venture capital firm would have been to stay invested for the first six months and then sell the shares immediately after the expiration of the lock-up period.
4.2. Bank-Relationship and IPOs
The following section deals with the bank-backed IPOs. In nearly half the cases (23) the bank also acted as an underwriter. In additional 15 cases the bank was part of the underwriter group. Thus, in only 25% of the bank-financed IPOs the banks did not fulfill any underwriting functions. Consequently, banks were involved in 75% of the IPOs in which they hold equity stakes. This obviously creates some conflict of interest. It is evident that the bank must have a high interest in the performance of the IPO in the secondary market at least as long as they hold an equity stake. This means an investment at least until the lock-up period expires (4.2.2). Thus, the exit from the primary market should signal an inferior performance of the IPO (4.2.3). It is

12
especially troublesome that banks have different means of positively influencing the performance of IPOs at least for some time period. One opportunity to influence stock prices are buy recommendations by their own stock analysts. This aspect is covered in section 4.2.4.
4.2.1 Bank-Financed versus non Bank-Financed IPOs
In the previous sections we argued that banks have certain incentives as private equity investor that may result in various observable agency conflicts. Thus, it is useful to investigate the performance of the bank-financed IPOs separately. In our sample of 307 firms there are 51 firms in which banks had a private equity stake before the IPO. The empirical results are summarized in Table IV and Exhibit 4. At a first glance there does not appear to be any obvious difference in returns for both sub-samples. The BHAR for the first 6 months is 23.3% for the bank-financed IPOs and 29.0% for the non-bank financed IPOs. After 18 months the BHAR are 4.1% and 11.4%, respectively. A test for the difference of mean returns is insignificant.
4.2.2 Bank-Financed IPOs and Lock-up Period
The universal banking system in Germany in which banks perform both commercial banking and investment banking functions in one corporate unit could be a source of potential agency problems (Ber, Yafeh and Yosha, 2001). On one hand banks usually have private information about the IPO, for example, from the loan business, and on the other hand they are usually in a position to influence the stock price, for example, through price support activities and analysts’ recommendations. Thus, it appears quite interesting to investigate the specific behavior of banks with equity investments in IPOs with respect to lock-up periods and exit strategies. For this analysis we differentiate the bank-financed IPOs by the length of the lock-up period. As already mentioned in the previous section an extended lock-up period could signal quality. Therefore, one would expect a positive and superior long-run performance. This may be especially true given the private information advantage of the banks. The empirical results are presented in Table V and Exhibit 5.
The results are quite different from the ones of the non bank venture-backed IPOs as presented in Table II. The BHAR for bank-financed IPOs with extended lock-up periods is negative and reaches a level of -10.0% after 6 months. This figure is not only negative but significantly lower than the performance of the other bank-financed
13
IPOs. They generate a positive performance of 43.5%. After 18 months the difference in the performance of both groups is smaller. The BHAR are now 16.7% and -15.7%, respectively. For the group with lock-up agreements of only six months we observe a strong positive performance for the first six months. It appears that longer lock-up periods of bank-financed IPOs is not a credible signal to convey quality to the market. There are a number of reasons for this observation. Because there is only a six months lock-up period officially required by official regulations of the Deutsche Boerse any longer period is voluntary and negotiable and may be altered later on if the parties agree. Thus, shares may be sold after the end of the six months period. This is especially critical for those cases where the venture capitalist and the underwriter are the same financial institution. In this instance the lock-up agreement is irrelevant and has little value.
4.2.3 Bank-Financed IPOs and Exit in the Primary Market
From Exhibit 5 it is evident that bank-financed IPOs have a positive performance over the first six months. If we include the first day initial return of 61.8% of this sample in our calculation of the total performance, it becomes quite evident that a bank exit at the time of the IPO in the primary market is on average not an optimal exit strategy. Therefore, it is of interest whether the group of IPOs in which the banks sold their shares in the primary market has an inferior performance compared to the group of IPOs in which the banks kept their investment at least up to the end of the lock-up period. The basic idea is that an equity commitment by the bank of a time period of least up to the end of the lock-up period signals the believe that these are higher quality firms and therefore that a superior performance of these IPOs could be expected. The percentage of ownership that must be sold to fall into one of the two groups is 10%. The empirical results are presented in Table VI and Exhibit 6.
The performance of the two groups over the first 6 months is quite different. The group of IPOs in which banks sold immediately more than 10% of their equity stake has a negative performance of -4.1% after 6 months. In comparison, the group of IPOs in which the banks kept their investments have a positive performance of 65.6% which is higher and significantly different. Obviously, a strategy in which the banks keep their equity stake for a while and sold it in the secondary market yields a much better performance. The difference in performance, however, declines later on and this difference is statistically insignificant after 18 months.

14
Whether the banks use this apparent profit opportunity to exit at the end of the lock-up period cannot be investigated due to the unavailability of the relevant data. The same is true for other investors that may bandwagon on this price behavior. Depending on whether the investor got shares allocated at the time of the IPO or bought shares in the secondary market immediately following the IPO, the investors may be able to generate some superior returns on average. Nevertheless, the cause and effect of this relationship with respect to the return behavior is not that clear at all and provides some room for speculation. From the empirical evidence it is obvious that the banks should keep the shares up to the end of the 6 months period and then should start selling their equity stake. On the other hand it could be argued that the positive performance at the end of the lock-up period is not random but in fact a result of the bank’s objective and activities. Possible explanations for such a price behavior are price support and positive analyst recommendations with the objective to create a favorable exit environment for their own investments. Consequently, the BHAR after six months can be interpreted as an intended overvaluation that vanishes slowly during the next six months. It is needless to say that such a bank strategy in the securities market is very problematic because it would disadvantage investors that invest in shares of IPOs at that time. In the next section we will gather some additional evidence on the bank behavior.
4.2.4 Analyst Recommendations
We will now investigate the analyst recommendations of the bank-financed IPOs in which the bank also acted as an analyst and venture capitalist. We collect the analyst recommendations from www.aktiencheck.de. For 3 IPOs analyst recommendations were not available. We exclude these IPOs, so that there remain 48 bank-backed IPOs. Altogether we find 48 analyst recommendations from banks which had equity stakes in an IPO. There are three recommendations that could be labeled as neutral. In 45 instances the analysts of the banks recommended to buy the shares. Obviously it is not surprising at all that the banks usually do not recommend to their clients to divest the shares of IPOs in which they hold themselves an equity stake, especially when they cannot sell their own stake before the end of the lock-up period. However, the number of buy recommendations for an IPO is quite different. For 14 of the 48 IPOs we observe at least two buy recommendations from the invested bank. In this instances it can be assumed that the objective of the bank is to positively influence the price performance of the IPO. In Exhibit 7 and Table VII the performance of these 14 IPOs

15
is compared to the performance of the 34 IPOs that has received only one buy recommendation from the analysts of the underwriting and equity holding bank. Due to the small sample size the statistical tests and therefore the results have to be interpreted very carefully.
The IPOs for which the invested bank issued at least two buy recommendations have a BHAR of 91.5% over the first 6 months period. This is a much better performance than the 1.6% of the other bank-financed IPOs. At the end of the first year, however, the difference in returns have diminished again substantially. There are different ways in which these results can be interpreted. To some extend the empirical results suggest that this is a situation with tremendous potential for conflicts of interest between banks and investors. Banks can take advantage of private information and they can be actively engaged in manipulating stock prices in order to generate excess returns for their own portfolio. The “Baader Wertpapierhandelsbank”, for example, recommended to buy shares of the “Softing AG” several times, even before the date of the IPO. The “Baader Wertpapierhandelsbank” was a major shareholder of this company and the lead underwriter.
Thus, there appears to be evidence that the banks used their privilege to issue buy recommendations to support stock prices and to exit then at very favorable prices. It is very difficult to see that these recommendations are in the interest of the ordinary investor. From the perspective of the small investor the equity ownership of banks, and especially the ownership of private equity and venture capital before an IPO, is very problematic especially then when the bank is also the underwriter or part of the underwriter group.
There are a variety of obvious conflicts of interests that are real and not academic when a bank acts as equity holders, underwriters, designated sponsors, analysts as well as commercial banker. From this perspective and with the empirical evidence provided in this study is quite obvious that at least in the United States there are some institutional changes planed that are in the interest of the ordinary investor and that are useful in reducing the agency problems of the investment banking business. Because these problems are even more dramatic in a universal banking system the German authorities need to act in order to reduce the apparent profit potential for banks and provide a fair and equal equity market.

16
5. Conclusions
The objective of this paper was to investigate the stock price performance of venture-backed and bank-financed IPOs that went public at the “Neuer Markt” in Germany between 1998 and 2001. Various theoretical and empirical (e.g. Glass Steagal-Act of 1933) considerations suggest that there are strong agency conflicts if an institutional shareholder simultaneously acts as a creditor, underwriter for the going public process or issues analyst recommendations. On the other hand, venture capital firms and possibly banks can signal the superior quality of an IPO (certification hypotheses) and reduce agency problems. Thus, this would result in a reduced underpricing and a better long-run performance of the IPO.
The empirical results suggest that there are in fact serious agency problems, especially when banks act as venture capitalists. During the first six months after the IPO, the owners including banks and venture capitalists usually are not allowed to sell their shares (lock-up period). As the agency theory would predict, for venture-backed IPOs there is a strong out-performance during the first six months after the IPO and a significant under-performance following the end of the lock up-period, if the lock-up commitment just fulfils the minimum requirements of 6 month. In case of longer lock-up periods, e.g. 12 or 18 months, the initial out-performance continues but does not increase further. For bank-backed IPOs we observe the opposite results. Extended lock-up periods of banks convey a negative signal. If the lock-up amounts to 6 month, the banks usually find ideal opportunities for an exit. Considering the underpricing of the IPOs at the “Neuer Markt”, venture capitalists and banks on average leave money on the table if they sell large equity stakes at the date of the initial public offering. Thus, a large sale of primary shares by banks and venture capitalists at the time of the IPO should be interpreted as a negative signal. The empirical results support this view. It appears that banks and venture capitalists are able to time their exit perfectly at the highest stock price. The interesting question that is being addressed at the end of this paper is whether the banks have certain timing abilities or whether they may use various means of influencing the stock price. The empirical results so far support the idea that to some extent banks manipulate the stock prices using overoptimistic analyst buy recommendations. Thus, there seems to be empirical evidence that especially banks act in their own interest and to the disadvantage of other investors.

17
References
Ber, Hedva, Yishay Yafeh and Oved Yosha (2001), Conflict of Interest in Universal Banking: Bank Lending, Stock Underwriting, and Fund Management, in: Journal of Monetary Economics 47, 189-218.
Bessler, Wolfgang and Stefan Thies (2002), Initial Public Offerings, Subsequent Seasoned Equity Offerings, and Long-Run Performance: Evidence from IPOs in Germany, in: Working Paper University of Giessen.
Brav, Alon and Paul A. Gompers (1997), Myth or Reality? The Long-Run Underperformance of Initial Public Offerings: Evidence from Venture and Nonventure Capital-Backed Companies, in: Journal of Finance 52, 1791-1821.
Brav, Alon and Paul A. Gompers (2003), The Role of Lock-ups in Initial Public Offerings, in: Review of Financial Studies 16, 1-29.
BVK (1996), Jahrbuch des Bundesverband Deutscher Kapitalbeteiligungsgesellschaften (German Venture Capital Association) e.V.
Espenlaub, Susanne, Ian Garrett and Wei Peng Mung (1999), Conflicts of Interest and the Performance of Venture-Capital-Backed IPOs: A Preliminary Look at the UK, in: Venture Capital 1, 325-349.
Espenlaub, Susanne, Marc Goergen and Arif Khurshed (2001), IPO Lock-in Agreements in the UK, in: Journal of Business Finance & Accounting 28, 1235-1278.
Field, Laura Casares and Gordon Hanka (2001), The Expiration of IPO Share Lockups, in: Journal of Finance 56, 471-500.
Francis, Bill B. and Iftekhar Hasan (2001), The Underpricing of Venture and Nonventure Capital IPOs: An Empirical Investigation, in: Journal of Financial Services Research 19, 99-113.
Franzke, Stefanie A. (2001), Underpricing of Venture-Backed and Non Venture-Backed IPOs: Germany's Neuer Markt, in: Working Paper University of Frankfurt.
Gerke, Wolfgang and Jörg Fleischer (2001), Die Performance der Börsengänge am Neuen Markt, in: Zeitschrift für betriebswirtschaftliche Forschung 53, 827-839.
Giudici, Giancarlo and Peter Roosenboom (2002), Pricing Initial Public Offerings in Europe: What Has Changed?, in: Working Paper University Bergamo.
Gompers, Paul and Josh Lerner (1998), Venture Capitalist Distributions: Short-Run and

18
Long-Run Reactions, in: Journal of Finance 53, 2161-2183.
Gompers, Paul and Josh Lerner (1999), Conflict of Interest in the Issuance of Public Securities: Evidence from Venture Capital, in: Journal of Law and Economics 42, 1-28.
Ibbotson, Roger G., Jody L. Sindelar and Jay R. Ritter (1988), Initial Public Offerings, in: Journal of Applied Corporate Finance 1, 37-45.
Kiss, Imre and Richard Stehle (2002), Underpricing and Long-Term Performance of Initial Public Offerings at Germany's Neuer Markt, Working Paper Humbold University Berlin.
Lerner, Joshua (1994), Venture Capitalists and the Decision to Go Public, in: Journal of Financial Economics 35, 293-316.
Li, Xi and Ronald W. Masulis (2003), Venture Capital Investments by IPO Underwriters: Certification or Conflict of Interest?, in: Working Paper University of Miami and Vanderbilt University.
Lin, Hsiou-wei and Maureen F. McNichols (1998), Underwriting Relationship, Analysts' Earnings Forecasts and Investment Recommendations, in: Journal of Accounting and Economics 25, 101-127.
Loughran, Tim and Jay R. Ritter (1995), The New Issues Puzzle, in: Journal of Finance 50, 23-51.
Loughran, Tim and Jay R. Ritter (2002), Why Don’t Issuers Get Upset About Leaving Money on the Table in IPOs?, in: Review of Financial Studies 15, 413-443.
Loughran, Tim and Jay R. Ritter (2003), Why Has IPO Underpricing Changed Over Time?, in: Working Paper University of Notre Dame and University of Florida.
Megginson, William L. and Kathleen A. Weiss (1991), Venture Capitalist Certification in Initial Public Offerings, in: Journal of Finance 46, 879-903.
Michaely, Roni and Kent L. Womack (1999), Conflict of Interest and the Credibility of Underwriter Analyst Recommendation, in: Review of Financial Studies 12, 653-686.
Nowak, Eric and Alexandra Gropp (2002), Ist der Ablauf der Lock-up-Frist bei Neuemissionen ein kursrelevantes Ereignis? Eine empirische Analyse von Unternehmen des Neuen Marktes, in: Working Paper University of Frankfurt.
Puri, Manju (1996), Commercial Banks in Investment Banking: Conflict of Interest or

19
Certification Role?, in: Journal of Financial Economics 40, 373-401.
Puri, Manju (1999), Commercial Banks as Underwriters: Implications for the Going Public Process, in: Journal of Financial Economics 54, 133-163.
Ritter, Jay R. (1984), The "Hot Issue" Market of 1980, in: Journal of Business 57, 215-240.
Ritter, Jay R. (1991), The Long-Run Performance of Initial Public Offerings, in: Journal of Finance 46, 3-27.
Stehle, Richard and Olaf Ehrhardt (1999), Renditen bei Börseneinführungen am deutschen Kapitalmarkt, in: Zeitschrift für Betriebswirtschaft 69, 1395-1422.
Wang, Kangmao, Clement K. Wang and Qing Lu (2002), Differences in Performance of Independent and Finance-Affiliated Venture Capital Firms, in: Journal of Financial Research 25 (1), 59-80.

I
Appendix
Exhibit 1. Venture-Backed versus Non Venture-Backed IPOs. The IPOs are divided into two subsamples. Venture-backed are those IPOs, where an independent venture capital firm is involved in an IPO at the date of the going public. The remaining IPOs are defined as non venture-backed. The shareholdings are gathered from each offering prospectus. The ordinate depicts the mean buy and hold abnormal returns and the abscissa the trading days after the going public. 123 trading days correspond to 6 month and 367 trading days to 18 month.
0,00
0,05
0,10
0,15
0,20
0,25
0,30
0,35
0,40
0,45
0,50
2 17 32 47 62 77 92 107 122 137 152 167 182 197 212 227 242 257 272 287 302 317 332 347 362
Venture-Backed (N=75)Non Venture-Backed (N=232)

II
Table I
Venture-Backed versus Non Venture-Backed IPOs The Table reports the mean buy and hold abnormal return (BHAR) of venture-backed and non venture-backed IPOs after 123 and 367 trading days (about 6 month and 18 month, respectively). N stands for the sample size and VAR for the variance of the BHAR. To test whether the BHAR differ from zero significantly (Table Ia) we apply Student’s t test (t-Stat) and a simple sign test (z-Stat). Furthermore we test whether the mean returns of both subsamples differ significantly applying a t test for differences between means and Wilcoxon’s test of sum of ranks (Table Ib). The levels of significance are depicted by asterisks (* at 10%, ** at 5% and *** at 1%).
Table Ia Criteria Interval BHAR N VAR t-Stat % Neg. z-Stat
Venture-Backed T [2, 123] 41.3% 75 1.37 3.06*** 46.7% 0.69
Non Venture-Backed T [2, 123] 23.8% 232 1.21 3.30*** 54.7% -1.38
Venture-Backed T [2, 367] 18.9% 75 2.38 1.06 62.7% -2.08**
Non Venture-Backed T [2, 367] 7.3% 232 2.76 0.67 64.2% -4.27***
Table Ib
Criteria Interval BHAR N VAR t-Stat % Neg. z-Stat
Venture-Backed T [2, 123] 41.3% 75 1.37 46.7%
Non Venture-Backed T [2, 123] 23.8% 232 1.21 1.14
54.7% 1.40
Venture-Backed T [2, 367] 18.9% 75 2.38 62.7%
Non Venture-Backed T [2, 367] 7.3% 232 2.76 0.55
64.2% 0.71
III
Exhibit 2. Venture-Backed IPOs and the Lock-up Commitment. In 61 cases the venture capitalist’s share at the IPO exceeds 5% after the going public. In 16 cases the venture capitalists commits to a lock-up period longer than 6 month. In the remaining cases (45) the venture capitalist only commits to the minimum requirement of 6 month. The lock-up commitments are gathered from each offering prospectus. The ordinate depicts the mean buy and hold abnormal returns and the abscissa the trading days after the going public. 123 trading days correspond to 6 month and 367 trading days to 18 month.
-0,10
0,00
0,10
0,20
0,30
0,40
0,50
0,60
0,70
0,80
0,90
2 17 32 47 62 77 92 107 122 137 152 167 182 197 212 227 242 257 272 287 302 317 332 347 362
Lock-up = 6 Month (N=45)Lock-up > 6 Month (N=16)

IV
Table II
Venture-Backed IPOs and the Lock-up Commitment The table reports the mean buy and hold abnormal returns (BHAR) after 123 and 367 trading days (about 6 month and 18 month, respectively) of venture-backed IPOs depending on the lock-up period. N stands for the sample size and VAR for the variance of the BHAR. To test whether the BHAR differ from zero significantly (Table IIa) we apply Student’s t test (t-Stat) and a simple sign test (z-Stat). Furthermore we test whether the mean returns of both subsamples differ significantly applying a t test for differences betwwen means and Wilcoxon’s test of sum of ranks (Table IIb). The levels of significance are depicted by asterisks (* at 10%, ** at 5% and *** at 1%).
Table IIa Criteria Interval BHAR N VAR t-Stat % Neg. z-Stat
Lock-up = 6 Month T [2, 123] 42.6% 45 1.89 2.08** 51.1% 0.00
Lock-up > 6 Month T [2, 123] 55.3% 16 0.60 2.86*** 18.8% 2.75**
Lock-up = 6 Month T [2, 367] -5.6% 45 1.07 0.36 62.2% -1.49
Lock-up > 6 Month T [2, 367] 59.1% 16 3.44 1.27 56.3% -0.25
Table IIb Criteria Interval BHAR N VAR t-Stat % Neg. z-Stat
Lock-up = 6 Month T [2, 123] 42.6% 45 1.89 51.1%
Lock-up > 6 Month T [2, 123] 55.3% 16 0.60 -0.45
18.8% -2.00**
Lock-up = 6 Month T [2, 367] -5.6% 45 1.07 62.2%
Lock-up > 6 Month T [2, 367] 59.1% 16 3.44 -1.32
56.3% -1.32

V
Exhibit 3. Venture-Backed IPOs and their Sale of Secondary Shares at the Primary Market. The 72 venture-backed IPOs are separated by the criteria, whether the venture capitalist sells more than 15% of his shares at the primary market. 3 venture-backed IPOs are excluded, because the VC owns more than 50% of the company, so that we assume a sale of primary shares does not convey a negative signal. In 44 cases the venture capitalists sell more than 15% of their primary shares at the date of the going public. The shareholdings (pre and post IPO) are gathered from each offering prospectus. The ordinate depicts the mean buy and hold abnormal returns and the abscissa the trading days after the going public. 123 trading days correspond to 6 month and 367 trading days to 18 month.
-0,30
-0,20
-0,10
0,00
0,10
0,20
0,30
0,40
0,50
0,60
0,70
2 17 32 47 62 77 92 107 122 137 152 167 182 197 212 227 242 257 272 287 302 317 332 347 362
% Sale > 15% (N=44)% Sale < 15% (N=28)

VI
Table III Venture-Backed IPOs and their Sale of Secondary Shares at the Primary Market The table reports the mean buy and hold abnormal returns (BHAR) after 123 and 367 trading days (about 6 month and 18 month, respectively) of venture-backed IPOs depending on the sale of their shares at the primary market. N stands for the sample size and VAR for the variance of the BHAR. To test, whether the BHAR differ from zero significantly (Table IIIa) we apply Student’s t test (t-Stat) and a simple sign test (z-Stat). Furthermore we test whether the mean returns of both subsamples differ significantly applying a t test for differences between means and Wilcoxon’s test of sum of ranks (Table IIIb). The levels of significance are depicted by asterisks (* at 10%, ** at 5% and *** at 1%).
Table IIIa Criteria Interval BHAR N VAR t-Stat % Neg. z-Stat
% Sale > 15% T [2, 123] 30.0% 44 0.66 2.45** 50.0% 0.15
% Sale < 15% T [2, 123] 64.4% 28 2.55 2.13** 35.7% 1.70*
% Sale > 15% T [2, 367] 42.8% 44 3.56 1.50 62.5% -1.36
% Sale < 15% T [2, 367] -28.0% 28 0.26 -2.91** 75.0% -2.46**
Table IIIb Criteria Interval BHAR N VAR t-Stat % Neg. z-Stat
% Sale > 15% T [2, 123] 30.0% 44 0.66 50.0%
% Sale < 15% T [2, 123] 64.4% 28 2.55 -1.06
35.7% -0.73
% Sale > 15% T [2, 367] 42.8% 44 3.56 62.5%
% Sale < 15% T [2, 367] -28.0% 28 0.26 2.36**
75.0% 1.66*

VII
Exhibit 4. Bank-Backed versus Non Bank-Backed IPOs. The IPOs are divided into two subsamples. If a bank or a bank-owned venture capitalist is involved in an IPO at the date of the going public, the IPO is graduated as bank-backed. The remaining IPOs are defined as non bank-backed. The shareholdings are gathered from each offering prospectus. The ordinate depicts the mean buy and hold abnormal returns and the abscissa the trading days after the going public. 123 trading days correspond to 6 month and 367 trading days to 18 month.
-0,05
0,00
0,05
0,10
0,15
0,20
0,25
0,30
0,35
2 17 32 47 62 77 92 107 122 137 152 167 182 197 212 227 242 257 272 287 302 317 332 347 362
Bank-Backed (N=51)Non Bank-Backed (N=256)

VIII
Table VI
Bank-Backed versus Non Bank-Backed IPOs The Table reports the mean buy and hold abnormal return (BHAR) of bank-backed and non bank-backed IPOs after 123 and 367 trading days (about 6 month and 18 month, respectively). N stands for the sample size and VAR for the variance of the BHAR. To test, whether the BHAR differ from zero significantly (Table VIa) we apply Student’s t test (t-Stat) and a simple sign test (z-Stat). Furthermore we test whether the mean returns of both subsamples differ significantly applying a t test for differences between means and Wilcoxon’s test of sum of ranks (Table VIb). The levels of significance are depicted by asterisks (* at 10%, ** at 5% and *** at 1%).
Table VIa Criteria Interval BHAR N VAR t-Stat % Neg. z-Stat
Bank-Backed T [2, 123] 23.3% 51 1.13 1.57 56.9% -0.84
Non Bank-Backed T [2, 123] 29.0% 256 1.28 4.10*** 62.8% -4.06***
Bank-Backed T [2, 367] 4.1% 51 0.71 0.35 51.6% 0.00
Non Bank-Backed T [2, 367] 11.4% 256 3.05 1.04 64.1% -4.44***
Table VIb
Criteria Interval BHAR N VAR t-Stat % Neg. z-Stat
Bank-Backed T [2, 123] 23.3% 51 1.13 56.9%
Non Bank-Backed T [2, 123] 29.0% 256 1.28 -0.35
62.8% -0.51
Bank-Backed T [2, 367] 4.1% 51 0.71 51.6%
Non Bank-Backed T [2, 367] 11.4% 256 3.05 -0.45
64.1% -0.78

IX
Exhibit 5. Bank-Backed IPOs and the Lock-up Commitment. In 49 cases the bank owns some shares at the IPO after the going public. In 17 cases the bank commits to a lock-up period longer than 6 month. In the remaining cases (32) the venture capitalist only commits to the minimum requirement of 6 month. The lock-up commitments are gathered from each offering prospectus. The ordinate depicts the mean buy and hold abnormal return and the abscissa the trading days after the going public. 123 trading days correspond to 6 month and 367 trading days to 18 month.
-0,20
-0,10
0,00
0,10
0,20
0,30
0,40
0,50
0,60
2 17 32 47 62 77 92 107 122 137 152 167 182 197 212 227 242 257 272 287 302 317 332 347 362
Lock-up = 6 Month (N=32)Lock-up > 6 Month (N=17)

X
Table V
Bank-Backed IPOs and the Lock-up Commitment The table reports the mean buy and hold abnormal returns (BHAR) after 123 and 367 trading days (about 6 month and 18 month, respectively) of bank-backed IPOs depending on the lock-up period. N stands for the sample size and VAR for the variance of the BHAR. To test, whether the BHAR differ from zero significantly (Table Va) we apply Student’s t test (t-Stat) and a simple sign test (z-Stat). Furthermore we test whether the mean returns of both subsamples differ significantly applying a t test for differences between means and Wilcoxon’s test of sum of ranks (Table Vb). The levels of significance are depicted by asterisks (* at 10%, ** at 5% and *** at 1%).
Table Va Criteria Interval BHAR N VAR t-Stat % Neg. z-Stat
Lock-up = 6 Month T [2, 123] 43.5% 32 1.67 1.90* 56.3% -0.53
Lock-up > 6 Month T [2, 123] -10.0% 17 0.09 1.37 52.9% 0.00
Lock-up = 6 Month T [2, 367] 16.7% 32 0.96 0.96 56.3% -0.53
Lock-up > 6 Month T [2, 367] -15.7% 17 0.27 1.25 76.5% -1.94*
Table Vb
Criteria Interval BHAR N VAR t-Stat % Neg. z-Stat
Lock-up = 6 Month T [2, 123] 43.5% 32 1.67 56.3%
Lock-up > 6 Month T [2, 123] -10.0% 17 0.09 2.23**
52.9% 1.20
Lock-up = 6 Month T [2, 367] 16.7% 32 0.96 56.3%
Lock-up > 6 Month T [2, 367] -15.7% 17 0.27 1.52
76.5% 0.90

XI
Exhibit 6. Bank-Backed IPOs and their Sale of Secondary Shares at the Primary Market. The 51 bank-backed IPOs are separated by the criteria, whether the bank sells more than 10% of his shares at the primary market. In 31 cases the banks sell more than 10% of their primary shares at the date of the going public. The shareholdings (pre and post IPO) are gathered from each offering prospectus. The ordinate depicts the mean buy and hold abnormal returns and the abscissa the trading days after the going public. 123 trading days correspond to 6 month and 367 trading days to 18 month.
-0,20
-0,10
0,00
0,10
0,20
0,30
0,40
0,50
0,60
0,70
2 17 32 47 62 77 92 107 122 137 152 167 182 197 212 227 242 257 272 287 302 317 332 347 362
% Sale > 10% (N=31)% Sale < 10% (N=20)

XII
Table VI Bank-Backed IPOs and their Sale of Secondary Shares at the Primary Market
The table reports the mean buy and hold abnormal returns (BHAR) after 123 and 367 trading days (about 6 month and 18 month, respectively) of bank-backed IPOs depending on the sale of their shares at the primary market. N stands for the sample size and VAR for the variance of the BHAR. To test, whether the BHAR differ from zero significantly (Table VIa) we apply Student’s t test (t-Stat) and a simple sign test (z-Stat). Furthermore we test whether the mean returns of both subsamples differ significantly applying a t test for differences between means and Wilcoxon’s test of sum of ranks (Table VIb). The levels of significance are depicted by asterisks (* at 10%, ** at 5% and *** at 1%).
Table VIa Criteria Interval BHAR N VAR t-Stat % Neg. z-Stat
% Sale > 10% T [2, 123] -4.1% 31 0.25 0.46 67.7% -1.80*
% Sale < 10% T [2, 123] 65.6% 20 2.29 1.94* 40.0% 1.12
% Sale > 10% T [2, 367] -0.4% 31 0.93 0.02 71.0% -2.16**
% Sale < 10% T [2, 367] 11.0% 20 0.40 0.78 50.0% 0.22
Table VIb
Criteria Interval BHAR N VAR t-Stat % Neg. z-Stat
% Sale > 10% T [2, 123] -4.1% 31 0.25 67.7%
% Sale < 10% T [2, 123] 65.6% 20 2.29 -1.99*
40.0% -1.95*
% Sale > 10% T [2, 367] -0.4% 31 0.93 71.0%
% Sale < 10% T [2, 367] 11.0% 20 0.40 -0.51
50.0% -1.06

XIII
Exhibit 7. Bank-Backed IPOs and Analyst Recommendations. The bank-backed IPOs are separated by the criteria, how intense the banks’ analysts recommend to buy the shares of the IPO in the first 18 month of trading. In 14 cases, the bank as a shareholder of the IPO issues two ore more buy recommendations. In the remaining 34 cases the bank utters no or only one buy recommendation. The analyst recommendations are gatherd from www.aktiencheck.de. The ordinate depicts the mean buy and hold abnormal return and the abscissa the trading days after the going public. 123 trading days correspond to 6 month and 367 trading days to 18 month.
-0,20
0,00
0,20
0,40
0,60
0,80
1,00
1,20
1,40
2 17 32 47 62 77 92 107 122 137 152 167 182 197 212 227 242 257 272 287 302 317 332 347 362
Max. 1 Buy Recommendation (N=34)
Min. 2 Buy Recommendations (N=14)

XIV
Table VII
Bank-Backed IPOs and Analyst Recommendations The table reports the mean buy and hold abnormal returns (BHAR) after 123 and 367 trading days (about 6 month and 18 month, respectively) of bank-backed IPOs depending on the number of buy recommendations published by the affiliated bank. N stands for the sample size and VAR for the variance of the BHAR. To test, whether the BHAR differ from zero significantly (Table VIIa) we apply Student’s t test (t-Stat) and a simple sign test (z-Stat). Furthermore we test whether the mean returns of both subsamples differ significantly applying a t test for differences between means and Wilcoxon’s test of sum of ranks (Table VIIb). The levels of significance are depicted by asterisks (* at 10%, ** at 5% and *** at 1%).
Table VIIa Criteria Interval BHAR N VAR t-Stat % Neg. z-Stat
Max. 1 Buy Recom. T [2, 123] 1.6% 34 0.29 0.17 58.8% -0.86
Min. 2 Buy Recom. T [2, 123] 91.5% 14 3.12 1.94* 35.7% 1.34
Max. 1 Buy Recom. T [2, 367] 4.5% 34 0.59 0.34 58.8% -0.86
Min. 2 Buy Recom. T [2, 367] 13.5% 14 1.12 0.48 64.3% -0.8
Table VIIb Criteria Interval BHAR N VAR t-Stat % Neg. z-Stat
Max. 1 Buy Recom. T [2, 123] 1.6% 34 0.29 58.8%
Min. 2 Buy Recom. T [2, 123] 91.5% 14 3.12 -1.87*
35.7% -1.70*
Max. 1 Buy Recom. T [2, 367] 4.5% 34 0.59 58.8%
Min. 2 Buy Recom. T [2, 367] 13.5% 14 1.12 -0.29
64.3% -0.18