respiration physiology (1984) 55, 175-192 175 elsevierwoodcm/woodblog/wp-content/uploads/... ·...
TRANSCRIPT
Respiration Physiology (1984) 55, 175-192 175 Elsevier
THE MECHANISMS OF ACID-BASE AND IONOREGULATION IN THE FRESHWATER RAINBOW TROUT DURING ENVIRONMENTAL HYPEROXIA AND SUBSEQUENT NORMOXIA. III. BRANCHIAL
EXCHANGES
B
CHRIS M. WOOD, MICHELE G. WHEATLY* and HELVE HOBE**
Department of Biology, McMaster University, Hamilton, Ontario, Canada LBS 4KI
H + Al~traet. Fluxes of both acidic equivalents (Jnet) and electrolytes across the gills were continuously monitored in the freshwater rainbow trout (Salmo gairdneri) during 24 h normoxia (PIo2 = 120-150 torr; control), 72 h hyperoxia (Pro2 = 500-600 torr), and 24 h return to normoxia. A highly negative
H + Jnet (i.e., excretion) was responsible for over 90~o of the compensation of respiratory acidosis induced by hyperoxia in the whole animal. Similarly, a highly positive JnH~ (i.e., uptake) accounted for virtually all the compensation of metabolic alkalosis induced by normoxic recovery. Hyperoxia was associated with a small net gain of Na + and large net losses of C l - at the gills, while normoxic recovery was associated with large net losses of Na + and net gains of C!- , effects reflected in ECF composition. Unidirectional flux analyses with radiotracers (22Na, 36C1) demonstrated that these net flux alterations resulted from rapid and complex changes in both influx and effiux components such that the difference
H + between I sa+ and J~net- was stoichiometrically equivalent to Jnet • The results support the concept that - n e t
Na ÷ vs acidic equivalent (I-I +, Nl-I4* ) and CI- vs basic equivalent (HCO3-, O H - ) exchanges at the gill are dynamically adjusted in order to correct internal acid-base disturbances.
Acid-base balance Hyperoxia Branchial fluxes lonoregulation Chloride exchange Salmo gairdneri Gills Sodium exchange
The renal response, while extremely important in HCO3- conservation, accounted for less than 10% of the total removal of acidic equivalents from extra- and intra- cellular compartments which compensated the respiratory acidosis of hyperoxia in the rainbow trout (Wheatly et al., 1984; HDbe et al., 1984). A similarly small urinary contribution occurred during the alkalotic compensation of normoxic recovery. A significant involvement of the gills therefore seemed likely. A number
Accepted for publication 18 November 1983
* Present address: Department of Zoology, University of Florida, Gainesville, FL 32611, U.S.A. ** Present address : Department of Biology, University of Calgary, Calgary, Alberta, Canada T2N IN4.
0034-5687/84/$03.00 © 1984 Elsevier Science Publishers B.V.

176 C.M. WOOD et al.
of recent studies have demonstrated that the teleost gill (and also the crustacean gill; Dejours et al., 1982) has the capacity for net transfer of acidic equivalents in either direction between the animal and its environment (Maetz, 1973; Cameron, 1980; Cameron and Kormanik, 1982a,b; Heisler, 1980, 1982; McDonald and Wood, 1981; McDonald et al., 1983). The first goal of the present study was to quantitatively assess the importance of such branchial fluxes in the internal acid- base adjustments observed during the normoxia-hyperoxia-normoxia regime in the trout.
The mechanisms of acid-base regulation by the gill remain controversial. Dating from the original work of Krogh (1939), Garcia-Romeu and Maetz (1964) and Maetz and Garcia-Romeu (1964), there is now a vast body of literature demon- strating the presence of independent Na + vs acidic equivalent (NH~, H ÷) and CI- vs basic equivalent (HCO3-, OH-) exchanges in the freshwater teleost gill. Experi- mental interference with Na ÷ or CI- uptake (e.g., pharmacologically, or by selective ionic manipulation of internal or external environments) generally disturbed acid-base equilibrium in the expected direction ( c f Cameron, 1978; Girard and Payan, 1980; Evans et al., 1982, for reviews). However, it is still unclear whether the rates of these exchanges are ever dynamically manipulated by the fish so as to achieve acid-base adjustment. Supporting the idea is the work of Cameron (1976) on Arctic grayling showing decreased branchial CI- influx and increased Na ÷ influx during compensation of a respiratory acidosis induced by external hyper- capnia. The latter was also seen in the Amazonian jejfi (Cameron and Wood, 1978). However, in opposition, Perry et al. (1981) found no changes in either Na ÷ or C1- influx during a similar hypercapnic acidosis in the rainbow trout. Kerstetter and Mize (1976) reported that blood lactacidosis had no effect on Na + or CI- influx in an anaesthetized, artificially ventilated trout preparation. Furthermore, Payan (1978) found that acidification of the internal perfusate inhibited Na ÷ influx in the isolated-perfused trout head, while Bornancin et al. (1979) reported that CI- influx was greatly stimulated during the respiratory acidosis of hyperoxia in the intact eel. The latter two observations are in fact exactly opposite what one would predict were branchial ionic exchanges actively modulated to achieve acid-base correction. In light of this controversy, a second goal was to assess the role of these ionic exchanges by continuous simultaneous measurements of acidic equivalent and ionic net flux rates at the gills during the normoxia-hyperoxia- normoxia regime, as well as unidirectional Na ÷ and C1- exchanges at selected times of particular interest.
In combination, the three parts of this investigation have monitored the acid-base status of the extra- and intracellular compartments (H~be et al., 1984), ECF electrolyte levels, and the net fluxes of major electrolytes and acidic equivalentS via the kidney (Wheatly et al., 1984) and gills (present study), during the hyperoxic regime. Therefore, the final aim of this study was to construct ion and acidic equivalent budgets for the whole animal during the experimental treatments.
BRANCHIAL RESPONSES TO HYPEROX1A IN TROUT 177
Materials and methods
Experimental animals and protocol. The treatment of the animals prior to expe- rimentation and the general test conditions have been outlined in H~be et al. (1984). The branchial flux data were obtained from the trout of Series III (mean wt = 281 + 12 g; n = 12) which were fitted with urinary catheters (Wood and Randall, 1973b) draining outside the 4-6 L flux chambers, thereby allowing simul- taneous determination of urinary fluxes (Wheatly et al., 1984). After the standard 72 h post-operative recovery, fluxes were measured during 24 h of normoxia (control; PIo: = 120-150 torr), 72 h of hyperoxia (Plo2 = 500-600 torr), and a final 24 h of normoxia. This study assumes, in the usual manner for freshwater fish, that all non-urinary fluxes are branchial in origin - i.e., that skin and gut exchanges are negligible. While this seems relatively safe for ion exchange, the possible role of the gut in acid-base exchange should not be overlooked (cf. Cameron, 1978).
Net branchial flux rates of ions and acidic equivalents were recorded over 10.5-12 h intervals. Water samples (50 ml) were withdrawn at the start and end of each period and analyzed for total ammonia, titratable alkalinity, Na ÷ , CI-, K ÷ , and Ca2÷. The 10.5-12 h measurements were prorated to the full 12 h so that these data cor- responded with urinary flux periods described in Wheatly et al. (1984). The short gaps represented flushing periods employed to keep water ammonia levels below ca. 500/aM • L -~ (cf. H~be et al., 1984). Thorough flushes (30 L/chamber) were performed at the start of the experiment, in between the two 12 h control periods ( - 12 h in figs.), at 12, 36, and 60 h of hyperoxia, and after 12 h return to normoxia (84 h in figs.). This protocol minimized disturbance at the start (0 h) and end (72 h) of hyperoxia. After each flush, the water level was reset precisely to a volume calibration mark.
Unidirectional influx rates of Na ÷ and CI- across the gills were measured by monitoring the disappearance of radioisotopes from the external medium (cf. Maetz, 1956). These measurements could not practically be performed over the entire 5 day experiment because continual isotopic loading of the fish would require a progressively larger backflux correction with increasing error. Instead, radio- tracer measurements were made only at times of maximum interest, the initial transition to hyperoxia and the later transition back to normoxia (e.g., fig. 4). Immediately after the flush between the two control periods (i.e., - 1 2 h), radio- tracers (5 #Ci 22Na, 2/iCi 36Cl; NEN) were added to each chamber and allowed to mix for ca. 0.5 h. Water samples (50 ml) were then drawn over three successive 3.5 h intervals, the last ending at time 0 h, when the equilibration gas was changed from air to 02. Once the desired Plo2 of 50(0600 torr was attained, a second identical batch of isotope was added and allowed to mix. Water samples were then drawn over three more successive 3.5 h intervals, starting at 1.5 h and ending at 12 h. A similar procedure was employed at the return to normoxia, with radiotracer measurements made over six 3.5 h intervals, three preceding and three following the changeover at 72 h. However, in order to improve the external to internal
178 C . M . W O O D et al.
specific activity ratio (in view of the previous radiotracer loading of the trout), each addition of isotope was doubled (i.e., I0 #Ci ZZNa, 4 #Ci ~CI). Each 3.5 h water sample was analyzed for 22Na and ~CI activities, total Na + and CI-, and ammonia. Changes in titratable alkalinity could only be reliably detected over the 10.5 h segments.
AnalytiCal techniques and calculations. 36C1- is a pure fl emitter, while 2ZNa is a mixed y and/~ emitter. Dual labelled water samples were prepared in duplicate, with 22Na alone measured by y counting in a well-counter (Nuclear Chicago Model 1085), and 22Na plus ~CI by scintillation counting (Beckman LS 250). After correction for differences in efficiency of 22Na counting by the two instruments, the 36C1 counts were obtained by subtraction. Water levels of Na + , K +, Ca 2÷, CI-, and total ammonia were determined as described for urine by Wheatly et al. (1984). Titratable alkalinity was determined by titration to pH 4.00 with 0.02 N HCI as described by McDonald and Wood (1981).
Net flux rates (J,c,).of each substance (e.g., X) were calculated as:
J~t ([X]i -[X]f) x V t x W (1)
where i and f refer to initial and final concentrations in #Eq. ml -~, V the volume of the system in ml, corrected for sampling deficits, t the elapsed time in h, and W the fish weight in kg. Thus net losses by the animal have a negative sign, net gains a positive sign. By reversing the i and f terms, the net titratable acidity flux was calculated from the titratable alkalinities. The net branchial flux of acidic
H + equivalents (J,c~) was calculated as the sum of the titratable acidity ( ~ ) and ammonia fluxes ,.,°~tT̂mm~,, signs considered, which derives from the original principles outlined by Maetz (1973). As McDonald and Wood (1981) point out, this method does not distinguish between ammonia movement in the NH 3 and NIL + forms, nor between the net excretion of acidic equivalents and the net uptake of basic equivalents, or vice versa. Fortunately this does not matter in terms of the acid- base status of the animal.
Unidirectional influxes ( J i n ) o f N a + and CI- were calculated as outlined by Maetz (1956) :
(Ri - Rf) x V Jin = SA x t x W (2)
where Ri and Rf are initial and final radioactivities in cpm. ml -t, SA the mean specific activity (cpm.#Eq -t) over the flux period in question, and the other symbols as in eq. (1). Because of the experimental design, calculated internal specific activity never exceeded 5~o of external specific activity, and therefore cor- rection for radioisotopic backflux in eq. (2) was unnecessary (cf. Maetz, 1956). Unidirectional outflux rates (-lout) were calculated by the conservation equation:
J , , t = Ji , + Jout (3)
BRANCHIAL RESPONSES TO HYPEROXIA IN TROUT 179
Statistical analyses. Methods follow those outlined in H~be et al. (1984) and Wheatly et al. (1984). With each fish serving as its own control, Student's paired two-tailed t-test was used throughout. Net flux data for the two initial 12 h normoxic periods were averaged for individual fish to produce control values. For unidirectional fluxes, the 3.5 h flux measurements were averaged over each 10.5 h segment to produce grand means for each treatment condition (i.e., control normoxia, start of hyperoxia, end of hyperoxia, and return to normoxia).
Results
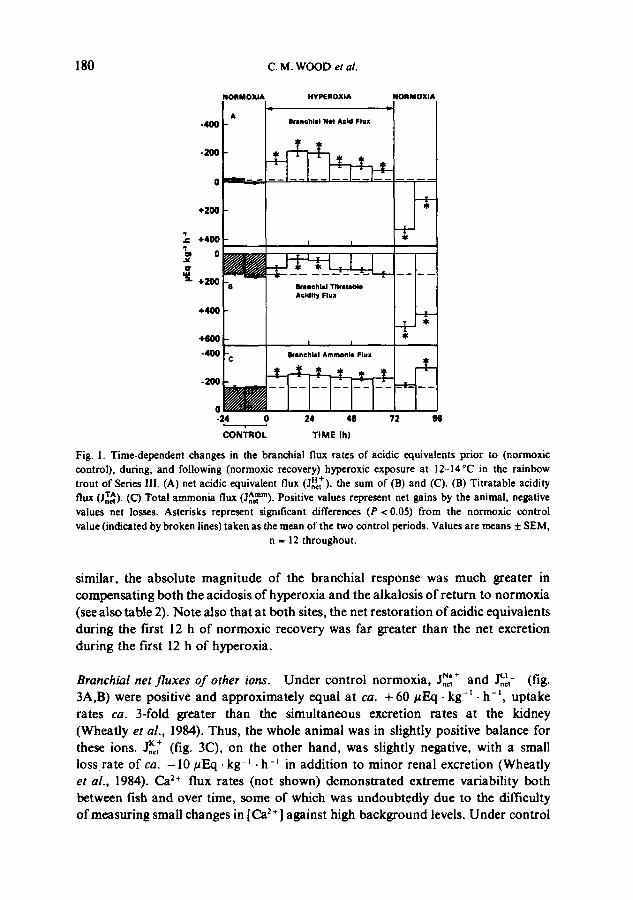
Branchial net f luxes o f acidic equivalents. Under normoxic conditions, a rather low JnAc~ 'm (--160.7 + 9.6 (12)/~Eq. kg -t .h - t ; fig. IC) was just balanced by the ~At (fig. IB) resulting in a negligible j,H~ of -9.3 + 9.2 (12)/~Eq. kg -~ .h -t (fig. 1A). This was similar to the situation at the kidney 0Vheatly et al., 1984). Upon exposure to hyperoxia, the net excretion of acidic equivalents across the gills increased substantially, reaching a peak of -214.2 + 35.6 (12)#Eq .kg -t .h -t at 12-24 h, thereafter slowly declining (fig. 1A); at 60-72 h, the flux was still elevated above control levels. These cha'nges in Jn~t reflected significant, approximately equal, modification of both components, with elevations in -,etlgm~ to --256.9_+ 9.6 (12) /~Eq-kg -~ .h -t at 12-24 h (fig. IC) and simultaneous decreases in ~ (fig. 1D). It cannot be emphasized too sh'ongly that unlike the renal measurements (Wheatly et al., 1984) the ammonia and titratable components of JnS~ + are not necessarily independent parameters, for the latter may or may not be affected by changes in the former. The fact that JA~tm increased at a time when ~,^ decreased suggests, but does not prove, that more ammonia was being excreted in the NH2 form. Measurements of JAeTm over 3.5 h periods (not shown) demonstrated that the response was rapid, reaching a value 36% above control over the first 5 h of hyperoxia.
On return to normoxia, a dramatic changeover to net branchial uptake of acidic equivalents (or base excretion) at a rate of + 330.4 + 28.1 (12) #Eq • kg -t • h -t was seen in the first 12 h, with a continued but attenuated net uptake over the second 12 h (fig. IA). Again both components were involved. There was a marked elevation of ~A (fig. 1B) while JnAet m returned to control levels (fig. IC). Measure- ments over 3.5 h intervals (not shown) demonstrated that the reduction in l^mm was - -ne t
complete within the first 5 h of normoxic recovery. However, paradoxically, the ammonia component rebounded during the second 12 h of normoxic recovery to a level higher than any seen during the entire hyperoxic period (fig. IC). This may have reflected the 3-fold increase in plasma ammonia levels at this time (see fig. 2B, Wheatly et al., 1984).
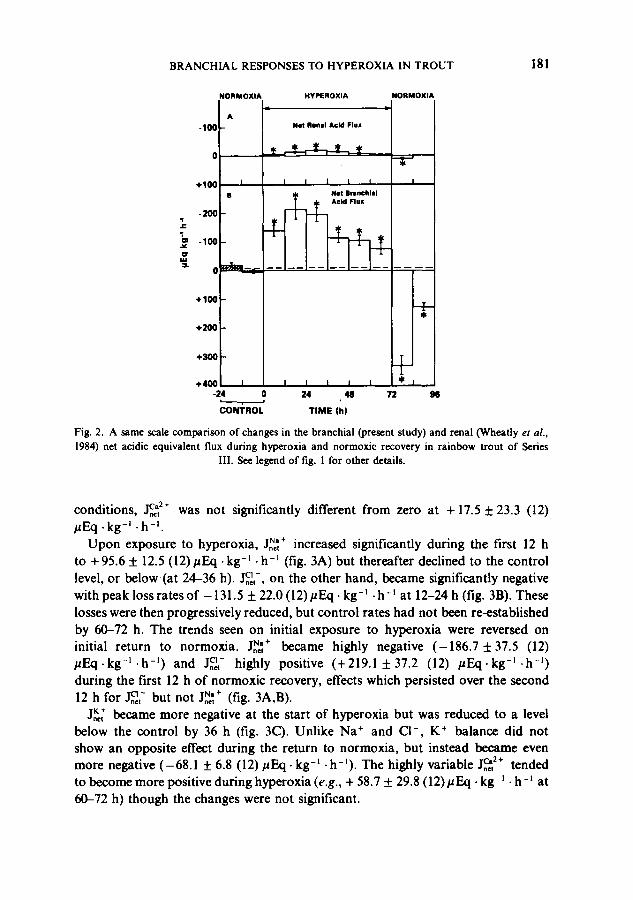
The simultaneous measurements of acidic equivalent fluxes through the gills and kidney (from Wheatly et al., 1984) have been compared on the same scale in fig. 2. Note that while the actual time courses of the two responses were rather
180 C.M. WOOD et al.
-2OO
4"200
NORMOXiA
A
HYPEROXiA
Ikllnohll)l Net Ac~ Flux
4"400 - - I I
o
.* mlm ~" 4'200 -8 Brxnohlal Tllratal~le
Acidity Flux
NOIIMOXIA
4"400
1[ 4t
I 4c
+600 ! I
-400 -C II~lnchlal Ammonia Flux
~ T f ~t t* T
-2o0-0 ~ - --I--I--l--l[ I I I _L. -24 0 24 48 72
CON'I 'RO L T I M E (h)
I
Fig. 1. Time-dependent changes in the branchial flux rates of acidic equivalents prior to (normoxic control), during, and following (normoxic recovery) hyperoxic exposure at 12-14°C in the rainbow
H + trout of Series lII. (A) net acidic equivalent flux (Jnct). the sum of (B) and (C). (B) Titratable acidity flux (Jnr~). (C) Total ammonia flux (jA~rn). Positive values represent net gains by the animal, negative values net losses. Asterisks represent significant differences (P < 0.05) from the normoxic control value (indicated by broken lines) taken as the mean of the two control periods. Values are means ± SEM,
n = 12 throughout.
similar, the absolute magnitude of the branchial response was much greater in compensating both the acidosis of hyperoxia and the alkaiosis o f return to normoxia (see also table 2). Note also that at both sites, the net restoration of acidic equivalents during the first 12 h of normoxic recovery was far greater than the net excretion during the first 12 h o f hyperoxia.
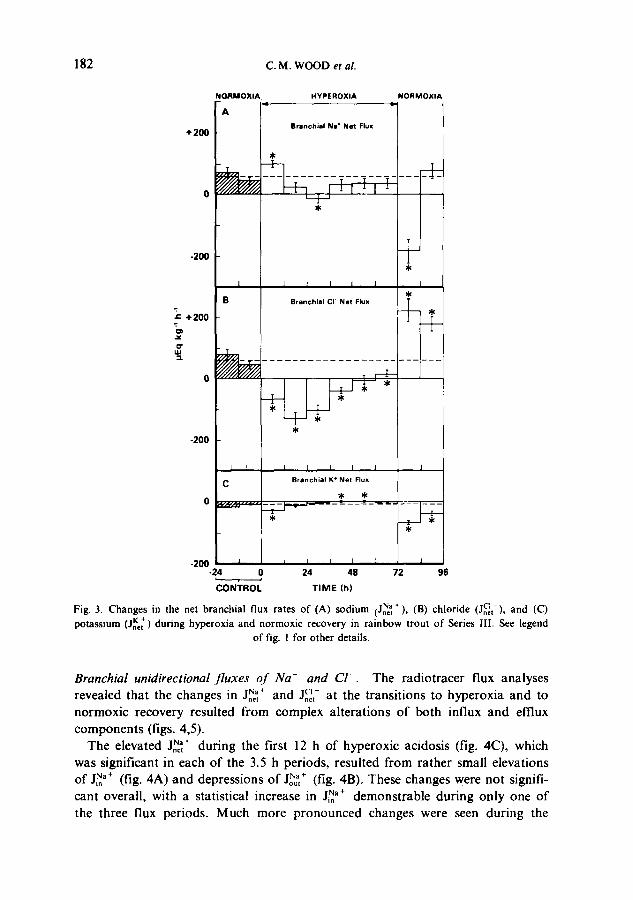
Branchial net f l u x e s o f other ions. Under control normoxia, -,c, IN" + and J,,~( (fig. 3A,B) were positive and approximately equal at ca. + 60/zEq- k g - l . h - i , uptake rates ca. 3-fold greater than the simultaneous excretion rates at the kidney (Wheatly et al., 1984). Thus, the whole animal was in slightly positive balance for these ions. J ,~ (fig. 3C), on the other hand, was slightly negative, with a small loss rate of ca. - 1 0 / ~ E q . kg -t • h -~ in addition to minor renal excretion (Wheatly et al., 1984). Ca 2÷ flux rates (not shown) demonstrated extreme variability both between fish and over time, some of which was undoubtedly due to the difficulty of measuring small changes in [Ca 2÷ ] against high background levels. Under control
BRANCHIAL RESPONSES TO HYPEROXIA IN TROUT 181
'7
O"
NORMOXIA HYPEROXlA
A -100 - Net Almill Acid Flux
I
-200 • T
-100
[ I | N e t IlrllnChlll
. . . ~ Acid Flux
NORMOXIA p
I
+100:
+200 d=
+300
+400 J i i 1 i -24 0 24 48 i i
CONI"ROL T I M E (h)
I I Iil l
7 2 N
Fig. 2. A same scale comparison of changes in the branchial (present study) and renal (Wheatly et al. ,
1984) net acidic equivalent flux during hyperoxia and normoxic recovery in rainbow trout of Series III. See legend of fig. 1 for other details.
| C a 2 + conditions, ,~, was not significantly different from zero at + 17.5 ± 23.3 (12) /~Eq .kg -I -h -I
Upon exposure to hyperoxia, J~,~+ increased significantly during the first 12 h to + 95.6 ± 12.5 (12)#Eq • kg -Ioh -1 (fig. 3A) but thereafter declined to the control level, or below(at 24-36 h). ~ , - , on the other hand, became significantly negative with peak loss rates of -131.5 ± 22.0 (l 2)#Eq. kg-~ • h- ~ at 12-24 h (fig. 3B). These losses were then progressively reduced, but control rates had not been re-established by 60-72 h. The trends seen on initial exposure to hyperoxia were reversed on initial return to normoxJa. J~,~+ became highly negative (-186.7 ±37.5 (12) # E q . k g -~ .h -~) and j c~- highly positive (+219.1 ±37.2 (12) #Eq-kg -~ .h -~) during the first 12 h of normoxie recovery, effects which persisted over the second 12 h for ~ , - but not J~+ (fig. 3A,B).
J,~ became more negative at the start of hyperoxia but was reduced to a level below the control by 36 h (fig. 3C). Unlike Na ÷ and Cl- , K ÷ balance did not show an opposite effect during the return to normoxia, but instead became even more negative (-68.1 ± 6.8 (12) #Eq-kg -~ .h-I). The highly variable ,]c2+ tended to become more positive during hyperoxia (e.g., + 58.7 ± 29.8 (12)#Eq • kg -~ • h -~ at 60-72 h) though the changes were not significant.
182 C.M. WOOD et al.
NORMOXIA. HYPEROXIA NORMOXIA
A
Branchial Na* Net Flux + 2 0 0
. . . . . .
0
-200
I
B
• = +~10
,Ig o"
o
-200
I ; I I I
Branchial Cl Net Flux
T
1
I
t *
I 1 I I I C Branchial K* Net Flux
~(_.dd--~-- ~ _ _=_e . . __~_ _
-200 l J I i I ; I -24 0 24 48 72 96
J CON: I 'ROL T I M E lh )
Fig. 3. Changes in the net branchial flux rates of (A) sodium (ane t'Na+ J,' (B) chloride ,tjCl-~nct ,, and (C) K + potass ium (Jnet) during hyperoxia and normoxic recovery in ra inbow trout o f Series III. See legend
of fig. 1 for other details.
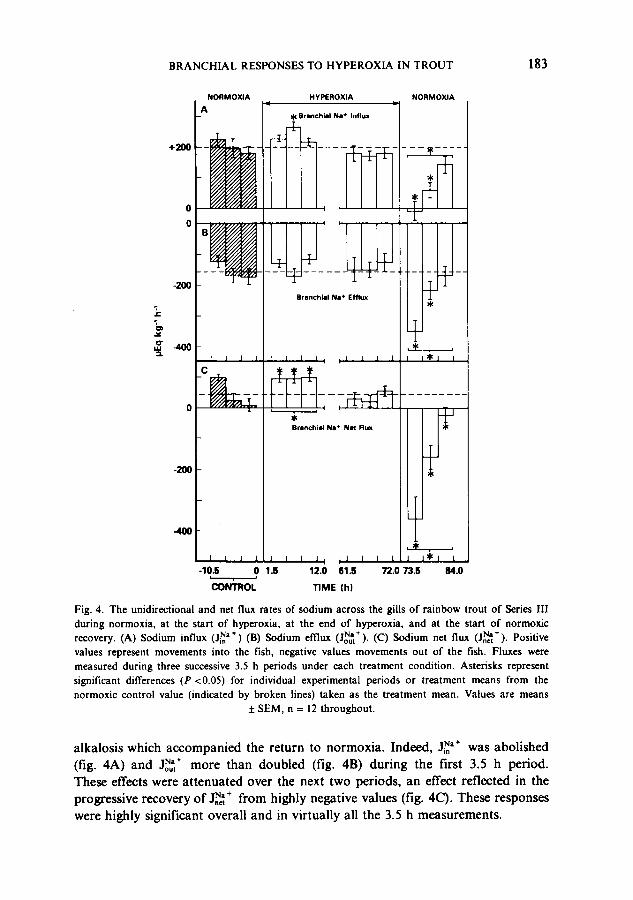
Branchial unidirectional f luxes o f Na" and C l . The radiotracer flux analyses revealed that the changes in _°,,-I ~"+ and J~,- at the transitions to hyperoxia and to normoxic recovery resulted from complex alterations of both influx and effiux components (figs. 4,5).
The elevated J~,~+ during the first 12 h of hyperoxic acidosis (fig. 4C), which was significant in each of the 3.5 h periods, resulted from rather small elevations of j~a+ (fig. 4A) and depressions of Jolt] ÷ (fig. 4B). These changes were not signifi- cant overall, with a statistical increase in jNa+ demonstrable during only one of the three flux periods. Much more pronounced changes were seen during the
B R A N C H I A L RESPONSES TO HYPEROX1A IN T R O U T 183
@ 2 0 0
-20o
t- E.
NORMOXIA HYPEROXIA NORMOXIA A
I I I I I:L--. 1.
I I I 1 I
-10.5 0 1.5 i i CON~OL
~f Brlmchial NIl + Influx
Branchial Na* Efftux
" - - ~ - "
1 I ! 1 , . 1 1 1 1 I J ) J t l
, i ' i i i
Branchial I ~ * Net Ru~
~ ,
I I I ~ ¢ 1 I
72.0 73.5 84.0 1 I I ; . I I
12.0 61.5
TIME Ih)
Fig. 4. The unidirectional and net flux rates of sodium across the gills o f rainbow trout o f Series 1II during normoxia, at the start of hyperoxia, at the end o f hyperoxia, and at the start of normoxic
/ l N a + ( i N a + recovery. (A) Sodium influx ,_,,CT~a+~, (B) Sodium efflux ~-out ). (C) Sodium net flux ~-net J- Positive values represent movements into the fish, negative values movements out of the fish. Fluxes were measured during three successive 3.5 h periods under each treatment condition. Asterisks represent
significant differences (P <0.05) for individual experimental periods or treatment means from the
normoxic control value (indicated by broken lines) taken as the treatment mean. Values are means ± SEM, n = 12 throughout .
alkalosis which accompanied the return to normoxia. Indeed, j~a+ was abolished (fig. 4A) and J~',÷ more than doubled (fig. 4B) during the first 3.5 h period. These effects were attenuated over the next two periods, an effect reflected in the progressive recovery of J~ + from highly negative values (fig. 4C). These responses were highly significant overall and in virtually all the 3.5 h measurements.
184 C.M. WOOD et al.
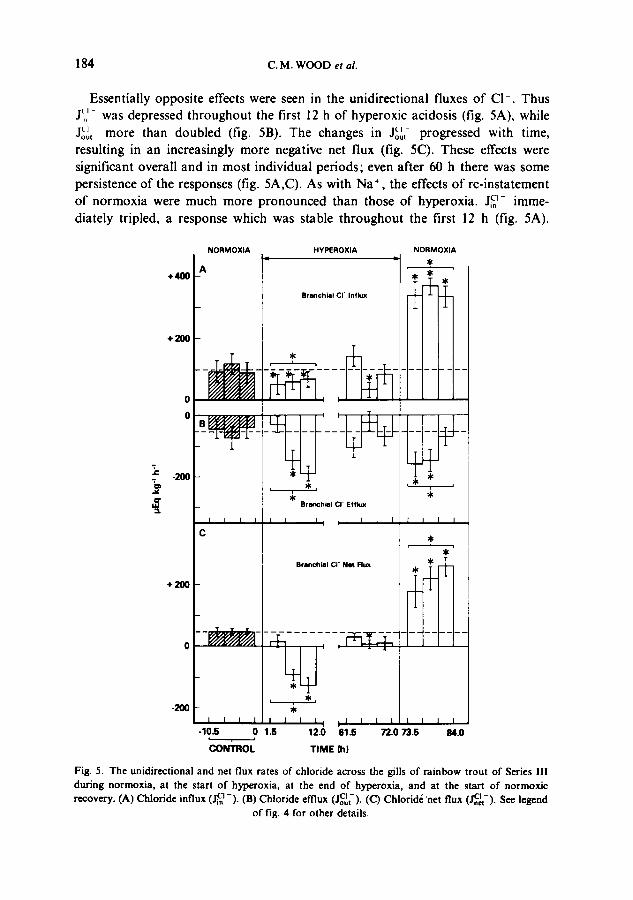
Essentially opposite effects were seen in the unidirectional fluxes of C1-. Thus J~i ~- was depressed throughout the first 12 h of hyperoxic acidosis (fig. 5A), while Jot~ more than doubled (fig. 5B). The changes in J~o~,- progressed with time, resulting in an increasingly more negative net flux (fig. 5C). These effects were significant overall and in most individual periods; even after 60 h there was some persistence of the responses (fig. 5A,C). As with Na ÷ , the effects of re-instatement of normoxia were much more pronounced than those of hyperoxia, j a - imme- diately tripled, a response which was stable throughout the first 12 h (fig. 5A).
.t¢
NORMOXlA
A + 4 0 0
+ 2 0 0
0
•2•
C
+ 2 O O
HYPtEROXIA
Brlmchia) c r Influx _I_
NORMOXIA
-
i , ~ * B r ~ h i a l I ~ E ~
t t t : i I I t I I I I
Branchial CJ" Net FhLx dt * J
t * J
i, I I I I , ; i i I I 1 I I I
-10JS 0 1 .5 1 2 . 0 0 1 . 5 J
COI~ROL TIME (h)
~ . 0 ~ . 5 ~ . 0
Fig. 5. The unidirectional and net flux rates of chloride across the gills of rainbow trout of Series III during normoxia, at the start of hyperoxia, at the end of hyperoxia, and at the start of normoxic recovery. (A) Chloride influx ( J~ -). (B) Chloride effiux (JoC~t-). (C) Chlorid~ 'net flux (J~.et-). See legend
of fig. 4 for other details.
B R A N C H I A L R E S P O N S E S T O H Y P E R O X I A 1N T R O U T 185
J~,-, rather than decreasing as might be predicted by analogy to the other data, actually increased significantly (fig. 5B), but the absolute change was much smaller than that in ~J~-, and had disappeared by the final 3.5 h period. These complex unidirectional alterations resulted in a large, progressive increase in J~,~ (fig. 5C). Overall, changes in CI- fluxes were much greater than those in Na + fluxes during hyperoxic acidosis, but of comparable size to the latter during normoxic alkalosis (figs. 3-5).
Relationships between branchial ion and acid--base exchange. The data of figs. 1,3,4 and 5 clearly indicate an interaction between Na ÷ , CI- and acidic equivalent fluxes at the gills, such that at times of acidic equivalent excretion, there was a more negative CI- balance and a more positive Na + balance, with the reverse at times of acidic equivalent uptake. However, the mechanisms of the inter- action are not readily apparent. Each of the four 10.5 h segments of unidirectional flux determination yielded simultaneous measurements of JnHet, -i.-INa+ , Jout~'~* , -n~F"a+ , CI - CI - CI -
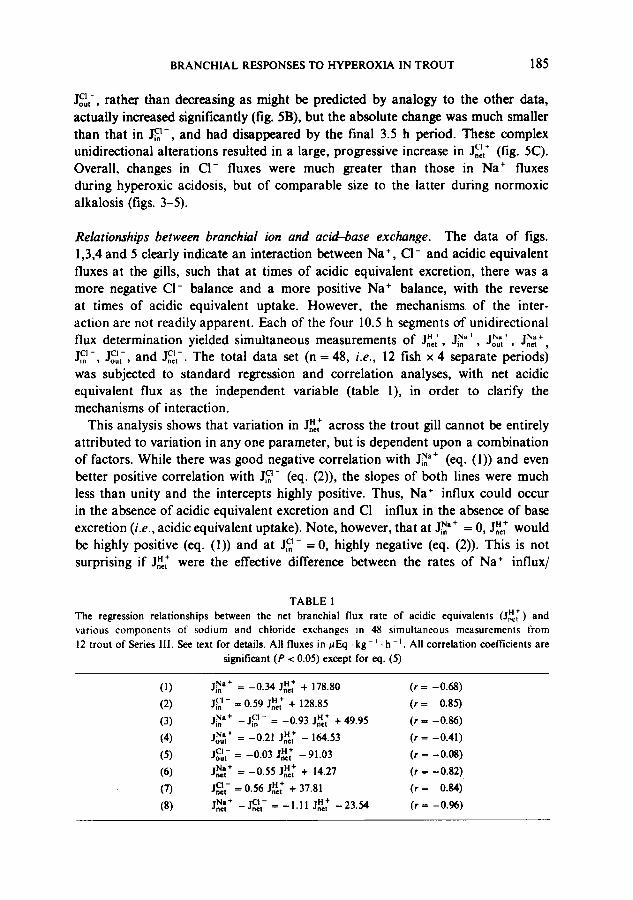
, Jnct • = J i . , Jou, and The total data set (n 48, i.e., 12 fish x 4 separate periods) was subjected to standard regression and correlation analyses, with net acidic equivalent flux as the independent variable (table I), in order to clarify the mechanisms of interaction.
This analysis shows that variation in J~e~ across the trout gill cannot be entirely attributed to variation in any one parameter, but is dependent upon a combination of factors. While there was good negative correlation with I Na+ -i, (eq. (1)) and even better positive correlation with J~- (eq. (2)), the slopes of both lines were much less than unity and the intercepts highly positive. Thus, Na + influx could occur in the absence of acidic equivalent excretion and CI- influx in the absence of base excretion (i.e., acidic equivalent uptake). Note, however, that at J~'+ = 0, J,",,+ would be highly positive (eq. (1)) and at Ji~- = 0, highly negative (eq. (2)). This is not surprising if JnHc~ " w e r e the effective difference between the rates of Na ÷ influx/
T A B L E 1 H + T h e r e g r e s s i o n r e l a t i o n s h i p s b e t w e e n t he ne t b r a n c h i a l f lux r a t e o f a c i d i c e q u i v a l e n t s ( Jne t ) a n d
v a r i o u s c o m p o n e n t s o r s o d i u m and c h l o r i d e e x c h a n g e s in 48 s i m u l t a n e o u s m e a s u r e m e n t s f r o m
12 t r o u t o f Se r i e s 111. See t ex t fo r de ta i l s . A l l f l uxes in # E q • kg - ~ • h - t. A l l c o r r e l a t i o n coe f f i c i en t s a r e
significant (P < 0.05) except for eq. (5)
iNa+ H+ (1) -,n = - 0 . 3 4 Jnet + 178.80 ( r = - 0 . 6 8 )
(2) JiCn I - = 0 .59 JnHe + + 128.85 ( r = 0 .85)
H + (3) J, Na+ - JiCln - = - 0 . 9 3 Jnet + 49 .95 ( r = - 0 . 8 6 )
iN a + H + (4) -o , t = --0.21 Jnet - 164.53 ( r = - 0 . 4 1 )
(5) J~out- = -0.03 J ~ - 91.03 (r = -0.08) iNa + H + (6). Jnet = - -0 .55 Jnet + 14.27 ( r = - 0 . 8 2 )
(7) JnOet - = 0 .56 JnH~ + 37.81 ( r = 0.84)
(8) -netlN'+ -- J~net- = - l . l l JnetH + - - 2 3 . 5 4 ( r = - 0 . 9 6 )
186 C .M . W O O D et al.
N H ; , H + efflux and CI- influx/HCOf, OH- efflux exchanges. In fact, when J~'+ - J i~- was regressed against J,~ (eq. (3)), there was excellent stoichiometry (slope = -0.93) and improved correlation, but the intercept remained significantly positive. Thus, even when Na + and C1- influx rates were equal, the gill could still take up acidic equivalents. Examination of the outflux relationship explains why this is so. There was a significant negative correlation of low slope (-0.21) between Jn~t and J~t + (eq. (4)), suggesting that a rise in Na ÷ outflux might effect acidic equivalent uptake by a reversal of the mechanisms. There was no such relationship with JoC~t - (eq. (5)); however if the paradoxical data showing increased Cl - outflux during the first two periods of normoxic recovery (fig. 5B) were deleted, then a significant positive correlation of low slope occurred, suggesting that increased CI- outflux could effect acidic equivalent excretion (i.e., base uptake). Ifoutflux as well as influx modulations must be taken into account, then J.~ should
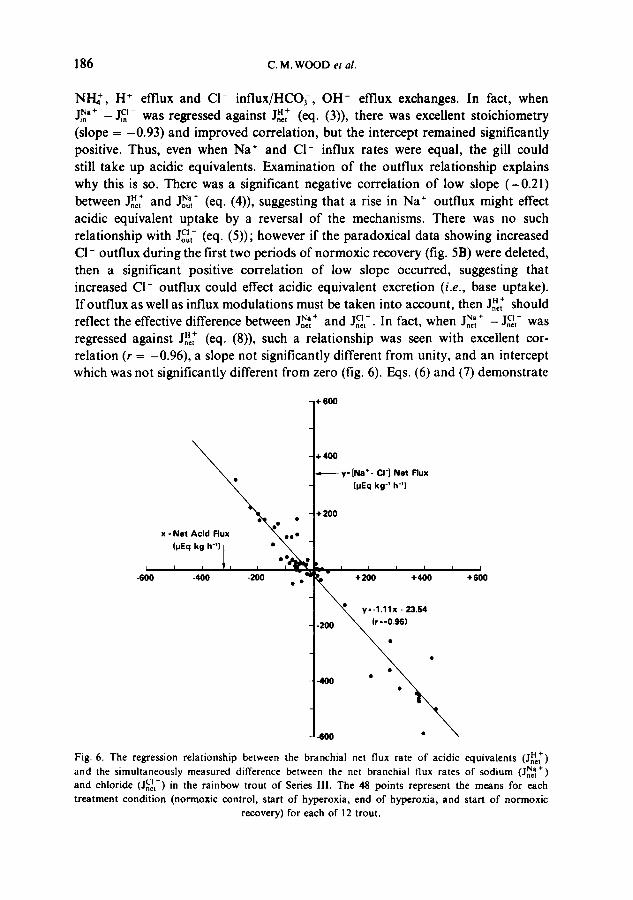
]Na + CI - reflect the effective difference between _=,I N" + and J.~,-. In fact, when -=t - J , , , was regressed against Jn~, + (eq. (8)), such a relationship was seen with excellent cor- relation (r = -0.96), a slope not significantly different from unity, and an intercept which was not significantly different from zero (fig. 6). Eqs. (6) and (7) demonstrate
4-600
~ % _ ~ 400 ,, y-[Na*- Q'l Net Flux
(pEq kg -~ h-')
+ 200
x = Net Acid Rux ~ o • O
(,~Eq k . h-') I • \ t • • • n
-600 -400 -200 • o e ~ +200 +400 +600
t \ I "~ y--1.11x - 23.54 -200 ~ ] •
H+ Fig. 6. The regression relationship between the branchial net flux rate o f acidic equivalents (J .*t) and the simultaneously measured difference between the net branchial flux rates of sodium (JnNe~ ÷) and chloride c l - (Jnet) in the rainbow trout of Series Ill. The 48 points represent the means for each treatment condition (normoxic control, start of hyperoxia, end of hypcroxia, and start o f normoxic
recovery) for each of 12 trout.
BRANCHIAL RESPONSES TO HYPEROX1A IN TROUT 187
that the relative influences of the individual Na ÷ and CI- net flux components were approximately equal. Thus over a wide range from highly positive to highly negative values, variations in the net flux of acidic equivalents across the gills in this data set could be explained on a 1 : 1 basis by modulation of the relative rates of Na ÷/acidic equivalent and Cl-/basic equivalent exchanges.
Discussion
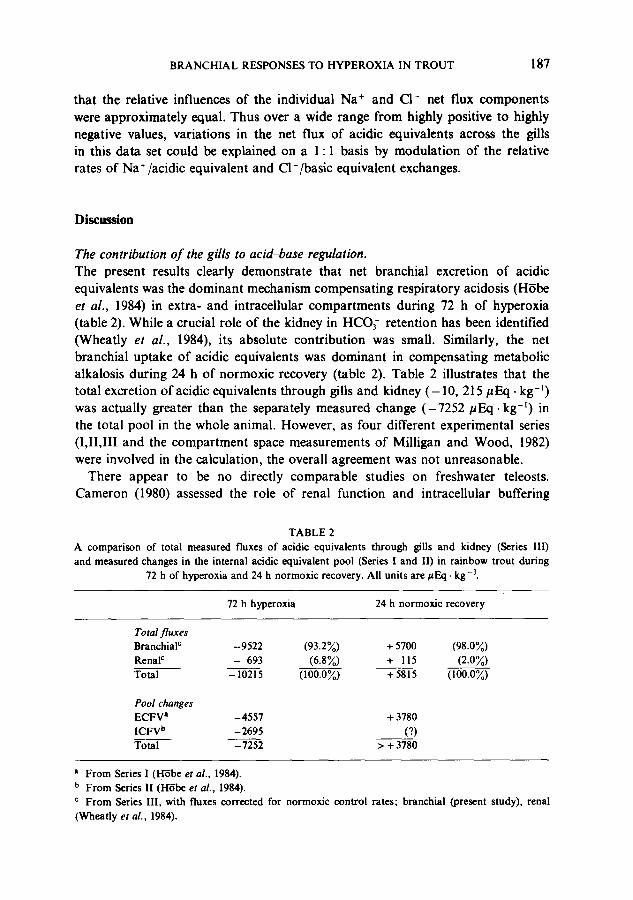
The contribution o f the gills to acid~ase regulation. The present results clearly demonstrate that net branchial excretion of acidic equivalents was the dominant mechanism compensating respiratory acidosis (H~be et al., 1984) in extra- and intracellular compartments during 72 h of hyperoxia (table 2). While a crucial role of the kidney in HCO3- retention has been identified (Wheatly et al., 1984), its absolute contribution was small. Similarly, the net branchial uptake of acidic equivalents was dominant in compensating metabolic alkalosis during 24 h of normoxic recovery (table 2). Table 2 illustrates that the total excretion of acidic equivalents through gills and kidney ( -10 , 215/~Eq. kg -~) was actually greater than the separately measured change (-7252/~Eq. kg - t ) in the total pool in the whole animal. However, as four different experimental series (I,II,III and the compartment space measurements of Milligan and Wood, 1982) were involved in the calculation, the overall agreement was not unreasonable.
There appear to be no directly comparable studies on freshwater teleosts. Cameron (1980) assessed the role of renal function and intracellular buffering
TABLE 2 A comparison of total measured fluxes of acidic equivalents through gills and kidney (Series III) and measured changes in the internal acidic equivalent pool (Series I and I1) in rainbow trout during
72 h of hyperoxia and 24 h normoxic recovery. All units are #Eq. kg - J.
72 h hyperoxia 24 h normoxic recovery
Total f luxes Branchial c Renal c
Total
-9522 (93.2~) + 5700 (98.0~) - 693 (6.8~) + 115 (2.0~)
-10215 (100.0%) +5815 000.0%)
Pool changes ECFV a -4557 + 3780 ICFV b -2695 (?) Total - 7252 > + 3780
a From Series 1 (H'rbe et al., 1984). b From Series I1 (H-rbe et al., 1984). c From Series III, with fluxes corrected for normoxic control rates; branchial (present study), renal (Wheatly et al., 1984).
188 c.M. WOOD et al.
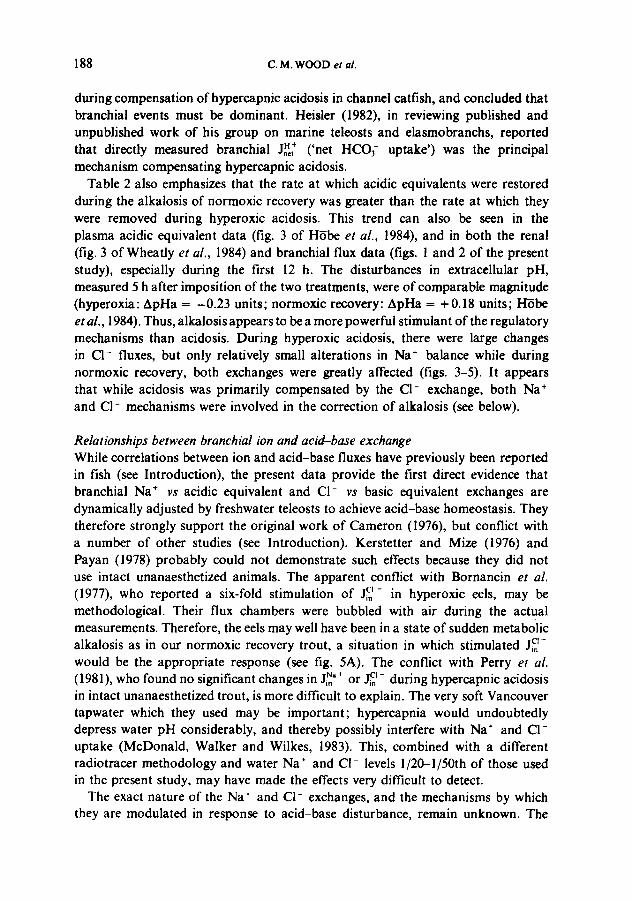
during compensation of hypercapnic acidosis in channel catfish, and concluded that branchial events must be dominant. Heisler (1982), in reviewing published and unpublished work of his group on marine teleosts and elasmobranchs, reported that directly measured branchial Jn~ ('net HCO; uptake') was the principal mechanism compensating hypercapnic acidosis.
Table 2 also emphasizes that the rate at which acidic equivalents were restored during the alkalosis of normoxic recovery was greater than the rate at which they were removed during hyperoxic acidosis. This trend can also be seen in the plasma acidic equivalent data (fig. 3 of H~be et al., 1984), and in both the renal (fig. 3 of Wheatly et al., 1984) and branchial flux data (figs. 1 and 2 of the present study), especially during the first 12 h. The disturbances in extracellular pH, measured 5 h after imposition of the two treatments, were of comparable magnitude (hyperoxia: ApHa-- -0.23 units; norrnoxic recovery: ApHa -- + 0.18 units; H-6be et al., 1984). Thus, alkalosis appears to be a more powerful stimulant of the regulatory mechanisms than acidosis. During hyperoxic acidosis, there were large changes in Cl- fluxes, but only relatively small alterations in Na + balance while during normoxic recovery, both exchanges were greatly affected (figs. 3-5). It appears that while acidosis was primarily compensated by the CI- exchange, both Na + and CI- mechanisms were involved in the correction of alkalosis (see below).
Relationships between branchial ion and acid-base exchange
While correlations between ion and acid-base fluxes have previously been reported in fish (see Introduction), the present data provide the first direct evidence that branchial Na ÷ vs acidic equivalent and CI- vs basic equivalent exchanges are dynamically adjusted by freshwater teleosts to achieve acid-base homeostasis. They therefore strongly support the original work of Cameron (1976), but conflict with a number of other studies (see Introduction). Kerstetter and Mize (1976) and Payan (1978) probably could not demonstrate such effects because they did not use intact unanaesthetized animals. The apparent conflict with Bornancin et al.
(1977), who reported a six-fold stimulation of ~n~- in hyperoxic eels, may be methodological. Their flux chambers were bubbled with air during the actual measurements. Therefore, the eels may well have been in a state of sudden metabolic alkalosis as in our normoxic recovery trout, a situation in which stimulated J~- would be the appropriate response (see fig. 5A). The conflict with Perry et al.
(1981), who found no significant changes in J~+ or ~ - during hypercapnic acidosis in intact unanaesthetized trout, is more difficult to explain. The very soft Vancouver tapwater which they used may be important; hypercapnia would undoubtedly depress water pH considerably, and thereby possibly interfere with Na ÷ and CI- uptake (McDonald, Walker and Wilkes, 1983). This, combined with a different radiotracer methodology and water Na + and C1- levels 1/20-1/50th of those used in the present study, may have made the effects very difficult to detect.
The exact nature of the Na" and CI- exchanges, and the mechanisms by which they are modulated in response to acid-base disturbance, remain unknown. The
B R A N C H I A L RESPONSES TO HYPEROXIA IN T R O U T 189
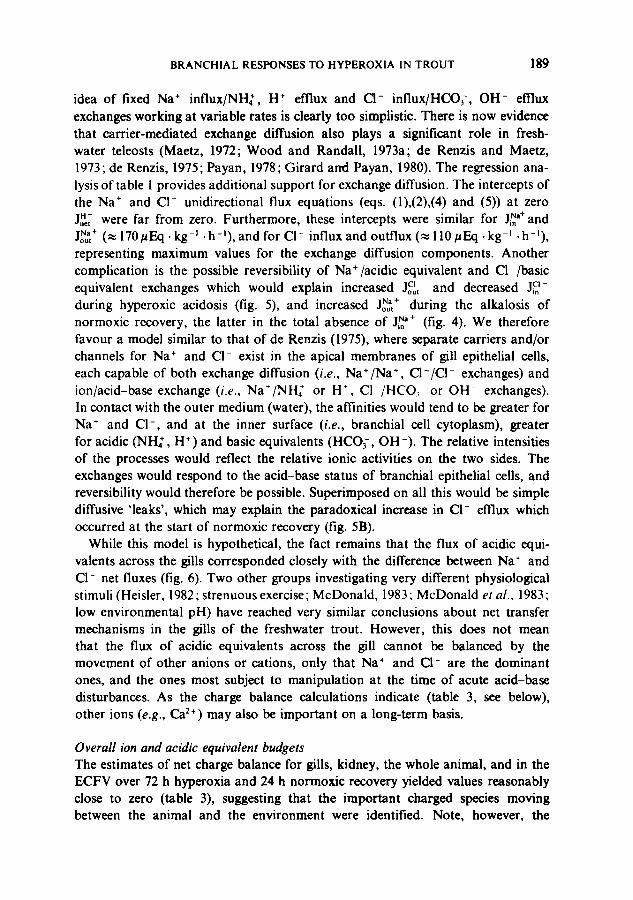
idea of fixed Na ÷ influx/NH~, H ÷ efflux and Cl- influx/HCOf, OH- efflux exchanges working at variable rates is clearly too simplistic. There is now evidence that carrier-mediated exchange diffusion also plays a significant role in fresh- water teleosts (Maetz, 1972; Wood and Randall, 1973a; de Renzis and Maetz, 1973; de Renzis, 1975; Payan, 1978; Girard and Payan, 1980). The regression ana- lysis of table 1 provides additional support for exchange diffusion. The intercepts of the Na ~ and CI- unidirectional flux equations (eqs. (1),(2),(4) and (5)) at zero J,~ were far from zero. Furthermore, these intercepts were similar for J,~'÷ and J~L~ ÷ (~ 170/aEq • kg -j • h-~), and for CI- influx and outflux (~ 110 #Eq- kg -~ • h-~), representing maximum values for the exchange diffusion components. Another complication is the possible reversibility of Na+/acidic equivalent and C1-/basic equivalent exchanges which would explain increased JoC~t - and decreased JiCn I -
during hyperoxic acidosis (fig. 5), and increased J~t ÷ during the alkalosis of normoxic recovery, the latter in the total absence of j~a÷ (fig. 4). We therefore favour a model similar to that of de Renzis (1975), where separate carriers and/or channels for Na ÷ and CI- exist in the apical membranes of gill epithelial cells, each capable of both exchange diffusion (i.e., Na÷/Na ÷, CI-/CI- exchanges) and ion/acid-base exchange (i.e., Na+/NH; or H ~, CI-/HCO~ or OH- exchanges). In contact with the outer medium (water), the affinities would tend to be greater for Na ÷ and CI-, and at the inner surface (i.e., branchial cell cytoplasm), greater for acidic (NH~', H ÷) and basic equivalents (HCOf, OH-). The relative intensities of the processes would reflect the relative ionic activities on the two sides. The exchanges would respond to the acid-base status of branchial epithelial cells, and reversibility would therefore be possible. Superimposed on all this would be simple diffusive 'leaks', which may explain the paradoxical increase in CI- efflux which occurred at the start of normoxic recovery (fig. 5B).
While this model is hypothetical, the fact remains that the flux of acidic equi- valents across the gills corresponded closely with the difference between Na ÷ and C1- net fluxes (fig. 6). Two other groups investigating very different physiological stimuli (Heisler, 1982; strenuous exercise; McDonald, 1983; McDonald et al., 1983 ; low environmental pH) have reached very similar conclusions about net transfer mechanisms in the gills of the freshwater trout. However, this does not mean that the flux of acidic equivalents across the gill cannot be balanced by the movement of other anions or cations, only that Na ÷ and CI- are the dominant ones, and the ones most subject to manipulation at the time of acute acid-base disturbances. As the charge balance calculations indicate (table 3, see below), other ions (e.g., Ca 2÷) may also be important on a long-term basis.
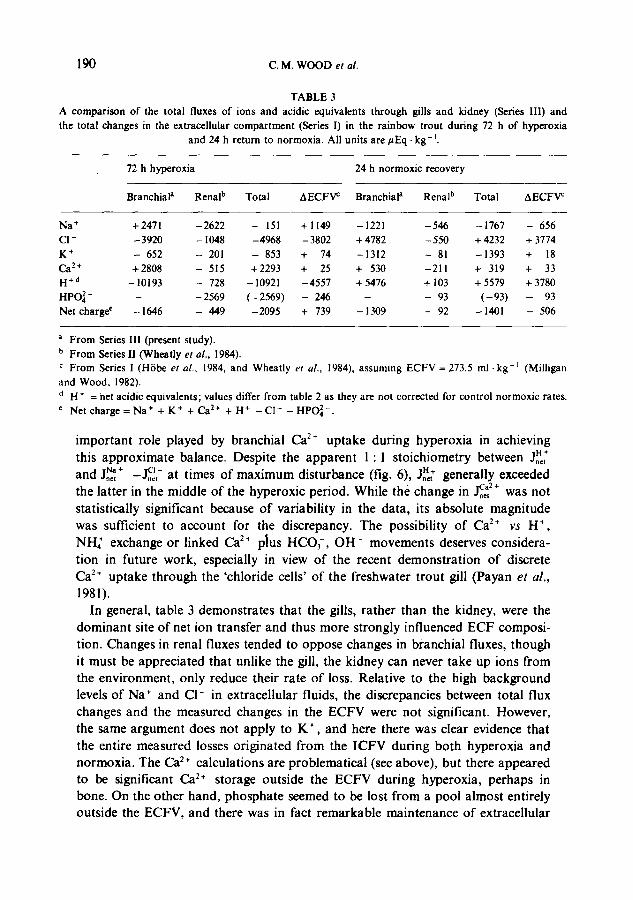
Overall ion and acidic equivalent budgets The estimates of net charge balance for gills, kidney, the whole animal, and in the ECFV over 72 h hyperoxia and 24 h normoxic recovery yielded values reasonably close to zero (table 3), suggesting that the important charged species moving between the animal and the environment were identified. Note, however, the
190 C . M . W O O D et al.
T A B L E 3
A c o m p a r i s o n o f the to ta l f luxes o f i ons a n d ac id ic equ iva l en t s t h r o u g h gills a n d k i d n e y (Series III) a n d
the to ta l c h a n g e s in the ex t r ace l lu l a r c o m p a r t m e n t (ser ies I) in the r a i n b o w t r o u t d u r i n g 72 h o f h y p e r o x i a
a n d 24 h r e t u r n to n o r m o x i a . All un i t s a r e / ~ E q , k g -1.
72 h h y p e r o x i a 24 h n o r m o x i c r e c o v e r y
B r a n c h i a l a R e n a l b To ta l A E C F V c B r a n c h i a l a R e n a l b T o t a l A E C F ~
N a + + 2 4 7 1 - 2 6 2 2 - 151 + 1 1 4 9 - 1 2 2 1 - 5 4 6 - 1 7 6 7 - 656
CI - - 3 9 2 0 - 1048 - 4 9 6 8 - 3 8 0 2 + 4782 - 5 5 0 + 4232 + 3774
K + - 652 - 201 - 853 + 74 - 1 3 1 2 - 81 - 1 3 9 3 + 18
C a 2+ + 2 8 0 8 - 515 + 2 2 9 3 + 25 + 530 - 2 1 1 + 319 + 33
H + d -- 10193 - 728 -- 10921 - 4 5 5 7 + 5476 + 103 + 5579 + 3780
HPO~4- - - 2 5 6 9 ( - 2 5 6 9 ) - 246 - - 93 ( - 9 3 ) - 93
Net c h a r g e e - 1646 - 449 - 2 0 9 5 + 739 - 1309 - 92 - 1401 - 506
a F r o m Series I l l (p resent s tudy) .
b F r o m Series II ( W h e a t l y et al., 1984).
c F r o m Series l (HDbe et al., 1984, a n d W h e a t l y et al., 1984), a s s u m i n g E C F V = 273.5 ml . k g -1 (Mi l l igan
a n d W o o d , 1982).
d H * = net a c id i c equ iva l en t s ; va lues differ f r o m tab le 2 as t hey a re n o t c o r r e c t e d for c o n t r o l n o r m o x i c ra tes .
e Ne t c h a r g e = N a + + K + + C a 2+ + H + - C l - - HPO~4- .
important role played by branchial Ca :+ uptake during hyperoxia in achieving this approximate balance. Despite the apparent 1"1 stoichiometry between Jo~[ and J~,~ ÷ - ~ - at times of maximum disturbance (fig. 6), Jn~[ generally exceeded the latter in the middle of the hyperoxic period. While the change in Ic_nf + was not statistically significant because of variability in the data, its absolute magnitude was sufficient to account for the discrepancy. The possibility of Ca 2+ vs H +, NIL + exchange or linked Ca 2÷ plus HCOf, OH- movements deserves considera- tion in future work, especially in view of the recent demonstration of discrete Ca 2~ uptake through the 'chloride cells' of the freshwater trout gill (Payan et al.,
1981). In general, table 3 demonstrates that the gills, rather than the kidney, were the
dominant site of net ion transfer and thus more strongly influenced ECF composi- tion. Changes in renal fluxes tended to oppose changes in branchial fluxes, though it must be appreciated that unlike the gill, the kidney can never take up ions from the environment, only reduce their rate of loss. Relative to the high background levels of Na ÷ and CI- in extracellular fluids, the discrepancies between total flux changes and the measured changes in the ECFV were not significant. However, the same argument does not apply to K + , and here there was clear evidence that the entire measured losses originated from the ICFV during both hyperoxia and normoxia. The Ca 2+ calculations are problematical (see above), but there appeared to be significant Ca 2+ storage outside the ECFV during hyperoxia, perhaps in bone. On the other hand, phosphate seemed to be lost from a pool almost entirely outside the ECFV, and there was in fact remarkable maintenance of extracellular

BRANCHIAL RESPONSES TO HYPEROXIA IN TROUT 191
phosphate levels in the face of massive renal losses during hyperoxia. Unfortunately, branchial phosphate fluxes were not measured.
Finally, the budget calculations of table 3 emphasize the very large and complex exchanges of ions and acidic equivalents with the environment which the trout performs so as to completely compensate the respiratory acidosis of hyperoxia in both extra- and intracellular compartments (H~be et al., 1984). These exchanges are undoubtedly costly; their occurrence illustrates the great importance of precise acid-base control in the active, pelagic rainbow trout.
Acknowledgements
We thank Mary Rogano for excellent technical assistance, and Drs. J.N. Cameron and D.G. McDonald for very helpful communication and discussions. This work was supported by an N.S.E.R.C. operating grant to C.M.W.H.H's travel was supported by a Research Allowance from the Alberta Heritage Fund for Medical Research and the University of Calgary. M.G.W.'s travel was supported by an N.S.E.R.C. grant to B.R. McMahon.
References
Bornancin, M., G. de Renzis and J. Maetz (1977). Branchial CI- transport, anion stimulated ATPase and acid-base balance in Anguilla anguilla adapted to freshwater: effects of hyperoxia. J. Comp. Physiol. 117: 313-322.
Cameron, J.N. (1976). Branchial ion uptake in Arctic grayling: resting values and the effects of acid-base disturbance. J. Exp. Biol. 64:711-725.
Cameron, J. N. (1978). Regulation of blood pH in teleost fish. Respir. Physiol. 33: 129-144. Cameron, J.N. and C. M. Wood (1978). Renal function and acid-base regulation in two Amazonian
Erythrinid fishes: Hoplias malabaricus, a water-breather, and Hoplerythrinus unitaeniatus, a facul- tative air-breather. Can. J. Zool. 56: 917-930.
Cameron, J. N. (1980). Body fluid pools, kidney function, and acid-base regulation in the freshwater catfish Ictalurus punctatus. J. Exp. Biol. 86: 171-185.
Cameron, J.N. and G.A. Kormanik (1982a). Intra- and extracellular acid-base status as a function of temperature in the freshwater channel catfish, lctalurus punctatus. J. Exp. Biol. 99: 127-142.
Cameron, J. N. and G.A. Kormanik (1982b). The acid-base responses of gills and kidneys to infused acid and base loads in the channel catfish, Ictalurus punctatus. J. Exp. Biol. 99: 143-160.
Dejours, P., J. Armand and H. Beekenkamp (1982). The effect of ambient chloride concentration changes on branchial chloride-bicarbonate exchanges and hemolymph acid-base balance of crayfish. Respir. Physiol. 48: 375-386.
De Renzis, G. and J. Maetz (1973). Studies on the mechanism of chloride absorption by the goldfish gill: relation with acid-base regulation. J. Exp. Biol. 59: 339-358.
De Renzis, G. (1975). The branchial chloride pump in the goldfish Carassius auratus: relationship between C I - / H C O f and C1-/CI- exchanges and the effects of thiocyanate. J. Exp. Biol. 63: 587-602.
Evans, D. H., J. B. Claiborne, L. Farmer, C. Mallery and E.J. Krasny (1982). Fish gill ionic transport: methods and models. Biol. Bull. 163: 108-130.
192 C.M. WOOD et al.
Garcla-Romeu, F. and J. Maetz (1964). The mechanism of sodium and chloride uptake by the gills of a fresh-water fish, Carassi~ aurotus. I. Evidence for an independent uptake of sodium and chloride ions. J. Gen. Physiol. 47: 1195--I 207.
Girard, J. P. and P. Payan (1980). Ion exchanges through respiratory and chloride cells in freshwater- and seawater-adapted teleosteans. Am. J. Physiol. 238: R260--R268.
Heisler, N. (1980). Regulation of the acid-base status in fishes. In: Environmental Physiology of Fishes, edited by M. A. Ali. New York, Plenum Press, pp. 123--162.
Heisler, N. (1982). Transepithelial ion transfer processes as mechanisms for fish acid-base regulation in hypercapnia and lactacidosis. Can. J. Zool. 60:i108-1122.
H~Sbe, H., C.M. Wood and M.G. Wheatly (1984). The mechanisms of acid-base and ionoregulation in the freshwater rainbow trout during environmental hyperoxia and subsequent normoxia. I. Extra- and intracellular acid-base status. Respir. Physiol. 55: 139-154.
Kerstetter, T. H. and R. Mize (1976). Responses of trout gill ion transport systems to acute acidosis. J. Exp. Biol. 64: 511-515.
Krogh, A. (1939). Osmotic Regulation in Aquatic Animals. Cambridge, Cambridge University Press. Maetz, J. (1956). Les &:hanges de sodium chez le poisson Carassius auratus L. Action d'un inhibiteur
de I'anhydrase carbonique. J. Physiol. (Paris) 48: 1085-1099. Maetz, I. and F. Gareia-Romeu (1964). The mechanism of sodium and chloride uptake by the gills
of a freshwater fish, Carassius auratus. II. Evidence for NH4+/Na + and HCO3/CI- exchanges. J. Gen. Physiol. 47: 1209-1227.
Maetz, J. (1972). Branchial sodium exchange and ammonia excretion in the goldfish Carassius auratus. Effects of ammonia loading and temperature changes. J. Exp. Biol. 56: 601~520.
Maetz, J. (1973). Na+/NH4 *, Na+/H ÷ exchanges and NH3 movement across the gill of Car assius auratus. J. Exp. Biol. 58: 255-275.
McDonald, D.G. and C.M. Wood (1981). Branchial and renal acid and ion fluxes in the rainbow trout, Salmo gaird~eri, at low environmental pH. J. Exp. Biol. 93:101-118.
McDonald, D.G. (1983). The interaction of environmental calcium and low pH on the physiology of the rainbow trout, Salmo gairdneri. 1. Branchial and renal net ion and H + fluxes. J. Exp. Biol. 102: 123-140.
McDonald, D.G., R. L. Walker and P. R. H. Wilkes (1983). The interaction of environmental calcium and low pH on the physiology of the rainbow trout, Salmo gairdneri. 2. Branchial ionoregulatory mechanisms. J. Exp. Biol. 102: 141-155.
Milligan, C.L. and C.M. Wood (1982). Disturbances in haematology, fluid volume distribution and circulatory function associated with low environmental pH in the rainbow trout, Salmo gairdneri. J. Exp. Biol. 99: 397-415.
Payan, P. (1978). A study of the Na+/NH4 + exchange across the gill of the perfused head of the trout (Salmo gairdneri). J. Comp. Physiol. 124: 181-188.
Payan, P., N. Mayer-Gostan and P.K.T. Pang (1981). Site of calcium uptake in the freshwater trout gill. J. Exp. Zool. 216: 345-347.
Perry, S. F., M.S. Haswell, D.J. Randall and A.P. FarreU (1981). Branchial ion uptake and acid-base regulation in the rainbow trout, Salmo gairdneri. J. Exp. Biol. 92: 289-303.
Wheatly, M.G., H. I-l5be and C. M. Wood (1984). The mechanisms of acid-base and ionoregulation in the freshwater rainbow trout during environmental hyperoxia and subsequent normoxia. II. The role of the kidney. Respir. Physiol. 55: 155-173.
Wood, C.M. and D.J. Randall (1973a). Sodium balance in the rainbow trout (Salmo gairdneri) during extended exercise. J. Comp. Physiol. 82: 235-256.
Wood, C.M. and D.J. Randall (1973b). The influence of swimming activity on water balance in the rainbow trout (Salmo gairdneri). J. Comp. Physiol. 82: 257-276.