resource management department seminar
TRANSCRIPT

SLIDE 1
Resource Management Department
SEMINAR
Executive Board, 17 January 2018

SLIDE 2
AGENDA
Introduction
1. Enabling Operations
2. Connecting Resources to Results
3. Safeguarding Resources
Key EB dates

SLIDE 3
INTRODUCTION

SLIDE 4
OUR TEAM
Staff Wellness (RMW)
Sergio ArenaSecurity (RMQ)
Christophe BoutonnierPerformance Management
& Monitoring (RMP)
Jane Pearce
Finance & Treasury (RMF)
Nicholas NelsonBudget & Programming (RMB)
Erika JoergensenAssistant Executive Director
for RM and CFO
Manoj Juneja
Management Services (RMM)
Philip Ward
Enterprise Risk Management (RMR)
Chief Risk
Officer(under
recruitment)

SLIDE 5
Supporting and enabling operations by leading
performance management and safeguarding resources to
improve the lives of the people we serve
RM in one sentence

SLIDE 6
WHAT WE DO
SUPPORTING
& ENABLING
OPERATIONS
CONNECTING
RESOURCES
& RESULTS
SAFEGUARDING
OUR RESOURCES
1
2
3
3 Key Thematic Areas

SLIDE 7
SUPPORTING & ENABLING OPERATIONS
Enabling Financial Tools
Taking care of our people
SLIDE 8
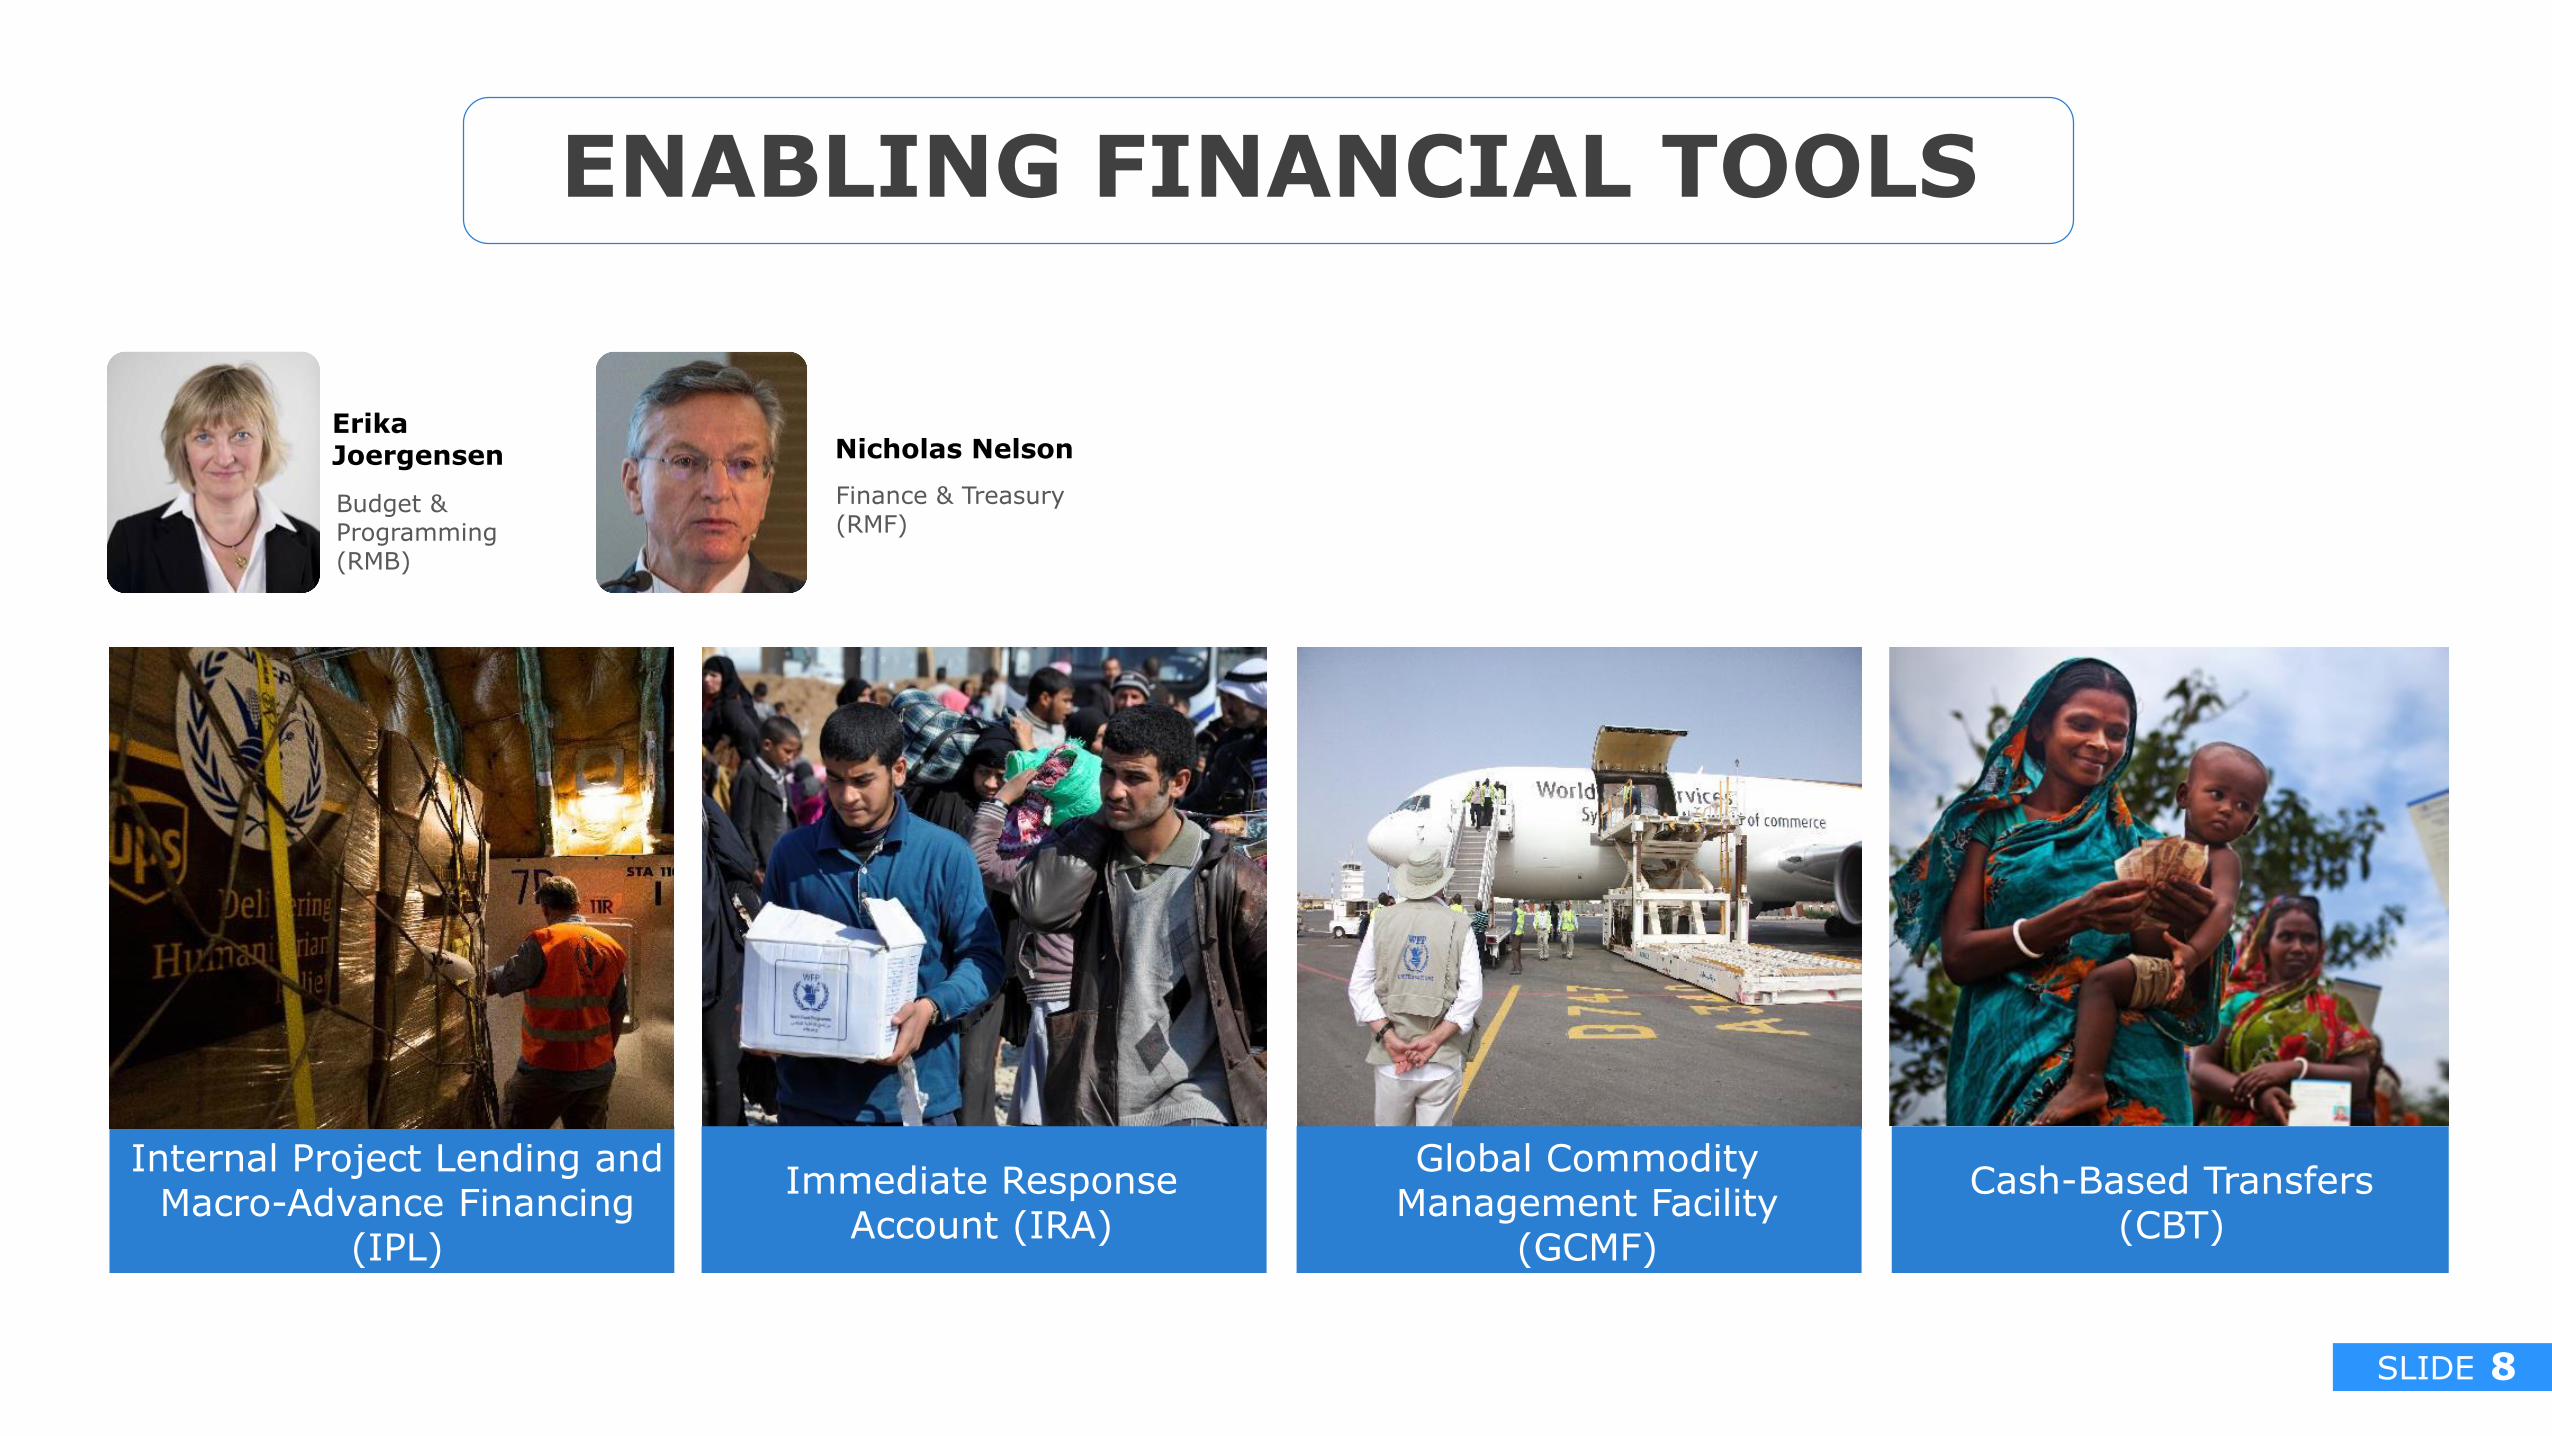
ENABLING FINANCIAL TOOLS
Budget & Programming (RMB)
Erika Joergensen
Finance & Treasury (RMF)
Nicholas Nelson
Internal Project Lending and Macro-Advance Financing
(IPL)
Immediate Response Account (IRA)
Global Commodity Management Facility
(GCMF)
Cash-Based Transfers (CBT)

SLIDE 9
9
Provides timely
spending authority
to projects before
contributions are
confirmed through
Internal Project
Lending (IPL)
179 advances
IPLUSD 1.3 B
• USD 61 million in new contributions from donors
• 74% revolved by reimbursement from donor contributions
IRAUSD 154 M
Advance release of funds and use of IRA
Budget
& P
rogra
mm
ing
4.3%0.3%
24.0%
69.2%
2.2%
CPB DEVs - CPs
EMOP PRRO
SOs

SLIDE10
Financial tools for more effective and efficient food delivery
Gradually becoming the “new norm” for increased efficiency, the GCMF allows:
• faster response to emergencies
• steady supply of commodities at a reduced lead-time
• procurement of food when markets are favourable
GCMF
Budget
& P
rogra
mm
ing
1.7 million mt of food went through GCMF, which is equivalent to 47% of all food resourced in 2017
months
USD 800 millionpurchase value for 2017
The capital of USD 350 million rotates on average 2.5 times per year
HIGH PERFORMANCE BENEFICIARIES REACHED
25 million beneficiaries in 2016
30% of 82 million beneficiaries reached by WFP
SAVED
nearly
3in lead time thanks to GCMF as compared with conventional procurement process

SLIDE11
Innovating for Efficiency & Effectiveness in CBT
Fin
ance &
Tre
asury
63%USD 1.4 B transferred Increase from 2016
in 60 countries
to 14.3 M people in need*
CBT in 2017
*2017 beneficiary total being finalized
Global Beneficiary Payment Solution (GBPS)
BENEFITSCost & reduced risk
Speed efficiency & flexibility Scalability & security
Beneficiary centricRegulatory compliance
Blockchain
BENEFITSFosters inter-agency collaborationReduced CBT costs & financial riskBetter protection of beneficiary privacyReduced CBT implementation time & simplified reconciliationThorough tracking of assets
Prioritized Financial Service Providers
Jordan Pilot & Scale upFrom 10,500 people served in 2017, with the goal of 100,000+ in 2018

SLIDE12
The CBT Special Account Platform
USD 141.76 Mcash transfer value
1 million people served
7 Country Offices currently on board
18 Partner Users
WFP managed service that enables other
humanitarian organizations and governments to
benefit from WFP’s Cash Transfer
experience and infrastructure
Fin
ance &
Tre
asury

SLIDE13
Security Training Vaccination Campaign in South Sudan
Upgrade of accommodation
STAFF SECURITY & SAFETY
STAFF WELLNESSFACILITIES &
ACCOMMODATION
Management Services (RMM)
Philip Ward
Staff Wellness(RMW)
Sergio Arena
Security(RMQ)
Christophe Boutonnier
LOOKING AFTER OUR PEOPLE

SLIDE14
Staff Wellness Strategy
1
23
4
5
• Medical health
• Psychological health
• Working and living conditions
• Safety
• HR stewardship
Sta
ff W
ellness
MAY: EB Briefing on the Wellness Strategy

SLIDE15
WFP Engineering
Yemen emergency response (WHO)
Djibouti Logs Base (first WFP design-built grain silos in history)
Cox’s Bazar emergency (UNHCR/IOM)
WFP Engineering
Managem
ent
Serv
ices
Engineering work
57 projects in27 countries
Global team
+90 Engineers
Projects
10 of 11
Corporate
Emergencies
WFP Engineering projects
Emergencies
USD 126 M

SLIDE16
Managem
ent
Serv
ices
21 countries
80+ Guesthouses
14,000+ guests annually
Top 5 Countries for overall bookings in 2017
WFP is the second largest humanitarian guesthouse provider
1. South Sudan 2. Chad 3. Kenya4. Haiti5. Sudan
Guest’s origin share
37% non-WFP guests
63% WFP guests
INTER-AGENCY LEADERSHIP
SLIDE17
CONNECTING RESOURCES TO RESULTS
2018 Planning and ReportingWFP funding windows and SRAC

SLIDE18
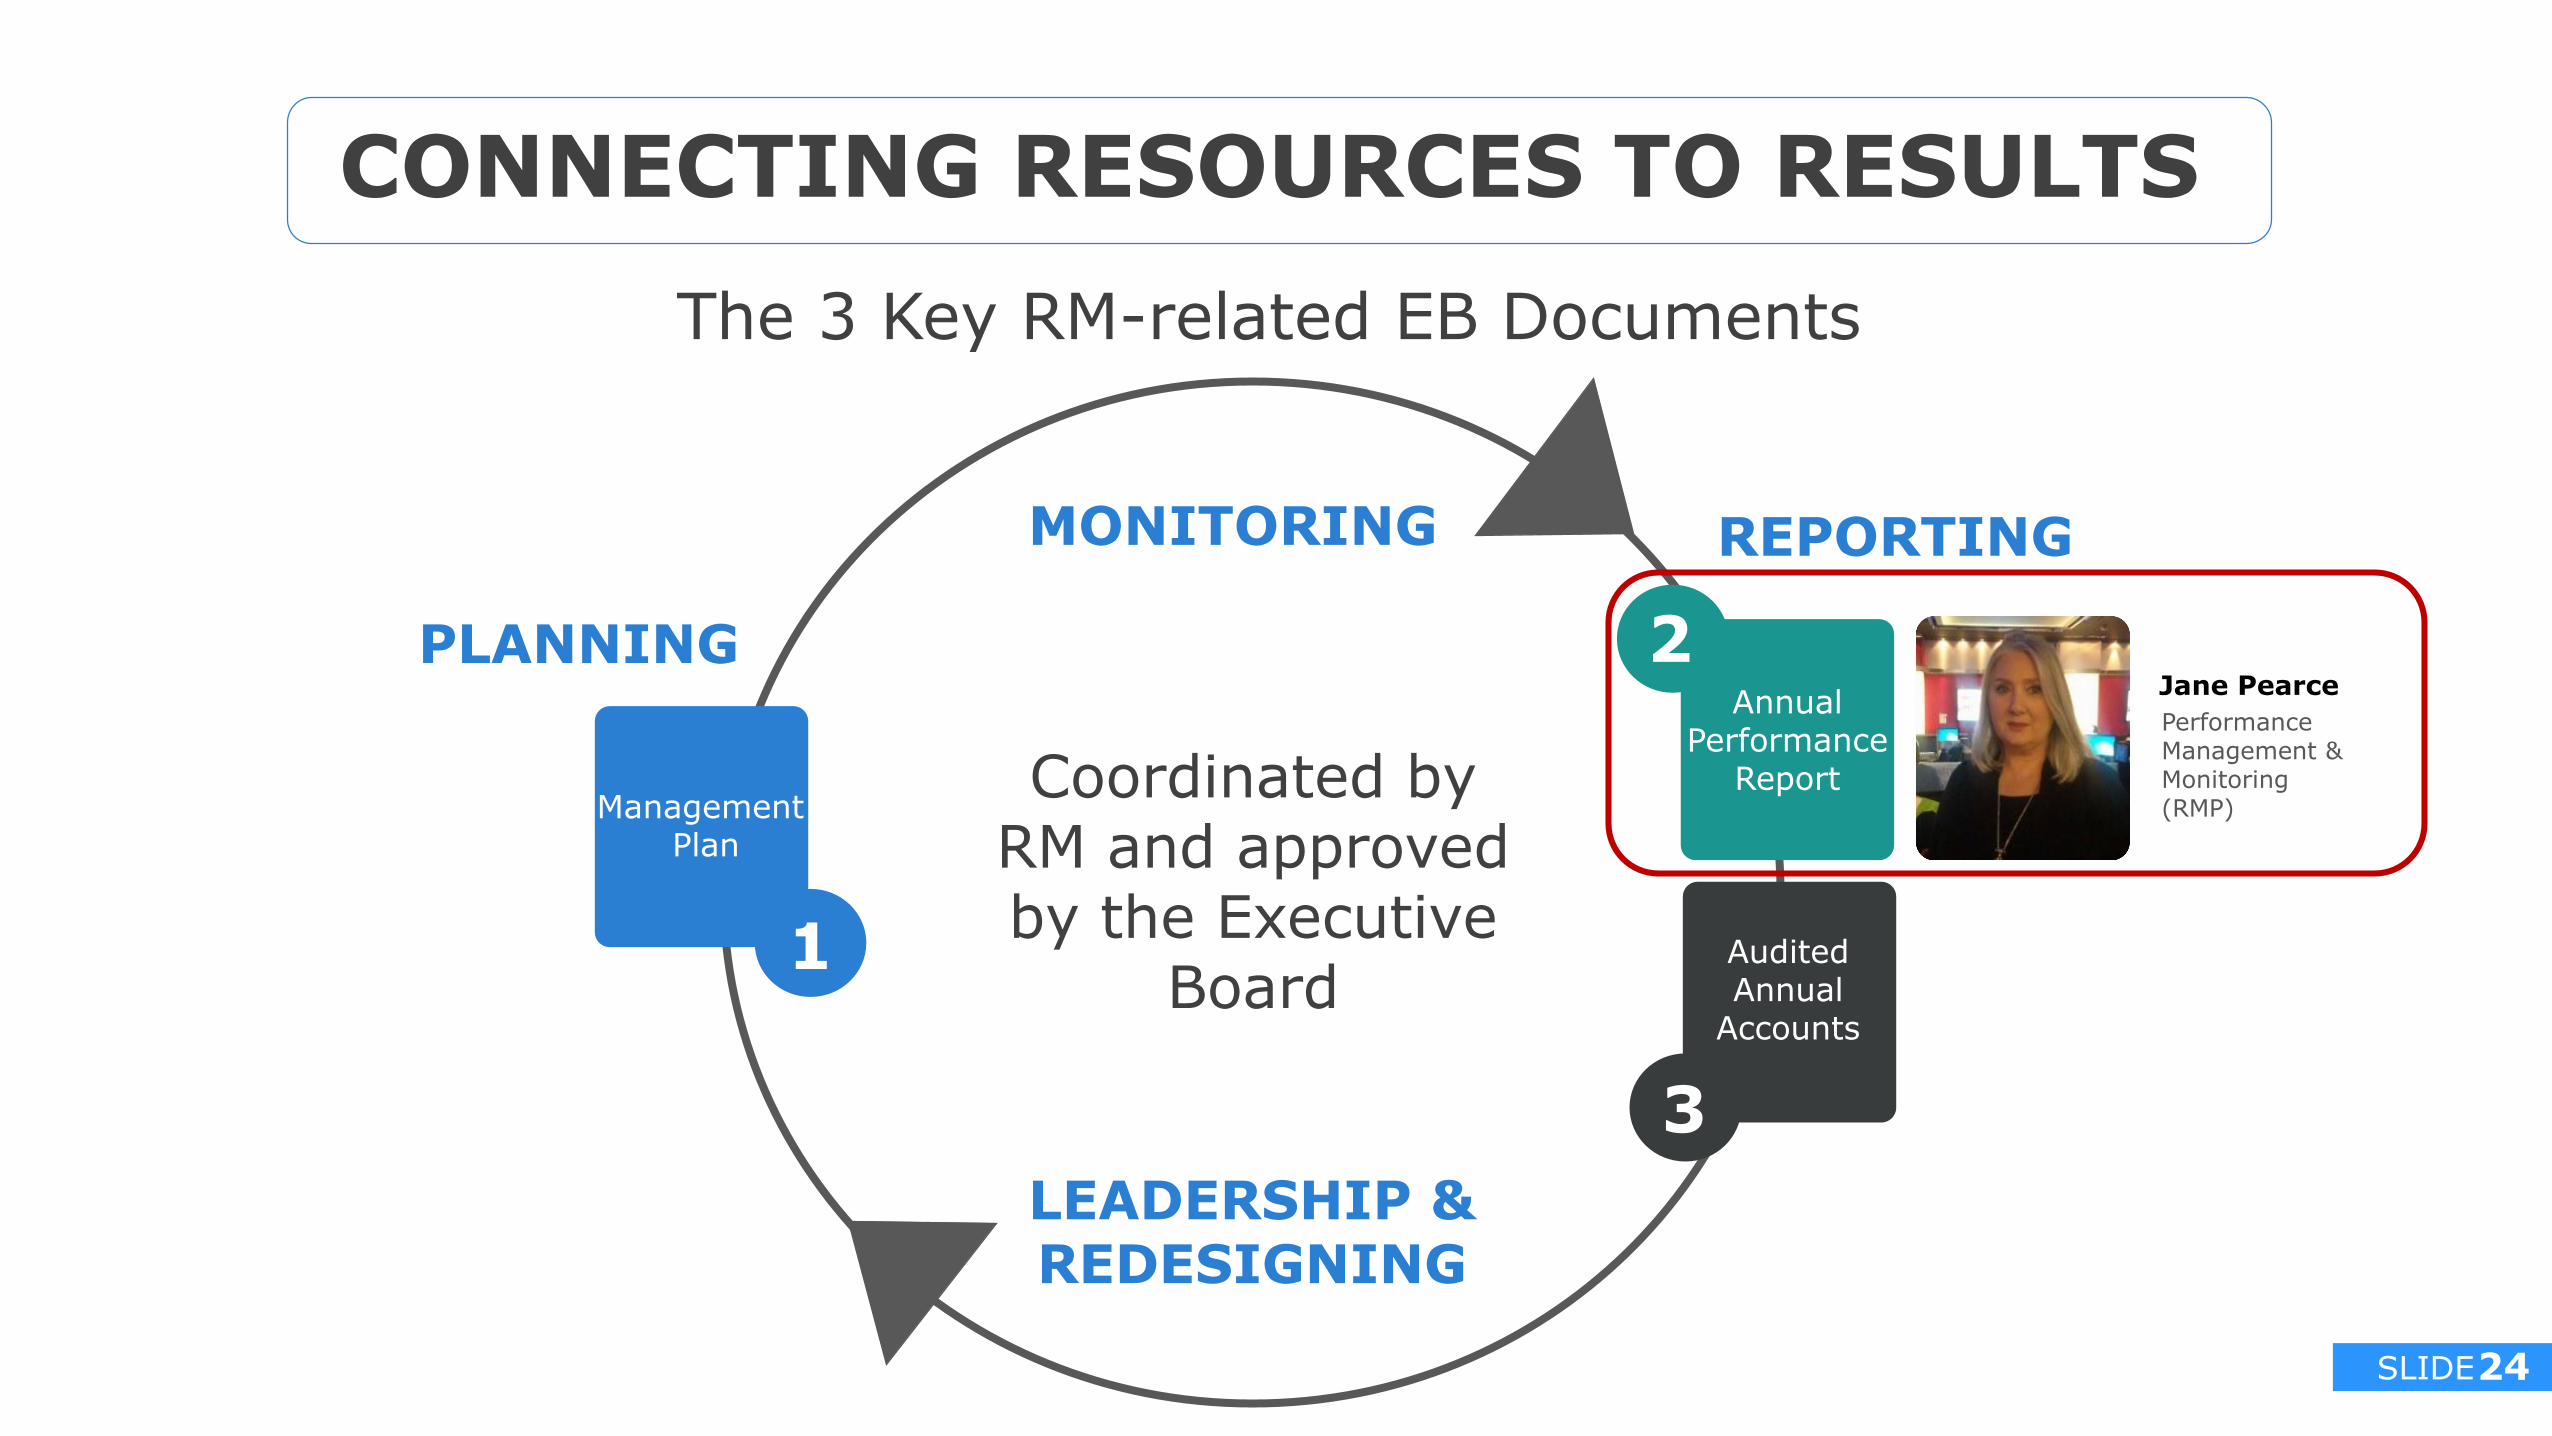
CONNECTING RESOURCES TO RESULTS
The 3 Key RM-related EB Documents
PLANNING
REPORTINGMONITORING
LEADERSHIP &REDESIGNING
Management Plan
Annual Performance
Report
Audited Annual
Accounts
Coordinated by RM and approved by the Executive
Board1
2
3

SLIDE19
• Most flexible source of funding for WFP
• Allocated and prioritized by Strategic Resource Allocation Committee (SRAC)
PROPORTION OF FUNDING IN 2017
UN-EARMARKED & SOFTLY EARMARKED
EARMARKED
WFP’s Funding Windows
Budget
& P
rogra
mm
ing
• Directed by donor to a specific WFP activity or country programme
• Standard Project Reports that are submitted to the Executive Board
94.2%is earmarked*
5.8%is un-earmarked / softly earmarked*
*of which 8% are allocated to IRA
*of which 3% are contributions to Trust
Funds, Special Accounts and General Funds

SLIDE20
Strategic Resource Allocation Committee
(SRAC)
• Composition: Leadership Group• Secretariat: Budget & Programming Division
(RMB)
Allocation of resources over which management has discretion, including• Unearmarked or softly earmarked contributions• Extra-budgetary funds• PSA funds• Capital Budgeting Facility
STRUCTURE
THE SRAC IS RESPONSIBLE FOR

SLIDE21
Key Figures: 2018 Prioritized Plan of Work
The Prioritized Plan of Work (PoW) is prepared within the context of assessed needs, forecasted funding, the scope
of the Strategic Plan and organizational capacity
Budget
& P
rogra
mm
ing
82 countries
69 million beneficiaries
15 billion rations
USD 5.9 billion prioritized
PoW
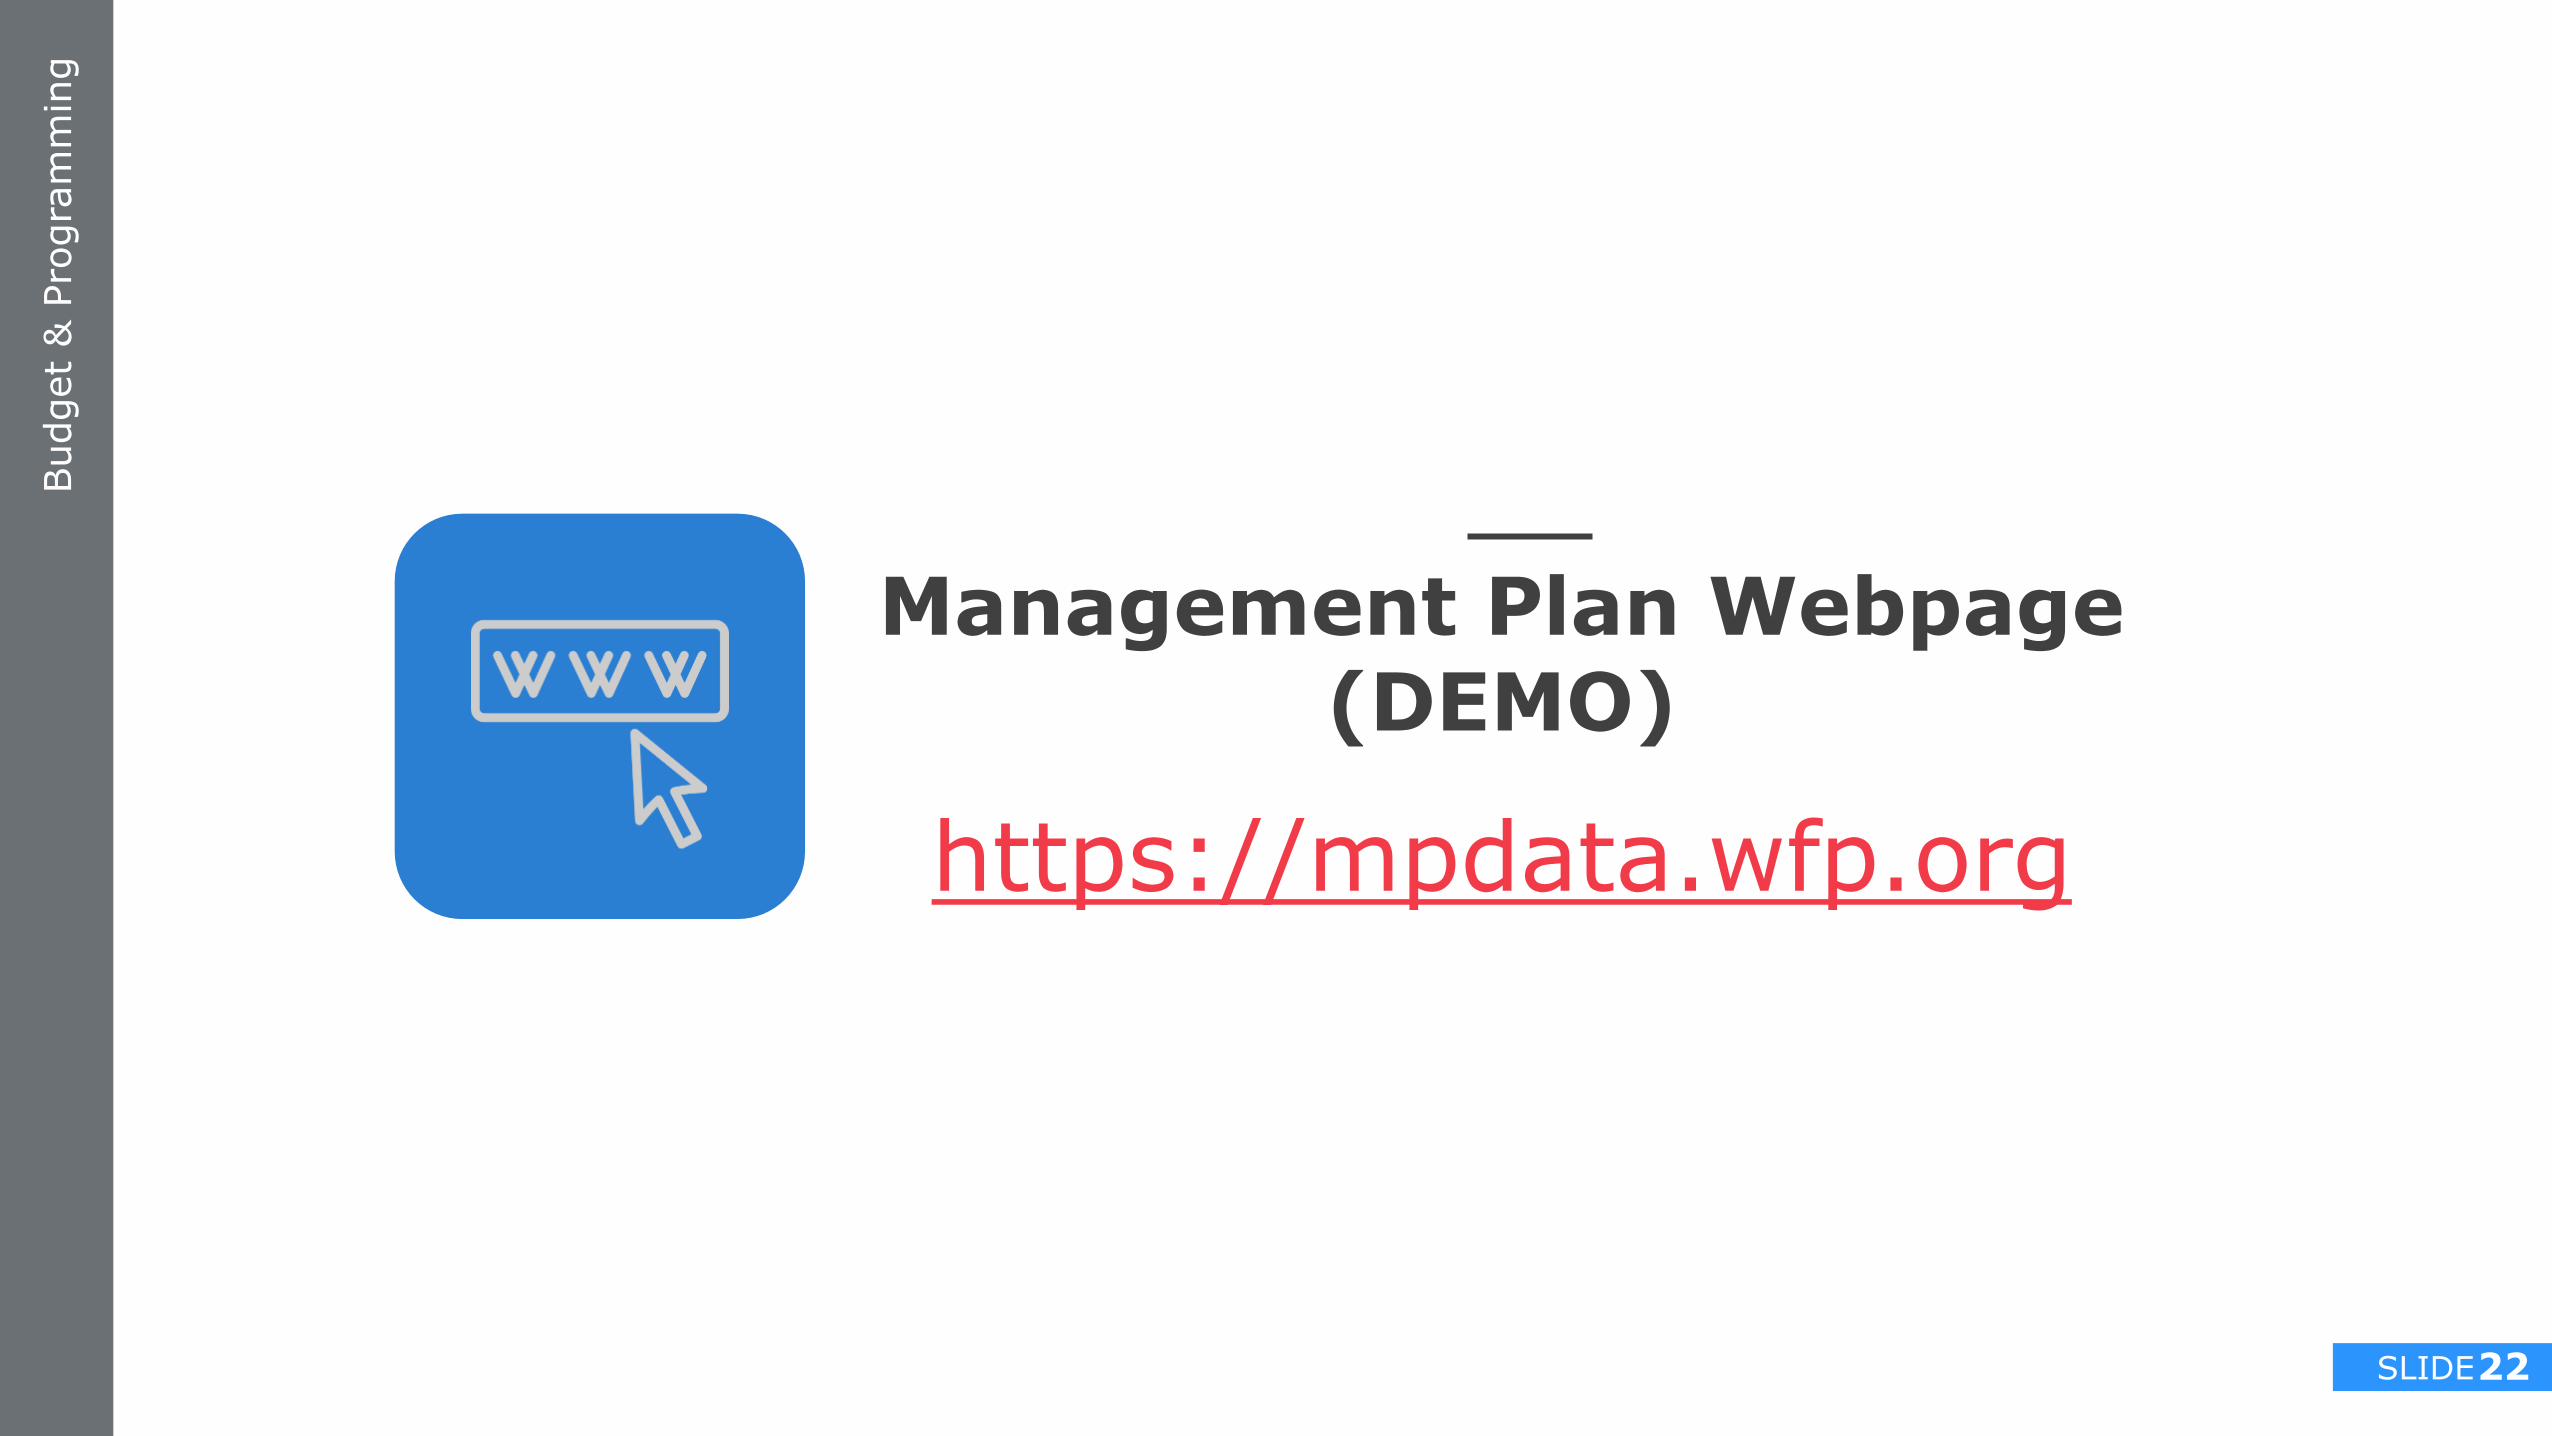
SLIDE22
Management Plan Webpage (DEMO)
Budget
& P
rogra
mm
ing
https://mpdata.wfp.org

SLIDE23
Indirect Support Costs: Background
Budget
& P
rogra
mm
ing
ISC rates are approved annually by the Executive Board in the Management Plan1Policy of a flat rate (currently 6.5% from 2018) applicable to most contributions2However, ISC policy as currently stated lacks flexibility in application because of governance decisions3Other Agencies have greater flexibility to propose lower ISC rates because of the regulatory framework and funding streams
4With the disaggregation of the PSA budget in 2018 into 5 results pillars, discussion with the Board will continue, including possible criteria for flexibility in the application of ISC rates
5
SLIDE24
CONNECTING RESOURCES TO RESULTS
The 3 Key RM-related EB Documents
PLANNING
REPORTINGMONITORING
LEADERSHIP &REDESIGNING
Management Plan
Annual Performance
Report
Audited Annual
Accounts
Coordinated by RM and approved by the Executive
Board1
2
3
Performance Management & Monitoring(RMP)
Jane Pearce

SLIDE25
Demonstrating Value for Money through strong Performance Management and Accountability
Robust and flexible
Corporate Results
Framework
Efficient performance planning to ensure WFP
is set to success
Strong monitoring system to support
evidence-based decision
making
High quality reports that
evidence results &
show value for money
Innovative systems to support effective
management of operations and transparency
Perf
orm
ance M
anagem
ent
& M
onitoring

SLIDE26
Corporate Results Framework (CRF)
The Corporate Results Framework (CRF) lays out the strategic goals, outcomesand results relating to the Strategic Plan (2017-2021) including the indicators WFP uses to plan, monitor and report on its programmes and its management performance.
The framework includes indicative measures to capture management performance in terms of efficiency, effectiveness and economy.
A revised, stronger CRF will be presented to the
Executive Board in November 2018
Entrepreneurial activities differ substantially
CSP Design
and Revision
Monitoring
Link Resources to Results
Management Performance
and KPIs
Reporting and Accountability
Perf
orm
ance M
anagem
ent
& M
onitoring

SLIDE27
CRF in action: Example from ZimbabwePerf
orm
ance M
anagem
ent
& M
onitoring
WFP Strategic Result 1Everyone has access to food USD 16.7 m
Strategic Outcome 1 Food insecure people, including refugees, in the most affected districts are enabled to meet their basic food and nutrition requirements during severe seasonal shocks
1.1. Maintained/ enhanced individual and household access to adequate food
USD 16.7 m
Activity 1Provide cash and/or food transfers to the most vulnerable households affected by seasonal food shortages
Unconditional resource transfers to support access to food
USD 14.3 m
Activity 2Provide unconditional cash and/or food transfers and livelihoods support for refugees in camps
Unconditional resources transfers to support access to food
USD 2.3 m
Corporate Results Framework
Logframe/COMP
WINGS and budget
MRE Plan
Annual Country Report
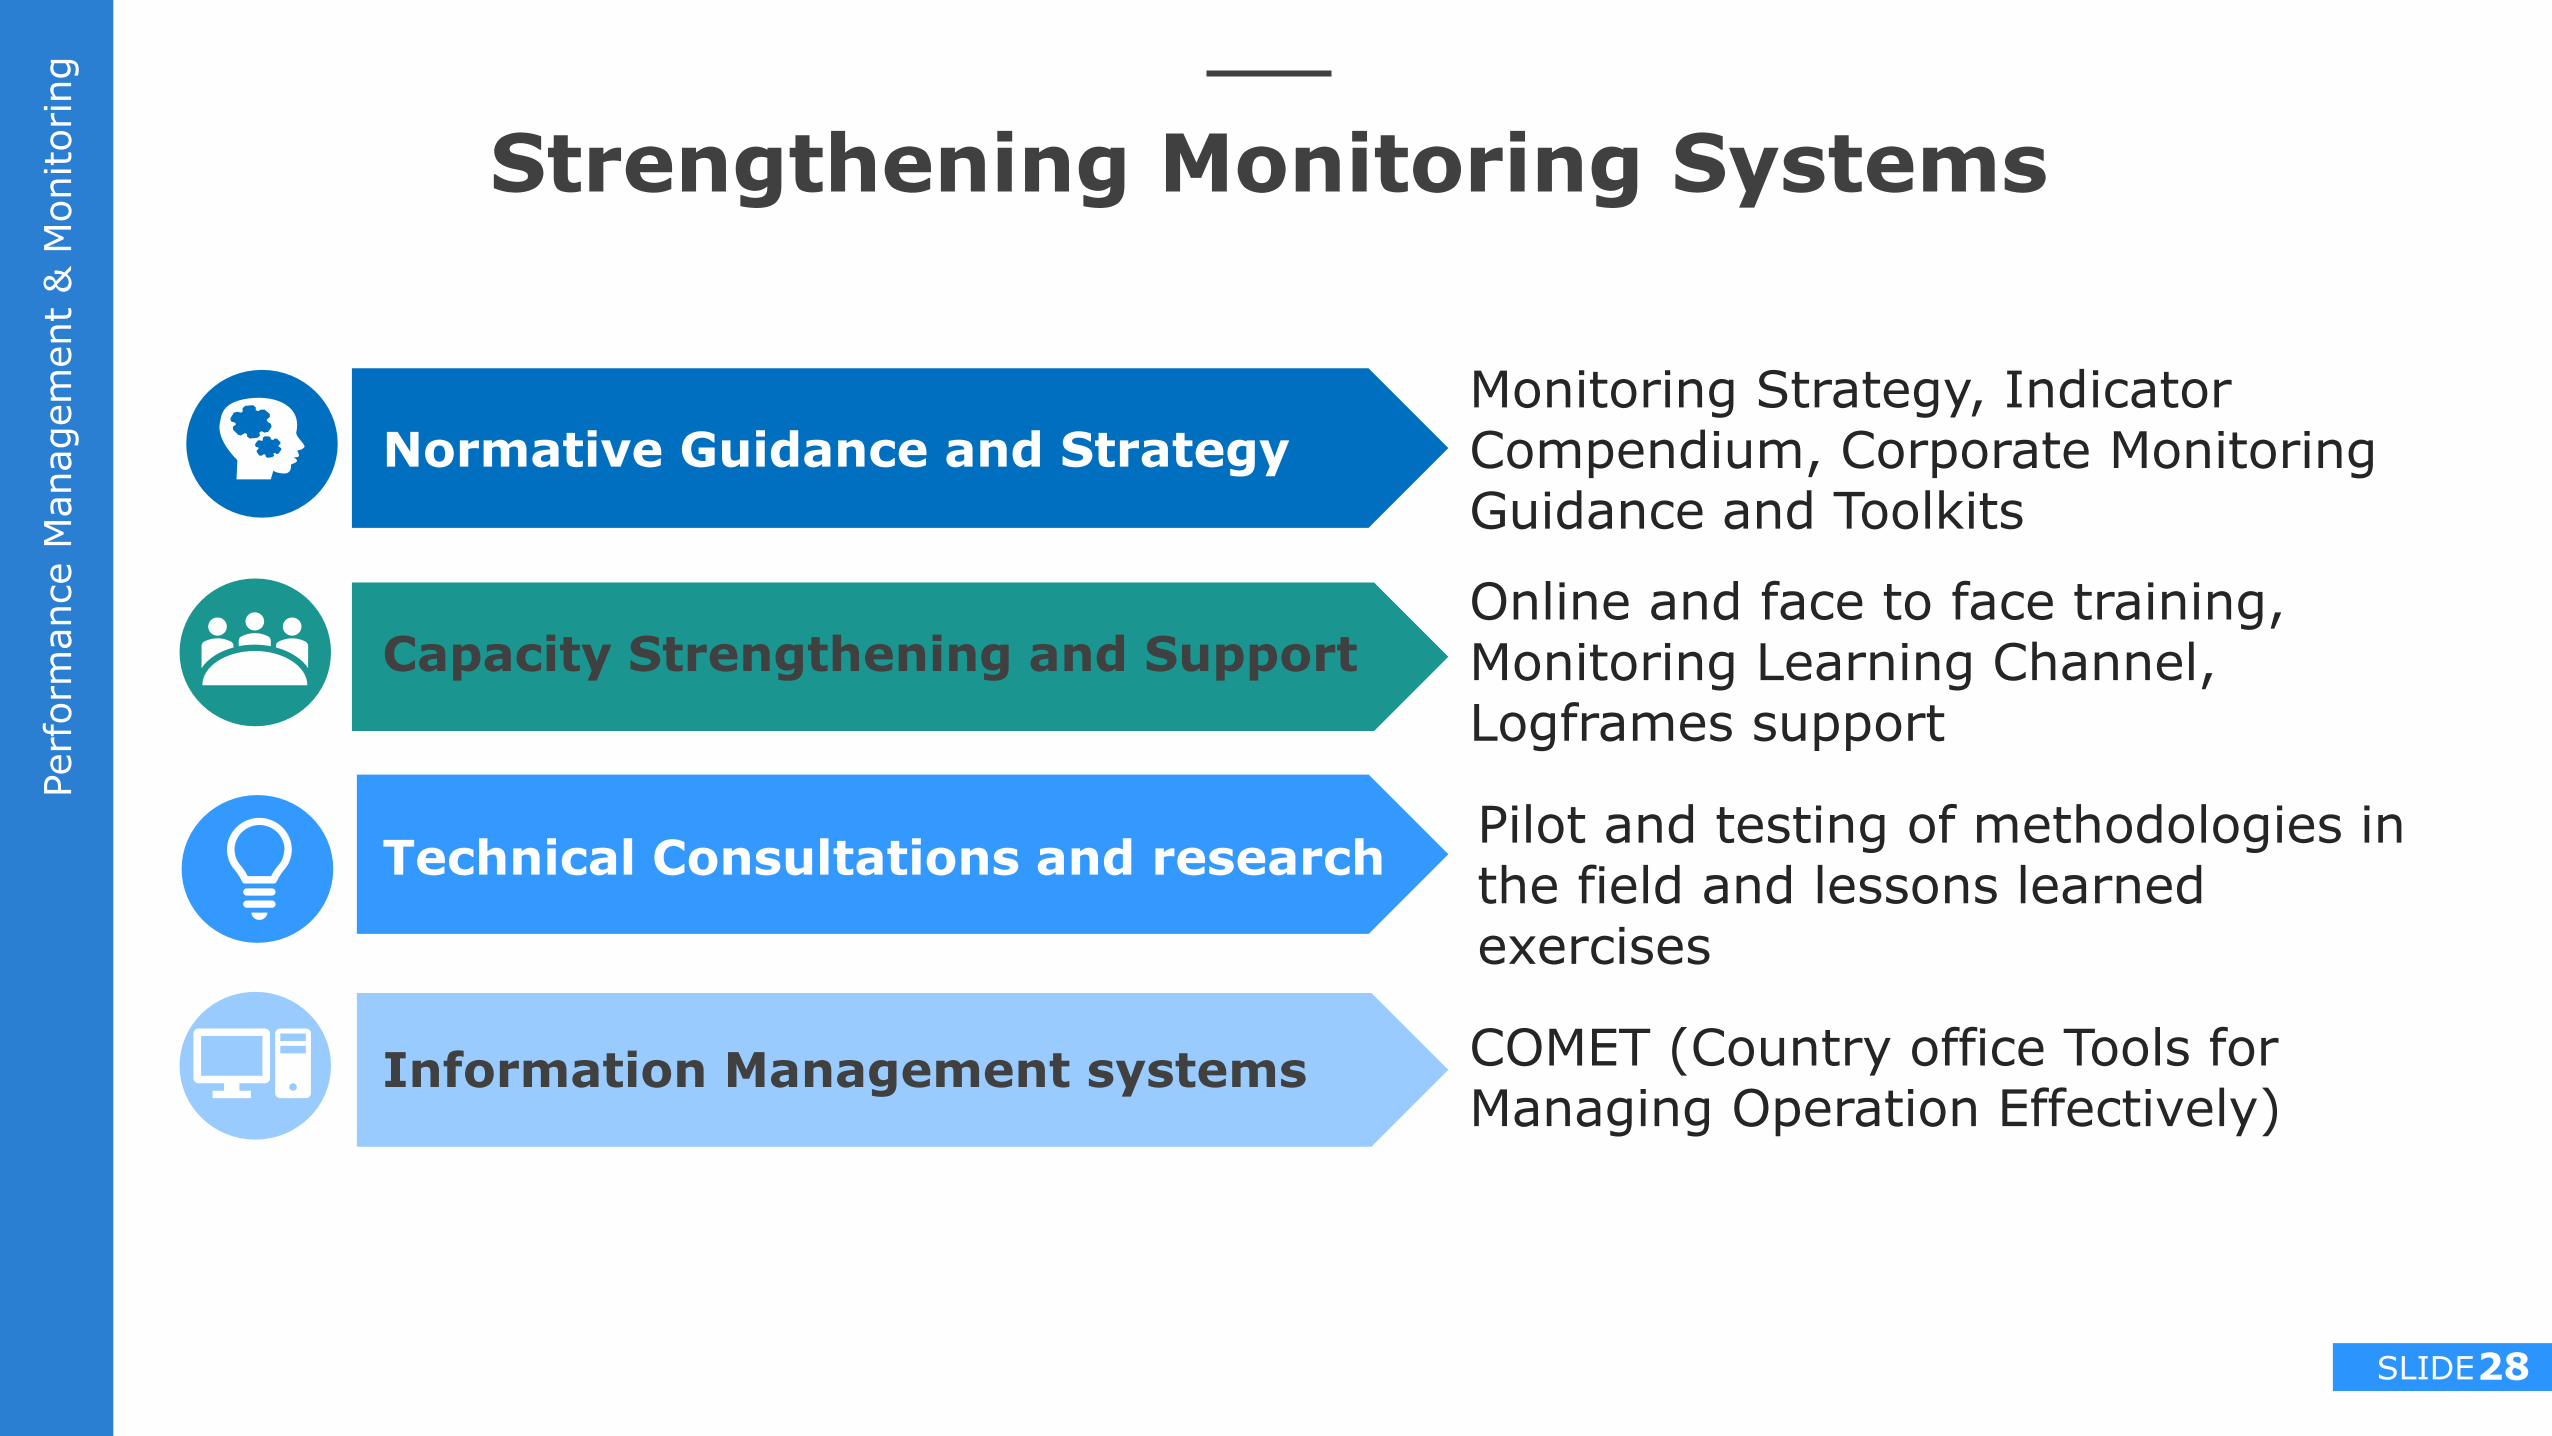
SLIDE28
COMET (Country office Tools for Managing Operation Effectively)
Monitoring Strategy, Indicator Compendium, Corporate Monitoring Guidance and Toolkits
Online and face to face training, Monitoring Learning Channel, Logframes support
Pilot and testing of methodologies in the field and lessons learned exercises
Strengthening Monitoring Systems
Perf
orm
ance M
anagem
ent
& M
onitoring
Normative Guidance and Strategy
Capacity Strengthening and Support
Technical Consultations and research
Information Management systems

SLIDE29
SPR ACR
The Standard Project Report details the results achieved by WFP at project level. It will be substituted by the ACR once
the IRM transition is complete.
APR
The Annual Performance Report details overall WFP’s
performance against the Strategic Plan and the Management Plan, basing on the Corporate Results Framework and linking resources
to results.
The Annual Country Report demonstrates the performance of CSP countries over the year using the new line of sight and
country portfolio budget structure
Performance Reports for 2017
Perf
orm
ance M
anagem
ent
& M
onitoring
SLIDE30
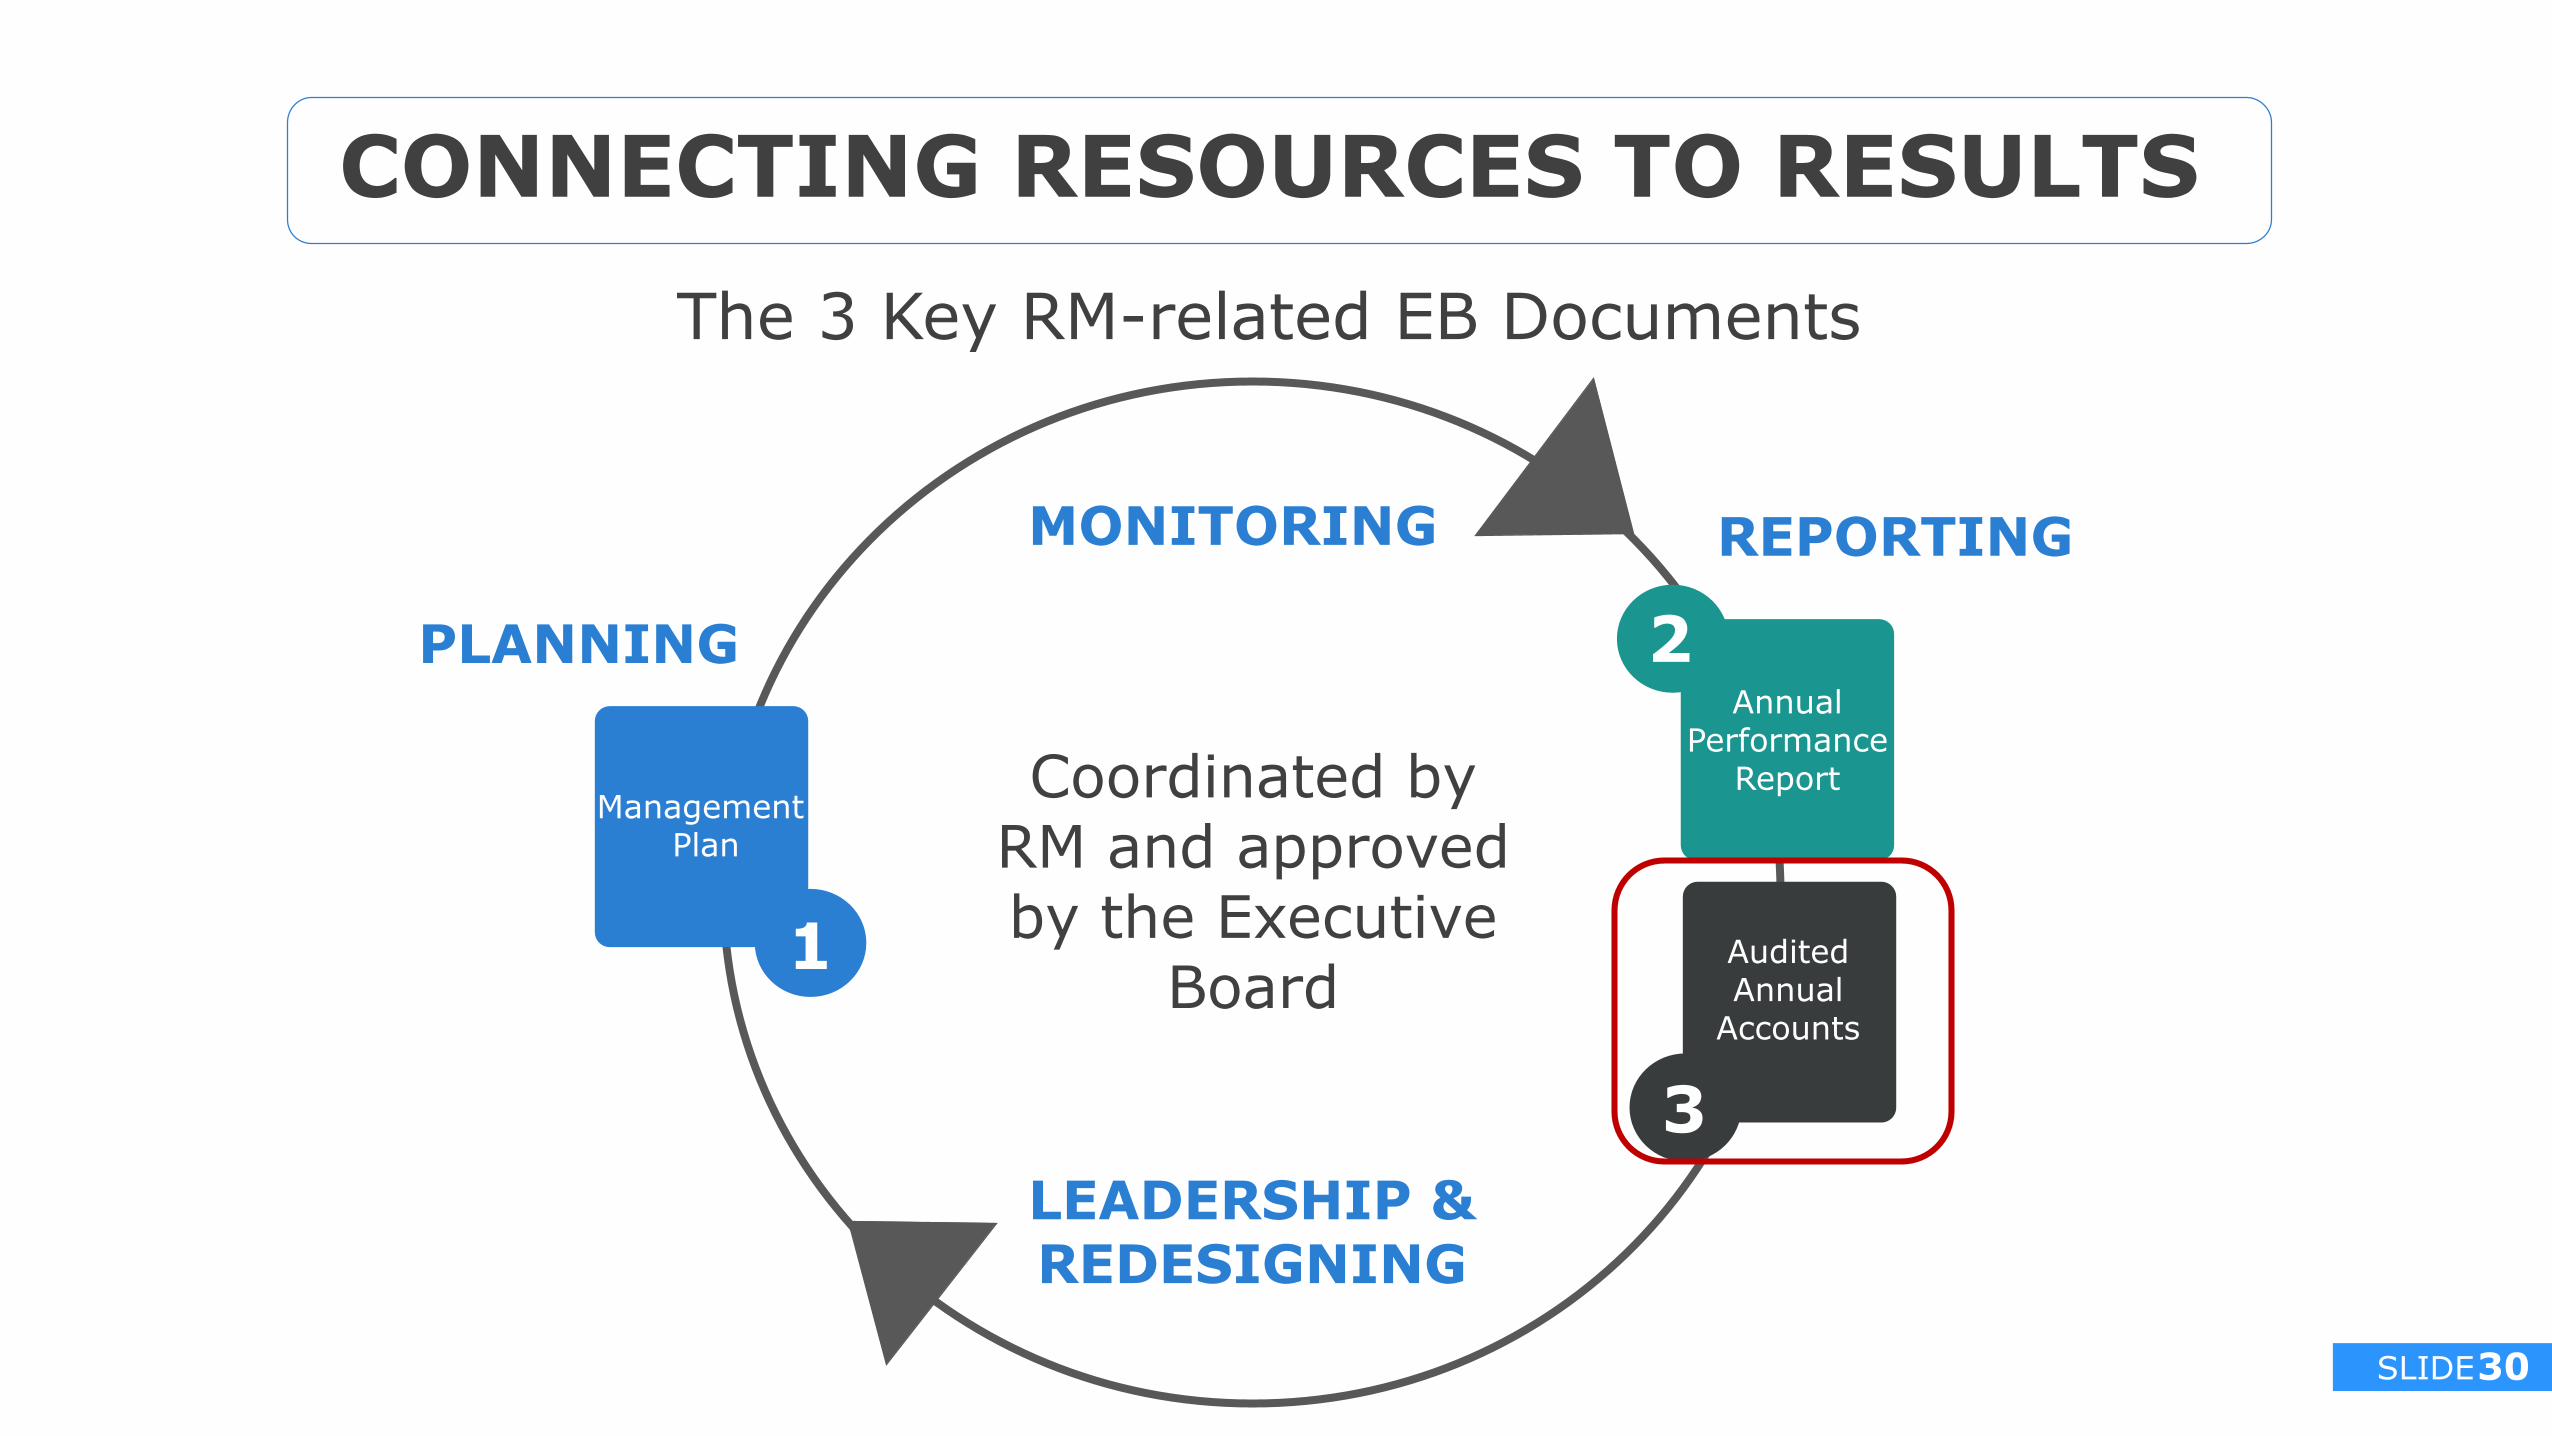
CONNECTING RESOURCES TO RESULTS
The 3 Key RM-related EB Documents
PLANNING
REPORTINGMONITORING
LEADERSHIP &REDESIGNING
Management Plan
Annual Performance
Report
Audited Annual
Accounts
Coordinated by RM and approved by the Executive
Board1
2
3

SLIDE31
2017 Forecast
20162015
(restated)2014 2013 2012
Contribution revenue (monetary and in-kind)
5,963 5,771.1 4,662.2 5,410 4,401 3,830
Other (Other Revenue, Currency and Return on Investment)
368 138 103 69 156 167
Total Revenue 6,331 5,909 4,765 5,479 4,557 3,997
Expenses 5,955 5,367 4,816 5,215 4,515 4,396
Surplus (Deficit) 376 541 (51) 264 42 (399)
Total Deferred Revenue (Liability) 1,928 986 239 NA NA NA
Annual Financial Statements HighlightsPreliminary figures for 2017 (RMF)
Fin
ance &
Tre
asury
SLIDE32
SAFEGUARDING OUR RESOURCES
Enterprise Risk ManagementFinancial Risk and Cash Management
Asset Management

SLIDE33
RMR
Enterprise Risk Management
& Internal Controls
SAFEGUARDING OUR RESOURCES
Global Asset Management
RMMRMF
Financial Risk Management
& Cash Management
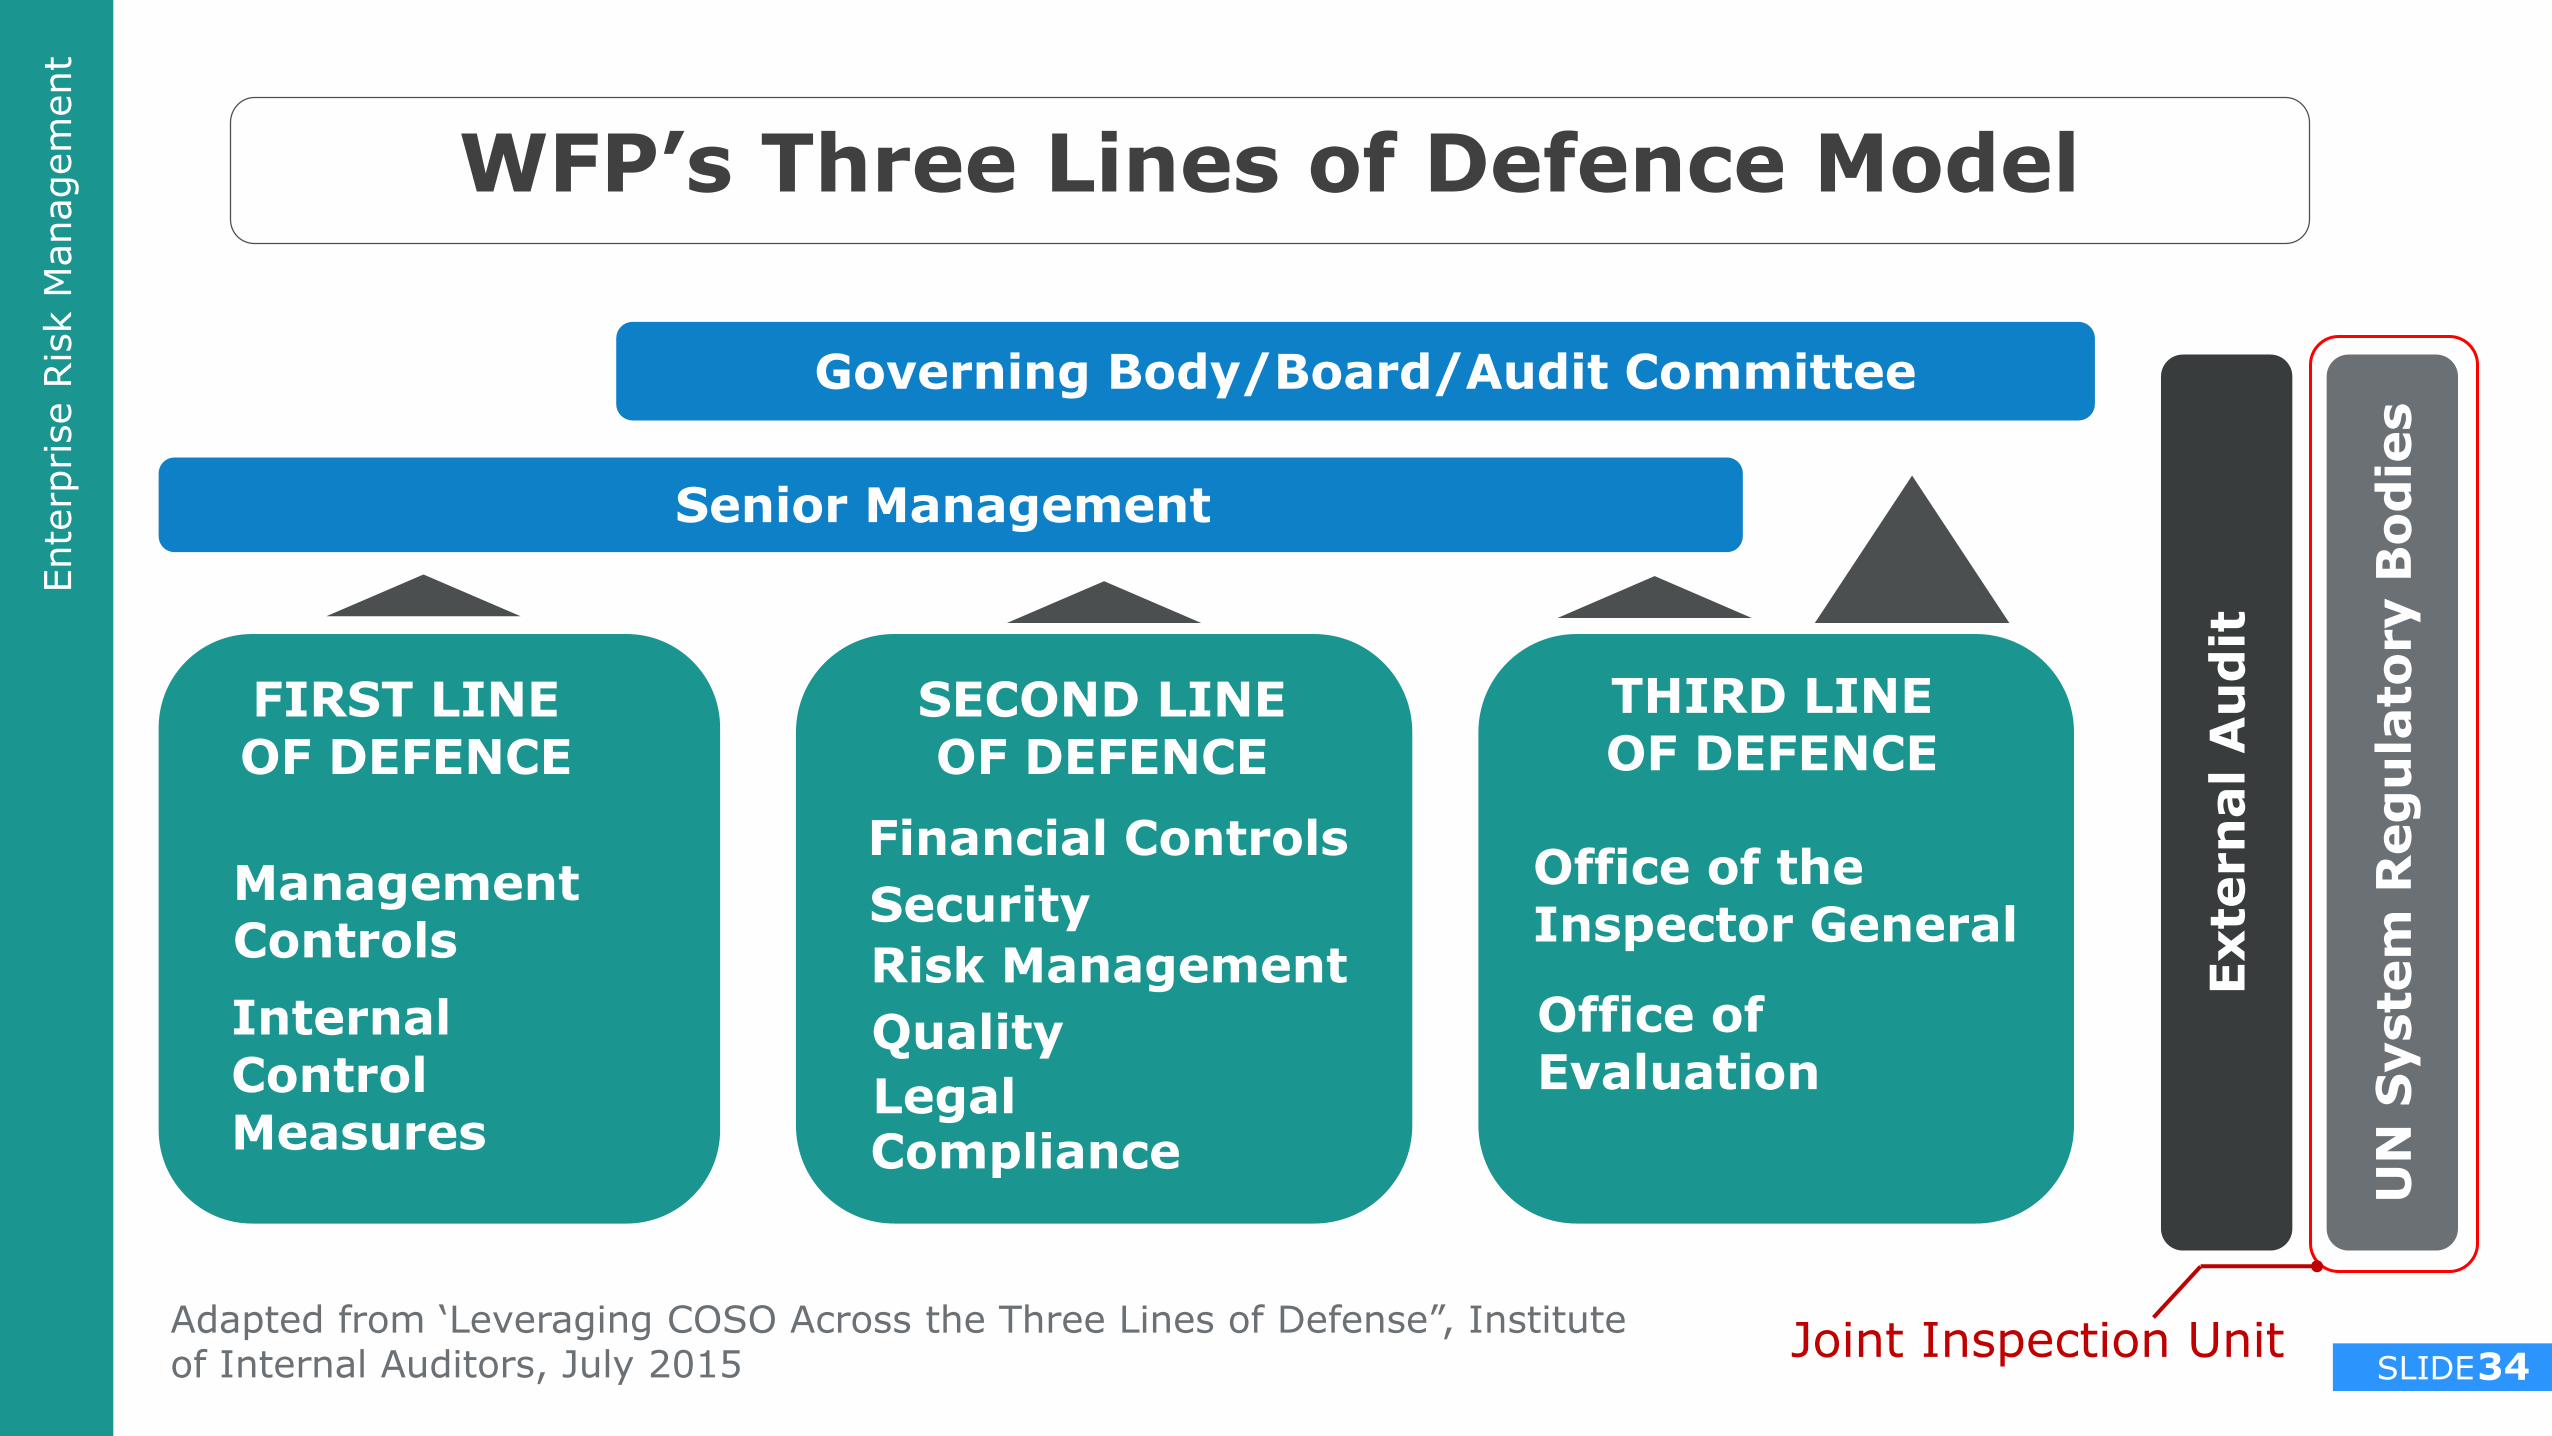
SLIDE34
WFP’s Three Lines of Defence Model
Governing Body/Board/Audit Committee
Senior Management
Exte
rn
al A
ud
it
UN
Syste
m R
eg
ula
tory B
od
ies
FIRST LINE OF DEFENCE
SECOND LINE OF DEFENCE
THIRD LINE OF DEFENCE
Management Controls
Internal Control Measures
Financial Controls
Security
Risk Management
Quality
Legal Compliance
Office of the Inspector General
Office of Evaluation
Adapted from ‘Leveraging COSO Across the Three Lines of Defense”, Institute of Internal Auditors, July 2015
Ente
rprise R
isk M
anagem
ent
Joint Inspection Unit
SLIDE35
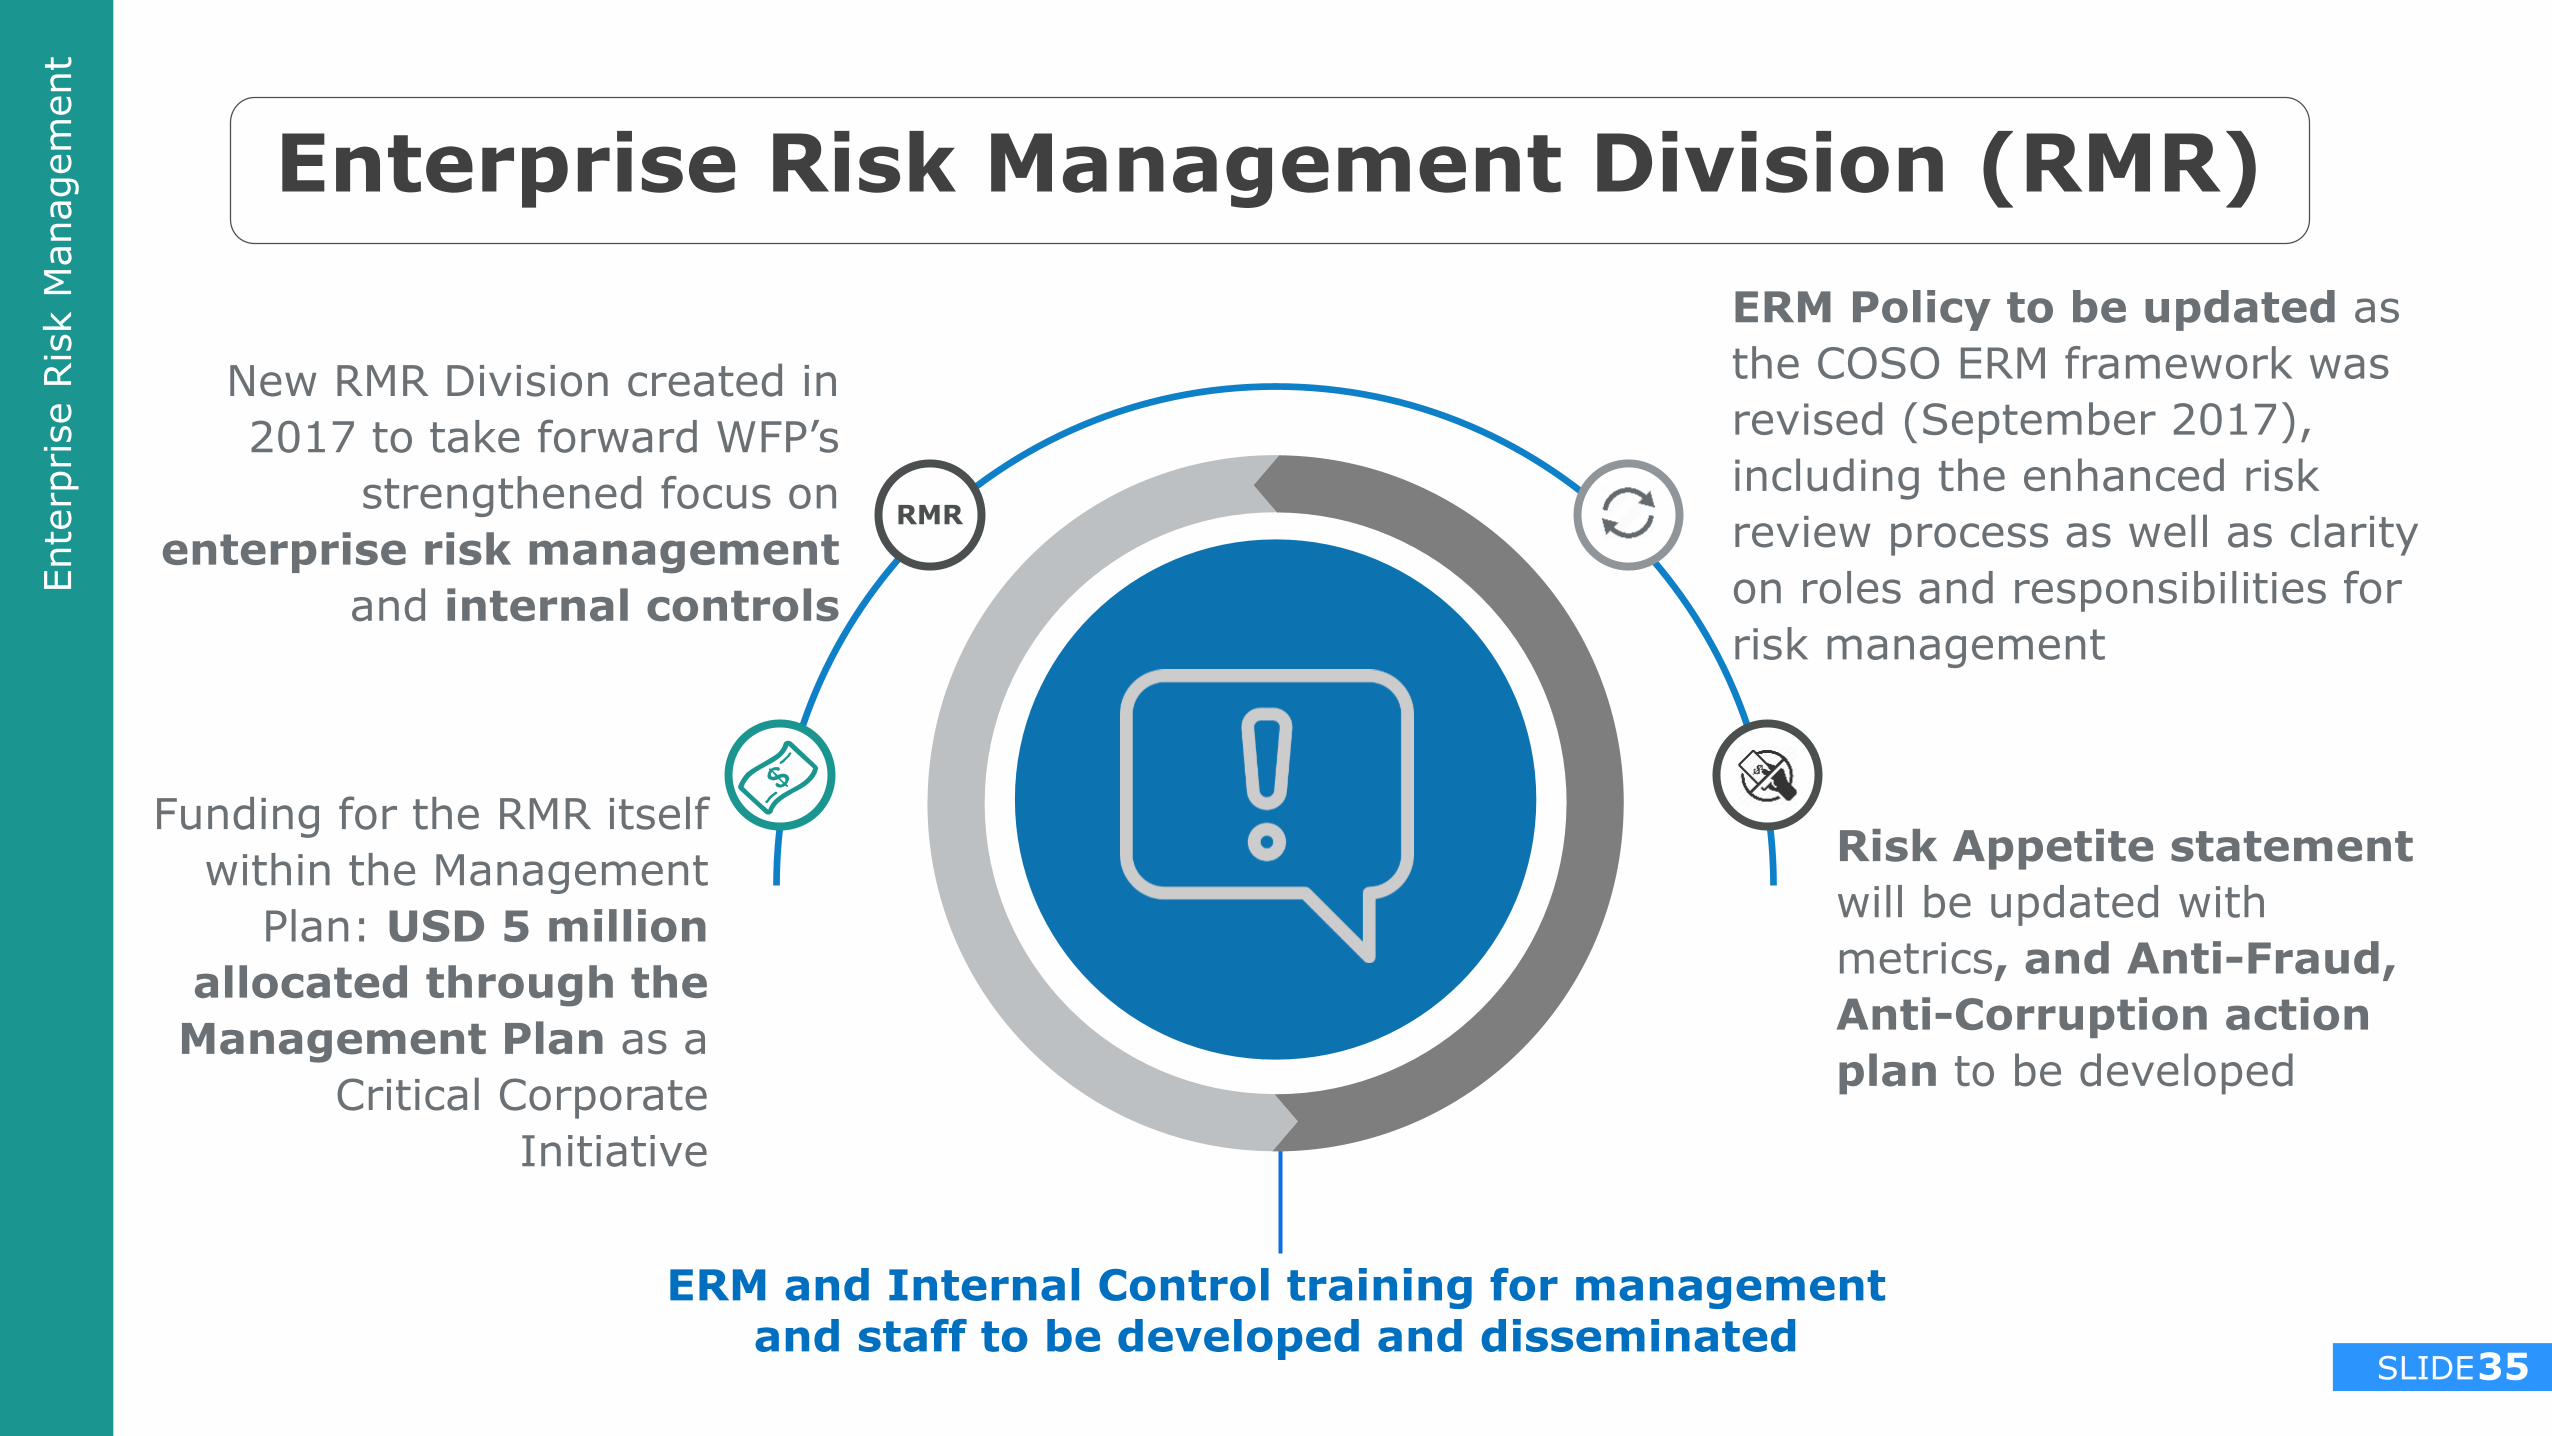
Enterprise Risk Management Division (RMR)
New RMR Division created in
2017 to take forward WFP’s
strengthened focus on
enterprise risk management
and internal controls
Funding for the RMR itself
within the Management
Plan: USD 5 million
allocated through the
Management Plan as a
Critical Corporate
Initiative
ERM Policy to be updated as
the COSO ERM framework was
revised (September 2017),
including the enhanced risk
review process as well as clarity
on roles and responsibilities for
risk management
Risk Appetite statement
will be updated with
metrics, and Anti-Fraud,
Anti-Corruption action
plan to be developed
RMR
ERM and Internal Control training for management and staff to be developed and disseminated
Ente
rprise R
isk M
anagem
ent
SLIDE36
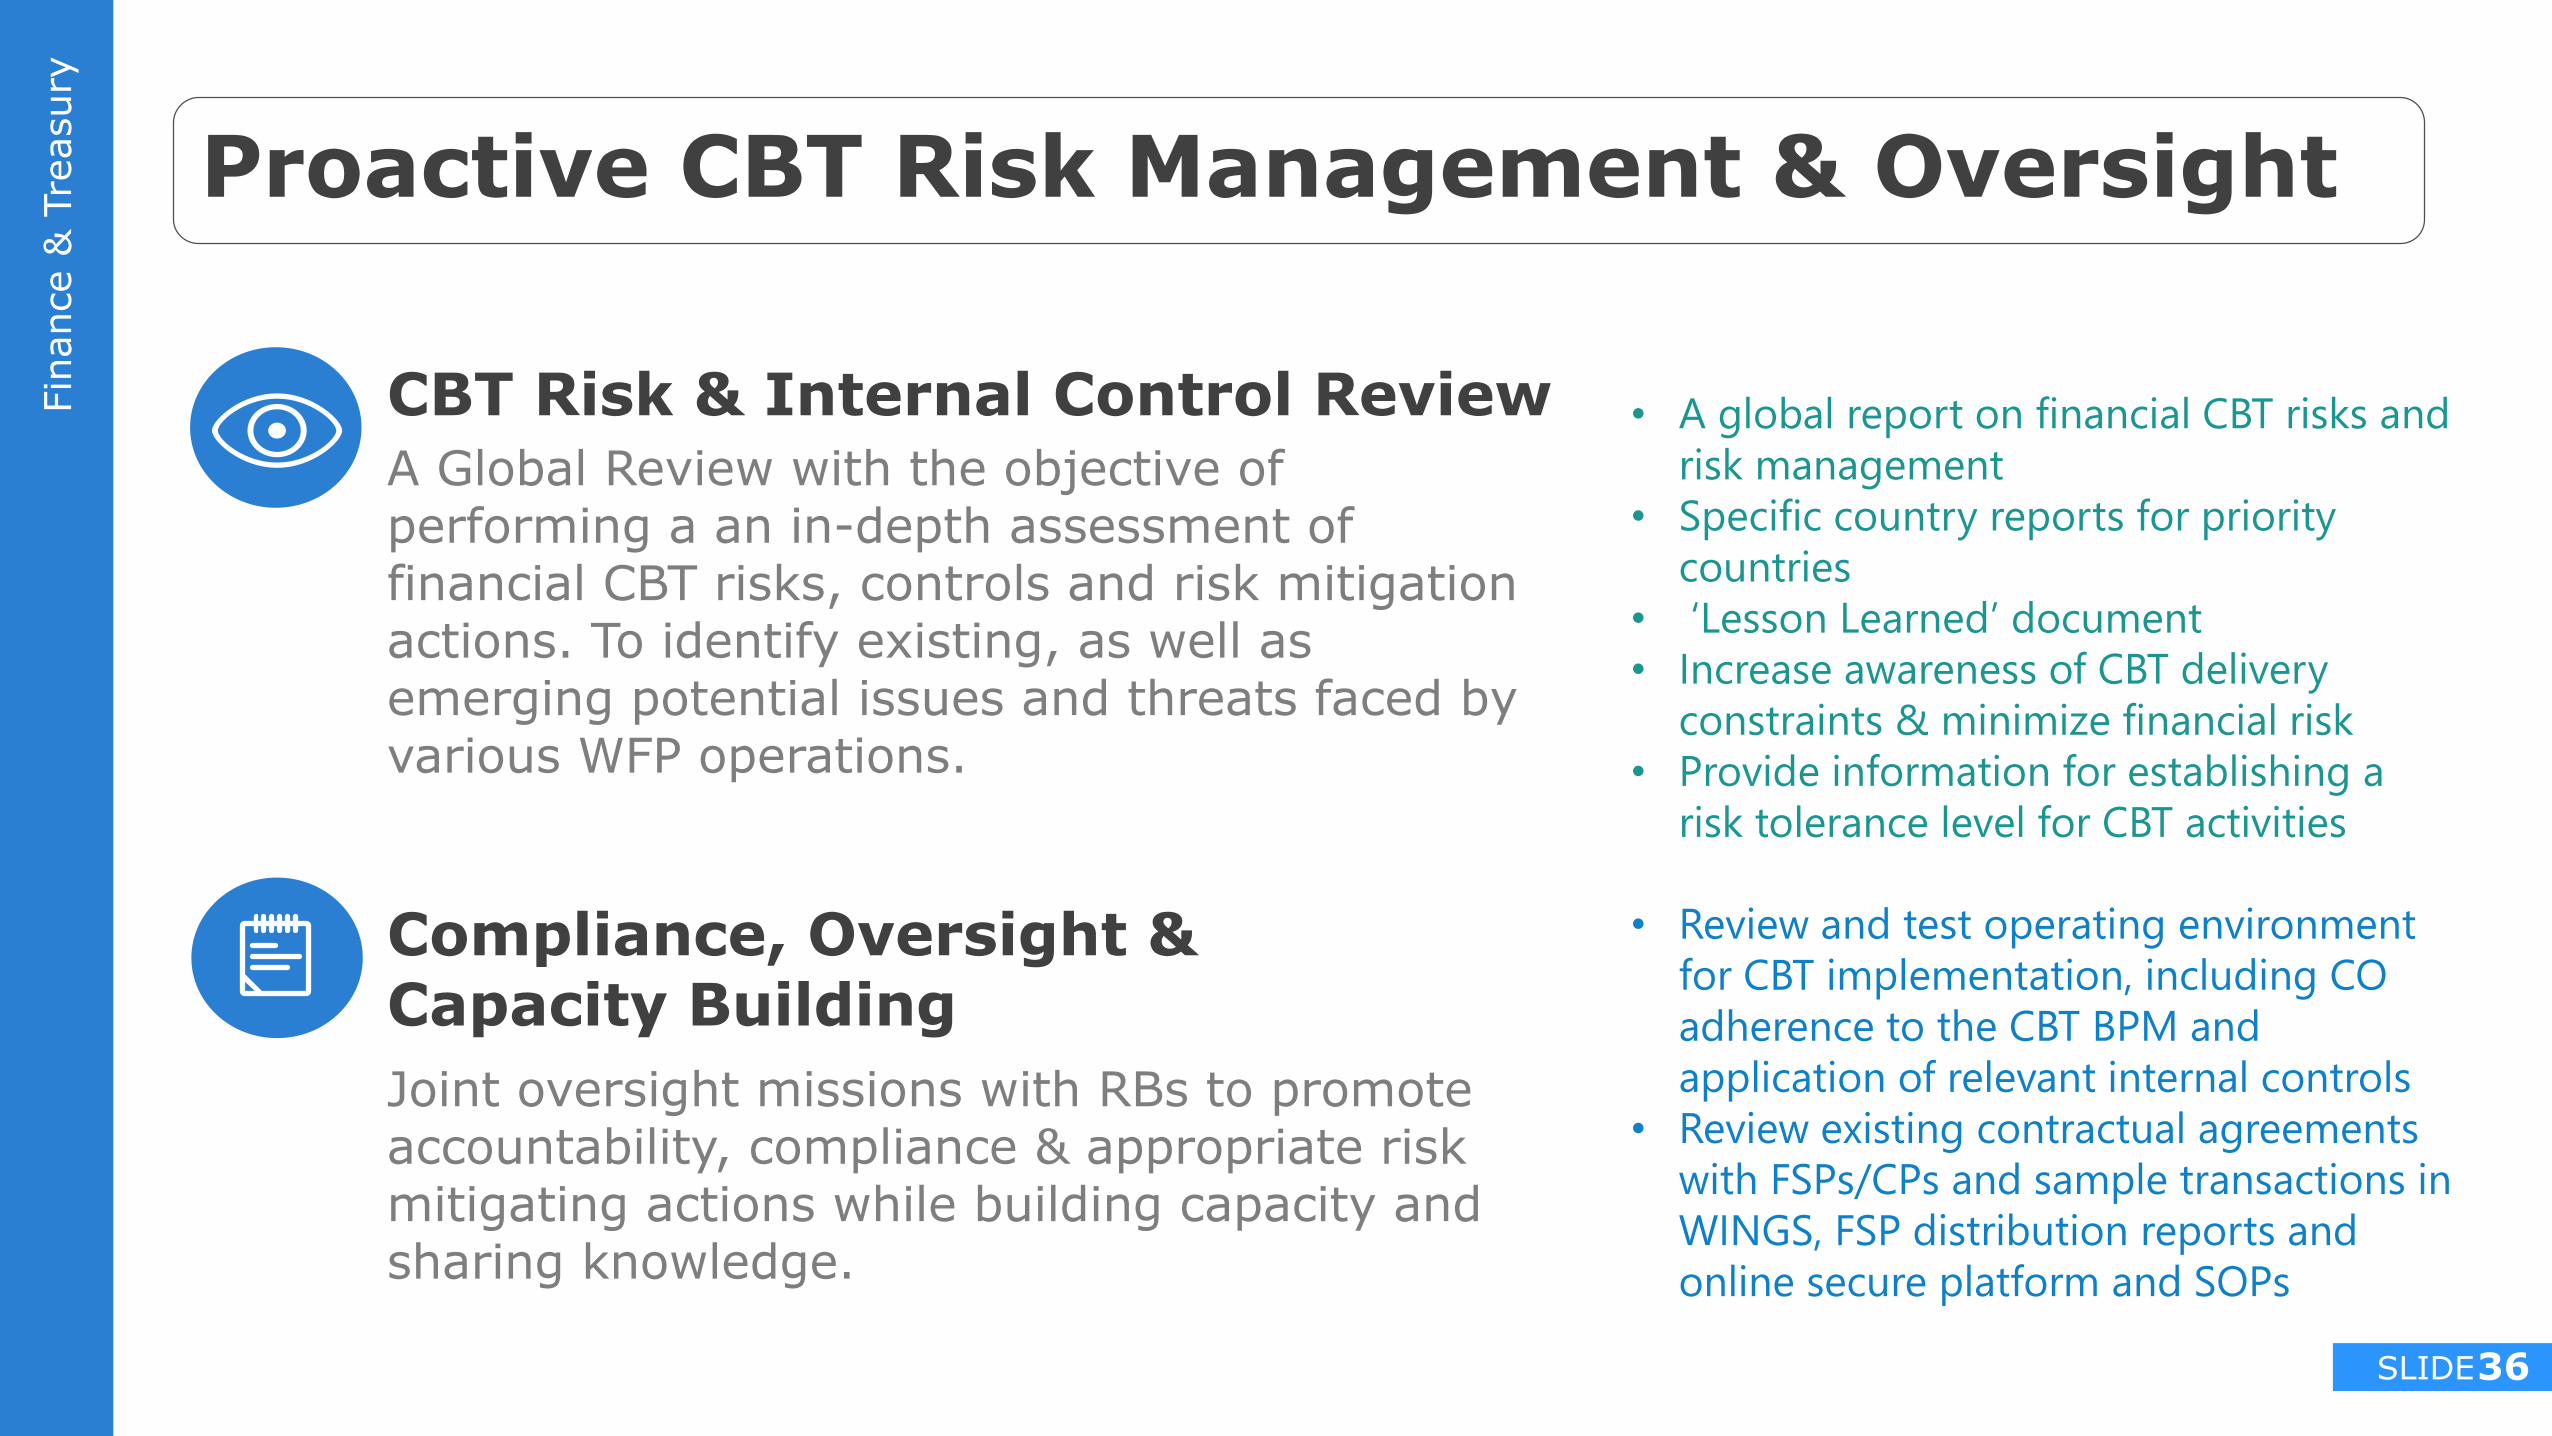
Proactive CBT Risk Management & Oversight
CBT Risk & Internal Control Review A Global Review with the objective of performing a an in-depth assessment of financial CBT risks, controls and risk mitigation actions. To identify existing, as well as emerging potential issues and threats faced by various WFP operations.
Compliance, Oversight & Capacity Building
Joint oversight missions with RBs to promote accountability, compliance & appropriate risk mitigating actions while building capacity and sharing knowledge.
• A global report on financial CBT risks and
risk management
• Specific country reports for priority
countries
• ‘Lesson Learned’ document
• Increase awareness of CBT delivery
constraints & minimize financial risk
• Provide information for establishing a
risk tolerance level for CBT activities
• Review and test operating environment
for CBT implementation, including CO
adherence to the CBT BPM and
application of relevant internal controls
• Review existing contractual agreements
with FSPs/CPs and sample transactions in
WINGS, FSP distribution reports and
online secure platform and SOPs
Fin
ance &
Tre
asury

SLIDE37
Asset Management
Managem
ent
Serv
ices
WFP owns 300,000 assets acquired at value of USD 632
million
Vehicles represent 35% of total asset
value
Project to auction obsolete assets and
generate savings
Fleet and Asset Centre in Dubai and the Global Asset Service Team (GAS)
supports CO through professional asset management
2018 Global roll-out of GEMS Mobile & Physical Inventory Module in joint
effort with RMTD

SLIDE38
Treading lightly on the earth
A sound environmental policy and systems that consistently manage environmental risks and
improve environmental outcomes will better equip WFP to help achieve the SDGs and end hunger

SLIDE39
9.5 MSavings on CO FX transactions
performed by HQ in 2016
13.2 M
Cost Efficiency Lens
Savings on food procured through GCMF during first semester of 2017
9 MIn savings planned through the Global
Fleet Service Center
1.3 BIn internal lending to
country offices against forecasted
contributions in 2017
SLIDE40
KEY EXECUTIVE BOARD DATES

SLIDE41
Annual Session (18-22 June)
• Annual Performance Report (APR)
for 2017
• Audited Annual Accounts, 2017
• Report on the Utilization of WFP’s
Advance Financing Mechanisms
• Update to Oversight Framework
• Utilization of PSAEA reserves
Second Regular Session (26-30 November)
• WFP Management Plan (2019-
2021)
• Revised Corporate Results
Framework (CRF)
• Enterprise Risk Management
Policy and Risk Appetite
Statement
17 January Resource Management Seminar
07 February• 1st Quarterly Briefing on Oversight
• IC on the update of IRM
26-28 February First Regular Session of the Executive Board
March (TBC) IC on Updated Oversight Framework
07 March IC on the update of IRM
11 April 2nd Quarterly Briefing on Oversight
03 May
• IC on the update of IRM
• Briefing on the uses and mechanisms of the SRAC
• Briefing on the Wellness Strategy
09 May• Briefing on the Management Plan (2019-2021)
• Resource Management Seminar on EB.A/2018 items
18-22 June Annual Session of the Executive Board
06 July 1st IC on the Management Plan (2019-2021)
13 July IC on the update of IRM
20 July 3rd Quarterly Briefing on Oversight
24 July 1st IC on Enterprise Risk Management Policy
06 September• IC on the update of IRM
• 2nd IC on the Management Plan (2019-2021)
07 September• 2nd IC on Enterprise Risk Management Policy
• IC on the Revised Corporate Results Framework (2017-2021)
09 October 4th Quarterly Briefing on Oversight
26-30 November Second Regular Session of the Executive Board
KEY
RM
DA
TES
AN
D D
OC
UM
EN
TS
IN
20
18

SLIDE42
THANK YOU