resilience of the u.s. electricity system: a multi … of the u.s. electricity system: a...
TRANSCRIPT

Resilience of the U.S. Electricity System: A Multi-Hazard Perspective
Benjamin L. Preston (ORNL) Scott N. Backhaus (LANL) Mary Ewers (LANL) Julia A. Phillips (ANL) Cesar A. Silva-Monroy (SNL) Jeffery E. Dagle (PNNL) Alfonso G. Tarditi (ORNL) John (Pat) Looney (BNL) Thomas J. King, Jr. (ORNL) August 18, 2016

DOCUMENT AVAILABILITY
Reports produced after January 1, 1996, are generally available free via US Department of Energy (DOE) SciTech Connect. Website http://www.osti.gov/scitech/ Reports produced before January 1, 1996, may be purchased by members of the public from the following source: National Technical Information Service 5285 Port Royal Road Springfield, VA 22161 Telephone 703-605-6000 (1-800-553-6847) TDD 703-487-4639 Fax 703-605-6900 E-mail [email protected] Website http://www.ntis.gov/help/ordermethods.aspx
Reports are available to DOE employees, DOE contractors, Energy Technology Data Exchange representatives, and International Nuclear Information System representatives from the following source: Office of Scientific and Technical Information PO Box 62 Oak Ridge, TN 37831 Telephone 865-576-8401 Fax 865-576-5728 E-mail [email protected] Website http://www.osti.gov/contact.html
This report was prepared as an account of work sponsored by an agency of the United States Government. Neither the United States Government nor any agency thereof, nor any of their employees, makes any warranty, express or implied, or assumes any legal liability or responsibility for the accuracy, completeness, or usefulness of any information, apparatus, product, or process disclosed, or represents that its use would not infringe privately owned rights. Reference herein to any specific commercial product, process, or service by trade name, trademark, manufacturer, or otherwise, does not necessarily constitute or imply its endorsement, recommendation, or favoring by the United States Government or any agency thereof. The views and opinions of authors expressed herein do not necessarily state or reflect those of the United States Government or any agency thereof.

RESILIENCE OF THE U.S. ELECTRICITY SYSTEM:
A MULTI-HAZARD PERSPECTIVE
Authors:
Benjamin L. Preston (ORNL)
Scott N. Backhaus (LANL)
Mary Ewers (LANL)
Julia A. Phillips (ANL)
Cesar A. Silva-Monroy (SNL)
Jeffery E. Dagle (PNNL)
Alfonso G. Tarditi (ORNL)
John (Pat) Looney (BNL)
Thomas J. King, Jr. (ORNL)
Date Published: August, 2016
Prepared by
ARGONNE NATIONAL LABORATORY
BROOKHAVEN NATIONAL LABORATORY
LOS ALAMOS NATIONAL LABORATORY
OAK RIDGE NATIONAL LABORATORY
PACIFIC NORTHWEST NATIONAL LABORATORY
SANDIA NATIONAL LABORATORIES
This document was prepared for Greg Singleton and James Bradbury at the Department of Energy’s
Office of Energy Policy and Systems Analysis (EPSA). The Authors and National Laboratory staff
would like to thank a number of participants that donated their time and effort towards informing the
results of this report, as well as the support of Mr. Singleton and Mr. Bradbury for their encouragement
and support throughout the process.

i
Contents LIST OF FIGURES ...................................................................................................................................... ii LIST OF TABLES ........................................................................................................................................ ii ABBREVIATIONS ..................................................................................................................................... iii ABSTRACT ................................................................................................................................................. iv 1. Introduction ........................................................................................................................................... 1
Box 1. Federal Initiatives on Electricity System Resilience ....................................................... 2 2. Overview of U.S. Electricity Sector – Status and Trends ..................................................................... 3 3. Framing Electricity Sector Risk and Resilience ................................................................................... 5
Box 2. Existing Reliability Performance Requirements for the Bulk Electric System ............... 8 4. Environmental and Human Threats to the Electricity Sector ............................................................... 9
4.1 Natural/Environmental Threats ................................................................................................. 10 4.1.1 Hurricanes and Extreme Winds ................................................................................... 10 4.1.2 Drought ........................................................................................................................ 13 4.1.3 Winter Storms, Ice, Extreme Cold ............................................................................... 15 4.1.4 Extreme Heat and Heatwave ........................................................................................ 16 4.1.5 Inland and Coastal Flooding ........................................................................................ 17 4.1.6 Wildfire ........................................................................................................................ 18 4.1.7 Sea-Level Rise ............................................................................................................. 19 4.1.8 Earthquake ................................................................................................................... 21 4.1.9 Geomagnetic ................................................................................................................ 22 4.1.10 Wildlife and Vegetation ............................................................................................... 23
4.2 Human Threats .......................................................................................................................... 24 4.2.1 Physical Attack ............................................................................................................ 24 Box 3. High-Voltage Transformers as Key Sources of Vulnerability ...................................... 25 4.2.2 Cyber Attack ................................................................................................................ 25 Box 4. Electricity System Vulnerabilities to Cyber Attack ...................................................... 26 4.2.3 Electromagnetic ........................................................................................................... 27 4.2.4 Spontaneous Equipment Failure .................................................................................. 29 4.2.5 Combined threats ......................................................................................................... 29
5. Integrated Assessment of Electricity Sector Resilience ...................................................................... 30 5.1 Assessing electricity sector resilience ....................................................................................... 31
Box 5. Toward Industry Resilience Metrics for the Electricity Sector ..................................... 32 5.2 Assessment of Electricity sector risk and reslience .................................................................. 33
6. Toward Enhanced Resilience of the Electricity Sector ....................................................................... 36 6.1 Opportunities for enhancing resilience ..................................................................................... 36 6.1 constraints and limits associated with enhancing resilience ..................................................... 37
6.1.1 Predictability of Threats and System Responses to Climate Change........................... 37 Box 6. Technology Options for Enhancing Grid Resilience ..................................................... 38 6.1.2 Cost Recovery and Stranded Investments .................................................................... 39 6.1.3 Communication and Workforce ................................................................................... 40 6.1.4 Coordination and Collaboration ................................................................................... 40 6.1.5 Governance Gaps ......................................................................................................... 41 6.1.6 Future Risk ................................................................................................................... 41
7. Conclusions and recommendations .................................................................................................... 42 Appendix A. References for Table 4. Summary of Key Threats to the Electricity System ........................ 44 Appendix B. Detailed Analysis of Risk and Resilience of the U.S. Electricity System ............................. 45 Endnotes ...................................................................................................................................................... 46

ii
LIST OF FIGURES
Figure 1. Essential Elements of a Resilient System. ..................................................................................... 1 Figure 2. Components of the U.S. Electricity Grid ....................................................................................... 3 Figure 3. Monthly Net Generation by Fuel Source ....................................................................................... 4 Figure 4. Conceptual Model of the Risk Landscape ..................................................................................... 7 Figure 5. Projected Change in North American Seasonal Precipitation ..................................................... 14 Figure 6. Historical Trend in U.S. Wildfire Frequency and Area (1960-2015) .......................................... 19 Figure 7. Past and Projected Changes in Global Sea Level ........................................................................ 20 Figure 8. The U.S. Geological Survey National Seismic Hazard Map ....................................................... 21 Figure 9. Metrics of Electricity System Resilience Used in the Current Report ........................................ 31 Figure 10. A Logic Framework for Resilience Indicators for the Energy System ...................................... 32 Figure 11. Risks to the Electricity Sector Mapped to the Risk Landscape ................................................. 35
LIST OF TABLES
Table 1. Types of Electric Utility Owners and Operators. ............................................................................ 4 Table 2. Annual Trends in Generation by Source ......................................................................................... 5 Table 3. Electric Emergency and Disturbance Events (2014) .................................................................... 10 Table 4. Summary of Key Threats to the Electricity System ...................................................................... 11 Table 5. Top Six Weaknesses in Industrial Control Systems in 2015 ........................................................ 27 Table 6. Potential Interactions between Natural and Human Risks to the Electricity System .................... 30 Table 7. Integrated Assessment of Risk and Resilience to the Electricity Sector ....................................... 34 Table 8. Detailed Integrated Assessment of Risk and Resilience to the Electricity Sector ........................ 45

iii
ABBREVIATIONS
ARI – Annual return interval
BS – British Standard
CPC – Climate Prediction Center
CSU – Colorado State University
CT – Combustion turbines
DER – Distributed Energy Resource
DCS – Distributed Control System
DHS – Department of Homeland Security
DOE – Department of Energy
EEI – Edison Electric Institute’s
ENSO – El Niño-Southern Oscillation
G1 – Minor geomagnetic storm
G2 – Moderate geomagnetic storm
G5 – Extreme geomagnetic storm
GIC – Geomagnetically induced current
GMD – Geomagnetic disturbance
GMI – Grid Modernization Initiative
GMLC – Grid Modernization Laboratory
Consortium
EHV – Extra high voltage
EIA – Energy Information Administration
EMP – Electromagnetic pulse
EMI – Electromagnetic interference
EPRI – Electric Power Research Institute
HEMP – High altitude electromagnetic pulse
HILF – High impact, low frequency
HVT – High-voltage transformers
IMT – Incident Management Team
IPCC – Intergovernmental Panel on Climate
Change
ISO – International Organization for
Standardization
LDC – Local distribution companies
MW – Megawatt
NEMP – Nuclear Electromagnetic Pulse
NERC – North American Electric Reliability
Corporation
NIAC – National Infrastructure Advisory
Council
NOAA – National Oceanographic and
Atmospheric Administration
NWS – National Weather Service
PDSI – Palmer Drought Severity Index
PLC – Programmable logic controllers
PPD – Presidential policy directive
PSHA – Probabilistic seismic hazard analyses
QER – Quadrennial Energy Review
PDO – Pacific Decadal Oscillation
ROI – Return on investment
RPS – Renewable portfolio standard
SAIDI – System average interruption duration
index
SAIFI – System average interruption frequency
index
SCADA – Supervisory control and data
acquisition
SF6 – sulfur hexafluoride
SQL – Structured Query Language
SREF – Short Range Ensemble Forecast
SWPC – Space Weather Prediction Center
USGS – U.S. Geologic Survey

iv
ABSTRACT
The U.S. electricity system is a critical infrastructure that supports human well-being, economic growth,
and national security. Comprised of four core components generation, transmission, distribution, and
end use, and, increasingly, dependent on supporting infrastructure such as communication and fuel supply
the electricity system has multiple vulnerabilities to both natural and human risks. These risks range
from the routine and predictable, such as weather events that disrupt transmission or distribution, to high
impact, low frequency risks such as catastrophic hurricanes. In addition to such well-defined, discrete
risks, electricity systems can also be challenged by complex risks associated with multiple, interacting
threats, and/or indirect effects.
Not all of the various risks to which electricity systems are exposed can be readily quantified, predicted,
or even anticipated. Hence, the federal emphasis on resilience reflects the growing awareness of the need
for more robust approaches to addressing risks to the nation’s critical infrastructure and support systems.
The concept of resilience integrates four elements that address risk management needs before, during, and
after an event:
Robustness – the ability to absorb shocks and continue operating;
Resourcefulness – the ability to skillfully manage a crisis as it unfolds;
Rapid Recovery – the ability to get services back as quickly as possible; and
Adaptability – the ability to incorporate lessons learned from past events to improve resilience
A resilience approach explicitly recognizes that not all risks to the U.S. electricity system can be avoided.
However, response options can be implemented to mitigate damage and recover from damage that is
incurred in order to resume normal operations and service delivery as quickly as possible while also
learning from experience to shift the system toward an increasingly robust configuration.
Framing risk and resilience of the U.S. electricity system in an integrated way necessitates considering
different sources of threats, different components of the electricity system that are exposed, different
dimensions of resilience, and the different management practices and technologies that can be deployed
and/or implemented. For example, some options to enhance resilience may be specific to certain types of
threats and may be deployed to protect one component of the system. Yet others may be threat agnostic,
providing system-wide resilience to a broad range of threats including those that cannot be anticipated.
Overall, the U.S. electricity system is among the most robust and resilient in the world. Nevertheless, a
number of threat scenarios continue to pose risk management challenges. Adequately anticipating and
responding to high impact, low frequency (HILF) risks is inherently difficult because they are, by
definition, both rare and significant in scale. Undertaking risk assessment and contingency planning for
more complex risks such as combined threats will require improvements in scenario development as well
as in coordination and communication among different actors. Climate change poses long-term challenges
by changing the frequency, intensity, duration of the weather events that represent the largest source of
disruptions to the U.S. electricity grid.
Future efforts toward building resilience should focus on risk assessment and planning for multiple and
emerging contingencies, particularly for potentially catastrophic threats. Continuing to invest in new
generation technologies and grid modernization while enhancing the capacity for launching coordinated
responses across multiple actors will generate significant benefits in terms of maintaining reliability. Such
investments will also help enable the system to keep pace with the rapidly changing nature of the U.S.
energy sector and emerging threats.

1
1. INTRODUCTION
Recent assessments conducted under the auspices of the U.S. Department of Energy (DOE), the
Department of Homeland Security, and the Global Change Research Program have identified a range of
risks to the electricity sector from natural, climatic, and human threats.1,2,3 Disruptions to the U.S.
electricity system are associated with a range of security, health and safety, and economic consequences
at an estimated annual cost of $18–70 billion.1 Often, however, such threats are assessed in isolation,
limiting the ability to generate comprehensive insights that can assist in risk prioritization or identify risk
management options that are robust to a broad range of threats.
In light of the inevitable risks facing the U.S. electricity system as well as other sectors of the nation, the
federal government has emphasized a resilience agenda (Box 1).1 This has included building national
resilience to climate variability and change through the Climate Action Plan,4 the National Infrastructure
Protection Plan,5 and the Quadrennial Energy Review.6 The emphasis on resilience has also manifested in
the States, particularly in the wake of disasters such as Hurricanes Katrina and Sandy, where enhancing
resilience against similar future threats has become a central theme of public and private recovery efforts.7
The National Infrastructure Advisory Council defines resilience as having four dimensions (Figure 1):8
Robustness – the ability to absorb shocks and continue operating;
Resourcefulness – the ability to skillfully manage a crisis as it unfolds;
Rapid Recovery – the ability to get services back as quickly as possible; and
Adaptability – the ability to incorporate lessons learned from past events to improve resilience
This framing is also consistent with the Presidential Policy Directive (PPD-21) on Critical Infrastructure
Security and Resilience.9 Hence, achieving a resilient electricity sector is a multi-objective challenge that
is best addressed through proactive, rather than reactive, approaches.10
Figure 1. Essential Elements of a Resilient System
Source: NIAC (2010)8
The resilience of the electricity system must be viewed in the context of the changing nature of the larger
U.S. energy landscape. The first Quadrennial Energy Review (QER) identified a range of developments
in the energy sector including growing threats from climate change, energy security, transitions from coal
to natural gas generation, increased deployment of distributed and renewable generation, and rising
investments to modernize the energy grid.6 These trends are creating new opportunities, but they are also
associated with challenges. Continued growth of the U.S. population along with migration and
urbanization are changing the geographic distribution of electricity demand and exposure of infrastructure
to natural hazards. New energy technologies have to be seamlessly integrated into the electricity grid.
Meanwhile, cybersecurity is an emerging priority for U.S. energy infrastructure, while vigilance is still
needed against more conventional sabotage and physical attack. Climate change is affecting both energy

2
supply and demand. Supply is affected because it constrains the use of resources such as water, and shifts
the likelihood of extreme weather events. Demand is affected because of increased demand for electricity
in some regions.
The QER noted that despite ongoing investments in grid modernization, the U.S. electricity system
remains vulnerable to a range of threats. While the consequences of extreme weather account for the
majority of disruptions, and those disruptions are trending upward,11 many natural risks can be forecast or
at least anticipated (e.g., more intense heat waves). This ability to forecast helps to enable the cost-
effective design and deployment of risk management options and technologies to promote grid resilience.
A more challenging set of risks are those associated with low probability yet carry high or catastrophic
consequences.3 These include electromagnetic or geomagnetic disruptions, large-scale cyber or physical
attack, or combinations of risks evolving simultaneously.
Continuing to make progress on grid modernization and electricity system resilience will therefore
necessitate new risk management tools and frameworks that can enable more strategic decision-making.
This includes enhancing the capacity to assess risk across a range of spatial and temporal scales through
data, modeling, and analysis, but also improving management best practices and mechanisms for their
ongoing evaluation.6 A particular challenge will be enhancing the capacity to monitor, analyze, and
respond to systemic, complex risks that propagate over space and time, affect interconnected systems, and
are associated with unknown probabilities of occurrence.
The objective of this report is to build on the knowledge generated through the first QER by integrating
recent literature for a comprehensive analysis of risk and resilience for the U.S. electricity system. The
report provides an overview of the current status and trends in the electricity system that are relevant to
resilience. This is followed by a synthesis of different natural/environmental and human threats to the
electricity system including information on known trends, predictability, and mitigation options. This
information on threats is subsequently examined in the context of different general metrics for resilience
to assess risk to various system components. This integrated assessment helps to inform the identification
Box 1. Federal Initiatives on Electricity System Resilience
Creating the Build America Investment Initiative. The Administration has created this
initiative – an interagency effort led by the Departments of Treasury and Transportation – to
promote increased investment in U.S. infrastructure, particularly through public-private
partnerships.
Enhancing grid resilience to geomagnetic storms. In June 2014, the Federal Energy
Regulatory Commission adopted a new reliability standard to mitigate the impacts of
geomagnetic disturbances on the grid. In November 2014, the Administration established an
interagency Space Weather Operations, Research, and Mitigation Task Force to develop a
National Space Weather Strategy, to include mitigation of grid vulnerability.
Department of Energy’s Grid Modernization Initiative (GMI). Includes funding of $220
million per year for three years, for the Grid Modernization Laboratory Consortium (GMLC) –
a collaborative research and development program across DOE’s national laboratory system.
Partnership for Energy Sector Climate Resilience. Under this Partnership, owners and
operators of energy assets will develop and pursue strategies to reduce climate and weather-
related vulnerabilities. Collectively, these Partners and the DOE will develop resources to
facilitate risk-based decision making and pursue cost-effective strategies for a more climate-
resilient U.S. energy infrastructure.
3
of key opportunities and constraints for enhancing resilience. The report concludes with a set of priority
recommendations for both research and development activities as well as strategic and operational
planning.
2. OVERVIEW OF U.S. ELECTRICITY SECTOR – STATUS AND TRENDS
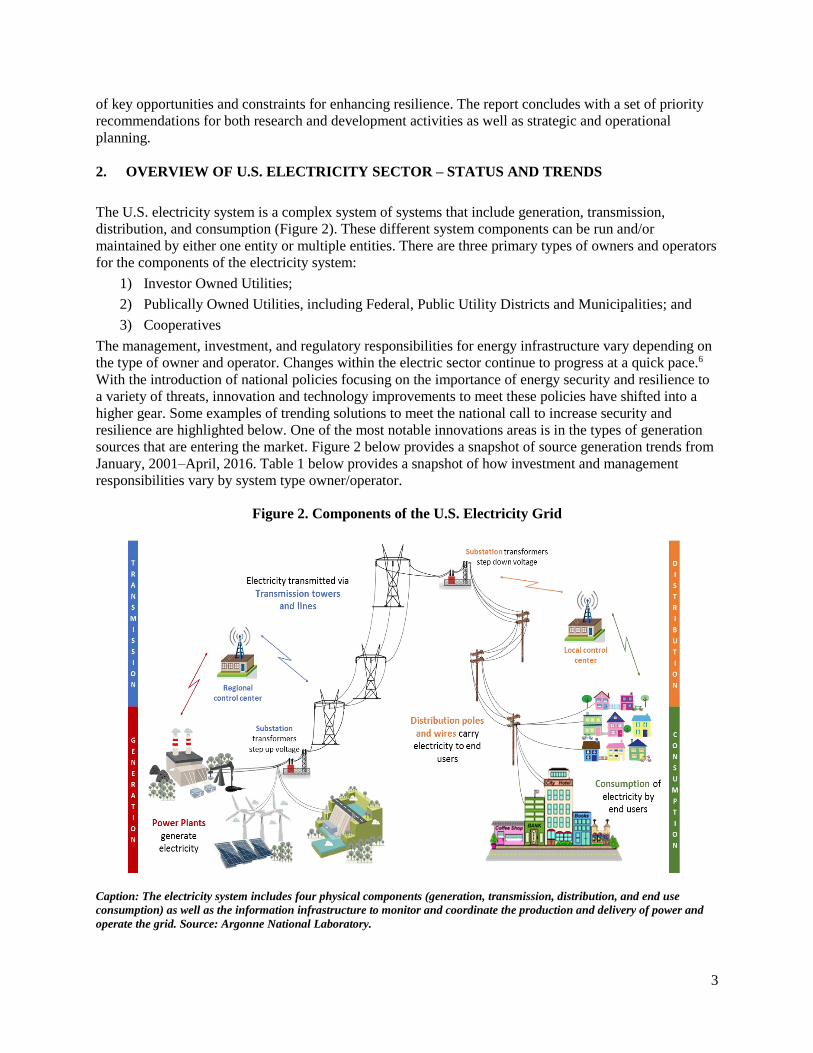
The U.S. electricity system is a complex system of systems that include generation, transmission,
distribution, and consumption (Figure 2). These different system components can be run and/or
maintained by either one entity or multiple entities. There are three primary types of owners and operators
for the components of the electricity system:
1) Investor Owned Utilities;
2) Publically Owned Utilities, including Federal, Public Utility Districts and Municipalities; and
3) Cooperatives
The management, investment, and regulatory responsibilities for energy infrastructure vary depending on
the type of owner and operator. Changes within the electric sector continue to progress at a quick pace.6
With the introduction of national policies focusing on the importance of energy security and resilience to
a variety of threats, innovation and technology improvements to meet these policies have shifted into a
higher gear. Some examples of trending solutions to meet the national call to increase security and
resilience are highlighted below. One of the most notable innovations areas is in the types of generation
sources that are entering the market. Figure 2 below provides a snapshot of source generation trends from
January, 2001–April, 2016. Table 1 below provides a snapshot of how investment and management
responsibilities vary by system type owner/operator.
Figure 2. Components of the U.S. Electricity Grid
Caption: The electricity system includes four physical components (generation, transmission, distribution, and end use
consumption) as well as the information infrastructure to monitor and coordinate the production and delivery of power and
operate the grid. Source: Argonne National Laboratory.
4
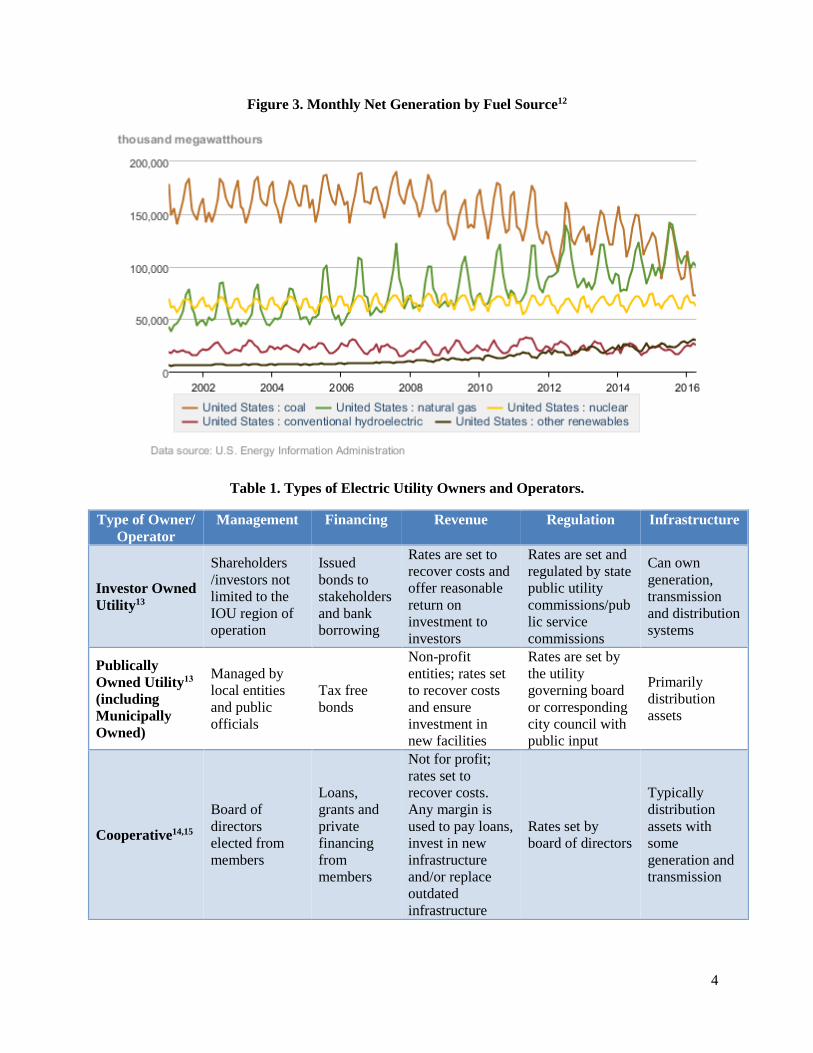
Figure 3. Monthly Net Generation by Fuel Source12
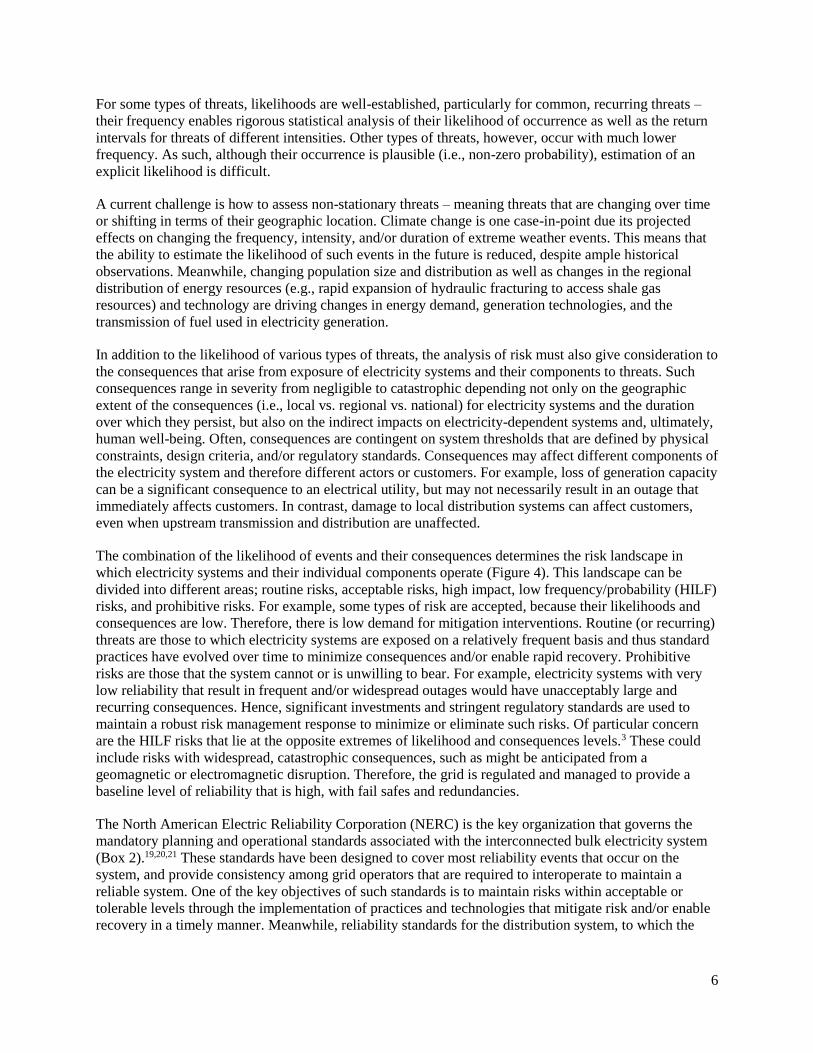
Table 1. Types of Electric Utility Owners and Operators.
Type of Owner/
Operator
Management Financing Revenue Regulation Infrastructure
Investor Owned
Utility13
Shareholders
/investors not
limited to the
IOU region of
operation
Issued
bonds to
stakeholders
and bank
borrowing
Rates are set to
recover costs and
offer reasonable
return on
investment to
investors
Rates are set and
regulated by state
public utility
commissions/pub
lic service
commissions
Can own
generation,
transmission
and distribution
systems
Publically
Owned Utility13
(including
Municipally
Owned)
Managed by
local entities
and public
officials
Tax free
bonds
Non-profit
entities; rates set
to recover costs
and ensure
investment in
new facilities
Rates are set by
the utility
governing board
or corresponding
city council with
public input
Primarily
distribution
assets
Cooperative14,15
Board of
directors
elected from
members
Loans,
grants and
private
financing
from
members
Not for profit;
rates set to
recover costs.
Any margin is
used to pay loans,
invest in new
infrastructure
and/or replace
outdated
infrastructure
Rates set by
board of directors
Typically
distribution
assets with
some
generation and
transmission

5
Table 2 below shows the national annual trends in generation by source between April, 2015 and April,
2016 as reported in the most recent release of the EIA’s, Electric Power Monthly.
Table 2. Annual Trends in Generation by Source
(April 2015 to April 2016) [Thousand Megawatt hours]
Generation Fuel April, 2016 Capacity Change since April, 2015
Coal 278,963 -24.2%
Natural Gas 311,825 6.7%
Nuclear 204,323 1.0%
Hydro 76,950 6.5%
Non-hydro Renewables 87,044 22.9%
Petroleum 3,417 -58.5%
The expansion of the electric generation portfolio can increase the resilience of the system by broadening
the sources of available generation as well as transitioning the structure of the market from large,
centralized generation to smaller, decentralized generation options. The decentralized model provides for
greater flexibility in the event of disruptions as well as potentially reducing the time needed for recovery
as disruptions might be more localized. One example of potential distributed generation sources is the
influx of renewables.16
There are number of other avenues that can be taken to increase the resilience of the electric grid. Recent
major disasters have highlighted the need for more opportunities and approaches for resilience such as
hardening, smart grid components, capacity growth, and new policies and regulations, especially in
market structures. States such as New Jersey and New York, which were severely impacted by
Superstorm Sandy, have started initiatives such as “resilience banks.” Resilience banks, such as the New
Jersey Energy Resilience Bank, will offer low-interest loans in to finance energy resilience enhancements,
offsetting the high costs of resilience options for critical energy infrastructure. The remainder of this
document will explore not only the types of threats to the infrastructure, but also the key opportunities and
technology options that could be used to address one or more of those threats.
3. FRAMING ELECTRICITY SECTOR RISK AND RESILIENCE
The energy sector is accustomed to framing threats to the electricity in the language of risk, which is often
expressed as the interaction between the likelihood of an event occurring and the severity of its
consequences.17 A number of criteria influence the assessment of risk:18
Probability of occurrence – How frequently are threats and/or consequences experienced?
Extent of damage – How critical and/or costly are the consequences?
Uncertainty – How much confidence can be associated with estimates of risk?
Geographic extent – Over how large an area are consequences experienced?
Persistence – Over what duration are consequences experienced?
Delay – What is the latency between the threat and the consequence?
Reversibility – To what extent and/or how quickly can affected systems recover?
Social impact – What is the potential for damage to human and societal well-being?
Risk assessment and management for the electricity sector often hinge on a number of these dimensions.
6
For some types of threats, likelihoods are well-established, particularly for common, recurring threats –
their frequency enables rigorous statistical analysis of their likelihood of occurrence as well as the return
intervals for threats of different intensities. Other types of threats, however, occur with much lower
frequency. As such, although their occurrence is plausible (i.e., non-zero probability), estimation of an
explicit likelihood is difficult.
A current challenge is how to assess non-stationary threats – meaning threats that are changing over time
or shifting in terms of their geographic location. Climate change is one case-in-point due its projected
effects on changing the frequency, intensity, and/or duration of extreme weather events. This means that
the ability to estimate the likelihood of such events in the future is reduced, despite ample historical
observations. Meanwhile, changing population size and distribution as well as changes in the regional
distribution of energy resources (e.g., rapid expansion of hydraulic fracturing to access shale gas
resources) and technology are driving changes in energy demand, generation technologies, and the
transmission of fuel used in electricity generation.
In addition to the likelihood of various types of threats, the analysis of risk must also give consideration to
the consequences that arise from exposure of electricity systems and their components to threats. Such
consequences range in severity from negligible to catastrophic depending not only on the geographic
extent of the consequences (i.e., local vs. regional vs. national) for electricity systems and the duration
over which they persist, but also on the indirect impacts on electricity-dependent systems and, ultimately,
human well-being. Often, consequences are contingent on system thresholds that are defined by physical
constraints, design criteria, and/or regulatory standards. Consequences may affect different components of
the electricity system and therefore different actors or customers. For example, loss of generation capacity
can be a significant consequence to an electrical utility, but may not necessarily result in an outage that
immediately affects customers. In contrast, damage to local distribution systems can affect customers,
even when upstream transmission and distribution are unaffected.
The combination of the likelihood of events and their consequences determines the risk landscape in
which electricity systems and their individual components operate (Figure 4). This landscape can be
divided into different areas; routine risks, acceptable risks, high impact, low frequency/probability (HILF)
risks, and prohibitive risks. For example, some types of risk are accepted, because their likelihoods and
consequences are low. Therefore, there is low demand for mitigation interventions. Routine (or recurring)
threats are those to which electricity systems are exposed on a relatively frequent basis and thus standard
practices have evolved over time to minimize consequences and/or enable rapid recovery. Prohibitive
risks are those that the system cannot or is unwilling to bear. For example, electricity systems with very
low reliability that result in frequent and/or widespread outages would have unacceptably large and
recurring consequences. Hence, significant investments and stringent regulatory standards are used to
maintain a robust risk management response to minimize or eliminate such risks. Of particular concern
are the HILF risks that lie at the opposite extremes of likelihood and consequences levels.3 These could
include risks with widespread, catastrophic consequences, such as might be anticipated from a
geomagnetic or electromagnetic disruption. Therefore, the grid is regulated and managed to provide a
baseline level of reliability that is high, with fail safes and redundancies.
The North American Electric Reliability Corporation (NERC) is the key organization that governs the
mandatory planning and operational standards associated with the interconnected bulk electricity system
(Box 2).19,20,21 These standards have been designed to cover most reliability events that occur on the
system, and provide consistency among grid operators that are required to interoperate to maintain a
reliable system. One of the key objectives of such standards is to maintain risks within acceptable or
tolerable levels through the implementation of practices and technologies that mitigate risk and/or enable
recovery in a timely manner. Meanwhile, reliability standards for the distribution system, to which the

7
majority of outages can be attributed, are established at the state level and overseen by state public utility
commissions. Therefore, NERC standards do not apply to equipment on this part of the system.
Figure 4. Conceptual Model of the Risk Landscape
Caption: The risk landscape is formed by the interaction between the probability of threats and their consequences.18 These
axes define different classes of risks that reflect different combinations of probability and consequence.
The persistence of risks experienced by the electricity system is another important consideration. Acute
risks are relatively short in spatial and temporal extent, but can be associated with significant
consequences. For example, hurricanes often cause damage to electricity systems in a short duration. In
contrast, chronic events – those that manifest and persist over long periods of time – may have only
modest, short-term impacts, but their cumulative effects can be quite large. For example, drought
conditions that affect electricity generation of hydropower facilities can become chronic risks –
generation continues, but the loss of generation capacity results in financial losses that continue to accrue
until drought subsides.
In the context of a technologically developed society, the presence of power is taken for granted.
Society’s vulnerability (in terms of possible disruption of established standard of life) is very high, due to
the extreme dependence on electricity. From a defense/national security perspective, this dependence
constitutes an “asymmetric” vulnerability when looking at possible conflicts with adversaries that are not
based in a technologically developed country. With exception of highly secured military system where it
is assumed that local generation can be provided as long as needed, the ability to sustain power failures
without appreciable damages/consequences is very limited. For domestic households power is preferably
restored in hours; for loads with their own uninterruptible power supplies, such as hospitals, the time may
stretch to a few days. Failing complete restoration of power, a staggered power dispatch (with controlled
blackout) can at least temporarily provide a way to limit consequences.

8
Consistent with the general definition of resilience (Section 1), a resilient grid system is associated with a
number of specific characteristics:
Resourcefulness: in practice this could be applied to the power transmission and distribution
system by implementing a constant monitoring and optimized dispatching and/or load shedding to
respond to anomalies. For example, if a critical transmission line is lost, power might still be
delivered by temporarily overloading parallel/alternative routes and monitoring conductor
temperature and time of overload conditions.
Redundancy: over-engineering critical systems to be able to function, at least at a reduced level,
in critical conditions.
Restoration: coordination and integration among stakeholders of restoration efforts, plans
optimized for a variety of scenarios to avoid the need of improvising a solution during critical
conditions. Sharing best practices among different organizations (from local to global, nation-
wide) and practicing simulated emergencies should be mandated and coordinated at the national
level. This sharing should include mutual assistance programs and their resources (personnel,
equipment, parts) during the restoration phase.
Each type of risk is associated with different risk management interventions to maintain or enhance
various elements of resilience in the face of different types of threats. The principle value of assessing and
characterizing risks to the electricity system is to guide decision-making on the prioritization of risk
management options that can enhance resilience. Such options can target the robustness element of
resilience, often focusing on specific components of the electricity system (Figure 1). For example, the
siting of electricity generation facilities is often informed by understanding of the geographic distribution
of natural hazards (e.g., floods, seismic). Infrastructure hardening can make transmission and distributions
systems more robust to storm events. Deployable flood defenses can help protect facilities from flood
water in the event of a significant flooding event. Such interventions can be cost-effective, particularly for
recurring risks that can be anticipated.
Box 2. Existing Reliability Performance Requirements for the Bulk Electric System
The North American Electric Reliability Corporation (NERC) has specific requirements that all
owners and operators of the bulk electric system must follow. These requirements are based on a set
of contingency analyses that evaluate the system response given a range of contingencies associated
with loss of specific elements within the system. The planning standards were updated in 2013 to
accommodate seven levels of contingencies and the acceptable system response:
0. No contingency, normal system
1. Single contingency, normal system. Loss of a generator, transmission circuit, transformer,
etc.
2. Single contingency, normal system. Loss of a line section, bus fault, circuit breaker fault, etc.
3. Multiple contingency, loss of generator unit followed by system adjustments.
4. Multiple contingency, loss of multiple elements caused by a failure to clear the initial fault
5. Multiple contingency, delayed fault clearing due to the failure of non-redundant protection
6. Multiple contingency, two overlapping single contingencies
7. Multiple contingency, common structure (e.g., two adjacent circuits on a common structure)
The standard also specifies penalties for noncompliance with various aspects of the standard.

9
Other types of risk management options are “hazard agnostic”, in the sense that they can be implemented
independent of the threat to which the electricity system is exposed. Much of the investment in grid
modernization, for example, has the goal of enhancing overall reliability and flexibility of the system
(Figure 1). The effect is often to accommodate emerging technologies, such as distributed, renewable
generation, and at the same time to reduce the likelihood of disruption when exposed to threats. For
example, flexible load generation and dispatching can automatically adjust to changes in system demand.
Programs for automatic under frequency load shedding are used to balance generation and load when a
large disruption triggers a drop in frequency. Because such options can provide benefits for a broad range
of threats they help provide resilience to threats that are difficult to anticipate.
4. ENVIRONMENTAL AND HUMAN THREATS TO THE ELECTRICITY SECTOR
The U.S. electricity system is exposed to a broad range of threats that manifest over different spatial and
temporal scales. Some, like extreme weather events, earthquakes, or geomagnetic disturbances are natural
phenomena, the occurrence of which is beyond the control of humans. Such natural threats have been a
key focus of planning efforts.22 The most frequent power outages tend to have localized effects that
impact a small number of customers (e.g., resulting from damage to distribution systems caused by trees
falling on distribution lines). Damage to the transmission system results in more widespread major power
outages that affect large numbers of customers and large total loads. Utilities must report events that
affect more than 50,000 customers and 300 MW to NERC.23
Table 3 summarizes 2014 bulk power emergencies and disturbances by cause as well as the number of
customers affected when known. Severe weather and wildfire events accounted for 90 of the events listed
in the disturbance reports. For 67 of those, the number of affected customers is known. By comparison,
76 events were caused by human action such as physical attacks and cyber attacks, but the number of
customers affected by these events is unknown.
Although electric utilities have long prepared for specific hazards, they may not be fully prepared to
address new and existing hazards that evolve over time. Cyber threats are an example of an evolving
threat. New cyber threats may increase the vulnerability of specific components and operations for
utilities. As discussed below, climate change also will cause some risks to evolve over time.
This section presents what is known about the various established and emerging threats to the electricity
system including historical and future trends as well as the predictability of different threats, which has
important implications for threat mitigation and resilience. This information is summarized in Table 4,
based on the subsequent discussion in the text.

10
Table 3. Electric Emergency and Disturbance Events (2014)
Event Type Number of Events
Events Where
Number of Affected
Customers is Known
Average Number of
Customers Affected
Severe Weather 87 64 149,702
Physical Attack 73 0 -
Fuel Supply Emergency 17 1 140,000
Electrical System
Separation (Islanding) 14 4 1,000,092
Public Appeal 8 2 61,400
Cyber Attack 3 0 -
Wildfires 3 3 933,475
Voltage Reduction 3 0 -
Load Shedding 2 2 27,428
Distribution Interruption
(Unknown cause) 1 1 75,000
Earthquake 1 1 70,000
Operational Failure 1 1 6,549
Uncontrolled Loss 1 1 1 Source: Energy Information Administration (OE-417)24
4.1 NATURAL/ENVIRONMENTAL THREATS
Many of the exogenous threats routinely encountered by the electricity system are natural in origin and
can be attributed to weather (both on Earth and in space) or wildlife and vegetation that come in contact
with system components. As mentioned above, weather is by far the most common and potentially severe
naturally-occurring threat. Analysis of weather-related outages indicates that abnormally high wind
conditions are one of the most significant factors driving outages, and overall, weather-related outages are
increasing over time. This section therefore starts by discussing what is known about weather-related
threats before proceeding to discuss other threats associated with the natural environment.
4.1.1 Hurricanes and Extreme Winds
Experience with U.S. land falling hurricanes over the past decade has revealed the vulnerability of the
electric grid to their effects, and the effects of high winds in general. High-speed winds primarily knock
over trees, especially when the ground is already saturated with water from rainfall or flooding. Fallen
trees can damage or down distribution power lines, resulting in power outages.25 As the wind speed
increases, distribution system asset damage becomes more widespread, system performance is degraded
and, eventually, large areas and high percentages of customers may experience power outages. High
winds can also damage components at the transmission level of the electric power system, denying
service to distribution substations.

11
Table 4. Summary of Key Threats to the Electricity System
Caption: The table above provides information on observed or projected trends in natural/environmental and human threats
to the U.S. electricity system. Notes and references for specific events are listed in Appendix A. The predictability of each
threat is also indicated over the short-term (i.e., hours to days) and long-term (months to years).

12
Other wind events, such as the June 29, 2012 “super derecho” storm that affected the Midwest and mid-
Atlantic regions, can create similar impacts and disrupt power to millions of people. Tornadoes generally
create a narrow path of destruction and do not cause widespread power outages, but if a tornado passes
close to a major transmission substation or transmission corridor, the localized damage to the
transmission system could lead to widespread power outages. A number of organizations have presented
options for mitigation, preparedness, recovery, and response, including:
Improving reliability and resilience through efforts such as strengthening distribution poles and
wires, improving flood protection, managing vegetation, and burying distribution lines, where
feasible. 26,27
Increasing system flexibility and robustness through energy storage or creation of microgrids.
Grid modernization, smart meters, and synchrophasor technology can enable faster recovery from
hurricane damage.26,27,28
Seasonal predictions of hurricane activity are based one or more of three basic methods:29 statistical
methods that attempt to correlate seasonal hurricane activity with predictors such as sea surface
temperature, analog methods that attempt to find a previous year with similar atmospheric conditions, or
dynamical methods that used reduced models of the atmosphere-ocean system to predict the future state
of the system and its hurricane activity. NOAA’s Climate Prediction Center (CPC) releases an annual
prediction for the severity of the hurricane season that incorporates all three methods.30 Researchers from
Colorado State University (CSU) also release extended range forecasts for the number of Atlantic
hurricanes expected and the general hurricane activity in the upcoming season. The CSU model is
primarily statistical. It analyzes a variety of different atmosphere and ocean measurements (through May)
that are known to have long-period statistical relationships with the upcoming season’s Atlantic tropical
cyclone activity to predict the intensity of the hurricane season.31 SCOR, a global reinsurer, evaluated the
forecasts of CPC and CSU and found that, while the forecasts were an improvement over using the long-
term average of hurricane activity, each exhibited strong deviations from actual activity limiting the
usefulness of these seasonal forecasts.
To predict the track and intensity of an individual local hurricane, NOAA now uses unmanned aircraft to
deploy dropsonde sensors to gather data on wind speed, wind direction, and pressure.32 New technologies,
such as the unmanned aircraft and a new Doppler Wind Lidar system, are increasing the accuracy of
NOAA forecasting for hurricane landfall and intensity. Forecast errors in track location have decreased
significantly since 1970; the 72-hour forecast has an annual average track error of 125 miles. The 24-hour
forecast has an annual average track error of 50 miles.33
U.S. Tornadoes issues a long-range tornado outlook34 that extends out several months. At this prediction
time scale, the forecast is primarily based on analog methods that focus on large scale weather patterns
such as the El Niño-Southern Oscillation (ENSO), Pacific Decadal Oscillation (PDO), and Atlantic Multi-
decadal Oscillation. As with long-range hurricane forecasting these methods provide very limited forecast
skill and are not very useful for assessing annual risk to the power systems. In contrast with hurricanes,
tornadoes form and dissipate rapidly. There is little to no ability to predict the location and intensity of a
tornado. Conditions favorable for formation may be seen a day ahead, but actual formation may only be
known less than one hour ahead.
It is unlikely that seasonal forecast for hurricanes or tornados will improve significantly in the near future.
Research investments in numerical weather forecasting will likely reduce the forecast uncertainties for
individual hurricanes, which will enable better response planning and resource prepositioning for the
post-hurricane recovery. Uncertainty in hurricane track and intensity will still be present, and power
system real-time impact modeling should be improved to incorporate these factors. Finally, forecasting

13
individual tornados is unlikely to provide sufficient lead time to enable any coordinated response planning
from electrical utilities.
Climate change may increase the risk of power outages caused by hurricanes from increased intensity,
frequency, and duration. Other trends in severe storms, including the intensity and frequency of
tornadoes, hail, and damaging winds, are uncertain and understudied.35
Preparing for severe weather events requires a balanced process. It is not economical to build
transmission and distribution systems that can withstand every extreme, but infrequent, weather event.
Developing rapid restoration capabilities can be more appropriate. It is important to balance increased
system hardening with provisions for faster restoration.36
4.1.2 Drought
In 2013, 7% of the electricity generated in the United States was from hydroelectric resources.37 Low
rainfall reduces the availability of hydroelectric resources, particularly in the western United States. For
example, in 2014, California experienced its worst drought in 119 years.38 Consequently, hydroelectric
generation for June 2014 was only 58% of the 10-year average.39 In addition, annual temperature profiles
can impact the timing of water availability.40 A rapid snowpack thaw in the spring can overload reservoir
capacity and lead to lost energy normally available later in the year.
Drought decreases the cooling water availability for steam plants and can lead to plant de-rating because
of low water levels, low flow rates, or high water temperatures in rivers and reservoirs. Examples include
the drought in Texas in 2011, which reduced the cooling water available to power plants by 30%.41 A
recent study42 simulated the weather experienced during the U.S. Dust Bowl disaster between 1930 and
1934. Generation-capacity losses for California, Arizona, and Texas under such drought conditions would
be 17%, 25%, and 30%, respectively. Further, a study of droughts in the southwestern region of the
United States over a 1,200-year period indicates that during a 12th century drought, temperatures were
higher and precipitation was lower than any drought experienced during the past two centuries.43 Non-
thermoelectric power plants, such as many natural-gas-fired combustion turbines, do not use water for
cooling, but they still require water for other purposes, such as improving turbine performance on non-
thermoelectric natural gas plants and for housekeeping activities.44,45
NOAA and other weather organizations use the ENSO pattern to predict seasonal climate patterns such as
an unusually dry season.46 The U.S. Drought Monitor, run by the University of Nebraska Lincoln,
releases weekly estimates of drought severity in the U.S.47 A major gap relative to drought and it impact
on power is the accuracy of long-range predictions of drought and water availability. Climate change is
expected to alter the frequency and severity of drought conditions, but the results still carry significant
uncertainty. Current projections indicate that the Southwest United States will be impacted by increasing
drought conditions.35 Figure 5 shows how precipitation could change by season by the end of the century.
Other power plants in the region will need to increase power production to make up for reduced
hydropower generation potentially leading to additional transmission congestion.

14
Figure 5. Projected Change in North American Seasonal Precipitation
for 2071-2099 (compared to 1970-1999)
Caption: Projected changes in seasonal precipitation as simulated by an ensemble of general circulation models for a high
emissions scenario (the Special Report on Emission Scenario’s A2 scenario). Source: Walsh et al. (2014).48
Replacing water-cooled power plants with air-cooled power plants that do not rely on water for cooling
can mitigate drought’s impacts; other mitigation options include prioritizing low- or no-water cooling
options for new generators and setting strong guidelines for power plant water use.49 (Note: Air-cooled
plants may operate a reduced output during periods of high temperatures.) Western Resource Advocates
recommends that utilities and regulators consider future water use during planning exercises.50

15
4.1.3 Winter Storms, Ice, Extreme Cold
During an extreme cold weather event, the demand for natural gas increases and puts stress on natural gas
pipeline operations. Natural gas-fired electric power generators typically hold interruptible gas
transmission contracts. The extreme cold may cause gas pipeline customers with firm transmission rights
(e.g. local distribution companies (LDCs)) to require full delivery of the natural gas allowed by their
right. If the gas pipeline is physically unable to deliver gas to the interruptible contracts held by electric
power generators, these generators are de-rated or shut down. The stress on the electrical grid created by
the loss of generation may be compounded by high electrical demand created by the extreme cold. The
threat and potential impact of these extreme cold scenarios is being amplified by the increasing reliance
on natural gas generation,51 raising concerns about the ability to maintain electric system reliability during
these events.52
Electric generation capacity may be lost though other effects of extreme cold. NERC has issued reports
on eleven severe cold weather events that have significantly impacted the electric power system since
1983.53 In addition to natural gas supply issues, generation capacity may be reduced due to generating
unit trips, de-rates, or failures to start.53 Frozen coal piles, fuel oil delivery, and cold temperature impacts
on sulfur hexafluoride (SF6) and air blast circuit breakers have resulted in generator outages and
unavailability.53 Liquefaction of SF6 occurs between -10°F and -30°F, depending on the density of the
SF6; this liquefaction can cause circuit breakers to mis-operate. In locations where temperatures fall
below –10°F, a supplemental means to maintain the SF6 above -10°F must be provided.
Power outages caused by extreme cold conditions may also cascade through the both electrical and
natural gas systems. For example, during a severe cold weather event in New Mexico in February 2011,
frozen sensing lines caused many generators to automatically trip offline due to faulty readings from
transmitters.54 The resulting power outages disabled electric-power gas compressors on well gathering
lines, which limited the delivery of natural gas to New Mexico.54
NOAA and other weather organizations use the ENSO pattern and other atmospheric and oceanic analog
conditions to predict seasonal climate patterns, including the likelihood of below normal temperatures.55
Although these forecasts provide expected general trends, they have limited utility in planning for
extreme cold temperature events.
The NOAA Weather Prediction Center (WPC) releases a WPC Probabilistic Winter weather forecast.56
The maximum duration for the forecast is 72 hours prior to the event. The National Weather Service
Storm Prediction Center also releases a 4-to-8 day severe weather outlook that indicates severe and
unusual weather conditions that may occur. These forecasts provide electrical grid operators sufficient
warning to prepare their systems using the short-term mitigations discussed below.
Extreme cold temperatures are rare and forecasting natural gas and electrical demands are challenging.
Even when the forecasts of extreme cold temperatures are accurate, errors in forecasting of natural gas
and electrical demand can lead to overly conservative planning or unresolved system risk. Improvements
in this type of forecasting can improve coordinated system operations during these extreme events.
Short-term mitigations for extreme cold include winterizing generators, cancelling scheduled generation
and transmission outages, reviewing generator fuel procurements, committing additional generator units,
demand response to reduce load, coordination with neighboring utilities to maximize the benefit of
electricity imports and exports, and operational coordination and information sharing with gas pipeline
operators.57

16
Longer-term mitigations for extreme cold weather include encouraging natural gas-fired generators to
purchase firm transmission rights to guarantee the availability of fuel. Alternatively, ISO New England
has started a Winter Reliability Program to provide incentives to non-gas-fired generators (e.g. fuel oil-
fired) to secure fuel and perform maintenance before winter.58
Ice accumulation adds weight to power lines and increases the cross sectional area for wind drag on the
lines leading to increase mechanical stress and breakage of power lines and support structures. 59 Similar
effects are experienced by nearby trees leading to greatly increased occurrence of trees and branches
falling on power lines. This type of damage is most prevalent in distribution systems, but may be
experienced by transmission lines as well. In many respects, the damage is similar to that caused by high
winds during hurricanes and the outcomes are similar (Section 4.1.1).
Similar to extreme cold weather, NOAA and other weather organizations use ENSO and other
atmospheric and oceanic analog conditions to predict seasonal climate patterns, including the likelihood
of winter precipitation.55 However, these forecasts do not distinguish between snow and freezing rain and
have limited utility in planning for ice storms.
The NOAA WPC releases a Probabilistic Winter Precipitation Guidance forecast for snow and freezing
rain.56 The maximum duration for the forecast is 72 hours prior to the snow/ice event. NOAA also uses a
Short Range Ensemble Forecast (SREF) derived winter weather impact graphics to show forecasted
accumulation on roads, surface visibility, and rate (intensity) of winter precipitation.60 The National
Weather Service Storm Prediction Center also releases a 4-to-8 day severe weather outlook that indicates
severe and unusual weather conditions that may occur. These forecasts provide sufficient warning for
distribution utilities to preposition equipment and crews and to plan for requests for mutual aid to speed
post-storm restoration.
Mitigation of ice storms includes two basic utility procedures; tree trimming and system hardening.
Aggressive tree trimming, including ground-to-sky approaches, greatly reduce the possibility of ice-laden
trees and branches from falling on distribution lines. System hardening may including undergrounding of
overhead lines, replacing existing pole and crossbars with stronger components, adding additional guying
to dead-end structures and other poles to prevent breakage and cascading mechanical failures, and
upgrading conductors with heavier wire.61
4.1.4 Extreme Heat and Heatwave
Summers are longer and hotter and extended periods of unusual heat are lasting longer.35 Most utilities
experience peak demand during extended heat waves; these high demands stress the existing electric
power infrastructure. On the demand side, a severe heat wave increases air-conditioning load significantly
driving up the entire system load curve, with the largest increases during the mid- to late-afternoon peak
hours.62 Cooling degree days have already increased in the U.S. by roughly 20 percent over the last few
decades, and this trend is projected to continue in the future.63,64 On the supply side, high ambient
temperature conditions have an impact on combustion turbines (CTs) because of the reduced density of
the air at higher temperatures. Unless inlet cooling technologies are used, the output capacity of a CT
decreases because the efficiency of converting fuel to power also decreases.65,66 Extreme heat can lower
thermal limits of transmission lines and transformers.67,68
NOAA and other weather organizations use the ENSO pattern and other atmospheric and oceanic analog
conditions to predict seasonal climate patterns, including the likelihood of above normal temperatures.55
Although these forecasts provide expected general trends, they have limited utility in planning for
extreme high temperature events.

17
In addition to normal weather and temperature forecasting, the NOAA Climate Prediction Center releases
probabilistic outlooks of temperature hazards.69 The maximum duration for the forecast is 14 days prior to
the event. These forecasts provide electrical grid operators sufficient warning to prepare their systems
using the near-term mitigations discussed below.
Extreme hot temperatures are rare and forecasting electrical demands are challenging. Even when the
forecasts of extreme hot temperatures are accurate, errors in forecasting of electrical demand can lead to
overly conservative planning or unresolved system risk. Improvements in this type of forecasting can
improve coordinated system operations during these extreme events. Climate change is projected to
significantly increase the frequency, intensity, and duration of extreme heat events (Table 4).
Short-term mitigations for extreme hot temperatures include cancelling scheduled generation and
transmission outages, committing additional generator units, demand response to reduce load, and
coordination with neighboring utilities to maximize the benefit of electricity imports and exports. Longer-
term mitigations for extreme hot weather include installation of inlet cooling equipment on gas
combustion turbines and combined cycle power plants. There are approximately 90 plants with inlet air
cooling across the entire United States, compared to a total of about 1,500 combustion turbines in the
Eastern Interconnection alone.70
4.1.5 Inland and Coastal Flooding
In the transmission and distribution system, substations are the elements most vulnerable to flooding.
Flooding damages ground-level substation control equipment and low-voltage switchgear. High-voltage
components, including insulators, circuit breakers, air-break switches, transformers, dead-end towers,
lightning arrestors, and metering transformers are situated high aboveground to use air space for
insulation from surrounding ground faults; therefore, flooding is less directly threatening to the high
voltage power system components.71 As a rule of thumb, facilities located in areas with more than four
feet of floodwater will likely be out of service and could sustain damage to transformers and circuit
breakers. (Note: Substations are usually built above grade.)
If floodwaters do not damage the transmission and distribution systems, then crews can restore these
systems shortly after the floodwaters recede. The utilities in the area may also reconfigure the distribution
networks to bring in power from other unaffected distribution substations. This would be done on a case-
by-case basis because of engineering limitations on individual networks (i.e., loading levels and voltage
issues). Crews can repair or replace damaged distribution system components as the area becomes
accessible. The restoration time for damaged transmission-level components, specifically high-voltage
transformers at individual substations, could be months.72 The repair time for high-voltage equipment
depends upon the availability of replacement parts. Specialized transformers would take the longest time
to replace, as spare parts are not readily available (see also Section 4.2.1).
The National Weather Service provides Spring Hydrological Outlooks that include the probabilities of a
range of flood severities.73 The National Weather Service (NWS) 73 and the U.S. Geological Survey
(USGS) 74 also provide short-term flood monitoring and forecasting. Both monitor the amount of rainfall
occurring in conjunction with the rate of change in the affected river stage. The USGS releases a daily
map of flood and high flow conditions within the United States. The estimates are measured in percentiles
of estimated streamflow. The series of maps also include real-time streamflow gauge data which also
forecasts estimate flood stage.
Climate change may increase the risk of flooding, but the results still carry significant uncertainty.
Coastal flooding caused by hurricane storm surge may be more severe due to higher sea levels (Table 4).
Extreme rainfall events are also becoming more common across most parts of the United States,

18
increasing the risk of flooding. As a result, many areas may experience flooded streets more regularly
during high tides and storms.35
Flood protection for substations is part of recommended “hardening” investments.75 Hardening includes
elevating or building berms around substations and relocating facilities. Undergrounding of wires to
harden them against other threats make them more vulnerable to flooding than overhead wires.1,76 Many
utilities use submersible equipment in flood prone areas to maintain electric power reliability. While
system redundancy could prevent power disruptions during a flood, it is possible that flooding could
cause partial loss of power that might extend beyond the inundation area. Electric power utilities
operating in flood-prone areas have developed planning guidelines based upon experience.
4.1.6 Wildfire
Wildfire events pose a threat to the electricity system, particularly due to the exposure of high voltage
transmission lines. Wildfires can trigger emergency line de-rating or shut-downs to prevent line damage.
Smoke from wildfires can induce a line fault, resulting in a loss of service.77 Recent years have witnessed
damage and disruption to electricity transmission due to large fires.2 Alternatively, transmission may be
cut to maintain the safety of emergency personnel operating in the area. Penetration of wildfires into
residential and/or commercial areas can also expose electricity distribution systems and substations, and
wildfires have also disrupted generation facilities. A California wildfire in 2015 damaged five facilities
associated Calpine Corporation’s The Geysers – the world largest geothermal infrastructure.78
Historical fire regimes are undergoing change due to larger patterns of climate change (Table 4). While
the absolute number of fires across the U.S. has not increased over the past fifty years, the total area
burned has increased markedly (Figure 6). This is associated with a lengthening of the fire season.48
Climate change is projected to further increase the likelihood of major fires in the future due to continued
lengthening of the fire season as well as projected increases in drought conditions (Table 4; see also
Section 4.1.2).48 Predicting wildfires requires understanding sources of ignition, the spatial and temporal
distribution of fuel loads, weather conditions, as well as fire management practices. Generally,
understanding of the spatial distribution of wildfire hazards is well-documented based on historical
events, land use, and U.S. climatology. Furthermore, the various factors that increase the risk of
significant wildfire events (e.g., drought, low humidity, high winds, high temperatures) can be monitored
and forecast with lead times of days to months.79 However, due to the stochastic nature of fire ignition,
such forecasting tools do not necessarily translate into a reliable forecast of a discrete wildfire event of a
specific size in a specific location.
Wildfire risks to electricity systems can be mitigated through wildfire management planning as well as
vegetation control planning. Removing vegetation in close proximity to transmission and distribution
lines and poles as well as substations and generation infrastructure can reduce the likelihood of direct
impacts on electricity assets during wildfire events. This can be facilitated by manual clearing or by
prescribed burns. In addition, during wildfire events, fire suppression efforts can target critical
infrastructure such as electricity system assets and, in some cases, protective measures such as fire
resistant coatings can be applied to power poles to reduce burn risk.

19
Figure 6. Historical Trend in U.S. Wildfire Frequency and Area (1960-2015)
Data Source: National Interagency Fire Center.80
4.1.7 Sea-Level Rise
Climate change and the associated warming of the oceans and melting of glaciers and ice sheets are
contributing to a global increase in sea level. Globally, sea levels have increased by approximately 8
inches since records began in the 1880s.48 This sea-level rise poses a potential threat to energy
infrastructure in the coastal zone through two possible pathways. First, the chronic increase in sea level
can potentially result in the permanent inundation of coastal land areas, some of which are associated with
electricity infrastructure.81
Scenarios of future sea-level rise over the 21st century presented in the most recent National Climate
Assessment reflect the uncertainty in projecting future sea level changes. The different scenarios indicate
a range of sea-level rise on the order of 1 to 7 feet by 2100, although model-based projections are more
modest, on the order of 1 to 4 feet (Figure 7).
Analysis of sea-level exposure for four metropolitan areas by DOE indicates that power plants and
substations are both potentially vulnerable to future sea-level rise. However, energy assets that lie in
harm’s way are likely to have significantly depreciated to the point of obsolescence by the time they are
affected by sea-level rise. Hence, the threat posed by chronic increases in sea level over the long-term
may be modest, unless sea-level rise proceeds along the higher range of current scenarios. In this case, the
rate of sea-level rise may be sufficiently rapid to threaten existing infrastructure, necessitate premature

20
retirement of the asset or investments in defenses to avoid inundation. That said, reported increases in
nuisance flooding in coastal communities are already being attributed to sea-level rise.82
Figure 7. Past and Projected Changes in Global Sea Level
Caption: Estimated, observed, and possible future amounts of global sea level rise from 1800 to 2100, relative to the year
2000. Source: Walsh et al. (2014).48
The other pathway by which sea-level rise can threaten electricity assets is through its interactions with
storm surge events associated with tropical cyclones, hurricanes, and nor’easters. Sea-level rise is
projected to increase the depth of inundation associated with storm surges as well as their inland
penetration. This may increase the frequency to which electricity assets are exposed to inundation as well
as the severity of inundation during storm events. The effects of sea-level rise are most significant for
low-intensity hurricanes, due to the change in sea level being relatively large relative to the typical storm
surge. For major hurricanes, sea-level rise has comparatively little additional impact on the anticipated
inundation of existing infrastructure.83
Although future increases in sea level are one of the most robust consequences of global climate change,
uncertainty in the specific magnitude of sea-level rise over different time scales remains a challenge for
both risk assessment and management. Sea level prediction will likely improve over time, resulting in
more constrained estimates of future sea-level rise.
Mitigation of the risks associated with sea-level rise is often categorized into one of three strategies:
protection, accommodation, and retreat.84 Protection measures often involve the use of flood defenses
(i.e., levies and sea walls) in order to prevent flooding of infrastructure and assets. This can be effective
for managing the increases risk of storm surge due to sea-level rise, but may not be suitable for locations
that experience permanent inundation in the future. Accommodation measures include elevating

21
infrastructure to reduce the likelihood of inundation. This may be particularly effective for substations,
but more challenging for large generating facilities. However, where new construction is occurring, the
elevation of sites can be increased to provide additional protection. One of the most robust options for
mitigating against the effects of sea-level rise is through retreat measures84 – siting of infrastructure and
assets in locations that will not be affected by sea-level rise. Siting decisions routinely consider exposure
to potential hazards in order to avoid vulnerable locations. However, retreat options are not feasible for
infrastructure and assets that currently exist, although assets may be allowed to depreciate or be
prematurely retired to reduce investment in assets that are increasingly at risk.
4.1.8 Earthquake
Ground shaking can affect the structural integrity of electric power assets through various modes of
permanent ground deformation: soil liquefaction, lateral spreading, and/or vertical displacement. Records
from past earthquakes indicate that electrical transmission lines are not particularly vulnerable to
significant earthquake damage, but distribution systems, transmission towers, and substation components
located in areas with unstable soil are at risk of damage. Earthquake related damage includes broken
porcelain components, toppled equipment, line failures because of inadequate slack, and leaking gaskets.
Distribution lines are not as vulnerable to earthquakes; however, some damage can occur if trees fall into
wires or poles, platform-mounted transformers topple, or wires tangle.85
Figure 8. The U.S. Geological Survey National Seismic Hazard Map
Caption: The U.S. Geological Survey (USGS) National Seismic Hazard Map of peak ground acceleration exceedance (2% in
50 years) across the United States. Source: USGS (2014).86

22
A damaged electric power asset may continue to operate at a reduced capacity or lose functionality. For
example, if a substation is located in an area that is moderately or severely damaged, it will most likely
lose complete functionality. Based on the configuration of the electric power network and damage to
certain network assets, some areas may experience power outages, because they become disconnected
from the grid, even though assets within these regions are undamaged.
There is no advanced notice before an earthquake occurs, and there may be significant transient effects on
power systems. If an earthquake causes more customer load than generation to go off-line, the generation
surplus will cause the remaining operating generators to spin faster—a situation the system cannot
tolerate. By design, the power system, through the control networks, automatically self-corrects by taking
units offline within minutes of the earthquake event. If an earthquake occurs when there is less demand on
the system, such as in the morning, on the weekend, or in the spring or fall, the reduction in demand
would be much less pronounced making it easier for the systems to ride through the event with less risk of
cascading failures.87
Probabilities for potential future earthquakes can be estimated from historical observational data. The
USGS releases National Seismic Hazard Maps that display probability levels for earthquakes across the
United States (Figure 8).86 The USGS also maintains a real-time map of the latest earthquakes.88
Using the seismic hazard maps, EPRI has performed extensive probabilistic seismic hazard analyses
(PSHA) for many power systems and specific components of power systems. One exemplary EPRI study
calculates probabilistic seismic hazard at nuclear plant sites using peak ground acceleration and the model
of seismicity developed by USGS at each site.89
Disposal of hydraulic fracturing (or “fracking”) wastewater in deep injection wells has created
nonstationary seismic processes that create a great deal of uncertainty around induced seismicity related
to these injections. According to the USGS, this induced seismicity has increased seismic activity in parts
of the United States coincident with fracking operations involving injection wells for wastewater disposal.
Although most fracking areas are not too close to widespread electrical power infrastructure, risks to
specific facilities remain. There is little historical data on induced earthquakes from fracking and, as such,
the uncertainty of these events is high. However, the USGS is now producing a 1-year seismic hazard
forecast for the Central and Eastern United States from Induced and Natural Earthquakes.90
Over the short term, there is no scientifically credible method to predict specific earthquake events.
Hence, given only limited long-term predictive capability, the main mitigation mechanism against
earthquakes is either to not cite critical electrical infrastructure in active seismic zones or to reinforce
facilities or apply strict construction codes within those zones. For known vulnerabilities, utilities should
have plans for replacement of permanently or long-term damaged generation or network transformer
capacity.
4.1.9 Geomagnetic
During geomagnetic disturbances, the magnetic fields at the Earth’s surface produce geo-electric fields
which can drive geomagnetically induced currents (GIC) through grounded transformers and transmission
lines. These quasi-DC currents can saturate transformer cores leading to voltage collapse and/or excessive
heating and failure of a significant number of high voltage transformers. The type of damage to large
transformer could result in long-term, widespread blackouts and also lead to lengthy repairs or
replacements that could take on the timescale of weeks to months.91,92
A solar storm, named the Carrington Event, occurred in 1859. During this event, a solar coronal mass
ejection hit Earth's magnetosphere, creating one of the largest geomagnetic storms on record. This solar
storm is widely regarded as the most extreme space weather event on record. This event occurred before

23
the advent of modern electric power grids, but it induced sparks and currents along telegraph lines. In
1989, a solar storm over North America caused a collapse of the Hydro-Quebec power grid and
oscillations on the Northeast Power Coordinating Council and the Mid-Atlantic Area Council grids,
nearly bringing them down in a cascading collapse. In 2003, a geomagnetic storm caused minor power
disturbances in North America but caused over 50,000 customers in northern Europe and Sweden to lose
electric power service.92 Anecdotal reports of significant auroras indicate that the Carrington event was
not unprecedented in Earth’s history. Historical records of solar events suggest that a reasonable range for
the average return period for an extreme geomagnetic storm is 100 to 250 years.
Over relatively short time-scales, the NOAA Space Weather Prediction Center releases a 27-Day Outlook
of radio flux and geomagnetic indices.93 The SWPC also releases a shorter 3-day forecast and a 30 minute
forecast.94 Although such forecasts can provide early warning that a storm is on the way toward Earth, the
ultimate impact of the event can vary significantly depending on the latitude and orientation of the
charged particles and how they couple with the earth’s magnetic field. Such characteristics are nearly
impossible to predict with precision. Over longer time-scales, the Sun follows a cycle of magnetic activity
reflected by the number of sunspots and the average sunspot area, which waxes and wanes on a time scale
of 9 to 14 years. However, major geomagnetic storms have occurred during solar cycle minimums
making the solar cycle a poor, long-term predictor of GMD occurrence.
Several strategies and designs can mitigate GIC events. These include 1) identifying high priority
facilities and 1) deploying advanced relay technology; 2) installing monitors to measure GIC flow; 3)
installing GIC blockers on vulnerable equipment; 4) protecting transmission lines by using a differential
element; and 5) implementing back-up precise time sources and back-up communications.95 However,
there are also drawbacks to these solutions. Series capacitor banks, which are used primarily for
compensation of transmission lines, can block GIC flow in transmission lines, but they are costly.
Another device utilizes a transformer-neutral blocking mitigation scheme. These devices have been
installed on a limited basis. A properly designed GIC blocking system should greatly improve system
reliability under a GIC event. However, a major concern is the successful operation of a bypass device
around the current limiting component during a system fault condition. Mis-operation of a bypass device
could cause major system issues and failure of key system components, including insulation failure of the
transformer.96
A significant amount of work had been done to understand the impact of GMD and GIC on power
systems97 and commercial software packages now exist for performing planning studies.98 However, a
significant gap that remains is our ability to predict the rate of occurrence of very large GMD events and
to characterize the spatial distribution of the geo-electric field hazard from these events. Some research
has investigated these effects,99 but both effects are critical inputs into a long-term GMD risk assessment.
Also, traditional power system planning models do not including substation grounding or transformer
configuration details. These are crucial to being able to model geomagnetic induced currents in the power
system. Hence, a significant modeling gap currently exists in modeling, and therefore predicting, GMD
risks.
4.1.10 Wildlife and Vegetation
Wildlife and vegetation contact are one of the most common causes of electric system outages reported by
utilities. A 2015 survey of energy utilities indicated that wildlife-related outages associated with the
distribution system exceeded those associated with severe weather.100 In 2005, the annual costs of
wildlife-caused power outages for California alone were estimated to be $32 million to $317 million.101
Wildlife can affect transmission, distribution, and substations. However, incursions of animals into
substations are particularly problematic as faults in substations can cause outages over larger areas.102
Vegetation can also pose a threat, particularly to distribution systems. However, the effects of vegetation
24
are often indirect through their association with weather events (e.g., wind or ice) that lead to falling
branches, trees, or other debris.
Due to their frequency of occurrence, wildlife and vegetation are well-recognized threats that can be
anticipated to routinely impact electricity systems. However, as they tend to be stochastic events, it is not
possible to predict the timing and location of specific outages. The link between vegetation threats and
weather indicates that increased exposure to vegetation impacts can be anticipated when storm events
have been forecast. There is no direct evidence of a future change in the threat of wildlife and vegetation
to electricity systems. However, there may be indirect effects through changes in population and
electricity demand that increase the extent and number of transmission, distribution, and substation
networks. This would effectively increase the exposure of the electricity system to wildlife and
vegetation. In addition, changes in the frequency, intensity, and/or duration of extreme weather due to
climate change could drive indirect increases in vegetation impacts on the electricity system.
Various measures are commonly used to mitigate the threat of wildlife and vegetation to electricity
systems. These include insulation of transmission and distribution lines and connections, using fencing
around substations and keeping sites clear of clutter and debris to deter wildlife, as well as tree trimming
and vegetation clearing programs to keep transmission and distribution lines free.102 The latter has the
additional benefit of reducing access by wildlife to power lines.102
4.2 HUMAN THREATS
4.2.1 Physical Attack
Globally, physical attacks on energy infrastructure have increased significantly in recent years, although
the role of improved reporting versus actual increase in the targeting of infrastructure remains an open
question. Moreover, in the United States, physical attacks on the U.S. electricity system have historically
consisted of small-scale vandalism targeting transmission and distribution systems.103 Most major
transmission substations and lines are located in rural areas and are not staffed. They are often visible
from roads, and substations are generally only protected by fences and intrusion alarms (Box 3). In
contrast, generation stations are typically staffed with more robust and layered physical protection.
Therefore, it is expected that physical attacks will primarily focus on the transmission system
components.
To try to reduce the risk of human sabotage and damage, the NERC has developed standards and
guidelines to address these issues. The NERC reliability standard CIP-014-1 seeks to protect transmission
infrastructure, including substations and control centers, from physical attack.104 Meanwhile, the 2001
NERC document An Approach to Action for the Electricity Sector, version 1.0 identifies a four‐tiered
approach to physical security. An effective program usually encompasses all four of these components:105
Avoidance: Ensure electric power system integrity and availability by promoting the
development and implementation of security policies, standards, and procedures; by use of
outreach programs; and by providing education programs to enhance and maintain appropriate
levels of cyber and physical cyber security.
Assurance: Ensure electric power system integrity and availability by promoting the regular
evaluation of physical and cyber security measures. A sub‐tier component includes the
identification of appropriate levels of risk management.
Detection: Protect electric power systems through monitoring, identification, central reporting,
and analysis of operational, physical and cyber threats and/or incidents. Promote reporting of
threat warnings and threat prevention information back to electricity sector operating regions and
utilities.

25
Recovery: Promote methods for timely investigation of operational, physical or cyber security
incidents and rapid recovery/restoration of services supporting the delivery of electric power
services. Lessons learned from this layer are incorporated into the other tiers.
Within the electric sector, there is little ability to predict when a physical attack on the power system will
occur. However, the rate of physical attack and vandalism in Table 3 indicates that occurrences are not
uncommon.
Without the ability to predict, the main mitigation mechanism is to identity highly critical assets in the
power system and to protect them from physical attack by assessing the vulnerability to physical attack
and hardening transformers and power equipment. Some facilities may warrant security guards to prevent
physical attacks. Real-time monitoring of power disruptions, sparing of critical components, and rapid
repair will assist in quickly restoring power lost due to a physical attack.106
4.2.2 Cyber Attack
Recently, the threat of physical attacks has been accompanied by a growing threat from cyber attacks. To
date, such cyber attacks have generally been a nuisance – while causing local impacts to infrastructure,
they do not necessarily trigger loss of service. Interest in such events is a function of their potential to
have more severe consequences and as a metric of potentially increasing risk of severe attacks. This threat
does not fall in the category of those that can be well-defined statistically, and it reflects a relatively
recent, but growing concern. Its consideration should be part of a more general discussion about physical
security and should be based on a classification of the criticality of the different system of the power grid.
As in most cyber physical systems, cyber vulnerabilities exist in the electric grid (Box 4).107,108,109,110
Cyber threats can be classified as inadvertent (unintentional) or deliberate. An example of an inadvertent
threat is a software upgrade or maintenance intervention that may cause unintentional disruptions to the
electricity supply. Human errors may also cause inadvertent cyber threats. Deliberate attacks increase in
complexity as the actors behind them increase in resources. For example, attacks from individual hacker
are less complex than state-sponsored group attacks. Examples of deliberate types of attacks include:
cross-site scripting, denial of service, distributed denial of service, logic bombs, phishing, passive
wiretapping, Structured Query Language (SQL) injection, Trojan horse, virus, war driving, worm, zero-
day exploit, eavesdropping, and coordinated cyber physical attacks.107,108
Other factors that increase the vulnerability of the grid to cyber attacks are:
Lack of password control: personnel do not protect their passwords, or use easy-to-guess, and or easy
to social-engineer passwords.
Box 3. High-Voltage Transformers as Key Sources of Vulnerability
High-voltage transformers (HVTs) have been a concern for DOE for three reasons. First, failure of a
HVT can cause temporary service interruption and/or cascading failures and damages. Second they are
vulnerable to physical attack and sabotage, both from within and from outside the substation where
they are located. Third, HVTs are difficult to replace due to their large size and their custom
construction, which is largely performed overseas. The NIAC and NERC have highlighted the lack of
excess HVT capacity as a priority for enhancing U.S. electricity system resilience. Hence, a robust
program of “recovery spares” is one option to address this capacity gap. DOE and DHS are
developing a strategy for the utility industry to manage this recognized vulnerability into the future.

26
Bypass of security features: cyber security features are not enabled, default passwords are used, or all
personnel use the same password.
Lack of secure software updates and patches: software patches or updates are not tested to fully meet
security standards, or updates to fix security vulnerabilities are not applied.
Integrity violations: Modifications to data in cyber physical systems are not validated.
Lack of standardization: Different entities and organization use different cyber security standards.
At present there is no way to predict or forecast cyber-attacks to the grid. Since 2009 there have been at
least five instances of cyber vulnerabilities exploited to cause harm on power systems around the world
including Stuxnet in July of 2009 and the attack on Ukraine’s power grid in December of 2015.111 Given
these trends, it is possible to infer that a sophisticated cyber-attack by a nation-state or large terrorist
group on the US critical infrastructure “is only a matter of when, not if”.112
Box 4. Electricity System Vulnerabilities to Cyber Attack
1. Supervisory Control and Data Acquisition (SCADA) were first implemented in the 1970s at a time
when cyber security did not need to be addressed. These legacy systems are used today to collect
data and send control signals in both the bulk power system (generation and transmission) and at
the substation level. They used to rely on dedicated communication links (e.g., phone lines, radio
waves) to send information from local area networks within substations to control centers. Today,
they rely on modern communication infrastructure such as the internet for that same purpose, but
as a consequence are highly vulnerable because they may have hardcoded passwords, backdoors,
passwords in clear texts, lack of strong authentication, and firmware vulnerabilities.
2. Power Plant’s Distributed Control Systems (DCSs) are the systems that perform local control on
large power plants. These systems use programmable logic controllers (PLCs) to perform this
function. PLCs are microprocessor or computer-based devices, and as such, are susceptible to
attacks over the local communication channels to which they are connected, which can cause mis-
operation.
3. Smart Grid refers to the use of information technologies and communications to increase the
reliability, security, and efficiency of the grid while meeting future demand. Because of the
increase use of software-based components with communication capabilities, the risk of cyber
attacks is also increased since they are susceptible to manipulation over those communication
networks, particularly when connected to the internet.
4. Distributed Energy Resources (DERs) are usually not under the jurisdiction of utilities, and are
highly connected to open networks for communication. Because of this, they are not subject to
utilities cyber security standards. They also contain actuators such as smart inverters with
advanced sensing and control capabilities that can be access remotely.
5. Smart Meters use communication channels to send consumer data to utilities. Fraud can lead to
financial risks to utilities and smart meters with disconnect capabilities can be used in a
coordinated attack that could cause large drops in demand resulting in blackouts.
6. Supply Chain vulnerabilities can be found in legacy systems such as SCADA. For instance,
software upgrades may not meet current cyber security requirements, or the system are not
updated periodically enabling zero-day exploit attacks.
7. Corporate Network communication networks can be a vulnerability, because they provide an entry
point to other control networks such as SCADA systems.

27
Recently, the University of Cambridge Centre for Risk Studies and Lloyd’s published a report where a
massive cyber attack is launched in the US.113 The hypothetical scenario takes out over 50 power plants,
affecting 15 states, and the District of Columbia, for a total of 93 million people without power. Though
the report clearly disclaims that it is not a prediction, but a hypothetical stress test scenario, it states that
the scenario is “improbable, [but] technologically possible” and “within the benchmark return period of
1:200 against which insurers must be resilient.” The report also estimates the economic impact would
range between $21.4 billion to $71.1 billion, and it discusses constraints faced by the attackers.113
The Department of Homeland Security has been making efforts to mitigate against cyber attacks to
critical infrastructure which includes the electric grid. One example is the Industrial Control Systems
Cyber Emergency Response Team (ICS-CERT) which conducts cybersecurity and communications
assessments on industrial control systems around the country. ICS-CERT conducted 112 in 2015. A
summary of their findings from last year for the top six weaknesses in industrial control systems is
presented in Table 5. They also offer a cyber security evaluation tool that can be downloaded at no cost to
users.
Table 5. Top Six Weaknesses in Industrial Control Systems in 2015
Area of Weakness Consequence/Risk
Boundary Protection
Cannot detect unauthorized activity in critical systems
Increased risk to critical assets with weak boundaries between ICS and
Enterprise networks
Least Functionality Creates vectors for malicious party access to critical systems.
Rouge internal access could be established.
Authenticator
Management
Unsecured password communications can easily be compromised.
Password compromise could allow trusted unauthorized access to systems.
Identification and
Authentication
Results in lack of accountability and traceability for user actions if an
account is compromised.
Increases difficulty in securing accounts as personnel leave the
organization, especially sensitive for users with administrator access.
Least Privilege
The more authorized users with elevated privileges, the larger the attack
surface for an intruder to steal account credentials with elevated access
rights to access and compromise critical systems.
Allocation of
Resources
Understaffing impedes organization cybersecurity monitoring and response
capability to a critical system cyber incident increasing the potential
impact to the company. Source: NCCIC/ICS-CERT Industrial Control Systems Assessment Summary Report, FY2015114
4.2.3 Electromagnetic
A manmade electromagnetic pulse (EMP) originates from a nuclear detonation or from a directed-energy
weapon. Energy fields resulting from a nuclear detonation at altitudes above 40 kilometers (km) are
referred to as high-altitude EMP (HEMP). A single, high-altitude nuclear burst could subject a large
spatial region that spans much of the continental United States to an electric field with peak amplitude on
the order of a few tens of kilovolts per meter. This is the early-time, E1, component with a decay of 1
microsecond or less.
From the same burst, and following the E1 environment, a more slowly varying and less intense
electromagnetic field is observed on the ground. This is the intermediate-time E2 environment, which has
an electric field strength of several hundreds of volts per meter and a typical duration time of several

28
hundred microseconds. The E1 and E2 waveform components are followed by E3, a low-amplitude, late-
time signal on the order of tens of volts per kilometer. This late-time E3 signal results from geomagnetic
perturbations caused by the high-altitude nuclear detonation and has a response time up to several
hundreds of seconds. It is often referred to as magnetohydrodynamic EMP.
The early-time E1 effects appear as flashovers and voltage-stress damage to power delivery equipment
and to communications electronics. Although present in the HEMP environment, the intermediate-time
E2 component was not found to be important in assessing the behavior of the electric power system.
Instead, E2 effects fall within the normal criteria for frequently occurring natural incidents and expected
manmade incidents, such as switching transients (an exception would be the case in which the E1 pulse
has destroyed some surge protection devices, thus making systems more vulnerable to E2 as well). As
stated previously, E3 manifests on long power lines as a quasi-direct current that flows through
transformers and shunt reactors. E1 and E2 could affect communications for control systems used
throughout the electric power system, depending upon the methods used to perform the communications.
Power companies are moving away from wave traps toward fiber-optic communications, wherein the
fibers are embedded into the core of the static overhead ground wire of the transmission lines. This shift
represents an improvement in that, although the transmitter and receiver electronics of the fiber-optic
communications will still be sensitive to E1 and possibly, to E2, the fiber itself is immune to EMP effects.
Because the two primary EMP threats from manmade incidents, E1 and E3, manifest on the electric
power system in such dissimilar ways, they must be evaluated separately. As noted previously, E3 affects
a system after it has already been affected by E1.
The loss of power generation capability arises from either damage or disruptions in power plant electrical
instrumentation systems, including switchyard power, control systems, combustion turbine generator
packages, and the control rooms themselves. Operation of the power generation plant is dependent upon
proper functioning of all these subsystems, especially their major components. Within power plants, the
percentage of generation lost is a measure of functional degradation. The assessments made in the late
1980s and early 1990s (neglecting the losses in generation capacity due to the plant’s control room
circuitry) resulted in estimates of 4.4 percent generation loss.115 This effect would result from switchyard
E3 pulse leakage, affecting operation of step-up transformers by electrically isolating them from the grid.
Much like a physical attack (Section 4.2.1), it is impossible to predict an EMP attack. Early warning
systems may be able to provide 10-20 minutes of warning if the attack utilizes a ballistic missile for
delivery.
A significant knowledge gap in modeling the impacts of an EMP attack is the likelihood of equipment
failure, the state of the failed equipment and the time sequence of the failure events. In the event of
control equipment losses at the substation, the effect upon the substation cannot be predicted. It is not
known whether the substation would remain functional or isolate itself. The loss-mode of the control
equipment would determine the state of the substation. For example, loss of circuit breaker control
equipment may send a signal to open the circuit breaker, or it may not. If the signal is sent, the circuit
breaker opens and the EHV transformer is isolated from its source, its load, or both.
If the probability of loss for every component level of the load circuit is calculated, the total system effect
can be estimated. Each component level depends on its upstream component. If an upstream component is
out of service, downstream component-level flashovers and failures will not affect substation circuit
breakers or the EHV transformer. The protection philosophy of each component level on the load circuit
must also be considered. For example, a flashover on a sub-lateral component may blow a fuse, cause a
circuit breaker to disconnect, or otherwise remove it from the rest of the circuit. The sub-lateral will
remain out of service until manual operator intervention occurs. If the flashover occurs during E1, that
sub-lateral will not be included in the system when E3 arrives.

29
Protection from E1 EMP is primarily through grounding and shielding of critical components, for
example, by utilizing shielded substation control houses; the elimination of conductive paths that can
couple E1 into sensitive equipment (e.g. switching from wave traps and copper signal wires to fiber
optics); and installing equipment constructed to sufficiently rigorous standards to ensure survivability in
E1 environments.
4.2.4 Spontaneous Equipment Failure
The failure of equipment may not qualify precisely as a “threat” because it typically refers to a condition
of deterioration that could be the result of design limitation and/or operations of the equipment near of
past design specifications. However, such factors need to be considered in risk management, particularly
when the equipment has high criticality for power grid operations and/or its replacement or repair may
require a period of time that is not compatible with the maintenance of an acceptable electric service for
the users (see Box 3).
Spontaneous failures of equipment used in the generation, transmission, distribution, or storage of
electricity pose a threat to the reliability the U.S. electricity system, both in isolation and through their
potential to trigger cascading failures across multiple system components. Equipment failures can arise
from a number of sources. For example, for generators, failures appear to be more prevalent for
distributed rather than centralized systems. Statistics on equipment failures from wind generators, indicate
differential rates of failure for small vs. large generator units as well as differences in how failure rates
change as the devices age.116 Similarly, photovoltaic modules experience failures due to faulty
manufacturing, damage during transportation, or faulty installation. The most common failures of PV
modules are associated with delamination of the module, cell part isolation due to cell cracks, and
laminate discoloring.117 In contrast, centralized generation systems, whether thermal (fossil and nuclear)
or hydroelectric, have lower risk tolerances for faults that would take the facility offline, and thus
spontaneous faults resulting in outages are rare.
Spontaneous equipment failures are, by definition, stochastic events that cannot be predicted, although
equipment and materials can be expected to depreciate and degrade over time, which can increase the
probability of failure.
Faults in transmission and distribution lines are often transient – power may be lost or disconnected for a
short period of time. Such faults are then isolated by power system protection technologies, after which
the fault clears and service can be restored. Such faults can rise from contact between the lines and other
objects (such as trees, other objects, or animals), or lightning strikes (see Section 4.1). In contrast,
persistent faults cannot be resolved by disconnecting power and are often associated with physical
damage to transmission and distribution lines.
4.2.5 Combined threats
The occurrence of truly random events, such as hurricanes and earthquakes, is expected to be independent
making the probability of two closely spaced, collocated events exceedingly low. However, an intelligent
attacker may plan to use occurrence of one naturally-occurring HILF event to amplify the impact of a
physical, cyber, or EMP attack (Table 6). Electric systems are generally not designed to withstand or
quickly recover from damage inflicted simultaneously on multiple components.103

30
Table 6. Potential Interactions between Natural and Human Risks to the Electricity System
Natural
Disaster
Combined
With
Discussion
Hurricane Physical or
Cyber
Hurricanes typically result in a large loss of load. A physical attack during
or immediately following a hurricane is not expected to yield significant
amplification.
GMD EMP Periods of significant, very high GMD can be predicted approximately 30
minutes ahead of time, although the exact locations and intensity are still
relatively uncertain. However, a well-timed EMP attack could be used to
significantly amplify the hazard and impact of an naturally occurring GMD
event.
Ice Storm Physical or
Cyber
Ice storms typically result in a large loss of load. A physical attack during
or immediately following an ice storm is not expected to yield significant
amplification.
Drought Physical or
Cyber
Droughts are chronic events that last an extended period of time making
coordination with a physical or cyber attack possible. Droughts also place
power systems in stressed conditions with low levels of hydro or thermal
generation (due to lack of water in storage or for cooling). This may be
amplified by high loads due to high temperatures. A well placed physical
or cyber attack that compromised the remaining generation assets could
significantly amplify the impact of the two combined events.
Flood Physical or
Cyber
A flood of sufficient severity to affect generation could constrain
generation capacity within a utility or region. Physical or cyber attacks
coordinated to coincide with generation shortfalls could overstretch
capacity or slow recovery efforts.
Extreme
Cold
Physical or
Cyber
Extreme cold events are forecasted far enough in advance to enable
coordination with a physical or cyber attack possible. Extreme cold places
power systems in stressed conditions with potentially low levels of thermal
generation capacity amplified by the increased electrical load. A well
placed physical or cyber attack that compromised the remaining generation
assets (or the natural gas pipeline system) could significantly amplify the
impact of the two combined events
Extreme
Heat
Physical or
Cyber
Extreme hot events are forecasted far enough in advance to enable
coordination with a physical or cyber attack possible. Extreme cold places
power systems in stressed conditions with potentially low levels of thermal
generation capacity amplified by the increased electrical load. A well
placed physical or cyber attack that compromised the remaining generation
assets (or the natural gas pipeline system) could significantly amplify the
impact of the two combined events
Earthquake Physical or
Cyber
The timing or location of major earthquakes are not predictable making
coordination with a physical or cyber attack difficult.
5. INTEGRATED ASSESSMENT OF ELECTRICITY SECTOR RESILIENCE
Placing the various threats discussed in Section 4 in a context useful for prioritizing risks and mitigation
options for decision-making requires the systematic integration of information on threats with that on
their likelihood of occurrence and their consequences as well as risk management options that can
enhance resilience. This section presents such integrated information by using published literature and

31
expert judgment to systematically assess risk and resilience for different components of the electricity
system. First, the section outlines the metrics of risk and resilience used in the assessment while
acknowledging the nascent state of resilience metrics for U.S. power systems. Second, those metrics are
then applied in a comprehensive assessment in order to identify key threats and/or system components
that should be priority targets for future investments in resilience.
5.1 ASSESSING ELECTRICITY SECTOR RESILIENCE
The variety of threats that may affect the resilience of the energy system are profoundly different in
nature with respect to their likelihood of occurrence, the severity of the consequences, their predictability,
and the availability of technologies and practices to avoid impacts or quickly recover. Meanwhile,
electricity infrastructure and assets are typically functionally divided among generation, transmission, and
distribution systems (Section 2), each of which have differential exposure and vulnerability to threats as
well as different governance regimes in terms of ownership and responsibility for management.
In the past, this complexity has often led to resilience of the electricity system being framed around
discrete threats and/or system components. This has encouraged reductionist thinking toward identifying
the risk that individual components will fail when challenged by a specific threat. Although this facilitates
risk assessment, it makes it difficult to generate a comprehensive picture of resilience for the sector or to
prioritize risks. The identification of a more systemic framing of resilience as well as specific metrics that
can be used for the monitoring and evaluation of resilience in the electricity system is a rapidly evolving
area of inquiry. Hence, this report does not attempt to define the specific metrics of resilience that should
be used. However, continuing to develop a community consensus around such metrics is an important
task for enhancing future resilience of the electricity sector.118,119
Figure 9. Metrics of Electricity System Resilience Used in the Current Report
Here, resilience is explored generally through four dimensions that collectively define resilience across
the electricity system for the range of threats to which the system is exposed:
First, system components reflect the elements of the electricity system that are exposed to risk
(i.e., resilience of what);
Second, threats reflect the hazards that can trigger adverse impacts (i.e., resilience to what);
Third, dimensions of risk reflect the factors that determine to what extent a system component is
susceptible to harm and the potential severity of the impacts; and
System Components
•Generation
•Transmission
•Substations
•Distribution (above and below ground)
•Storage
Threats
•Environmental
•Weather/climate
•Seismic
•Wildlife
•Human
•Physical attack
•Cyber attack
•Electromagnetic
Dimensions of Risk
•Threat probability
•Vulnerability
•Impact
Adequacy of RIsk Management
•Robustness
•Resourcefulness
•Recovery
•Adaptability

32
Fourth, the adequacy of risk management practices reflects the maturity of current threat
mitigation technologies, policies, and practices to maintain risks within acceptable limits.
Box 5. Toward Industry Resilience Metrics for the Electricity Sector
The ability to track resilience, evaluate progress, and prioritize challenges is a critical aspect of
enhancing the overall resilience of the U.S. electricity system. Resilience metrics can be used by
regulators and electricity system planners for developing, implementing, and monitoring general
policies, emergency management efforts, contingency planning, and investment planning. While such
metrics invariably reduce the complexity of the electricity system to a small number of parameters,
such simplification can be an effective mechanism to gauge and monitor progress towards the
improvement of resilience plans.
However, existing metrics are applied inconsistently, neglect important concepts of resilience, and/or
are not robust to the range of contingencies for which industry decision-makers should plan.
Therefore, a key recommendation emerging from the First Quadrennial Review was “Develop
comprehensive data, metrics, and an analytical framework for energy infrastructure resilience,
reliability, and asset security.”6
A review undertaken by RAND Corporation in 2015 provided not only a logic framework for
structuring resilience metrics (see below),118 but also a list of metrics that have either been proposed or
are currently in use at the facility or regional level. Those examples provide an entry point for further
development, refinement, and integration of metrics so that they can be robustly applied across
geographic scales, system components, and threats.
Figure 10. A Logic Framework for Resilience Indicators for the Energy System
Caption: The above logic framework for resilience indicators identifies different classes of metrics as well as general
examples of types of metrics associated with each class.118

33
5.2 ASSESSMENT OF ELECTRICITY SECTOR RISK AND RESLIENCE
Applying the various general metrics to the U.S. electricity system results in a comprehensive perspective
of the key points of risk to various system components as well as the extent to which current management
practices convey sufficient resilience to those risks (Table 7; Appendix B). Using this approach, this study
considers the range of threats discussed in Section 4, including information on the likelihood of threat
events of different intensities, the impacts to system components that are often associated with those
threats, and the available options for mitigating impacts or recovering from their effects.
To illustrate the importance of threat intensity on risk, contrasts are drawn between low intensity and high
intensity threats. For example, major hurricanes are associated with different levels of risk than minor
hurricanes and tropical storms, although the probability of a land falling major hurricane in any given
year is lower. However, for some types of threats, the likelihood of their occurrence is unknown, either
because they happen to infrequently to generate useful statistics, or because they are only plausible
scenarios that have yet to be observed.
The risk posed by a given threat to a system component is a function not only of the likelihood of the
threat, but also the vulnerability and potential impact associated with threat exposure. System components
vary in the extent to which they are exposed to different types of threats. For example, locating
distribution lines below ground significantly reduces their exposure to weather, which reduces the risk of
adverse impacts during severe weather events. Meanwhile, some components have a greater vulnerability
to threats based upon the design standard. Transmission lines tend to be built to a higher standard than
distribution lines, and thus the latter has a greater vulnerability to many types of threats, particularly
weather. That said, outages associated with distribution systems are often localized and therefore the
impacts in terms of customers affected can be relatively limited. Some types of risks remain difficult to
assess, in part because of uncertainty in the likelihood the threat.
The maturity of risk management practice for different types of risk is a function of industry’s experience,
the perceived severity of the risk, and the availability of effective risk management measures. Industry is
well-equipped to manage risks that occur frequently, in part because they can be anticipated and, in some
instances, even forecast. Federal and state standards for infrastructure design, planning, and operations
assist in making infrastructure more robust or enabling rapid recovery. Technological innovations
enhance system reliability and efficiency, while improvements in control systems accelerate situational
awareness, fault detection, and facilitate load balancing. However, some risks occur so rarely and/or with
such intensity that complete mitigation of the risk is unfeasible. Hence, resilience efforts should focus on
ensuring the system can recover as rapidly as possible.
Assessing the current state of the U.S. electricity system against these different metrics reveals a broad
range of risks that span a gradient from negligible to potentially catastrophic (Table 7). Fortunately, the
majority of these risks are relatively minor. The electricity system is robust to a broad range of routine
risks that arise with relatively high frequencies, but with negligible to modest consequences (e.g., from
safety, operational, financial standpoints). For example, the electricity system has evolved to cope with
storms, winter and summer temperature extremes, minor drought events, and even minor earthquakes
(Table 7).

34
Table 7. Integrated Assessment of Risk and Resilience to the Electricity Sector
Caption: Assessments of risk and status of risk management practice are based on information in Section 4, published
literature, and expert judgment (for statistically unknown threats). Table cells represent a qualitative assessment of risk by
electric system component and threat. Some threats are divided into low or high intensity threats. Estimates of individual sub-
components of risk (probability, vulnerability, and impact) are presented for each system component in Appendix B.

35
The more significant risks to the system are those that are rare (or have never occurred), but that have
potentially catastrophic consequences – HILF events (see Section 3).3 Examples include a High Altitude
Electromagnetic Pulse (HEMP) from a nuclear weapon (or NEMP), severe geomagnetic disturbances
(GMDs) from a solar coronal mass ejection, a large-scale cyber-attack (or coordinated, combined cyber
and physical attack occurring simultaneously in multiple selected critical locations), or a natural disaster
of historic intensity (Table 7; Figure 11). Included within HILF risks are those with probabilities that are
completely unknown, with consequences that span multiple interconnected systems, and/or are changing
over time due to dependencies on other driving forces. Often, even generating scenarios of such threat
events is challenging – either because they manifest in ways that are difficult to anticipate or because their
plausibility is perceived to be so low that they are dismissed. Such events are sometimes referred to as
“black swans”. The absence of foresight for such events poses obvious challenges for risk management,
but also highlights the importance of resilience. Given efforts to prevent or mitigate damages may be
stymied by lack of foresight, pursuing options that enhance the capacity of systems to manage during an
event and bounce back afterwards become important elements of the risk management toolkit.
Nevertheless, significant gaps persist in preparedness and resilience for HILF events, making them a
priority for future assessment and investment.
Figure 11. Risks to the Electricity Sector Mapped to the Risk Landscape
Caption: The risk landscape (as in Figure 4) with specific examples of types of threats. Each threat is associated with a
different range of probability and consequence and therefore risk.
An apparent challenge that emerges for the electricity system is the expansion and growth of human
threats to the electricity system. The risks associated with those threats can be severe and they have the
potential to affect a broad range of system components. Because human threats are a function of human
choice and agency rather than the environment, it is difficult to assess the likelihood of their occurrence or
the potential extent of their consequences (Table 7). For example, while physical attacks on the electricity
grid are common, impacts to date have been modest to negligible. Hence, stakeholders have limited

36
experience with more extreme attacks. As demonstrated by the rise of cyber attacks on the U.S. energy
system, emerging technologies have the potential to generate new threats to which the electricity sector
must remain vigilant. Severe human threats are also those for which risk management strategies are in a
nascent state, creating gaps in resilience.
The other insight that emerges from a comprehensive assessment of the electricity system’s resilience is
the differential risks associated with different system components (Table 7). There are clear contrasts, for
example, with respect to the risks to which above ground distribution systems are exposed compared with
below ground systems. Meanwhile, energy storage systems are associated with relatively fewer risks, in
part due to the limited storage infrastructure that currently exists across the United States. However,
storage is likely to expand in the years ahead, becoming more integrated into the national grid. This may
increase its importance as well as the vulnerability of the energy grid to potential disruptions to storage
capacity. Although differential risks can be identified, it is also important to note that not all components
of the system have the same criticality for system reliability. Disruptions of the bulk power system and
generation have the most impact – that is where the largest capital investment resides and where
replacement/repairs (or lack thereof) are costlier and may affect the largest segment of the population.
In assessing the resilience of the current electricity system, it is important to be aware that the system is
undergoing rapid change as are the risks to which it is exposed. As a case-in-point, climate change is an
emerging risk that has been a particular focus of U.S. national resilience efforts. Given severe weather
events are the major source of both routine and HILF threats to the U.S. electricity system, future changes
in the U.S. climate have implications for the frequency, intensity, and duration of weather and climate
threats. This includes conventional weather-related threats like floods, extreme heat events, hurricanes
(addressed above), but also includes challenges such as sea-level rise (Section 4.1.7), which is anticipated
to interact with hurricanes and other coastal storms to increase the risks to coastal electricity
infrastructure.
6. TOWARD ENHANCED RESILIENCE OF THE ELECTRICITY SECTOR
6.1 OPPORTUNITIES FOR ENHANCING RESILIENCE
The assessment of the current state of resilience across the U.S. electricity system identifies a number of
opportunities that should be the focus of future research and development and utility planning. First and
foremost, the sector should seek to maintain its current level of robustness and reliability to the range of
high frequency, routine risks to which it is exposed and, where possible, continue to make incremental
improvements in their mitigation. However, the most significant gains in resilience will likely come from
addressing those challenges that the sector is not currently well-equipped to manage. In particular, HILF
risks stand out as priorities for resilience. There is a need to better understand the likelihood and
consequences associated with various types of HILF events and a need to enhance risk management
options, technologies, and planning to address a broader range of contingencies (Box 6). To this end,
developing the capacity for viewing, modeling, assessing, and managing the electricity system as an
integrated infrastructure network, rather than a collection of discrete components, will aid in enhancing
overall system resilience.
An important management tool for infrastructure operators are the prescribed reliability planning
standards that outline in detail the performance requirements of the system following the failure or loss of
specific combinations of components. The NERC Standard TPL-001-4 Transmission System Planning
Performance Requirements specifies these requirements for transmission system owners and operators.19
While this serves as a useful basis for planning and operating the system, and provides consistency among
system owners and operators that depend on each other in operating an interconnected grid, it fails to
capture several elements of system resilience that we are addressing in this report.

37
Areas that the existing industry planning standards do not capture as it relates to system resilience:
Severe events. The industry standards do a good job of capturing likely events that could have an
impact on reliability, like the failure of single components or components that relate to each
other, for instance multiple circuits in a common right of way. However, many of the high impact
events postulated in this report would not be captured through a component failure analysis as
prescribed in the industry reliability planning standards.
System analysis. The planning standards address system impact based on component failure
analysis. However, vulnerabilities to the system that might compromise the entire operation of the
system are not addressed. These could include widespread physical consequences or cyber
vulnerabilities that simultaneously disable or degrade the system.
Time to recover. Because an essential element of resilience is the recovery from an off-normal
event, considering time to recovery, from full onset of the event through partial recovery to fully
recovered. Based on the nature of the event, the damage incurred, and the ability of the system to
quickly recover will dramatically impact the resilience of the system. This factor is not included
in the traditional reliability requirements.
In addition, NERC’s operational standards such as FAC-011-2, System Operating Limits Methodology for
the Operations Horizon, consider an even narrow range of contingencies and response scenarios.
Therefore, increasing the capacity of the bulk power system to accommodate HILF events in planning and
operations while maintaining robustness, survivability, adaptability, response, and recovery is key
opportunity for enhancing resilience.19
6.1 CONSTRAINTS AND LIMITS ASSOCIATED WITH ENHANCING RESILIENCE
Although there are clear opportunities for enhancing the resilience of the U.S. electricity system, there are
also a number of constraints associated with capitalizing on those opportunities. Resilience investments
can be expensive and require significant capital and time to implement. This necessitates the need for
utilities to prepare a rate case that includes sufficient justification, which can be a challenge when
investments involve preparation and planning for events that have not yet happened. Uncertainties in
global climate change, economic development, and changes in State and local policies and regulations
regarding electric infrastructure resilience create additional difficulties, as does incomplete understanding
of the interactions between energy infrastructure and other systems of critical infrastructure. Discussions
with subject matter experts and industry partners as well as open source research have identified the
following as the most common constraints associated with enhancing resilience:
6.1.1 Predictability of Threats and System Responses to Climate Change
The development of predictive models has always been of interest to the electric power industry. The
development of adequate models allows utilities to understand potential consequences of an event and
plan for mitigating those consequences before an event happens. Historically, past events (i.e., natural
hazards) have been used to help formulate parameters of the model in an attempt to minimize error.
However, the growing need to incorporate future threats that are changing over time is posing new
challenges. For example, uncertainty in the future frequency, intensity, and duration of extreme weather
events is now multiplied because of climate change. Hence, risk management efforts are moving into
unmapped territory. The climatic changes forecasted to manifest over the next 50–100 years should also
impact upgrades to existing and development of new technologies and infrastructure. The uncertainties
associated with the accepted climate change models, in addition to human behavioral responses to those
climate changes (i.e., shifting of population centers), exacerbate the ability to plan for future infrastructure
needs.

38
Box 6. Technology Options for Enhancing Grid Resilience
Distributed Energy Resources (DERs)
Positive impacts: DERs can help mitigate the negative consequences of natural hazards if they are
correctly configured to supply energy during interruptions. Because of their widespread locations and
generally low power, they are more resilient (or much less attractive as a target) to physical attacks
than larger plants located at centralized physical locations.
Positive and negative impacts: DERs can have either a positive or negative effect on capacity
constraints. For instance, some resources such as energy storage and demand response provide
additional flexibility to the system. Other resources such as PV can create additional stress on existing
generation because their integration generally requires additional reserves and their capacity value
decreases as a function of their penetration level. Additionally, accurately valuing these resources
(regardless of type – solar, demand response, storage) is a challenge for utilities and system operators,
so they tend to be overly conservative when assigning capacity values. If their capacity value is
overestimated at large penetration levels, they could create long term generation capacity shortages for
the system.
Negative impacts: On the flip side, they increase the points of entry for a cyber attacks. Though a
single resource can be considered a low value target, a more sophisticated coordinated attack could
have a significant impact on the grid. The increased complexity of communications and controls
necessary to run this type of devices increases the interdependencies with the communications
infrastructure.
Microgrids
Microgrids can be thought of as a collection of distributed resources that can be reconfigured an
islanded at any moment to supply a larger portion of the grid than a single household or building.
Because of their similarity to DERs, microgrids have similar positive effects to distributed energy
resources.
Positive impacts: Microgrids have a positive impact on natural hazards because they can be used to
supply critical loads and services during grid interruptions.
Negative impacts: There is a possibility that recovery times might increase due to increase difficulty
to identify damaged equipment. This is particularly true for distribution systems where utilities
generally rely on customers phone calls to pinpoint problems and send crews out.
Renewable Energy Sources
Here we refer to utility-size renewable energy power plants.
Positive impacts: renewable resources have a positive impact on dependencies and supply chain
interruptions because, unlike fossil fuel power plants, they do not depend on other infrastructure to
provide their fuel.
Positive and negative impacts: Some renewable energy resources increase the resilience of electric
power systems to the long-term effects of climate change. For instance, periods of longer drought are
seen in parts of the world because of changing weather patterns and in these cases, resources such as
wind and solar have a positive impact on grid resilience because they are not water-intensive.
However, resources such as hydro and geo-thermal can have a negative impact because of the water

39
6.1.2 Cost Recovery and Stranded Investments
Electric energy infrastructure (including both bulk power and local distribution) is primarily privately
owned. Due to deregulation, customers can receive power from separate generation, transmission, and
distribution companies. Those complexities are further compounded by the rates that local utilities charge,
which are generally regulated by State agencies.120
In the midst of these complexities, electric power customers expect power to be delivered consistently
with minimal disruptions. Keeping the lights on is an equally important imperative to the utilities, as
disruptions can result in a significant loss of revenue. Customer expectations and minimizing revenue loss
are sufficient motivators for power companies to invest in processes and solutions that minimize
downtime, both on blue sky days and on days when an adverse event shuts down the power.121
consumption required for either cooling (geo-thermal) or through evaporation and leakage in
reservoirs. When considering hurricanes, wind plants that are within close proximity of the affected
load centers or offshore can have a negative impact because they will most likely stop producing
power due to cutoff speeds being reached during the event, at the time when it is most needed.
Similarly during snow storms, solar power plants can be affected due to the potential accumulation of
snow on top of the solar panels. In both of these cases, having geographic diversity in wind and solar
portfolios can help mitigate these potential negative impacts.
Advanced Interdiction Analysis
Interdiction analysis provides information about the potential impact that different vulnerabilities pose
to a system. In power systems, interdiction analysis can be used for analyzing physical, cyber and
supply chain and interdependency threats. The objective is to identify which parts of the system, if
attacked, would result in larger consequences from such attacks in order to prioritize investments (e.g.,
hardening, spares) in order to increase resilience to those threats.
Positive impacts: As mentioned above, interdiction analysis helps prioritize investments to increase
resilience to physical, cyber and supply chain threats.
Negative impacts: Interdiction analysis relies on accurate threat modeling in order to be effective. It
is important to understand and create awareness about the limitations and assumptions made in the
models employed for this type of analyses.
Optimal Spare Acquisition and Positioning
Optimal spare positioning is intended to reduce vulnerabilities in the supply chain. Strategically
positioning acquiring and locating spares around the system may significantly reduce recovery times.
Positive impacts: resilience to supply chain threats is increased, and recovery times for other types of
threats such as natural disasters are reduced.
Negative impacts: Similarly to advanced interdiction models, optimal spare acquisition and
positioning is highly dependent on threat models. It is important to understand and create awareness
about the limitations and assumptions made in the models employed for this type of analyses.

40
Federal and State regulators have jurisdiction over the bulk power system, while State or local regulations
typically drive local distribution rates.120 This business model can lead to tensions between the regulators
and industry to implement resilience-enhancing options. The utilities must build rate cases to justify the
installations of any new measures and/or cover the cost of current costs of operation, which may have
changed. Part of this rate case is providing justification that these costs are reasonable and prudent and
can include showing estimates for return on investment (ROI). This may be difficult to justify in front of a
public utility commission and the end use customers. Some important trade-offs must be considered.
The Edison Electric Institute’s (EEI) comments on the QER122 recommended that the industry be allowed
to develop “innovative alternative utility rate design models.” The increased prevalence of distributed
generation (e.g., microgrids, solar, wind, and smart vehicles) and the challenges with incorporating those
typically intermittent power resources into the grid, almost necessitates a new model. New design models
will allow costs to be allocated to the proper customers while maintaining the need to keep the grid
reliable and resilient. The EEI also suggested developing additional Federal programs or tax provisions
designed to generate consistent funding to implement changes before and after extreme events. These
types of programs will allow Federal assistance in preparing for the changing environment for energy
infrastructure and promote proactive investments in resilience-enhancing activities.
6.1.3 Communication and Workforce
The continuum of resilience-related activities spans from complicated to simplistic, expensive to
inexpensive, and time consuming to instantaneous in implementation. Many discussions involving
resilience of the electric grid center on changes to the actual infrastructure, for example, upgrading
existing infrastructures or installing new components. In fact, a number of measures can be taken to
enhance resilience that utility management, employees, and State and local entities can employ that are
not as costly or time consuming. Several references (i.e., ISO 22301,123 BS 25999-2,124 and ANSI/ASIS
SPC.1125) are available that focus on the creation of robust plans, whether they look at business
continuity, emergency preparedness, or disaster response. Some components are common to all plans,
regardless of the type. Examples include establishing key points of contact; coordinating interactions with
outside responders; and training, exercising, and regularly maintaining the plan.126
6.1.4 Coordination and Collaboration
Maintaining electric power during and post emergency touches almost every component of a community
in some way. A community’s dependence on electric power necessitates collaboration among a disparate
set of entities to include State and local governments, the utility providers, and owners of other critical
infrastructure. The dependence on electric infrastructure for operations should require a shared
responsibility among the entities for keeping it operational; doing so will increase resilience across the
entire community. 121
Enhancing coordination and collaboration among these entities depends on two items: (1) awareness of
connections and impacts of these connections and (2) the information available and the ability to share
that information. Exchanging information that could be considered business sensitive has always been
problematic, even during an emergency or in the recovery phase.
The education of the consumer population, specifically the individual residential consumers, is important
in communication and collaboration. Resilience efforts can cost a significant amount of money; the
utilities will seek to recover these costs, typically via the customers. The customers, especially individual
residential customers, however, have a difficult time understanding improvements that are not
immediately or only incrementally felt. Situational awareness and education are as important at the

41
individual end user level as they are for State, local, and private sector critical infrastructure owners and
operators. 121
Barrett et al. (2013) summarized the need for enhanced communication, collaboration, and understanding
for all entities involved in understanding the risk to a community, the importance of energy infrastructure
in that risk picture, and the preparation for disruptions to the system, as shown below:
As a nation, we will need to find better ways to manage these areas of shared responsibility
stemming from current and future evolutions of the aggregate and shared risk picture. This
requires finding solutions that blend broader risk management needs for a more resilient
electrical grid with the private sector’s ability to invest in ways that meet challenges effectively
and efficiently. It also requires an open dialogue about the full costs and potential benefits of a
more interactive and modernized smart grid that allows consumers to help by reducing demand
during peak periods and provides deeper insights into the otherwise opaque real-world operating
conditions of the grid itself.121
6.1.5 Governance Gaps
Infrastructure resilience is a whole-of-community issue. As such, the utilities and the private sector can
work towards resilience in complementary ways. For example, the utilities can work on the process,
procedures, and construction, while the private sector can prepare for the loss of electricity during a
disaster and assist in community preparation in resilience. Although utilities are making investments to
increase resilience, long-term solutions rely on the identification and management of shared risks and
identification of governance gaps. Governance gaps in this context are defined as areas of shared risk
where there is no clear identification or responsibility assigned to one or more entity. This lack of clarity
can lead to an increase in consequences or impacts of an event because these areas are often overlooked.
121
One common governance gap is realized during HILF events such as Superstorm Sandy. The magnitude
of the disruptions caused by this type of event highlights, even further, the need for coordinated efforts
among State, local, and private sector entities. However, the identification of the shared risks and
assignment of who is responsible for what is often not considered or is considered but never discussed in
detail. Lessons on the importance of the identification of the shared risks and the identification of the
entities responsible to address those risks often occur after a major event. Multi-entity exercises can help
shed light on these governance gaps and assist in preparing for these disastrous events before they
happen.
While consumers often absorb the recovery costs associated with resilience improvements, private
investment in electricity infrastructure is an important component to consider from a governance
perspective. Governance actions, such as public policies, regulations, and process, play a role in the
nature and magnitude of private investment in electricity infrastructure.120 Policies and legislation
implemented through State and local governments, developed in concert with other members of the
community as well as the utilities, can help secure funds as well as remove barriers to implementing
resilience measures.
6.1.6 Future Risk
While utilities, State and local governments, and other private sector entities struggle to make
improvements to address the existing landscape of hazards, they also face another significant hurdle—
addressing the notion of future risks that may not be in the typical time frame for planning or amenable to
traditional methods of planning. Utilities typically base their planning assumptions on historic data;

42
however, the effects of climate change can lead to ever-changing surroundings and uncertainty in the
future. Global climate has already started to deviate from historic averages. According to the
Intergovernmental Panel on Climate Change (IPCC) Special Report on Extreme Events,127 in the haste to
rebuild infrastructure as quickly as possible after a disaster, utilities could miss an opportunity to improve
their infrastructure rather than rebuild it to the previous standard. With the advent of deviations in those
patterns due to climate change, historic trends could be misleading, as frequency, magnitude, or new
events manifest themselves over the next half century, thus leading to infrastructure that is unable to
perform as efficiently or at all.121
In addition to the uncertain and shifting landscape of natural disasters, other occurrences of man-made
threats are increasingly ambiguous due to the unpredictability of terrorist actions, the prediction of and
protection against cyber-attacks, as well as more traditional man-made threats (e.g., worker errors or
insider threats using knowledge of the system). Another type of risk is the interdependency among the
electric grid and other systems of critical infrastructure, especially telecommunications. As with
electricity, telecommunications (phones as well as internet) are critical to the operations of modern times.
Most, if not all, critical infrastructure relies on telecommunications in some way. Electric power requires
telecommunications to maintain information and responsiveness across the grid, especially as the grid
starts to get “smarter.”121 SCADA systems are a common telecommunications component of utmost
importance to the operations of the grid. This risk can build upon itself, leading to increasing
consequences that depend on how interconnected the systems are and how quickly the system can
recover. For example, a disruption in the grid can impact telecommunications systems that support the
function and operation or other portions of the grid, which can in turn cause further disruptions in the
grid.
7. CONCLUSIONS AND RECOMMENDATIONS
The resilience of the U.S. electricity system continues to evolve in response to changes in both the system
itself (e.g., scale, design, technology, and planning standards) as well as changes in the human and
environmental threats to which it is exposed. Electric power systems are currently well-equipped to
effectively manage a broad range of threats in order to mitigate risk or successfully recover from
disruption and damage. This is why the U.S. has one of the most reliability energy grids in the world.
Nevertheless, some types of risks remain challenging – either because their scale is so great, because they
have only recently emerged, or because the risk is difficult to define. As such, resilience efforts should
shift toward these more complex risk management challenges. Key risks identified within this report
include the following:
HILF threats associated with natural hazards (particularly weather or space weather) of historic
intensity or large-scale physical, cyber, or electromagnetic attacks. The lack of industry and
regulatory experience with such rare events, the difficulty of predicting or forecasting their
occurrence, and the potential scale of the consequences have collectively limited the
development of robust resilience strategies.
Combined or blended threats associated with simultaneous exposure of the electric grid to one
or more natural threats in combination with a physical or cyber attack. Such threats are
plausible, but could manifest in ways that are unprecedented. This poses significant challenges to
the development of contingencies that can be incorporated into planning and operational
standards.
Threats that affect vulnerable components of the electricity system or that exceed critical
thresholds. Distribution networks are a weak link in the electric grid, but disruptions and outages
associated with distribution are often localized. Generation, transmission, and substation assets
are often more robust to both human and natural threats. However, these assets are still

43
vulnerable to single point-of-failure risks, such as the loss of large power transformers.
Furthermore, once design, planning, and/or operational limits for such assets are exceeded,
significant and potentially catastrophic consequences can occur.
In response to these vulnerabilities, a number of recommendations can be made to guide future decision-
making to enhance resilience of the U.S. electricity system:
Building a greater understanding of HILF events and capability to incorporate HILF threats into
risk assessments and cost/benefit analyses of possible interventions or management strategies will
be an important component of resilience efforts. In addition, scenario-based planning to explore
multiple contingencies can be used to stress test the system and identify gaps in resilience.
Recent efforts to develop a robust and scalable system of resilience metrics for the electricity
system should continue. Resilience metrics have an important role to play in tracking progress
toward risk management and resilience objectives and for providing early warning of potential
weaknesses in the system.
Planning and operational standards are needed that extend beyond the classic reliability
requirements into resilient design principles. This will provide a common basis for electricity
infrastructure owners and operators to ensure that their system will interoperate with other
adjacent infrastructure associated with the interconnected power system.
Utilities and regulators should increase their capacity to assess and manage non-stationary risks
and their uncertainties. Future changes in not only the climate, but also population, technology,
and societal preferences have important implications for resilience. It is important to understand
whether risks are increasing or decreasing and whether those trends vary over different
geographic areas.
Despite a general consensus across the industry regarding the value of enhancing resilience of the
electricity system, a number of constraints act to slow or prevent action. Uncertainty regarding
different types of risks is one factor. However, concerns regarding the financing of investments in
resilience as well as the coordination of action across a diverse group of actors – utilities,
regulators, and consumers – at different scales make decision-making a complex task. Policies
and practices that can help to streamline assessment and decision-making while enhancing
coordination and communication can be just as important to resilience as the development of
robust infrastructure and assets.

44
APPENDIX A. REFERENCES FOR TABLE 4. SUMMARY OF KEY THREATS TO THE
ELECTRICITY SYSTEM
a Walsh, J., D. Wuebbles, K. Hayhoe, J. Kossin, K. Kunkel, G. Stephens, P. Thorne, R. Vose, M. Wehner,
J. Willis, D. Anderson, S. Doney, R. Feely, P. Hennon, V. Kharin, T. Knutson, F. Landerer, T. Lenton, J.
Kennedy, and R. Somerville. Ch. 2: Our Changing Climate. Climate Change Impacts in the United States:
The Third National Climate Assessment, edited by J. M. Melillo, Terese (T.C.) Richmond, and G. W.
Yohe, 19-67. Washington, DC: U.S. Global Change Research Program, 2014. Available at
http://s3.amazonaws.com/nca2014/low/NCA3_Full_Report_02_Our_Changing_Climate_LowRes.pdf?do
wnload=1
b Liu, Y., Goodrick, S.L., and Stanturf, J.A. “Future U.S. wildfire potential trends projected using a
dynamically downscaled climate change scenario.” Forest Ecology and Management 294 (2013): 120-
135.
c U.S. Geologic Survey, One-year seismic hazard forecast for the Central and Eastern United States from
induced and natural earthquakes, Petersen, M.D., Mueller, C.S., Moschetti, M.P., Hoover, S.M., Llenos,
A.L., Ellsworth, W.L., Michael, A.J., Rubinstein, J.L., McGarr, A.F., and Rukstales, K.S., U.S.
Geological Survey Open-File Report 2016–1035 (Washington DC: U.S. Geological Survey, 2016).
Available at http://dx.doi.org/10.3133/ofr20161035
d Congressional Research Service, Cybersecurity issues for the bulk power system, Campbell, R.J.,
(Washington, DC: Congressional Research Service, 2015). Available at
https://www.fas.org/sgp/crs/misc/R43989.pdf
e CNA Military Advisory Board, National Security and Assured U.S. Electrical Power (Arlington, VA:
CAN Military Advisory Board, 2015). Available at https://www.cna.org/CNA_files/PDF/National-
Security-Assured-Electrical-Power.pdf

45
APPENDIX B. DETAILED ANALYSIS OF RISK AND RESILIENCE OF THE U.S.
ELECTRICITY SYSTEM
Table 8. Detailed Integrated Assessment of Risk and Resilience to the Electricity Sector
Caption: Assessments of risk and status of risk management practice are based on information in Section 4, published
literature, and expert judgment (for statistically unknown threats). Table cells represent a qualitative assessment of risk by
electric system component and threat. Some threats are divided into low or high intensity threats. Estimates of individual sub-
components of risk are presented for each system component and threat: probability refers to the frequency or likelihood of a
threat occurring; vulnerability refers to the sensitivity of a system component to harm or damage; impact refers to the
potential severity of damage in terms of financial costs, affected customers, and/or health and safety. This table forms the
basis for Table 7 in Section 5.2.

46
ENDNOTES
1 Executive Office of the President, Economic Benefits of Increasing Electric Grid Resilience to Weather Outages
(Washington, DC: President’s Council of Economic Advisers, U.S. Department of Energy’s Office of Electricity
Delivery and Energy Reliability, with assistance from the White House Office of Science and Technology, 2013).
Available at http://energy.gov/sites/prod/files/2013/08/f2/Grid%20Resiliency%20Report_FINAL.pdf . 2 U.S. Department of Energy, U.S. Energy Sector Vulnerabilities to Climate Change and Extreme Weather
(Washington, DC and Denver, CO: U.S. Department of Energy’s Office of Policy and International Affairs and the
National Renewable Energy Laboratory, 2014). Available at http://energy.gov/sites/prod/files/2013/07/f2/20130716-
Energy%20Sector%20Vulnerabilities%20Report.pdf 3 North American Electric Reliability Corporation, High-Impact, Low-Frequency Event Risk to the North American
Bulk Power System. A Jointly-Commissioned Summary Report of the North American Electric Reliability
Corporation and the U.S. Department of Energy’s November 2009 Workshop (Washington, DC: North American
Electric Reliability Corporation , 2010). Available at
http://www.nerc.com/pa/CI/Resources/Documents/HILF%20Report.pdf 4 Executive Office of the President, The President’s Climate Action Plan (Washington, DC: Executive Office of the
President, 2013). Available at
https://www.whitehouse.gov/sites/default/files/image/president27sclimateactionplan.pdf 5 U.S. Department of Homeland Security, Partnering for Critical Infrastructure and Security and Resilience.
Washington, DC: U.S. Department of Homeland Security, 2013). Available at https://www.dhs.gov/national-
infrastructure-protection-plan 6 U.S. Department of Energy (2015) Quadrennial Energy Review: Energy Transmission, Storage, and Distribution
Infrastructure. Washington, DC: U.S. Department of Energy, 2015). Available at:
http://energy.gov/epsa/quadrennial-energy-review-qer 7 Consolidated Edison Co. of New York, Post Sandy Enhancement Plan. (New York: Consolidated Edison Co. of
New York, 2013). Available at: http://www.coned.com/publicissues/PDF/post_sandy_enhancement_plan.pdf 8 National Infrastructure Advisory Council, A Framework for Establishing Critical Infrastructure Resilience
Goals (Washington, DC: National Infrastructure Advisory Council, 2010). Available at
https://www.dhs.gov/xlibrary/assets/niac/niac-a-framework-for-establishing-critical-infrastructure-resilience-goals-
2010-10-19.pdf 9 Executive Office of the President, Presidential Policy Directive -- Critical Infrastructure Security and Resilience,
PPD-21. (Washington, DC: Executive Office of the President, 2013). Available at: https://www.whitehouse.gov/the-
press-office/2013/02/12/presidential-policy-directive-critical-infrastructure-security-and-resil 10 U.S. Department of Housing and Urban Development, Federal Disaster Policy: Toward a More Resilient Future.
Evidence Matters. (Washington, DC: U.S. Department of Housing and Urban Development, 2015). Available at
https://www.huduser.gov/portal/periodicals/em/winter15/highlight1.html 11 Larsen, P.H., LaCommare, K.H., Eto, J.H., and Sweeney, J.L., Assessing Changes in the Reliability of the U.S.
Electric Power System. (New York: Brookhaven National Laboratory, Brookhaven, 2015). Available at
https://emp.lbl.gov/sites/all/files/lbnl-188741_0.pdf 12 “Electricity Data Browser,” U.S. Energy Information Administration, accessed June 25, 2016,
http://www.eia.gov/electricity/data/browser/#/topic/0?agg=2,0,1&fuel=vvg&geo=g&sec=g&linechart=~ELEC.GEN
.COW-US-99.M~ELEC.GEN.NG-US-99.M~ELEC.GEN.NUC-US-99.M~ELEC.GEN.HYC-US-
99.M~ELEC.GEN.AOR-US-99.M&columnchart=ELEC.GEN.ALL-US-99.M~ELEC.GEN.COW-US-
99.M~ELEC.GEN.NG-US-99.M~ELEC.GEN.NUC-US-99.M~ELEC.GEN.HYC-US-
99.M&map=ELEC.GEN.ALL-US-
99.M&freq=M&start=200101&end=201604&ctype=linechart<ype=pin&rtype=s&maptype=0&rse=0&pin=. 13 “Differences Between Publically and Investor Owned Utilities,” California Energy Commission, accessed June
23, 2016, http://www.energy.ca.gov/pou_reporting/background/difference_pou_iou.html 14 “About Electric Coops.” National Rural Electric Cooperative Association, accessed June 23, 2016,
http://www.nreca.coop/about-electric-cooperatives/. 15 “About Electric Cooperatives,” Minnesota Rural Electric Cooperation, accessed June 23, 2016,
http://www.mrea.org/about-electric-cooperatives/. 16 Barbose, G., U.S. Renewables Portfolio Standards 2016 Annual Status Report. (Berkeley: Lawrence Berkley
National Laboratory, 2016). Available at https://emp.lbl.gov/sites/all/files/lbnl-1005057.pdf.

47
17 Aven, T. (2012) Foundations of Risk Analysis, II ed. Wiley, West Sussex, UK. 18 Renn, O. and Klinke, A. “Complexity, Uncertainty and Ambiguity in Inclusive Risk Governance,” in: Risk and
Social theory in Environmental Management, ed. T. Measham and S. Lockie (Collingwood: CSIRO Publishing), 59-
76. 19 National Electricity Reliability Commission, NERC Standard TPL-001-4: Transmission System Planning
Performance Requirements (Washington, DC: National Electricity Reliability Commission, 2014). Available at
http://www.nerc.com/files/TPL-001-4.pdf 20 National Electricity Reliability Commission, NERC Standard FAC-011-2: System Operating Limits
Methodology for the Operations Horizon (Washington, DC: National Electricity Reliability Commission, 2009).
Available at http://www.nerc.com/pa/Stand/Reliability%20Standards/FAC-011-3.pdf 21 National Electricity Reliability Commission, NERC Standard FAC-011-2: System Operating Limits
Methodology for the Planning Horizon (Washington, DC: National Electricity Reliability Commission, 2015).
http://www.nerc.com/_layouts/PrintStandard.aspx?standardnumber=FAC-010-
3&title=System%20Operating%20Limits%20Methodology%20for%20the%20Planning%20Horizon&jurisdiction=
United%20States 22 U.S. Department of Energy and U.S. Department of Homeland Security, Energy Sector-Specific Plan - An Annex
to the National Infrastructure Protection Plan (Washington, DC: U.S. Department of Energy and U.S. Department of
Homeland Security, 2010). Available at www.dhs.gov/xlibrary/assets/nipp-ssp-energy-2010.pdf. 23 North American Electric Reliability Council, Security Guideline for the Electricity Sector: Threat and Incident
Reporting. (Washington, DC: North American Electric Reliability Council , 2008). Available at
www.nerc.com/files/Incident-Reporting.pdf. 24 U.S. Department of Energy, Electric Disturbance Events (OE-417) Annual Summaries. (Washington, DC: U.S.
Department of Energy, Office of Electricity Delivery & Energy Reliability, 2014). Available at
www.oe.netl.doe.gov/OE417_annual_summary.aspx. 25 Campbell, J., Weather-related Power Outages and Electric System Resiliency. (Washington, DC: Congressional
Research Service, 2012). Available at http://fas.org/sgp/crs/misc/R42696.pdf. 26 Executive Office of the President, Economic Benefits of Increasing Electric Grid Resilience to Weather Outages.
(Washington, DC: Executive Office of the President, 2013). Available at
http://energy.gov/sites/prod/files/2013/08/f2/Grid Resiliency Report_FINAL.pdf. 27 U.S. Department of Energy, Hardening and Resiliency. U.S. Energy Industry Response to Recent Hurricane
Seasons. (Washington, DC: U.S. Department of Energy, 2010). Available at
http://energy.gov/sites/prod/files/Enery%20Industry%20Response%20to%20Recent%20Hurricane%20Seasons%20-
%20August%202010.pdf 28 Federal Energy Regulatory Commission and the North American Electric Reliability Corporation, Transmission
Facility Outage during the Northeast Snowstorm, October 29–30, 2011, Causes and Recommendations
(Washington, DC: Federal Energy Regulatory Commission and the North American Electric Reliability
Corporation, 2012). Available at www.nerc.com/news/Headlines%20DL/NE%20Outage%20Report-05-31-12.pdf. 29 SCOR, Seasonal Hurricane Forecast Skill and Relevance to the (Re)insurance Industry. (Paris: SCOR, 2014).
Available at www.scor.com/PandC_docs/pc_nl_hurricanes_0614.pdf. 30 “Near-Normal Atlantic Hurricane Season is Most Likely This Year,” National Oceanic and Atmospheric
Administration, accessed May 27, 2016, www.noaa.gov/near-normal-atlantic-hurricane-season-most-likely-year. 31 “Forecast of Atlantic Hurricane Activity, 2016,” Colorado State University, accessed May 27, 2016,
http://tropical.atmos.colostate.edu/forecasts/2016/apr2016/apr2016.pdf. 32 “Hurricane Research,” National Oceanic and Atmospheric Administration, accessed May 26, 2016,
http://research.noaa.gov/InDepth/Features/CurrentFeature/TabId/728/ArtMID/1884/ArticleID/11739/Hurricane-
Forecasting.aspx. 33 “Forecast Verification,” National Hurricane Center, accessed May 26, 2016,
http://www.nhc.noaa.gov/verification/verify5.shtml . 34 “Spring 2016 Seasonal Tornado Outlook,” U.S. Tornadoes, accessed May 26, 2016,
www.ustornadoes.com/2016/03/01/spring-2016-seasonal-tornado-outlook/ 35 Melillo, J.M., Richmond, T. C. and Yohe, G.W., Climate Change Impacts in the United States: The Third
National Climate Assessment. (Washington, DC: U.S. Global Change Research Program, 2014). Available at
http://nca2014.globalchange.gov 36 Expert judgment of author team.

48
37 Energy Information Administration, Monthly Energy Review – August, 2014. (Washington, DC: U.S. Department
of Energy, Energy Information Administration, 2014). Available at
http://www.eia.gov/totalenergy/data/monthly/archive/00351408.pdf 38 “The California Drought,” U.S. Geological Society, accessed June 26, 2016,
http://ca.water.usgs.gov/data/drought/. 39 “Electricity Monthly”, Energy Information Administration, U.S. Department of Energy, accessed June 26, 2016,
www.eia.gov/electricity/monthly/. 40 Cayan, D.R., S.A. Kammerdiener, M.D. Dettinger, J.M. Caprio, and D.H. Peterson, “Changes in the onset of
spring in the western United States,” Bulletin of the American Meteorology Society, 82(3) (2001): 399-415. 41 Scanlong, B.R., Duncan, I., Reedy, R.C. “Drought and the water-energy nexus in Texas,” Environmental
Research Letters, 8 (2013): 1-14. 42 Poch, L. A., Conzelmann, G., Veselka, T. D., An Analysis of the Effects of Drought Conditions on Electric Power
Generation in the Western United States, April 2009, DOE/NETL‐2009/1365. (Pittsburgh: National Energy
Technology Laboratory, 2009). Available at http://ceeesa.es.anl.gov/pubs/63599.pdf 43 Woodhouse, C.A., D.M. Meko, G.M. MacDonald, D.W. Stahle, and E.R. Cook, “A 1,200-year perspective of 21st
century drought in southwestern North America,” Proceedings of the National Academy of Sciences, 107(2010):
21283-21288. 44 “How Do Combustion Turbines Work,” Duke Energy, accessed June 26, 2016, www.duke-energy.com/about-
energy/generating-electricity/oil-gas-fired-how.asp. 45 U.S. Government Accountability Office, Energy-Water Nexus. (Washington, DC: Government Accountability
Office, 2009). Available at www.gao.gov/assets/300/296960.pdf. 46 “ENSO and Drought Forecasting,” University of Nebraska-Lincoln, accessed June 26, 2016,
http://drought.unl.edu/droughtbasics/ensoandforecasting.aspx 47 “U.S. Drought Monitor,” University of Nebraska-Lincoln, accessed June 26, 2016,
http://droughtmonitor.unl.edu/. 48 Walsh, J., D. Wuebbles, K. Hayhoe, J. Kossin, K. Kunkel, G. Stephens, P. Thorne, R. Vose, M. Wehner, J. Willis,
D. Anderson, S. Doney, R. Feely, P. Hennon, V. Kharin, T. Knutson, F. Landerer, T. Lenton, J. Kennedy, and R.
Somerville, “Ch. 2: Our Changing Climate” in Climate Change Impacts in the United States: The Third National
Climate Assessment, ed., J.M. Melillo, Terese (T.C.) Richmond, and G. W. Yohe (Washington, DC: U.S. Global
Change Research Program, 2014): 19-67. Available at
http://s3.amazonaws.com/nca2014/low/NCA3_Full_Report_02_Our_Changing_Climate_LowRes.pdf?download=1 49 Averyt, K., J. Fisher, A. Huber-Lee, A. Lewis, J. Macknick, N. Madden, J. Rogers, and S. Tellinghuisen,
Freshwater use by U.S. Power Plants: Electricity’s Thirst for a Precious Resource. A Report of the Energy and
Water in a Warming World Initiative. (Cambridge: Union of Concerned Scientists, 2011)Available at
www.ucsusa.org/assets/documents/clean_energy/ew3/ew3-freshwater-use-by-us-power-plants.pdf. 50 Tellinghuisen, S., A Powerful Thirst. Managing the Electricity Sector’s Water Needs and the Risk of Drought.
(Boulder: Western Resource Advocates, 2012) Available at
www.westernresourceadvocates.org/media/pdf/powerfulthirstreport2012.pdf 51 “Today in Energy,” Electricity Information Administration, accessed July 13, 2012,
http://www.eia.gov/todayinenergy/detail.cfm?id=7090 52 North American Electric Reliability Corporation, 2013 Special Reliability Assessment: Accommodating an
Increased Dependence on Natural Gas for Electric Power. (Atlanta and Washington, DC: North American Electric
Reliability Corporation, 2013). Available at
www.nerc.com/pa/RAPA/ra/Reliability%20Assessments%20DL/NERC_PhaseII_FINAL.pdf. 53 North American Electric Reliability Corporation, Assessment of Previous Severe Winter Weather Reports 1983-
2011. (Atlanta and Washington, DC: North American Electric Reliability Corporation, 2013). Available at
www.nerc.com/pa/rrm/ea/February%202011%20Southwest%20Cold%20Weather%20Event/Final_Draft_Assessme
nt_of_Previous_Severe_Winter_Weather_Report.pdf 54 Federal Energy Regulatory Commission, Outages and Curtailments during the Southwest Cold Weather Event of
February 1-5, 2011. (Washington, DC: Federal Energy Regulatory Commission, 2011). Available at
www.ferc.gov/legal/staff-reports/08-16-11-report.pdf 55 “Seasonal Forecast Discussion,” Climate Prediction Center, National Oceanographic and Atmospheric
Administration, accessed June 26, 2016,
http://www.cpc.ncep.noaa.gov/products/predictions/long_range/fxus05.html
49
56 “WPC Probabilistic Winter Precipitation Guidance,” Weather Prediction Center, National Weather Service,
accessed June 26, 2016,
http://origin.wpc.ncep.noaa.gov/pwpf/wwd_accum_probs.php?ftype=probabilities&fpd=24&ptype=icez. 57 North American Electric Reliability Corporation, 2014 Polar Vortex Review. (Washington, DC: National
Association of Regulatory Utility Commissioners, January 16, 2014). Available at
hwww.narucmeetings.org/Presentations/MoonNERC Polar Vortex Presentation NARUC Final.pdf. 58 “ISO New England Winter Program Payment,” ISO New England, accessed June 26, 2016, http://www.iso-
ne.com/markets-operations/markets/winter-program-payment-rate 59 Merrill, H.M., and J. Feltes, "Transmission icing: A physical risk with a physical hedge." Power Engineering
Society General Meeting, 2006. Available at www.merrillenergy.com/Icing31.pdf. 60 “Short-Range Ensemble Forecast (SREF) Derived Winter Weather Impact Graphics,” Weather Prediction Center,
National Weather Service, accessed June 26, 2016, http://www.wpc.ncep.noaa.gov/wwd/impactgraphics/ 61 Federal Emergency Management Agency, Electrical Transmission and Distribution Mitigation: Loss Avoidance
Study, FEMA-1674-DR-KS and FEMA-1675-DR-NE. (Washington, DC: Federal Emergency Management Agency,
2008). Available at http://www.fema.gov/media-library-data/20130726-1728-25045-
3899/electrical_transmission_loss_avoidance_study.pdf 62 Dirks J.A., W.J. Gorrissen, J.E. Hathaway, et al., "Impacts of Climate Change on Energy Consumption and Peak
Demand in Buildings: A Detailed Regional Approach,” Energy 79(1) (2015): 20-32. 63 “Climate at a Glance,” National Oceanic and Atmospheric Administration, accessed July 29, 2016,
http://www.ncdc.noaa.gov/cag/time-series/us. 64 Houser, T., Hsiang, S.M. Kopp, R.E., Larsen, K., Delgado, M., Jina, A.S., Mastrandrea, M.D., Mohan, S., Muir-
Wood, R., Rasmussen, D.J., Rising, J., and Wilson, P., Economic Risks of Climate Change: An American
Prospectus (New York: Columbia University Press, 2015). 65 International Organization for Standardization, Natural Gas. Standard Reference Conditions, ISO 13443:1996.
(Geneva: International Organization for Standardization, 1996). 66 Bastianen, M., “Multi-Stage Turbine Inlet Cooling for Increased Efficiency,” Turbine Inlet Cooling Association
Meeting, Naperville, IL, June 2013. 67 Vine, E., Adaptation of California’s Electricity Sector to Climate Change. (San Francisco: Public Policy Institute
of California, 2008). Available at www.ppic.org/content/pubs/report/R_1108EVR.pdf. 68 National Infrastructure Simulation and Analysis Center, Infrastructure Impact Assessment: Potential Impacts to
the California Electric Grid from the Current Drought. (Albuquerque: National Infrastructure Simulation and
Analysis Center, Sandia National Laboratory, 2014). 69 “U.S. Hazards Outlook,” Climate Prediction Center, National Weather Service, accessed June 26, 2016,
http://www.cpc.ncep.noaa.gov/products/predictions/threats/threats.php . 70 “Experience Database,” Turbine Inlet Cooling Association, accessed August 17, 2016,
www.turbineinletcooling.org/database.html. 71 McPherson, T.N., et al, Regional Consequence Assessment Report, Green River Valley. (Los Alamos: Los
Alamos National Laboratory, 2010). 72 National Infrastructure Simulation and Analysis Center, Analysis of Population, Infrastructure, and Economic
Impacts Resulting from Morganza Spillway Flooding. (Albuquerque: National Infrastructure Simulation and
Analysis Center, Sandia National Laboratory, 2011). 73 “NWS North Central River Forecast Center,” National Weather Service, accessed August 17, 2016,
http://www.weather.gov/ncrfc/. 74 “WaterWatch,” U.S. Geologic Survey, accessed August 17, 2016, http://waterwatch.usgs.gov/?id=ww_flood. 75 Boggess, J.M., Becker, G.W., and Mitchell, M.K., “Storm & Flood Hardening of Electric Substations” (Paper
presented at the IEEE Transmission & Distribution Conference & Exposition, Chicago, IL, 15 April, 2014).
Available at http://www.ieee-pes.org/presentations/td2014/td2014p-000564.pdf 76 The GridWise Alliance, Improving Electric Grid Reliability and Resilience: Lessons Learned from Superstorm
Sandy and Other Extreme Events, Workshop Summary and Key Recommendations. (Washington, DC: The
GridWise Alliance, 2013). Available at
www.gridwise.org/documents/ImprovingElectricGridReliabilityandResilience_6_6_13webFINAL.pdf. 77 Sathaye, J., Dale, L., Larsen, P., and Fitts, G., Estimating Risk to California Energy Infrastructure from Projected
Climate Change. (Berkeley: Lawrence Berkeley National Laboratory, 2011). Available at
http://www.osti.gov/scitech/servlets/purl/1026811

50
78 U.S. Department of Energy, Energy Assurance Daily, September 16, 2015(Washington, DC: U.S. Department of
Energy, 2015). Available at https://www.oe.netl.doe.gov/docs/eads/ead091515.pdf 79 National Interagency Fire Center, National Significant Wildland Fire Potential Outlook. Outlook Period – July,
August and September through October, 2016. (Boise: National Interagency Fire Center, 2016). Available at
http://www.predictiveservices.nifc.gov/outlooks/monthly_seasonal_outlook.pdf 80 “Year-to-Date Statistics 2015,” National Interagency Fire Center, accessed July 14, 2016,
http://www.nifc.gov/fireInfo/fireInfo_stats_totalFires.html 81 U.S. Department of Energy, Effect of Sea Level Rise on Energy Infrastructure in Four Major Metropolitan Areas.
(Washington, DC: Office of Electricity Delivery and Energy Reliability, U.S. Department of Energy, 2014).
Available at http://energy.gov/sites/prod/files/2014/10/f18/DOE-OE_SLR%20Public%20Report_Final%20_2014-
10-10.pdf 82 Sweet, W.V., and Marra, J.J., 2015 State of Nuisance Tidal Flooding. (Washington, DC: Center for Operational
Oceanographic Products and Services and National Centers for Environmental Information, National Oceanic and
Atmospheric Administration, 2016). Available at https://www.ncdc.noaa.gov/monitoring-
content/sotc/national/2016/may/sweet-marra-nuisance-flooding-2015.pdf 83 Maloney, M.C., and Preston, B.L., “A geospatial dataset for US hurricane storm surge and sea-level rise
vulnerability: Development and case study applications,” Climate Risk Management, 2 (2014): 26-41. 84 Titus, J.G., Rolling Easements. (Washington, DC: Climate Ready Estuaries Program, U.S. Environmental
Protection Agency, 2011). Available at
https://www.epa.gov/sites/production/files/documents/rollingeasementsprimer.pdf. 85 Federal Emergency Management Agency, Earthquake Resistant Construction of Electric Transmission and
Telecommunication Facilities Serving the Federal Government Report. (Washington, DC: Federal Emergency
Management Agency, 1990). Available at www.fema.gov/media-library-data/20130726-1505-20490-2834/fema-
202.pdf. 86 “Earthquake Hazards Program, Lower 48 Maps and Data,” U.S. Geological Survey, accessed June 26, 2016,
http://earthquake.usgs.gov/hazards/products/conterminous/index.php#2014 87 National Infrastructure Simulation and Analysis Center, Analytical Baseline Study for the Cascadia Earthquake
and Tsunami. (Washington, DC: Office of Infrastructure Protection, U.S. Department of Homeland Security, 2011).
Available at https://www.bluestonehockley.com/wp-content/uploads/2016/01/FEMA-earthquake-study.pdf 88 “1 Day, Magnitude 2.5+ Worldwide,” U.S. Geologic Survey, accessed June 26, 2016,
http://earthquake.usgs.gov/earthquakes/map/ 89 Electric Power Research Institute, Evaluation of Seismic Hazards at Central and Eastern U.S. Nuclear Power
Sites. (Palo Alto: Electric Power Research Institute, 2011). Available at
http://www.epri.com/abstracts/Pages/ProductAbstract.aspx?ProductId=000000000001023389 90 U.S. Geologic Survey, 2016 One-Year Seismic Hazard Forecast for the Central and Eastern United States form
Induced and Natural Earthquakes. (Washington, DC: U.S. Geologic Survey, 2016). Available at
http://pubs.usgs.gov/of/2016/1035/ofr20161035ver1_1.pdf 91 Space Studies Board, Severe Space Weather Events--Understanding Societal and Economic Impacts: A Workshop
Report. (Washington, DC: National Academies Press, 2008). Available at
www.nap.edu/openbook.php?record_id=12507&page=R1 92 Lloyd’s, Solar Storm Risk to the North American Electric Grid. (London: Lloyd’s, 2013). Available at
www.lloyds.com/~/media/lloyds/reports/emerging%20risk%20reports/solar%20storm%20risk%20to%20the%20nor
th%20american%20electric%20grid.pdf. 93 “27-Day Outlook of 10.7 cm Radio Flux and Geomagnetic Indices,” Space Weather Prediction Center, National
Oceanic and Atmospheric Administration, accessed June 26, 2013, http://www.swpc.noaa.gov/products/27-day-
outlook-107-cm-radio-flux-and-geomagnetic-indices. 94 “Aurora – 30 Minute Forecast,” Space Weather Prediction Center, National Oceanic and Atmospheric
Administration, accessed June 26, 2013, http://www.swpc.noaa.gov/products/aurora-30-minute-forecast 95 North American Electric Reliability Corporation, 2012 Special Reliability Assessment Interim Report: Effects of
Geomagnetic Disturbances on the Bulk Power System. (Atlanta and Washington, DC: North American Electric
Reliability Corporation , 2012). Available at
http://www.nerc.com/pa/RAPA/ra/Reliability%20Assessments%20DL/2012GMD.pdf 96 North American Electric Reliability Corporation, Geomagnetic Induced Current (GIC) Mitigation System
Summary for the White Paper. (Atlanta and Washington, DC: North American Electric Reliability Corporation , not
dated). Available at

51
www.nerc.com/comm/PC/Geomagnetic%20Disturbance%20Task%20Force%20GMDTF%20DL/NERC%20Mitigat
ion%20System%20Summary%20for%20White%20Paper%20-%20Final.pdf 97 North American Electric Reliability Corporation, TPL-007-1: Transmission System Planned Performance During
Geomagnetic Disturbances. (Atlanta and Washington, DC: North American Electric Reliability Corporation , 2014).
Available at
http://www.nerc.com/pa/Stand/Project201303GeomagneticDisturbanceMitigation/tpl_007_1_20140421_clean.pdf 98 “Geomagnetically Induced Current (GIC),” PowerWorld Corporation, accessed June 26, 2016,
http://www.powerworld.com/products/simulator/add-ons-2/simulator-gic 99 Rivera, M., and Backhaus, S., Review of the GMD Benchmark Event in TPL-007-1, LA-UR-15-25609. (Los
Alamos: Los Alamos National Laboratory, 2015). Available at
http://www.energy.gov/sites/prod/files/2015/09/f26/TPL-007-1%20Review_LANL_2015_09_14.pdf 100 American Public Power Association, Evaluation of Data Submitted in APPA’s 2015 Distribution System
Reliability & Operations Survey. (Arlington: American Public Power Association, 2016). Available at
http://www.publicpower.org/files/PDFs/2015DSReliabilityAndOperationsReport_FINAL.pdf 101 Energy and Environmental Economics, Inc., The Costs of Wildlife-Caused Power Outages to California’s
Economy, CEC-500-2005-030. (San Francisco: California Energy Commission, Public Interest Energy Research
Program,. San Francisco, 2005). Available at http://www.energy.ca.gov/2005publications/CEC-500-2005-030/CEC-
500-2005-030.PDF 102 Atkinson, W., “Wildlife-related outages,” Public Power, 72(2) (2014). Available at
http://www.publicpower.org/Media/magazine/ArticleDetail.cfm?ItemNumber=40367 103 National Research Council, Terrorism and the Electric Power Delivery System. (Washington, DC: National
Academies Press, 2012). 104 North American Electric Reliability Corporation, Physical Security, CIP-014-1. (Atlanta and Washington, DC:
North American Electric Reliability Corporation, 2014). Available at
http://www.nerc.com/pa/Stand/Reliability%20Standards/CIP-014-1.pdf 105 North American Electric Reliability Corporation, Security Guideline for the Electric Sector: Physical Security.
Atlanta and Washington, DC: North American Electric Reliability Corporation, 2012). Available at
www.nerc.com/comm/CIPC/Security%20Guidelines%20DL/Physical%20Security%20Guideline%202012-05-18-
Final.pdf. 106 ABB, Five Steps to Substation Physical Security and Resiliency. (Cary: ABB, 2015). Available at
https://library.e.abb.com/public/e8924c3fb5c5400a8890a8c88b6533b5/ABB%205%20Steps%20to%20Substation%
20Physical%20Security.pdf 107 G.C. Wilshusen, Cybersecurity – Challenges in Securing the Electricity Grid, GAO-12-926T. (Washington, DC:
U.S. Government Accountability Office, 2012). Available at http://www.gao.gov/assets/600/592508.pdf 108 C.-C. Liu, S. McArthur, and S.-J. Lee, Smart Grid Handbook. (New York: John Wiley & Sons, Ltd., 2016). 109 R.J. Campbell, Cybersecurity Issues for the Bulk Power System, R43989. (Washington, DC: Congressional
Research Service, 2015). 110 A. Abel, P.W. Parfomak, and D.A. Shea, Electric Utility Infrastructure Vulnerabilities: Transformers, Towers,
and Terrorism, R42795. (Washington, DC: Congressional Research Service, 2004). Available at
https://www.fas.org/sgp/crs/homesec/R42795.pdf 111 FireEye, Inc., Overload: Critical Lessons from 15 Years of ICS Vulnerabilities. (Milpitas: FireEye Inc., 2016).
Available at https://www2.fireeye.com/rs/848-DID-242/images/ics-vulnerability-trend-report-final.pdf 112 Admiral Michael S. Rogers, U.S. Navy, Commander, U.S. Cyber Command, Director, National
Security Agency, Chief, Central Security Service, Remarks at the 2016 RSA Conference, March 1, 2016.
Transcript available at https://www.rsaconference.com/events/us16/agenda/sessions/2751/remarks-by-
admiral-michael-s-rogers-u-s-navy 113 Lloyd’s, Business Blackout. The Insurance Implications of a Cyber Attack on the US Power Grid. Emerging Risk
Report – 2015. (Cambridge: Lloyd’s and the Center for Risk Studies, University of Cambridge, 2015). Available at
http://cambridgeriskframework.com/getdocument/29 114 U.S. Department of Homeland Security, NCCIC/ICS-CERT Industrial Control Systems Assessment Summary
Report, FY2015. (Washington, DC, U.S. Department of Homeland Security, 2015). Available at https://ics-cert.us-
cert.gov/sites/default/files/Annual_Reports/FY2015%20Industrial%20Control%20Systems%20Assessment%20Sum
mary%20Report_S508C.pdf
52
115 Barnes, P.R., McConnell, B.W., Van Dyke, J.W., Tesche, F.M., and Vance, E.F., Electromagnetic Pulse
Research on Electric Power Systems: Program Summary and Recommendations, ORNL-768. (Oak Ridge: Oak
Ridge National Laboratory, 1993). Available at http://www.osti.gov/scitech/servlets/purl/6721434-3paxB8/ 116 Ribrant, J., and Bertling, L., “Survey of Failures in Wind Power Systems with Focus on Swedish Wind Power
Plants during 1997-2005” (Paper presented at the Power Engineering Society General Meeting, Tampa, FL, 24-28
June 2007). 117 Hacke, P., Trudell, D., Terwillinger, K., Bosco, N., Gelak, E., and Kurtz, S., Application of the NREL Test-to-
Failure Protocol for PV Modules, NREL/CP-5200-46374. (Golden: National Renewable Energy Laboratory, 2011).
Available at http://www.nrel.gov/docs/fy11osti/46374.pdf 118 Willis, H.H., and Loa, K., Measuring the Resilience of Energy Distribution Systems. (Santa Monica: RAND
Corporation, 2015). Available at
http://www.rand.org/content/dam/rand/pubs/research_reports/RR800/RR883/RAND_RR883.pdf 119 Molyneaux, L., L. Wagner, C. Froome, and J. Foster, “Resilience and Electricity Systems: A Comparative
Analysis,” Energy Policy, 47 (2012) 188-201. 120 American Society of Civil Engineers, Failure to Act: The Economic Impact of current Investment Trends in
Electricity Infrastructure. (Reston: American Society of Civil Engineers, 2013). Available at
http://www.asce.org/uploadedFiles/Issues_and_Advocacy/Our_Initiatives/Infrastructure/Content_Pieces/failure-to-
act-electricity-report.pdf 121 Barrett, J.M., J. Harner, and J. Thorne, Ensuring the Resilience of the U.S. Electrical Grid. (Arlington: Lexington
Institute, 2013). 122 Edison Electric Institute, Infrastructure Resilience and Vulnerabilities – Cyber, Physical, Climate,
Interdependencies: Comments of the Edison Electric Institute to the Quadrennial Energy Review (Washington, DC:
U.S. Department of Energy, 2014). Available at
http://energy.gov/sites/prod/files/2015/03/f20/Edison%20Electric%20Institue%20Comments%20and%20Resources-
%20QER%20-%20Enhancing%20Infrastructure%20Resiliency%20FINAL.pdf 123 International Standards Organization, ISO 22301:2012 Societal security -- Business continuity management
systems --- Requirements. (Geneva: International Standards Organization, 2012). Available at
http://www.iso.org/iso/catalogue_detail?csnumber=50038 124 British Standards Institute, BS 25999-1: Business Continuity Management—Part 1: Code of Practice (London:
British Standards Institute, 2006). Available at https://www.pea.co.th/BCM/DocLib/BS_25999-1.pdf 125 ASIS International, ASIS SPC.1-2009: Organizational Resilience: Security, Preparedness, and Continuity
Management Systems—Requirements with Guidance for Use (Alexandria: ASIS International, 2009). Available at
https://www.ndsu.edu/fileadmin/emgt/ASIS_SPC.1-2009_Item_No._1842.pdf 126 ISO 22301 has become the industry standard for business continuity management since May 2012. 127IPCC, Managing the Risks of Extreme Events and Disasters to Advance Climate Change Adaptation. A Special
Report of Working Groups I and II of the Intergovernmental Panel on Climate Change, Field, ed., C.B., V. Barros,
T.F. Stocker, D. Qin, D.J. Dokken, K.L. Ebi, M.D. Mastrandrea, K.J. Mach, G.-K. Plattner, S.K. Allen, M. Tignor,
and P.M. Midgley. (Cambridge and New York: Cambridge University Press, 2012), 582 pp.