ghana: electricity corporation of ghana (ecg); appraisal...
TRANSCRIPT

Report No. 1196a-GH
Ghana: Electricity Corporation of Ghana (ECG);Appraisal of the Third Power ProjectMarch 1, 1977
Regional Projects DepartmentWestern Africa Regional Office FILE CO%pyFOR OFFICIAL USE ONLY
Document of the World Bank
This document has a restricted distribution and may be used by recipientsonly in the performance of their official duties. Its contents may nototherwise be disclosed without World Bank authorization.
Pub
lic D
iscl
osur
e A
utho
rized
Pub
lic D
iscl
osur
e A
utho
rized
Pub
lic D
iscl
osur
e A
utho
rized
Pub
lic D
iscl
osur
e A
utho
rized
Pub
lic D
iscl
osur
e A
utho
rized
Pub
lic D
iscl
osur
e A
utho
rized
Pub
lic D
iscl
osur
e A
utho
rized
Pub
lic D
iscl
osur
e A
utho
rized

CURRENCY EQUIVALENTS
uS$ 1 = Cedi (0) 1.15Cedi (0) 1 = us$ o.869Cedi (¢) 1 = Pesewas (P) 100Cedi (0) 1 million u US$ 869,565
WEIGHTS AND MEASURES
1 Kilometer (km) o 0.621 mile (mi)1 Meter (m) 2= 3.281 feet (ft)1 Square kilometer (km ) = 0.386 square mile (mi2)1 Kilogram (kg) = 2.205 pounds (lb)1 Ton (1,000 kg) = 1.102 short ton (sh ton)
3) 0.984 long ton (lg ton)1 Barrel (bbl; 0.159 mi) = 42 US gallons (gal)1 Kilowatt (kW) = 1,000 Watts (W)1 Megawatt (MW) = 1,000 kW1 Gigawatt (GW) - 1,000,000 kW = 1,000 MW (=106 kW)1 Kilowatthour (kWh) = 1,000 Watthour (Wh)1 Gigawatthour (GWh) = 1,000,000 kWh = 1,000 M4h(=106 kWh)1 Kilovolt (kV) = 1,000 Volts (V)1 Kilovolt ampere = 1,000 Volt amperes (1 kVA)1 Megavolt ampere (MVA) = 1,000 kVA
GLOSSARY OF ABBREVIATIONS
GDP = Gross Domestic ProductKfW = Kreditanstalt far WiederaufbauVALCO = Volta Aluminum CompanyVRA = Volta River AuthorityECG = Electricity Corporation of GhanaCEB = Communaute Electrique du BeninEECI = Energie Electrique de la C6te d'IvoireSWEB = South Western Electricity Board
GOVERNMENT FISCAL YEAR
July 1 - June 30
ECG's FISCAL YEAR
Calendar Year

FOR OFFICIAL USE ONLY
GHANA
ELECTRICITY CORPORATION OF GHANA (ECG)
APPRAISAL OF A POWER PROJECT
TABLE OF CONTENTS
Page No.
SUMMARY AND CONCLUSIONS
1. INTRODUCTION . ....................................... 1
2. THE SECTOR ......................................... 1General Economic Background ................. 1Sector Organization ......................... 3Electric Service Coverage ................... 3The Market .................................. 4Existing Facilities ......................... 5Sector Planning ............................. 5Rural Electrification ....................... 6Tariffs ..................................... 7
3. THE PROJECT ......................................... 8Project Costs ...................... 9Project Financing ............. .. ............ 11Items for Bank/IDA Financing ....... .. ....... 11Procurement ....... ........... ............... 12Disbursement ............... .. ............... 12Project Execution ............. .. ............ 12Construction Schedule ........... .. .......... 12
4. JUSTIFICATION .................... .................. 12General ..................................... 12Consumption Forecast ........................ 13Least-Cost Solution ......................... 14Basis for Economic Evaluation .... ........... 14Rate of Return .............................. 15
5. THE BORROWER ..................... .................. 17Organization and Management ........ .. ....... 17Personnel ....... ............ ................ 18Training ................... ................. 18Operations ....... ......... .. ................ 18Accounting and Financial Planning ..... .. .... 19Billing and Receivables .......... .. ......... 19Inventories .................. ............... 19Audit ..................... .................. 20Insurance ....... ............ ................ 20
This document has a restricted distribution and may be used by recipients only in the performanceof their official duties. Its contsnts may not otherwise be disclosd without World Bank authorization.

II
6. FINANCES .. ..................................... 20Past Finances ..... ...................... 21Financing Plan .............. .. .......... 22Future Finances ............. .. .......... 23Fiscal Impact .............. .. ........... 25
7. AGREEMENTS REACHED ............................. 25
This report was prepared by Messrs. B.M. Thiam, S. Alber-Glanstaetten,J. Gilling and R.W. Bates.

LIST OF ANNEXES
1. Detailed Project Description
Attachment 1: Construction Schedule
2. Cost Estimate (by category of materials)
3. Cost Estimate (by component of expenditures)
4. Disbursement Schedule
5. Demand and Energy Requirements in Ghana 1970 - 81
6. Tariffs
Table 1: Scheduled Tariffs prior to October 1, 1976Table 2: Scheduled Tariffs since October 1, 1976Table 3: Outline of a Study to Analyse the Cost of Supply to
Different Consumers and the Tariffs Charged to DifferentConsumers in the System
7. Demand Forecasts, Rate of Return Calculations
Table 1: Incremental load ForecastsTable 2: Demand Forecasts, Rate of Return CalculationsTable 3: Benefit and Cost StreamsFigure 1: Generation and Distribution cost/kwh vs. Discount rateFigure 2: Costs and Benefits per Kwh incremental consumption
8. Organization Chart
9. Past and Future Finances:
Table 1: Income StatementsTable 2: Forecast Fund FlowsTable 3: Balance SheetsTable 4: Debt Service Schedule
10. Assumnptions Underlying Financial Forecasts
11. Performance Indicators
IBRD Maps Nos.: 1223012231306oR


GHANA
ELECTRICITY CORPORATION OF GHANA (ECG)
APPRAISAL OF THIRD POWER PROJECT
SUMMARY AND CONCLUSIONS
Introduction
i. The Ghana Government and Electricity Corporation of Ghana (ECG)have requested the Bank to help finance a further phase of development in thepower sector, comprising ECG's 1976-79 development project and priority itemsof the Government's rural electrification program; the works consist mainlyof expansion to the sub-transmission and distribution facilities; in addition,the project provides for improvements to ECG's operations and management.ECG is the Government-owned enterprise which distributes throughout the greaterpart of the country the electric energy that it purchases from the Volta RiverAuthority (VRA); however, in the remoter centers which have still not beenreached by the main VRA transmission network, ECG generates its own power.A Bank loan/IDA credit of US$ 18.0 million in total -- 50% loan and 50% credit --is proposed for the project; for the loan ECG would be the Borrower and theGovernment would be the Guarantor; for the credit, the Government would be therecipient and would relend it to ECG. The Government of Ghana is at the sametime requesting a Bank loan of US$ 39 million to help finance the next generatingstation at Kpong (see Appraisal Report 1299-a-GH). Previously, two IDA creditstotalling us$ 17.1 million were made to ECG; two Bank loans totalling US$ 53million were also made to VRA as participation in the construction of theAkosombo hydro-power plant. All these IDA and Bank operations were completedsatisfactorily and without undue delay. The Bank's audit observations on thesepast operations are being addressed in paras. 2.07, 5.06, 6.12 and 6.13.
Institutions
ii. Two organizations, VRA and ECG, are responsible for providingpublic supplies of power in Ghana. VRA was created under a special GovernmentAct in 1961 to construct and operate the Akosombo hydroplant on the Volta River;VRA supplies bulk power to ECG, to the smelter of the Volta Aluminum Co.,(VALCO) at Tema, to several gold, diamond,manganese and bauxite mining industries(the mines), to the township of Akosombo and to the Communaute Electrique duBenin (CEB); the latter supplies Togo and Benin. ECG, established in 1967,supplies electricity to ai consumers other than those supplied by VRA, requiringup to 30 MVA at a voltage-not exceeding 34.5 kV. As of December 31, 1974, ECGhad 138,000 consumers; of the total energy sold by ECG in 1974 (774 GWh),industrial consumers accounted for about 54%, residential consumers for 27% andcommercial consumers 17%, and other consumptions 2%.

- ii -
Tariffs
iii. To be able to establish a sound tariff policy, the marginal costof electricity supply at different locations, distribution voltage levels andtype of load of the ECG system should be determined. In order to achieve onthe average prices that would reflect the marginal cost of electricity inGhana, the present ECG tariffs would need to be increased by an average of 70%in real terms. A tariff increase of this order of magnitude would not befeasible in the short run. During negociations, it was agreed to complete apower sector study by June 1978 and to derive therefrom a tariff structurereflecting as closely as possible economic costs.
The project
iv. The project proposed for Bank/IDA financing comprises (a) about250 circuit km of 33 kV sub-transmission lines; about 6 circuit km of 11 kVlines with 11 MVA of distribution transformers; (b) about 32 km of low tension(380/220 V) distribution lines; (c) 11 new 33/11 kV substations with about150 MVA of transformer capacity; expansion of about 6 existing 33/11 substationswith 60 MVA of additional transformer capacity; (d) miscellaneous supplymaterials; (e) vehicles; and (f) US$ 46h,ooo of engineering services equivalentto 105 man-months at US$ 4,400 per man-months. Included in item (a) is asizeable component (18% of total project cost) for the rural electrificationscheme from Kumasi to Kumawu.
v. The project provides for the distribution of power in the Sefwi-Wiawso-Bibiani area which is expected to be fed from the VRA grid through an80 km 161 kV line to be constructed by VRA under the proposed third Bank loanto VRA (see appraisal report 1299-a-GH).
Project Costs
vi. The project is estimated to cost ¢ 30.7 (US$ 26.7) millionincluding a foreign exchange component of ¢ 20.7 (us$ 18.0) million. The costs,which include overall allowances for physical and price contingencies of 3.0%and 22.2% respectively, exclude import duties and other related charges;ECG is exempted from these charges. ECG called for bids in mid-July 1976,and bids were opened in mid-September 1976; this has allowed the project costestimates to be based on actual bid prices.
Project Financing
vii. A Bank loan/IDA credit of us$ 18.0 million in total (50% loanand 50% credit) is proposed; this would finance the foreign exchange componentof the project. The recipient of the credit would be the Government of Ghana,which would relend part of the proceeds to ECG at standard Bank terms. Totallocal costs amounting to about US$ 8.7 million equivalent would be financedby customer contributions and ECG's internally generated funds. Retroactivefinancing of up to US$ 1.5 million is recommended to cover the foreign exchangecomponent of initial payments for engineering consulting services for projectpreparation work and for project expenditures expected to be made before Loan/Credit signing.

- iii
Procurement
viii. Equipment supplies, erection and related services to be financedout of the proceeds of the proposed loan/credit would be procured underinternational competitive bidding in accordance with the Bank/IDA Guidelines,except for about US$ 500,000 equivalent of sub-transmission and distributionequipment and materials which for standardization reasons would be procuredfrom the suppliers of the equipment under the previous program; it isrecommended that the Bank agree to this procedure provided that the pricesare reasonably in line with those obtained for similar items under internationalcompetitive bidding.
Disbursement
ix. The proposed loan/credit would be disbursed against the CIF costof equipment and materials and the foreign exchange cost component of erectionand services. Disbursement for any locally manufactured purchases would bemade on the basis of 100% ex-factory. To allow sufficient time for thesubmission of final invoices, a closing date of December 31, 1980 is proposed.
Project Execution
x. ECG has hired the South Western Electricity Board, UK (SWEB) astheir consultants to assist them in the design and procurement, as well as thesupervision of the execution of the project. Construction of sub-transmissionlines and sub-stations will be executed by contractors; low tension facilitieswill be installed by ECG's own force. Contracts were awarded in February 1977;supplies would be delivered during 1977 and 1978, and construction would startlate in 1977 to early 1978 with phased completion from 1978 to the end of 1979.
Justification
xi. The average annual growth rate of total ECG consumption is forecastat 11% for the period 1975-1980 and 8% thereafter. This load growth willrequire expansion of VRA generating (Kpong) and transmission facilities alongwith reinforcement and expansion of the ECG distribution network. The proposedproject would (a) reinforce the distribution network to meet the increaseddemand of existing consumers and to connect new loads; (b) replace existingdiesel generators now run by ECG or by some industries for own use; and (c)provide for review and implementation of staff planning and training, revaluationof inventory and fixed assets, and a study of tariff structure and levels allneeded to improve ECG's efficiency and viability.
xii. The proposed subprojects constitute the least cost solution todeliver the load forecast for a period of 15 years when compared with reasonablealternatives, taking into account the standardization of voltages adopted inGhana and other local conditions such as the need for underground installationsin some congested areas.
xiii. Each subproject has been evaluated as part of an overall investmentprogram necessary to meet the long term load growth. This program includes

- iv -
generation, transmission and distribution. The return on investment has beenfound as the discount rate which equalizes eosts (capital and operating) andbenefits. Revenues for new consumptions, fuel savings for existing self-generation and other benefits of new consumption, would not reflect the realeconomic benefits in view of consumers' willingness to pay the higher costsof alternatives for at least part of the same service e.g. kerosene for cookingand lighting, candles, etc. Current tariffs are based on the lov cost ofAkosombo hydro-energy and do not allow consumers to reveal their willingnessto pay a price for electricity based on the now higher long run marginal costof Kpong.
xiv. Direct evaluation of benefits has been done whenever possible,such as the fuel substitution by electricity (water pumps, diesel generation,etc.). Otherwise, the present underevaluated tariffs have been used as a proxyof benefits, which would represent the most pessimistic rate of returnevaluation. On this basis, using a shadow exchange rate, of 1.7 cedis (1.48times the market rate) the resulting rate of return of the overall project is10%. If benefits not evaluated directly were assumed to be valued at marginalcost (70% greater than present tariffs and roughly comparable to 75% of tariffspaid in Liberia), the return of the overall project is about 14%.
Organization and Management
xv. ECG's management is generally competent. All senior staff havehad a long-term association with ECG; however, the position of Chief Engineerhas been vacant since 1971. This situation undoubtedly has had a negativeinfluence on ECG's operations. Maintenance is very often delayed; this resultsin frequent breakdowns and power failures, particularly in the low voltagegrids of Accra. ECG's operations are expected to improve under the Project.
Finances
xvi. Outside its own operations, ECG executes and operates ruralelectrification schemes on behalf of the Government. While the Government hasregularly reimbursed the capital expenditures related to the schemes, it didnot do so for operating losses, although it had agreed to it. However, inNovember 1976, the Government undertook to pay past operating losses by theend of 1977.
xvii. Between 1968, ECG's first year of operation, and 1971, ECG'sfinancial performance was excellent. However, in 1972, ECG's financial perfor-mance commenced to deteriorate and since then profitability has shown seriousdecline; rate of return on partially revalued assets which was slightly belowthe required 8% in 1972 and 1973 fell to 3.3% in 1975. Following poor operatingresults, ECG's liquidity was reduced to such levels that the entity was unableto fully meet its debt service obligations in 1974 and 1975 in respect ofonlent IDA and Kreditanstalt fur Wiederaufbau (KfW) credits (IDA credits 118 &256-GH and KfW Credits I & II); the total amount unpaid at the end of 1975 wasabout US$ 6.2 million. During negotiations the Government confirmed that itagreed to extend final maturities of the IDA and KfW II Credits to 1982 and1984 respectively. The Government also agreed to ECG settling outstandingamounts of the IDA and KfW I Credits by the end of 1977.

v
xviii. ECG will be the Borrower for the Bank loan of US$ 9.0 millionand the Beneficiary of almost all of IDA Credit, In fact, the Governmentconfirmed during negotiations that of the US$ 9.0 million IDA Credit itwill retain US$ 100,000 for the power sector study (para. iii), it willonlend US$ 3.7 million relating to the Kumawu scheme on a grant basis andit will onlend the remaining US$ 5.2 million on standard Bank terms.
xix. The Government just approved ECG tariff increases of about 29%effective October 1, 1976. This action was taken in parallel with a 60%increase in VRA's bulk tariff to ECG, effective September 1, 1976. The newECG tariffs plus further tariff increases of 3-15% p.a. during 1978-1980are expected to restore ECG's liquidity and its rate of return performanceof 8% on revalued assets as stipulated under the previous Credit 256-GH andreconfirmed under the proposed Bank/IDA loans.
xx. ECG's financial position is expected to be excellent during theproject construction period. The level of Bank borrowing is more related toGhana's foreign exchange than ECG's own needs. Should the projected liquiditymaterialize, it was agreed that dividend payments would be made after ECG'sownl requirements, including contributions to investment needs, have been met.
xxi. Subject to agreement on the conditions set out in Chapter 7,the project is a suitable basis for a Bank loan and an IDA credit of US$ 9.0million each at standard terms.


GHANAElectricity Corporation of Ghana (ECG)
Third Power Project
1. INTRODUCTION
1.01 The Ghana Government and Electricity Corporation of Ghana (ECG)have requested the Bank to help finance a further phase of ECG's development,consisting mainly of expansion to the sub-transmission and distributionfacilities; and improvements to ECG's operations and management. ECG is theGovernment-owned enterprise responsible for electricity distribution to thegeneral public throughout Ghana. ECG distributes electric energy that itpurchases from the Volta River Authority (VRA) throughout the greater part ofthe country, however, in the remoter centers which have still not been reachedby the main VRA transmission network, ECG generates its own power.
1.02 A Bank loan/IDA credit of US$ 18.0 million in total (50% loanand 50% credit) is proposed; this would provide the foreign exchange needed(see para. 2.01) to meet part of ECG's 1976-79 development project and somepriority items of the Government's rural electrification program. This wouldbe the third Bank group operation to ECG, the fifth in Ghana's power sector.Tn 1968, IDA Credit 118-GH (us$ lo million) helped ECG to rehabilitate andexpand the distribution systems in Tema, Sekondi, Takoradi and Kumasi. In 1971,Credit 256-GH of US$ 7.1 million assisted ECG in financing (i) the furtherexpansion of all four main systems mentioned above, (ii) the installation ofnew systems, and (iii) the construction cf 33/11 kV lines and substations tointerconnect ECG's own systems and also connect ECG's systems with the VRAmain transmission system from Akosombo. The Bank has also participated in thefinancing of the construction of VRA's Akosombo hydropower plant through twoloans, 310-GH in 1962 for us$ 47 million and 618-GH in 1969 for US$ 6 million.All these IDA and Bank operations were completed satisfactorily and withoutundue delay. OED's audit comments on aspects of (i) merging the two powerauthorities, (ii) revaluation of assets, (iii) rate of return, and (iv) over-staffing are being addressed in paras 2.07, 5.06, 6.12 and 6.13 respectively.
1.03 The proposed Bank/IDA project is based on studies carried out bythe Borrower's own staff in 1975. The Bank and IDA were instrumental informulating the project through identification and pre-appraisal missions in1974-75. The appraisal of the project was carried out in November-December1975 and the present report has been prepared by Messrs. B.M. Thiam, S. Alber-Glanstaetten, J. Gilling and R.W. Bates.
2. THE SECTOR
General Economic Background
22.01 Ghana covers an area of about 240,000 km , extending about 400 kmfrom west to east between Ivory Coast and Togo, and about 700 km from northto south between the Sahelian country of Upper Volta and the Gulf of Guinea.In 1976, the population was about 9.8 million; this has been growing at an

- 2 -
average of about 2.6% per annum. Ghana's 1975 GNP is estimated at currentprices at about us$ 1460 which compares favorably with that of most other WestAfrican countries; recent GDP growth rates have been -3.8% in 1972, +4.6%in 1973 and +4.9% in 19714. Despite a rise in cocoa prices, Ghana's balanceof payments position deteriorated drastically in 1974; this was mainly due to(i) the four-fold increase in the oil import bill between 1973 and 1974,(ii) increases in the price of non-oil imports, and (iii) loosening of restric-tions on imports; the current account deficit in 1974 was about US$ 187 millioncompared to a surplus of US$ 128 million in 1973, and the overall deficit ofabout uS$ 187 million against US$ 145 million surplus in 1973. However, in1975, the current account deficit diminished to US$ 45 million and the overallsurplus was US$ 132 million.
2.02 The Government has issued general guidelines for a Five-YearDevelopment Plan covering the period 1976-80, pending the preparation of amore detailed plan; however, a 5.5% average GDP rate has been set. While theplan recognizes the country's dependence on a single commodity--cocoa-- whichaccounts for about 60% of the country's export earnings and 30% of Governmentrevenues, it also stresses the need for economic diversification, for which theavailability of a sufficient and reliable supply of electric energy representsa major ingredient. In this respect,Ghana has had a substantial advantage overmost of the other West African countries in that it has been possible throughthe utilization of the large hydro-power source of Akosombo on the Volta Riverto generate enough cheap power not only to supply a large aluminum smelter,but also to a large part of the country. This advantage became even morepronounced in recent years when large increases in fuel costs forced countriesusing oil to generate their electricity to increase dramatically the retailprice of their energy. Until the end of the present decade, Ghana shouldcontinue to benefit from electric energy at a cost far below those experiencedin most other West African countries. However, when the Akosombo output isfully absorbed by existing demand, and less economic hydro sources (e.g. theKpong hydro-plant downstream from Akosombo on the Volta River) have to be tapped,this particularly advantageous position will deteriorate.
2.03 Ghana's total hydroelectric potential is estimated at about 1,500MWl/ of which 882 MW (60%) is generated from the existing Akosombo hydro-plantgenerating facility. Although drilling (mainly off-shore) has been conducted,no oil resources have been discovered. Petroleum product consumption in 1975amounted to 800,000 metric tons; this was supplied from the Tema refinery, thecapacity of which is 1.4 million metric tons per year. Ghana does not haveany coal deposits, the forests do, however, contribute substantially to domesticneeds for charcoal.
1/ This hydro potential represents about 9,000 GWh/year, of which 5,400 GWhcorresponds to Akosombo.

-3-
Sector Organization
2.o4 Two organizations, the Volta River Authority (VRA) and theElectricity Corporation of Ghana (ECG) are responsible for providing publicsupplies of power in Ghana. The VRA supplies bulk power to ECG, to thesmelter of the Volta Aluminum Co. (VALCO) at Tema, to several gold, diamond,manganese and bauxite mining industries (the mines), to the township ofAkosombo and to Communaute Electrique du Benin (CEB), which supplies Togo andBenin. ECG is responsible for the distribution of power to all other consumersthroughout Ghana.
2.05 VRA was created under a special Government Act in 1961 in order toconstruct and operate the Akosombo hydro-plant on the Volta River. The Actprovides for a Board (appointed by the Head of State) consisting of a chairmanand seven members, including VRA's Chief Executive. The broad delegation ofpowers laid down in the Act enables VRA to take any action necessary to conductits affairs (electricity generation and bulk selling) in accordance with soundfinancial and public utility practices. In addition to generating and sellingbulk electricity, VRA is also responsible for some non-power activities(transport on Volta Lake, and research and development activities related tothe Volta Lake). Since its incorporation ten years ago, VRA has worked effi-ciently and has progressively improved its performance.
2.06 ECG supplies electricity to all consumers requiring up to 30 MVAat a voltage not exceeding 34.5 kV. As of December 31, 1974, ECG had a totalof 138,000 consumers. ECG's load in 1974 consisted of 54% industrial consumption,27% residential consumption, 17% commercial consumption, and 2% for otherconsumption. ECG's organization and overall management aspects (personnel,training, operations, Accounting System, billing, inventories) are fully analyzedin Chapter 5 and ECG's past and future finances in Chapter 6.
2.07 The feasibility of merging ECG and VRA has been under considerationoff and on since the mid-sixties. As by now both ECG and VRA have developedinto relatively mature organizations with distinctly different functions, amerger therefore is not expected to bring about major net benefits.
Electric Service Coverage
2.08 About 100 towns in Ghana receive a public power supply; with theexception of Akosombo which receives its supply from VRA, all towns are servedby ECG. Some 2.25 million people representing about 25% of the total populationlive in these towns and nearly half (i.e. 11-12% of the total Ghanaian popula-tion) live in a household with a connection. About 263,000 people live inrural communities with an electricity supply, representing about 4% of the totalrural population. Only some 10% of these (less than half of 1% of the totalrural population) have a connection.

-4 -
The Market
2.09 The total electric energy consumption and generation in 1974 1/
were as follows:% of total
GWh Consumption
ECGResidential 206 5.3
Commercial 128 3.3
Industrial 413 10.5
Other 23 0.7
Total ECG 770 19.8
VALCO 2,734 69.6
Mines 256 6.5
Akosombo Township & Textiles 30 o.8
CEB 128 3.3
Total Consumntion 3,918 100.0
Losses and own consumptionVRA 90ECG 102
192 4.6 2/Total Generation
of which 4_110VRA 4,076 99.2 2/
ECG (own generation) 25 0.6 2/
ECG (Rural electrification) 7 0.2 2/
As shown in Annex 5, during the period 1970-1975, total electricity consumptionincreased at an average of 6.5% per annum and ECG's consumption at 9.2% per
annum 3/. In 1974, ECG's consumption represented 21% of total consumption in
Ghana and in 1981, it is expected to be 30%.
1/ Figures corresponding to 1975 could not be considered as typical as they are
affected by a substantial decline (8%) in VALCO's consumption due to the
recession in the aluminum market.
2/ Referred to total generation.
3/ Annual growth rate of ECG's consumption for the 1970-1974 period was 10.2%
(see para. 4.03)
-5-
Existing Facilities
VRA
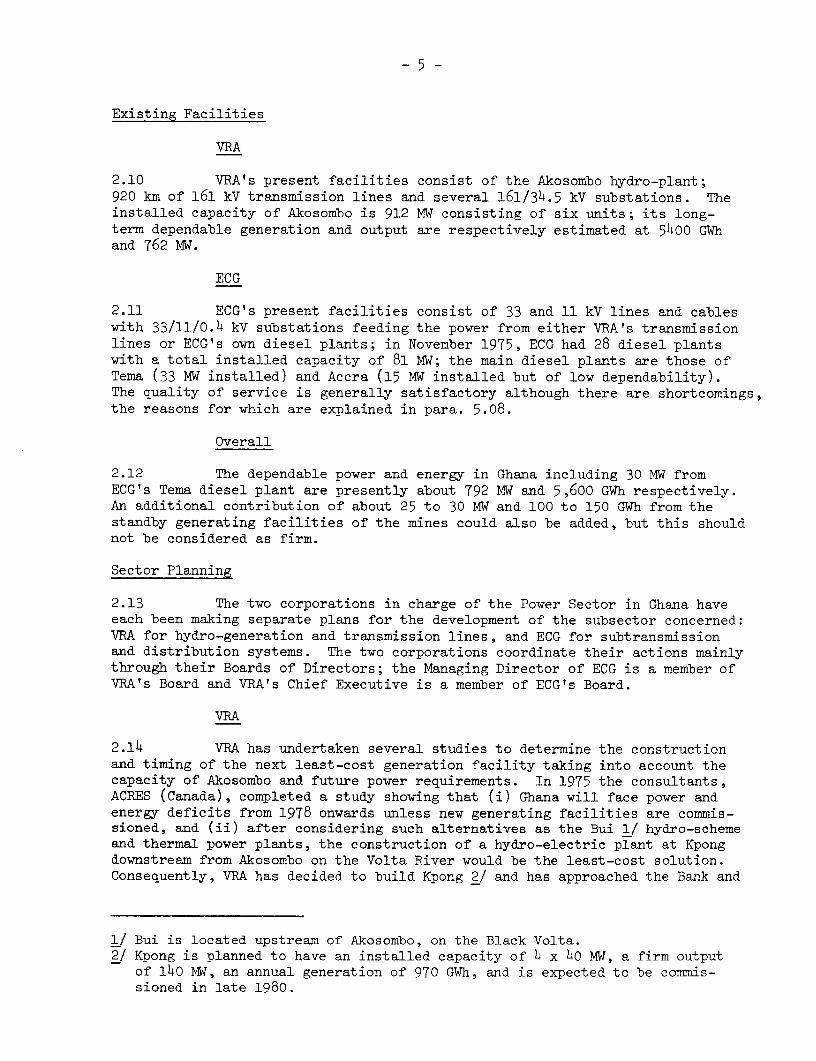
2.10 VRA's present facilities consist of the Akosombo hydro-plant;920 km of 161 kV transmission lines and several 161/34.5 kV substations. Theinstalled capacity of Akosombo is 912 MW consisting of six units; its long-term dependable generation and output are respectively estimated at 5400 GWhand 762 MW.
ECG
2.11 ECG's present facilities consist of 33 and 11 kV lines and cableswith 33/11/0.4 kV substations feeding the power from either VRA's transmissionlines or ECG's own diesel plants; in November 1975, ECG had 28 diesel plantswith a total installed capacity of 81 MW; the main diesel plants are those ofTema (33 MW installed) and Accra (15 MW installed but of low dependability).The quality of service is generally satisfactory although there are shortcomings,the reasons for which are explained in para. 5.08.
Overall
2.12 The dependable power and energy in Ghana including 30 MW fromECG's Tema diesel plant are presently about 792 MW and 5,600 GWh respectively.An additional contribution of about 25 to 30 MW and 100 to 150 GWh from thestandby generating facilities of the mines could also be added, but this shouldnot be considered as firm.
Sector Planning
2.13 The two corporations in charge of the Power Sector in Ghana haveeach been making separate plans for the development of the subsector concerned:VRA for hydro-generation and transmission lines, and ECG for subtransmissionand distribution systems. The two corporations coordinate their actions mainlythrough their Boards of Directors; the Managing Director of ECG is a member ofVRA's Board and VRA's Chief Executive is a member of ECG's Board.
VBA
2.14 VRA has undertaken several studies to determine the constructionand timing of the next least-cost generation facility taking into account thecapacity of Akosombo and future power requirements. In 1975 the consultants,ACRES (Canada), completed a study showing that (i) Ghana will face power andenergy deficits from 1978 onwards unless new generating facilities are commis-sioned, and (ii) after considering such alternatives as the Bui 1/ hydro-schemeand thermal power plants, the construction of a hydro-electric plant at Kpongdownstream from Akosombo on the Volta River would be the least-cost solution.Consequently, VRA has decided to build Kpong 2/ and has approached the Bank and
1/ Bui is located upstream of Akosombo, on the Black Volta.2/ Kpong is planned to have an installed capacity of 4 x 40 MW, a firm output
of 140 MW, an annual generation of 970 GWh, and is expected to be commis-sioned in late 1980.

several other agencies for the financing of the project; a third Bank loanto VRA is under consideration, mostly for the financing of the Kpong project.VRA, in collaboration with Energie Electrique de Cote d'Ivoire (EECI) 1/ isfurthermore studying the feasibility of an intertie with the Ivory Coast gridby 1979. If constructed, this would allow the exchange of power and energybetween the two countries and would result in substantial cost savings.Meanwhile, the feasibility study of the Bui hydro-electric project is underway.This would determine whether Bui is the least-cost alternative for electricitygeneration after Kpong.
2.15 As regards the transmission lines, VRA assisted by the Italianconsultant, Italconsult-CESI, has completed the study of the long-termdevelopment of the Ghanaian high voltage grid. The short and medium-termdevelopments of this grid consists of (i) an 80 km extension of the 161 kVgrid westward to the Sefwi-Wiawso-Bibiani area where one of the schemes of theproject is located; (ii) a 40 km/69 kV extension of the VRA grid from Asiekpeto Ho; (iii) a small 20 kV extension from Lome (Togo) to electrify the Ghanaiantownship of Aflao; (iv) reinforcement of VRA's substantions to take care oflocal load increases; (v) reactive power compensation in Prestea and Kumasi toreduce losses; and (vi) additional transmission facilities between Tema andAccra.
ECG
2.16 Distribution system planning is not normally done on long-termbasis; this is due to the uncertainties of the load growth pattern. For theshort and medium-term, the proposed project has been drawn up; in addition, ECGproposes to complete some relatively minor reinforcements and small extensionsto existing schemes.
Rural Electrification
2.17 Although there is no explicit long-term program of rural electri-fication 2/ for the country as a whole, the Government favors rural electrifi-cation in general and annually orders ECG to carry out specific works withinthe amounts available from the national budget 3/. ECG has been carrying out theGovernment's rural electrification requests, year after year without evaluatingand informing the Government about the financial and economic viability ofthese investments. During negotiations the Government agreed to exchange viewswith ECG on the financial and economic viability of rural electrificationprojects.
1/ EECI is the Electricity Corporation of Ivory Coast.
2/ ECG definition of "rural" is financial, and covers any scheme which is financeddirectly by the Government and for which ECG acts partly as an agent.
3/ For FY 1975/76, the Government has authorized capital expenditures of ¢ 4.8million (about US$4.2 million); more than half this amount is to supplypower from the VRA grid to Ho in the Volta region.

-7-
Tari ffs
2.18 Current electricity tariffs in Ghana are based on the low cost
of hydro-power supplied by VRA from the Akosombo dam. The era of cheap
electricity will end as successively more expensive hydro-plants at Kpong
(1980) and possibly Bui (1985) and thermal plants thereafter are brought
online. ECG's tariffs are based on the VRA bulk supply tariff plus the costs
of distribution and operation and are of two types (for details see Annex 6).
The small residential, commercial, and industrial consumers pay a simple kwh
charge in a declining block tariff. Large consumers pay a monthly maximum
demand charge and an energy charge per KWh which decreases with KWh consumption
per KVA of maximum demand.
2.19 Tariff restructuring and increases in level are needed to reflect
the incremental cost of power in Ghana. Examination of the power and energy
forecast in Annex 5 shows that the load factor of the VRA/ECG system is very
high (86% in 1974) and will continue to be high in the future (82% in 1985).
This is due to the significant proportion of the Valco aluminum smelter load
in the total system load. Because of this high load factor, the overall system
capacity is limited by hydro-energy capability (kWh) rather than by kW capacity.
In view of this, there is no need, for the time being, for a tariff structure
which distinguishes between peak and off-peak consumption or to encourage power
intensive industries.
2.20 Surplus hydro-energy at a zero marginal cost in the short run will
be available until 1985 given the present load forecast and commissioning date
of Kpong (year end 1980). While this surplus hydro-energy exists it should be
made available to industrial consumers for steam generation on an interruptible
basis at a price competitive with the cost of fuel oil. Consequently it will
provide benefits to Ghana equal to cost of fuel oil saved. On the other hand,
the existing special low tariffs for firm power to industrial consumers should
be eliminated because they lead to uneconomic utilization of electricity.
During negotiations, the Government and ECG agreed to eliminate the special low
tariffs for firm power to industrial consumers and replace them by the normal
industrial tariff at the expiration dates of the present contracts.
2.21 To be able to establish a sound tariff policy, the marginal cost
of electricity supply at different locations, distribution voltage levels and
typesof load of the ECG system should be determined. Given the ECG inadequate
information system, it is not possible to make a judgment on the cost of dis-
tributing electricity to the different classes of consumers. During negotiations
ECG agreed to undertake a study of these costs as part of an overall power sector
study as outlined in Annex 6 to establish a framework for future tariff policy.
In order to achieve on the average prices that would reflect the marginal cost
of electricity in Ghana, the present ECG tariffs would need to be increased by
an average of 70% in real terms. In view of this extremely large tariff
increase, it would not be feasible to implement marginal cost pricing in Ghana's
electricity power sector in the short run.

- 8 -
2.22 An allowance for the power sector study has been made in thecost estimate for consultants' services. The results of the study should bepresented for review by the Bank before June 30, 1978 with a view to derivetherefrom a tariff structure designed to reflect the marginal cost of power,taking into account social and wider economic considerations. This was con-firmed during negotiations.
3. THE PROJECT
3.01 The project proposed for Bank financing comprises the maincomponents listed below; further details are given in Annex 1.
(i) Subtransmission lines
About 230 circuit km of overhead and about 20 km of underground33 kV lines; about 6 circuit km of 11 kV overhead lines with about 11 MVA ofdistribution (33/0.4 kV and ll/0.4 kV) transformers mounted in such lines asdescribed in the Annex.
(ii) Distribution lines
About 32 km of low tension (380/220V) distribution lines.
(iii) Substations
11 new 33/11 kV substations with about 150 MVA of transformer capacity;expansion of about 6 existing 33/11 kV substations with about 60 MVA of addi-tional transformer capacity.
(iv) Miscellaneous supply materials
About US$ 2.6 million worth of miscellaneous equipment and materialfor rehabilitating the existing subtransmission and distribution system.
(v) Vehicles
About us$ 1.49 million worth of vehicles (heavy, medium and lighttrucks, station wagons) to replace and expand existing transportation facilities.This component would not have been considered in the project if ECG were notsuffering from the shortage of foreign currency in Ghana (more than 70% of ECG'sexisting service vehicles are at least four years old and need to be replaced).
(vi) Consultants' services
About us$ 464,000 in engineering services--equivalent to about 105man-months at US$ 4,400 per man-month--required for the execution of the project(see para. 3.10) and US$ 100,000 to cover two man years for the power sectorstudy (see para. 2.22).

- 9 -
3.02 The project provides for the supply of power to the Sefwi-Wiawso-Bibiani area (see Annex 1). This area is expected to be fed from theVRA grid through an 80 km 161 kV line to be constructed by VRA under the thirdBank loan which is now under consideration. It is important to achieve anadequate coordination between the construction of the Sefwi-Wiawso-Bibianischeme by ECG and that of the 161 kV line by VRA. In this respect, a letterof intent for the construction of this 161 kV line will be a condition ofdisbursement for that part of the proposed loan/credit financing the Sefwi-Wiawso-Bibiani scheme.
Project Costs
3.03 The project is estimated to cost ¢ 30.7 (uS$ 26.7) millionincluding a foreign exchange component of 0 20.7 (us$ 18.0) million. Thecosts which are summarized below and set out in detail in Annexes 2 and 3exclude import duties and other related charges. ECG is exempted from thesecharges.

- 10 -
Foreign Local Total Foreign Local Total % of--In million Cedis-- -- In million uS$-- Total
1. Aboso Glass Factory (7.5 kmof 33 kV double circuit lineand 2 x 33/11 kV substations) 0.9 o.4 1.3 0.8 o.4 1.2 4
2. Teshie Housing Program (5.7 kmof 33 kV double circuit line,4.7 km of 33 kV cable and1 x 33/11 kV substation) 1.3 o.6 1.9 1.1 0.5 1.6 6
3. Weija Waterworks (8.5 km of33 kV double circuit line,2 x 33 kV/11 kV substations) 1.1 0.5 1.6 0.9 0.5 1.4 5
4. Tema (3.7 km of 33 kV singlecircuit line, 11.2 km of 33 kVcable, 2 x 33/11 kV substations) 2.2 0.5 2.7 1.9 0.4 2.3 9
5. Sefwi-Wiawso Scheme (86.5 kmof 33 kV single circuit lineand 7 x 33/11 kV substations) 3.2 1.9 5.1 2.8 1.6 4.4 17
6. Kumasi-NSuta-Kumawu Scheme(91 km of 33 kV single circuitline, 4 x 33/11 kV substations) 3.2 2.0 5.2 2.8 1.7 4.5 17
7 Supply of materials (for spares,reinforcement of existing schemesand future development) 3.0 - 3.0 2.6 - 2.6 10
8. Supply of service vehicles 1.7 - 1.7 1.5 - 1.5 5
9. Engineering services 0.3 0.2 0.5 0.3 0.2 0.5 2
10. Total Base Line Cost 16.9 6.1 23.0 14.7 5.3 20.0 75
11. Physical Contingencies 0.7 0.2 0.9 o.6 0.2 0.8 3
12. Price Contingencies 3.1 3.7 6.8 2.7 3.2 5.9 22
13. Total Contingencies 3.8 3.9 7.7 3.3 3.4 6.7 25
14. TOTAL PROJECT COST 20.7 10.0 30.7 18.0 8.7 26.7 100
3.04 ECG has called for bids at mid-July 1976, and bids were opened inmid-September 1976; this has allowed the above cost estimates to be based onactual bid prices.

- 11 -
3.05 Since the various components of the project are well defined, a5% allowance for physical contingencies appears justified for the equipmentand materials to be used for these facilities. No such allowance has beenincluded for interchangeable items like small distribution equipment and servicevehicles; consequently, in relation to the total base line cost the overallallowance for physical contingencies amounts to 3.6%. Price contingencies havebeen allowed separately for foreign and local components 1/; the assumptionslead to an overall allowance for price contingencies of 28.2% on the base linecosts plus physical contingencies.
Project Financing
3.o6 A Bank loan/IDA credit of US$ 18.0 million in total (50% loanand 50% credit) is proposed; this would finance the foreign exchange componentof the project. The recipient of the IDA credit would be the Government ofGhana which would relend, at terms of the proposed Bank loan, part of the pro-ceeds to ECG which would also be the borrower of the Bank loan (see para. 6.07).Total local costs amounting to about US$ 8.7 million equivalent would be financedby customer contributions and ECG's internally generated funds. Retroactivefinancing is recommended for US$ 1.5 million to cover the foreign exchangecomponent of (i) initial payments for engineering consulting services and (ii)for payments related to letters of intent issued by ECG in February 1977 (seepara. 3.10).
Items for Bank/IDA Financing
3.07 The proposed Bank loan and IDA credit of US$ 9.0 million eachwould be applied as follows:
BANK LOAN IDA CREDIT(us$ - million)
I. Rural Scheme (Kumawu) - 2.9
II. Non rural schemesa) Equipment, materials, and vehicles 6.7 4.1b) Erection of lines and substations
and related works 0.5 0.3
III. Consultants 0.2 0.2
IV. Unallocated 1.6 1.5
Total 9.0 9.0
1/ For the'foreign component, the following rates were used 10% in 1976, 8% in1977-78, and 7% in 1980; for the local component the rates were 30% in 1976,18% in 1977, 1978, 1979, and 1980. The latter percentages were derived fromthe nature of works, i.e. erection of distribution equipment to be implemented.

- 12 -
Procurement
3.o8 Equipment, supplies, erection and related services to be financedout of the proceeds of the proposed loan/credit would be procured underinternational competitive bidding in accordance with the Bank's Guidelines,except for about US$ 500,000 equivalent of subtransmission and distributionequipment and materials which for standardization reasons would be procuredfrom the suppliers of the equipment under the previous program; it is recom-mended that the Bank and IDA agree to this procedure provided that the pricesare reasonably in line with those obtained for similar items under internationalcompetitive bidding.
Disbursement
3.09 The proposed loan/credit would be disbursed against the CIF costof equipment and materials and the foreign exchange cost component of erectionand services. Disbursement for any locally manufactured purchases would bemade on the basis of 100% ex-factory. The estimated schedule of disbursementis given in Annex 4. To allow sufficient time for the submission of finalinvoices, a closing date of December 31, 1980 is proposed.
Project Execution
3.10 As part of the project ECG has hired the South Western ElectricityBoard, UK, (SWEB) in accordance with terms of reference acceptable to the Bank,as their consultants to assist them in the design of the project items, thepreparation of tender documents, the tendering, the bid analysis, the preparationand administration of contracts, as well as the supervision of the executionof the project. Construction of subtransmission lines and related substationswill be executed by contractors and low tension facilities will be installedby ECG's own force. The preliminary design, the preparation of bidding documents,the opening of bids and their analysis have been completed late 1976. With theapproval of the Bank, ECG issued letters of intent within the bid's period ofvalidity and subsequently made the required payments (see also para. 3.06).
Construction Schedule
3.11 Contracts were awarded in February 1977; supplies would be deli-vered during 1977-78 and construction would start late in 1977 (and in early1978 for some items) with phased completion from 1978 to the end of 1979. Theattachment to Annex 1 shows the construction schedules for the main projectitems; these are based on past experience and are realistic.
4. JUSTIFICATION
General
4.ol In support of the Government's development policy (see para. 2.02),the power sector is gearing up to supply the required demand for electricity inthe medium term. This will require an expansion of the generating and transmission

- 13 -
capacity by VRA (Kpong and power transmission facilities) and provision byECG of the distribution facilities to support the forecast demand growth.Specifically, the Project would :
(a) extend and reinforce the subtransmission lines and distributionnetworks so as to meet the increased demand of existing consumersand new loads;
(b) replace diesel generated power by cheaper hydro-power by integratingto the main network isolated areas heretofore serviced either byECG itself or, in the case of some industries, by individually-ownedgenerating units; and
(c) provide for review and implementation of staff planning and training,revaluation of inventory and fixed assets and a study of tarifflevel and structure.
4.02 The economic justification which follows is based on the factthat (a) the individual sub-projects are required to serve the expected demandgrowth (para. 4.03) and (b) they constitute the least cost solution (para. 4.05).As indicated in para. 4.o8 it is not possible to evaluate the real rate ofeconomic return on this project, therefore, the attempts that have been madeto evaluate benefits based on the present prices of electricity in Ghana (para.4.11 through 4.13) are intended to demonstrate the inadequacy of the presenttariff levels vis-a-vis the marginal cost of electric power in Ghana. Tocorrect this situation it is proposed (a) to eliminate the present specialindustrial tariffs (see para. 2.20) which do not even cover the generating costof Kpong power and (b) to undertake a comprehensive power sector study (seepara. 2.22).
Consumption Forecast
4.03 The forecast of total ECG load growth is shown in Annex 5. Thisforecast is based on extrapolation of the past trends for each type of consumerand on the expected new consumer developments not included in the overalltrend, such as specific industrial projects. The average annual growth ratefor total ECG consumption is forecast at 11% for the period 1975-80 and 8%thereafter. Overall growth rates and composition of the ECG load are summarizedin the table below.

- 14 -
% Annual Growth Rate % Total ECG ConsumptionActual Forecast Actual Forecast1970 1975 1981
-1974 -1980 -1985 1970 1975 1980 1985
Residential 4.6 6.8 8.o 33 25 20 20Commercial 12.0 12.2 7.9 20 19 18 17Industrial 13.5 13.7 8.2 46 55 61 62Other 8.2 10.8 8.1 1 1 1 1
Overall ECG 10.2 11.3 8.1 100 100 100 100
%Total Ghanaian net generation(VRA + ECG generation - losses) 21 23 28 36
4.o4 Consumption forecasts for each of the areas served by thesub-projects have been made on the basis of the general trend for the non-industrial loads (residential, commercial, etc.) and on the basis of thespecific information available for the main industries and some specialservices (such as water pumping) to be supplied. In the case of the industrialand special services load, an important part of the expected electricityconsumption would come from substituting for direct fuel energy consumption,such as that of water pumps, sawmills, glass furnaces, etc. the electricitywhich would become available at lower cost as a result of the project. Detailsof the demand forecast for the specific subprojects are given in Annex 7.
Least-Cost Solution
4.05 The proposed subprojects consist basically of 33 kV subtrans-mission lines of several conductor sizes in accordance with their expectedloadings, and the corresponding substations. They constitute the least-costsolution to deliver the forecast load for a period of 15 years when comparedwith reasonable alternatives, taking into account the standardization ofvoltages adopted in Ghana and other local conditions such as requirements forunderground installations in some congested areas. It is assumed that afterthese lines would reach their full capacity, the ECG sub-transmission systemof which the proposed subprojects form part, would be reinforced according tofuture requirements.
Basis for Economic Evaluation
4.o6 The energy to be distributed through the project facilitieswould require in the long-run the necessary expansion in the generating andtransmission system of VRA. Consequently, for economic evaluation purposesthe cost components include the investment and operating cost of the threemain elements of the power system: generation, transmission and distribution,irrespective of the institutional separation between VRA and ECG. This approachhas also been used in the appraisal of the Kpong hydro-electric project.

- 15 -
4.07 Each subproject has been evaluated as part of an investmentprogram which includes generation/transmission, the 33 kV subtransmissionfinanced by the proposed loan, and additional low voltage facilities andfuture substation reinforcement required to support load growth to the capa-city of the 33 kV lines. Details of program costs are given in Annex 7.
4.o8 Current ECG tariffs, if taken as the sole proxy for benefits,would not reflect the real economic benefits obtained by consumers as evidencedby their willingness to pay. The current tariffs are based on the low cost ofAkosombo hydro-energy and do not reflect the long-run marginal cost. Thewillingness to pay a higher price for an undefinable percentage of incrementalconsumption is demonstrated by the actual use of more expensive substitutes(diesel generation for own use, oil for cooking, candles, etc.).
4.09 In view of this situation, direct evaluation of benefits forsubstitution loads of the industrial and water pumping energy requirements hasbeen made on the basis of the value of fuel savings and on the reduction inproduction costs of the glass factory 1/ by use of electricity. For the restof ECG's supply, benefits have been estimated on basis of present ECG tariffs,since no other direct method of evaluation could be satisfactorily applied. Forpurposes of comparison, an assumption has also been made that consumers wouldbe willing to pay a price approaching long run marginal cost which is 1.7 timiesthe average existing tariff and roughly 75% of the tariff level in Liberia.
4.1o Among the benefits obtained from fuel energy substitution, theuse of electric boilers at Tema textile industries has been considered. Inthis case surplus hydro-energy will be used to replace oil in the oil firedboilers for steam production. It is expected that sufficient surplus hydro-energy will be available as a result of Kpong project until 1985. The use offirm hydro-energy for replacing oil would not be economically justified becausethe long run marginal cost of electricity is about three times the fuel costrequired to produce the same amount of heat, when power and fuel costs areexpressed in economic terms, as indicated in Annex 7. The electricity for oilsubstitution would only be justified as long as surplus hydro-energy (with zeromarginal cost) is available. In the context of the Kpong project it was agreedthat VRA would agree to offer ECG surplus power on disconnectable basis.
Rate of return
4.11 The economic rate of return for each subproject and the overallproject has been estimated by finding the discount rate which equalizesincremental costs and incremental benefits, both costs and benefits beingexpressed in economic terms. A shadow rate of exchange of 1.7 Cedis/US$1(1.48time the market rate) has been adopted. No shadow pricing has been applied tothe local labor concerned because skilled and semi-skilled labor as requiredin this project is fully employed. Details of specific assumptions made inthe rate of return calculations are shown in Annex 7.
1/ Electric furnaces reduce defects on production due to better heat control.

- 16 -
4.12 The table below provides the results of the rate of return ofthe overall project and individual subprojects for the estimated cost andload forecast.
----------------Rate of Return %-----------------
1976 ECG Elimination of 1.7 x 1976Tariff 1/ Special Tariff 1/ ECG Tariff 1/
Accra-Teshie 8.4 8.4 18.5Accra-Weija 21.14 21.14 21.14Kumasi-Kumavu 2.6 2.6 7.5Sefwi-Wiawso 5.7 5.7 11.0Tarkwa-Aboso 14.4 14.4 14.4Tema 0.1 5.5 13.9
Overall 10.0 10.5 14.2
4.13 In the first column of the above table, benefits are estimatedon the basis of existing tariffs and other proxies. The second column showsthe effect on the rate of return when normal industrial tariffs are charged toindustrial users served by the Tema grid, instead of special contract rates.Both columns indicate clearly that the rate of return for the whole projectis reasonable 2/, despite the gross undervaluation of benefits that occurs whenusing current tariffs as a proxy (paras. 4.08 and 4.09). As a further yardstickfor comparative purposes, the third column of the above table illustrates thereturn for each subproject when benefits are valued at 70% higher than thecurrent tariff levels i.e. approaching long run marginal cost. Long run marginalpricing is still reasonable considering that it corresponds to only 75% of thetariffs charged in Liberia (see Annex 7), which has the lowest tariffs amongneighboring countries 3/. This analysis confirms the recommendations referredto in paras. 2.20 and 2.22 concerning the use of surplus hydro-energy on adisconnectable basis, the elimination of special tariffs for firm power andthe carrying out of a study for ECG's tariffs.
1/ Refers to the portion of benefits (approximately 30% of total in col. 1) forwhich there is no fuel substitution, replacement of existing diesel generation,or other proxy.
2/ The rates of return on the Kumasi-Kumawu and Sefwi-Wiawso-Bibiani schemesreflect their predominant rural character; the rate of return on the latteris slightly higher than the former because it includes more productive usesof electricity, i.e., sawmills, metal working, etc.
3/ Annex 7, Table 2, page 8 shows the overall rate of return as a function ofpercentage increase of ECG tariff to show the effect of intermediate tariffincreases.

- 17 -
5. THE BORROWER
5.01 Unlike the two previous Bank group operations, which were IDA
Credits (118-256-GH), the present operation consists of (i) a Bank loan for
which ECG will be the Borrower and the Government the Guarantor, and (ii) an
IDA Credit for which the Government will be the Borrower and ECG the Beneficiary
(see also para. 6.07).
5.02 ECG was established in 1967 following the Government's undertakingunder loan 310-GH to reorganize the Electricity Division of the Ministry of Worksand Housing as a Government-owned public utility with power to conduct its
business according to commercial principles. The Ministry of Works and Housing
supervises ECG, which is directed by a Board of seven members including ECG's
and VRA's Managing Directors, and representatives of the Ministries of Finance,
and Works and Housing.
Organization and Management
5.03 ECG's headquarter operations are organized in four departments(Engineering, Accounting, Internal Audit, and Administration), and a smalltariff section; in addition there are ten regional offices, the most importantof which are in Accra and Tema. All these units are ultimately responsible to
the Managing Director, who is ECG's Chief Executive. Functional control overthe regional offices is also exercised by ECG's department heads (see alsoAnnex 8).
5.o4 ECG's management has performed moderately well, leaving manynecessary improvements to be implemented. ECG's new Managing Director is adynamic and competent engineer who took over the job in early 1975 after a long
career in utilities which had brought him to the position of Director ofEngineering in VRA, which he filled until he was asked to take over his present
job. The managers heading the Accounting, Internal Audit and AdministrationDepartments are also competent; they all have had a long term association with
ECG. The position of manager of the Engineering Department has been vacantsince 1971, and this situation undoubtedly has had a negative influence onthe efficiency of ECG's operations. During the negotiations, ECG confirmedthat a Chief Engineer will be engaged by July 1, 1977. Present provisions(Credit 256-GH) on Bank consultation for future appointments of ManagingDirector and Chief Engineer have been confirmed. Except for an expatriateengineer, seconded from Germany for the operation of ECG's main control center,
all the utility's management is Ghanaian.
5.05 Whereas top level positions appear adequately filled, middlemanagement is weak and many vacancies exist. This is especially apparent in
the Accounting Department where there are key vacancies in the sections dealingwith the financial accounts, budget and stores. In order to attract adequatelyqualified staff for these positions, ECG has recently raised compensation levelsfor accountants; however, whether the salaries are now adequate to attract the
required staff is not yet known. During the negotiations, ECG agreed to fill
the vacant accounting positions by July 1, 1977.

- 18 -
Personnel
5.06 For several years up to 1973 ECG managed to stabilize its staffat about 4,800, but additions during 1974 brought the utility's establishmentto its present size of about 5,200, with an employee to customer ratio of1 to 27. Although reflecting a 33% improvement over the situation in 1969,this figure - as crude a measure for the staffing as it may be - indicatescontinued overstaffing. More acceptable ratios about 1 to 50 are found inNigeria, Senegal and Ivory Coast. However, while overstaffing applies mostlyto the lower level of staff, there is a lack of staff at the middle managementlevel (see para. 5.05). The UK aid authorities have been asked to provide amanpower expert to determine ECG's future manpower needs and propose policiesto adjust to these needs. It is understood that this request is being favorablyconsidered. During negotiations, ECG gave assurances that (i) with the assis-tance of experts, it would draw up by January 1, 1978, and thereafter implementa staff plan, and(ii) until such plan has been agreed with the Bank, ECG willnot increase overall staff numbers.
Training
5.07 ECG has never carried out a systematic survey of its trainingrequirements; there is no senior staff member in charge of training. Thissituation necessarily leads to unclear objectives and lack of comprehensivenessand coordination in this important aspect of ECG's operations. However, theprogramming of foreign training for the engineering personnel is relativelywell developed. All other staff are essentially trained on the job with occa-sional participation in specialized courses at local institutes. For severalyears ECG has been building a training school at Tema which was expected to becompleted by the end of 1976; the school will be mainly for vocational trainingof its junior staff. ECG is fully aware of the need to streamline and to improveits training programs, and it has requested the UK aid authorities to providea training expert. During the negotiations ECG agreed to carry out a surveyof its training requirements by July 1, 1977 and appoint a senior staff memberin charge of training.
Operations
5.o8 While ECG's operations are generally satisfactory there areshortcomings, particularly in respect of maintenance which is very oftendelayed; this results in frequent breakdowns, power failures and unsatisfac-tory voltage regulation, particularly in the low voltage grids of Accra.The main reasons for this situation are: (i) the absence of an engineeringdepartment manager since 1971 (see para. 5.o4), (ii) the lack of a local trainingschool (see para. 5.07), (iii) the lack of a good fleet of service vehicles;three quarters of ECG's present fleet of vehicles are old and need to be replaced,and (iv) frequent shortages of spare materials. The project will be of majorhelp in rectifying the shortcomings of ECG's operations. Performances indicatorsto be used during supervisions are shown in Annex 11.

- 19 -
Accounting and Financial Planning
5.09 ECG's accounting system was established and instituted by Coopers& Lybrand in the late sixties and the corresponding manuals are still beingfollowed. The standards of accounting in ECG are adequate. Due primarily tothe lack of staff, financial planning and control are weak and accounting isdelayed. It is expected that with the recruitment of adequately qualifiedstaff (see para. 5.05) the weakness will be corrected.
Billing and Receivables
5.10 ECG's billing is on a monthly basis. ECG's accounts receivableimproved from the equivalent of about 5-1/2 months revenue in 1970 to 3-1/2months in 1973. The main element in this relative success was the institutionof a central payment facility for Government accounts. Since then accountsreceivables have increased, and in 1975 amounted to about 4 months revenues;this has been due to frequent breakdowns of ECG's electronic billing machinesin Accra and more recently to teething troubles of a new consumers-basedbilling system. Increased collections from residential consumers is clearlythe key to better performance. The new billing system was expected to haveproduced accurate and timely billing data by mid-1976 which should give ECGan adequate lever to start a vigorous disconnection program. During thenegotiations ECG agreed that it would take such measures which would ensurethat the level of its accounts receivables would, by December 31, 1977, bereduced to a sum not exceeding 3 months' billing revenue and thereafter bemaintained at such level.
Inventories
5.11 ECG's stock levels have increased from ¢ 2.4 (US$ 2.1) millionin 1970 to ¢ 6.1 (us$ 5.3) million in 1974. The 1974 level represents materialrequirements for about 18 months; this is high. At the same time, ECG iscritically short of vital items (insulators, transformers, meters, etc.), whichis probably partly related to Ghana's import licensing system. However, ECGalso acknowledges that its inventory management has been suffering from a lackof qualified personnel. Reorder levels and stock values in particular need tobe reviewed. During negotiations ECG agreed to undertake by December 31, 1977with the assistance of experts: (i) a revaluation of its inventories, and(ii) a review of its inventory management and valuation system; and afterconsultation with the Bank, implement the appropriate recommendations forimprovements.

- 20 -
Audit
5.12 In accordance with the terms of previous IDA Credit, ECG'sexternal audit is carried out by Messrs. Coopers & Lybrand in association witha local firm of chartered accountants. This arrangement is satisfactory. Inaddition to the audit per se, ECG's auditors provide management letters con-taining suggestions to overcome system weaknesses discovered during the courseof the audit. ECG is continuing to build up an internal audit section tocomplement the work of external auditors and which emphasizes (i) control ofthe application of accounting procedures and (ii) physical stock taking.
Insurance
5.13 ECG's insurance policies provide protection against losses of goods-in-transit, fire in buildings, third party claims on vehicles and other property,and workmen's compensation. Transmission and distribution lines are not insured;this is in line with accepted public utility practices.
6. FINANCES
6.01 Outside its regular activities ECG executes and operates ruralelectrification schemes on behalf of the Government; ECG keeps separate accountsfor these works. As of December 1975 rural assets represented about 7% of ECG'sregular Fssets. While the Government reimbursed ECG for capital expenditures,it has not reimbursed ECG for operating losses in these areas, and as of end-December 1975 the Government owed ¢ 2.8 million in this respect.
6.02 ECG's past financial performance related to its regular activitieswith a forecast of the entity's future finances is set out in the Statementsgiven in Annex 9.

- 21 -
Past Finances
6.03 Between 1968, ECG's first year of operation, and 1971, ECG'sfinancial performance was excellent; rates of return were well above therequired 8%; the financial position of the entity was sound and financialindicators were above reasonable levels. Based on the excellent results of1971 a dividend was paid to the Government in 1972. However, in 1972, ECG'sfinancial performance commenced to deteriorate and since then profitabilityhas shown serious decline; rate of return on partially revalued assets whichwas slightly below the required 8% in 1972 and 1973 fell to 2.6% in 1974 anddespite a 20% tariff increase in August 1975, improved only marginally to 3.3%in 1975. The major factors contributing to the decline have been a slowingdown in the growth of energy sales from 12% to 8% in 1974/75, large increasesin employment related expenses, following substantial salary and wage settle-ments, and a doubling of fuel and lubricant expenses. Personnel and fuelexpenses account for about 50% of ECG's operating expenses. Following pooroperating results, ECG's liquidity was reduced to such levels that the entitywas unable to fully meet its debt service obligations to the Government in1974 and 1975 in respect of onlent IDA and KfW credits (IDA Credits 118 and256-GH and KfW Credits I and II); the total amount unpaid at the end of 1975was about 0 7.1 (us$ 6.2) million. Salient features of ECG's finances duringthis period of financial decline (1972-1975) are set out in the table below:
1972 1973 1974 1975
------------Actual----------
Electricity Sales (GWh) 640 712 770 840Average Revenues (P/kWh) 2.6 2.5 2.5 2.8Operating Ratio 89 87 98 96Rate of Return (%) 7.1 7.1 2.6 3.3Quick Ratio 1.4 1.6 0.7 0.5Debt/Equity Ratio 52/48 48/52 47/53 46/54Debt Service Coverage 1.6 1.0 0.7 o.6

- 22 -
6.o4 To assist ECG in regularizing its debt service obligations, theGovernment confirmed during negotiations that it agreed (i) to permit ECGto settle all amounts due on the onlent IDA I and KfW I Credits by the endof 1977 and (ii) to extend the final maturities of the onlent IDA II and theKfW II Credits from 1977 to 1982 and 1984 respectively. This is satisfactory.
6.05 Concerning the Government's undertaking under Credit 256-GH toreimburse ECG for rural operating losses, the Government confirmed duringnegotiations to settle all past amounts due in three equal semi-annualinstallments commencing in December 1976, and ending in December 1977. TheGovernment further confirmed that it agreed that ECG submit yearly estimatesof future operating losses and that on this basis, provisions would be madein the Government's budget.
Financing Plan
6.06 ECG's capital investment and working capital requirements duringthe 1976-80 period, along with the sources from which they would be met aresummarized below:
¢ us$ %---- Million----
RequirementsProposed Project 22.9 19.9 39Other Works 2.5 2.2 4Future Program 7.6 6.6 13
Sub-Total 33.0 28.7 56
Investments 0.3 0.3 1Working Capital 8.9 7.7 15
Additional Cash for Dividends/FutureCapital Works 16.0 13.9 28
Total Requirements 58.2 50.6 100
SourcesNet Revenues 26.8 23.3
Plus: Depreciation 32.8 28.5Plus: Consumer Contributions 2.5 2.2Less: Debt Service 24.1 20.9
Internal Cash Generation 38.0 33.1 66
Proposed IDA/IBRD Lending 16.4 14.2 28Future Borrowings 8 3.3 3
Total Sources 58.2 50.6 100

- 23 -
6.07 As indicated in para. 5.01, ECG will be the Borrower of the Bankloan of US$ 9.0 million. Of the US$ 9.0 million IDA Credit, the Governmentwould retain US$ 100,000 for the power sector study (para. 2.22), wouldonlend to ECG US$ 3.7 million related to the rural Kumawu scheme on a grantbasis and would onlend the remaining US$ 5.2 million for items not relatedto rural schemes on standard Bank terms.
6.08 The Bank loan would carry the prevailing interest rate (8.5% p.a.),a 3/4% commitment charge and a term of 20 years including four and half yearsgrace. ECG is expected to start a further three year phase of development in1980. Aggregate foreign exchange borrowing of ¢ 18.8 (US$ 16.3) million, onthe grounds of country requirements, have been assumed for these works.
Future Finances
6.09 In order to allow VRA to raise the necessary local capital requiredfor the financing of the next hydro-electric scheme at Kpong, the Governmentapproved a 60% increase in VRA's tariffs to ECG, effective September 1, 1976.The Government also approved, effective October 1, 1976, a 20% tariff increasein ECG's domestic and a 33% increase in ECG's industrial/commercial tariffs,equivalent to an average increase of about 29%.
6.10 The main assumptions underlying ECG's projected finances are:(i) VRA will increase tariff levels to ECG, during 1978-1981, 10-25% to meetits additional financial obligations for Kpong and to earn a 7-9% return onthe Government's investment; and (ii) ECG's operating expenses other thanpurchased power will grow 10-25% p.a. 1/, reflecting system growth and infla-tion. Additional detailed assumptions are shown in Annex 10. On this basis,ECG is expected to achieve the following operating results:
1976 1977 1978 1960 1982
Electricity Sales (GWh) 941 1,096 1,277 1,465 1,698Average Revenue (P/kWh) 3.2 3.8 3.9 4.8 6.3Operating Ratio 90 87 90 92 94Rate of Return (%) 7 10 8 8 8Asset Revaluation (%) 40.0 11.0 11.0 11.0 11.0Quick Ratio 0.8 1.2 1.2 1.6 1.0Debt/Equity Ratio 32/68 34/66 31/69 27/73 27/73Debt Service Coverage 2.4 2.2 2.6 3.1 3.0
1/ Should actual operating costs be higher, the Rate of Return mechanism (seepara. 6.10 next page) would provide automatic coverage.

- 24 -
The existing revenue covenant of an 8% return on net fixed assets plus 5%working capital minus customer contributions was confirmed during negotiations.It is estimated that in order to maintain this 8% return, ECG's tariffs wouldhave to increase - in current terms - very moderately in 1978 (3%) and there-after 7-15% per annum. In recognition of the present uncertainty caused byhigh inflation rates in Ghana, ECG and the Government agreed during negotiationsto take compensating tariff action within three months of an event which wouldcause ECG's operating expenses, excluding purchased power, but including debtservice to increase by more than 10%. In order to assess well ahead requiredtariff action ECG agreed during negotiations also to submit to the Bank eachyear full financial forecasts by July 31. Finally, during negotiations theBank suggested for further consideration by the Ghanaian Authorities to introducean automatic tariff adjustments mechanism. Automatic tariff increases havebeen used in other countries to avoid the political difficulties of drasticand sudden tariff increases.
6.11 Assets have not been fully revalued since 1967. A partialrevaluation, taking into account increases in ECG's long-term debt, followingexchange rate changes, took place in 1971. ECG has always agreed in principleto a revaluation of assets but has delayed implementation because it couldnot agree with the auditors on a regular, reliable and inexpensive revaluationmethod. It was confirmed during negotiations that ECG will revalue its 1976assets by indices satisfactory to the Bank by June 30, 1977 and keep assetson current values thereafter. The resulting asset values would be adoptedfor purposes of the rate of return calculation (see para. 6.12). Should theactual revaluation of the 1976 assets yield a different net fixed asset valuethan the estimated ¢ 69 million, the 8% return target would be adjustedproportionately. It was understood that assets will be maintained at currentvalues by applying to local and foreign assets indices for local and inter-national inflation. The financial projections assume a 40% revaluation in 1976.Thereafter, an annual revaluation of 11% has been assumed reflecting theweighted average of local (20%) and international (7%) inflation rates.
6.12 ECG's financial position throughout the forecast period isexpected to be satisfactory. Debt/equity ratio would remain at around 30/70which provides for an ample margin for further borrowing. ECG is alsoexpected to retain a generous liquidity position which can be explained by(i) the profile of the project's financing plan with 71% Bank borrowing, and29% internal funding and (ii) by ECG's requirement for full payment of theconsumer contribution at the start of construction. ECG's borrowing fromthe Bank Group is in fact primarily determined by Ghana's foreign exchange.As indicated in the financial plan (para. 6.06) ECG is expected to accumulateabout US$ 14 million in cash by 1980. This projected liquidity should enableECG to resume paying dividends to the Government (see also para. 6.14).During negotiations it was agreed that such payments would be made afterECG's own requirement, including contributions to future investment needs,have been met.
6.13 During negotiations ECG agreed that the debt limitation covenantof Credit 256-GH, stipulating that no new long-term debt would be incurred

- 25 -
unless ECG's revenues covered the maximum future debt service 1.5 time,be extended to the proposed loan.
Fiscal Impact
6.14 The project will affect the Government budget by (i) interestearnings on the portion of the IDA Credit which will be onlent to ECG, and(ii) disbursements for local currency element of the rural Kumavu scheme.Interest earnings are estimated at US$ 2.1 million, whereas, the local costcomponent of Kumavu amounts to US$ 1.8 million. No income or import taxrevenues are expected, because of ECG's tax exemptions (see para. 3.03).Should ECG's projected liquidity in fact materialize, dividends payments inthe order of ¢ 2-3.0 million per year may become available to the Government(see para. 6.12).
7. AGREEMENTS REACHED
7.01 As a condition of disbursement for that part of the proposed loan/credit financing the Sefwi-Wiawso-Bibiani scheme, a letter of intent for theconstruction of the 161 kV line feeding this scheme should have been signedin order to ensure an adequate coordination between the construction of the161 kV line and that of the distribution scheme (para. 3.02).
7.02 Under the proposed third Bank loan to VRA:
(i) VRA will offer ECG surplus hydro-power for industrial steam productionon disconnectable basis (para. 4.10); and
(ii) The Government agreed to allow ECG to pass on VRA's tariff increasesto its own customers.
7.03 During negotiations, assurances were obtained from the Governmentand ECG that:
(i) The Government will exchange views with ECG on the financial andeconomic viability of rural electrification projects (para 2.17);
(ii) ECG will make surplus hydro-energy available to industrial consumerson an interruptible basis for steam generation (paras. 2.20 and 4.10);moreover, the existing special low tariffs for firm power to industrialconsumers will be replaced by the normal tariff at the expirationdates of the present contracts (para. 2.20);
(iii) As part of an overall power sector study, a study of generation,transmission and distribution costs, and tariff structure will becarried out and presented for review by the Bank before June 30, 1978(para.2.22).
- 26 -
(iv) The Government will onlend that portion of the proposed IDA Creditwhich is related to the Kumawu rural scheme on a grant basis andwill onlend to ECG the portion of the credit unrelated to ruralworks at standard Bank terms (para. 6.07);
(v) The Bank will continue to be consulted on appointments ofManaging Director and Chief Engineer (para. 5.04); and
(vi) Compensating tariff action would be taken should an event occurwhich would increase operating expenses by more than 10% (para.6.10).
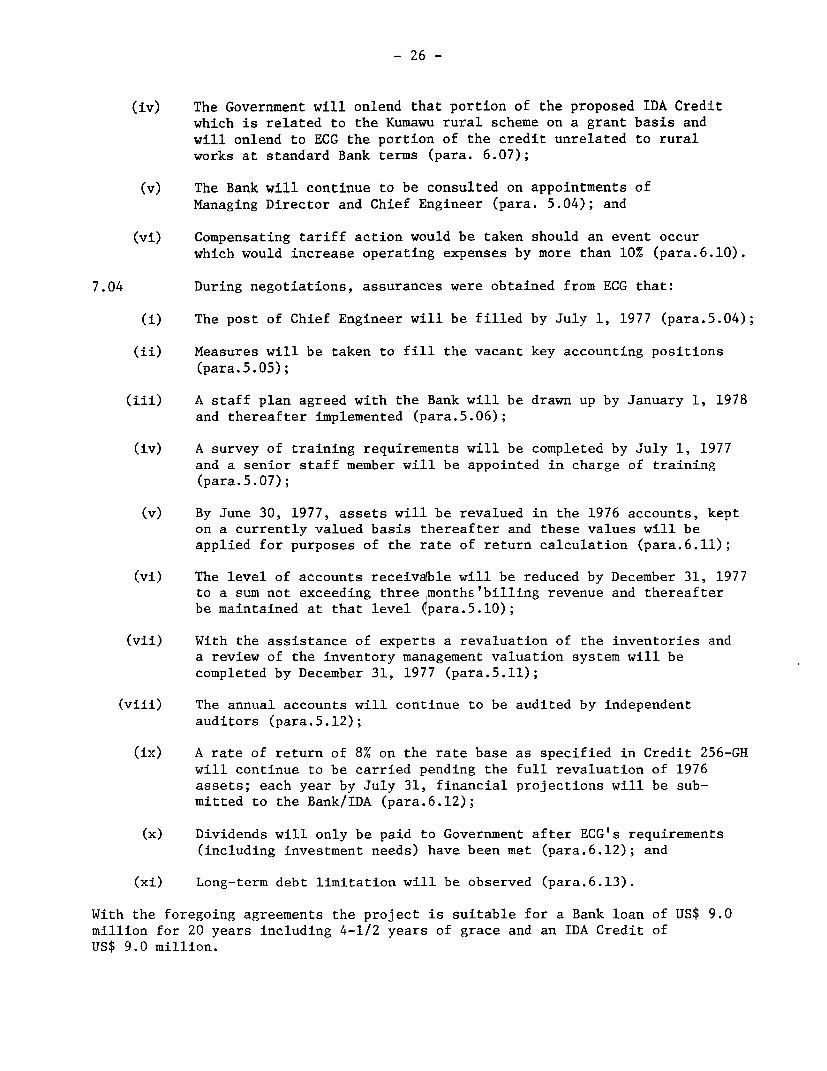
7.04 During negotiations, assurances were obtained from ECG that:
(i) The post of Chief Engineer will be filled by July 1, 1977 (para.5.04);
(ii) Measures will be taken to fill the vacant key accounting positions(para.5.05);
(iii) A staff plan agreed with the Bank will be drawn up by January 1, 1978and thereafter implemented (para.5.06);
(iv) A survey of training requirements will be completed by July 1, 1977and a senior staff member will be appointed in charge of training(para.5.07);
(v) By June 30, 1977, assets will be revalued in the 1976 accounts, kepton a currently valued basis thereafter and these values will beapplied for purposes of the rate of return calculation (para.6.11);
(vi) The level of accounts receivable will be reduced by December 31, 1977to a sum not exceeding three months'billing revenue and thereafterbe maintained at that level 6para.5.10);
(vii) With the assistance of experts a revaluation of the inventories anda review of the inventory management valuation system will becompleted by December 31, 1977 (para.5.11);
(viii) The annual accounts will continue to be audited by independentauditors (para.5.12);
(ix) A rate of return of 8% on the rate base as specified in Credit 256-GHwill continue to be carried pending the full revaluation of 1976assets; each year by July 31, financial projections will be sub-mitted to the Bank/IDA (para.6.12);
(x) Dividends will only be paid to Government after ECG's requirements(including investment needs) have been met (para.6.12); and
(xi) Long-term debt limitation will be observed (para.6.13).
With the foregoing agreements the project is suitable for a Bank loan of US$ 9.0million for 20 years including 4-1/2 years of grace and an IDA Credit ofUS$ 9.0 million.

ANNEX 1Page 1 of 3 pages
GHANAElectricity Corporation of Ghana (ECG)
Third Expansion Phase
Detailed Project Description
1. The proposed ECG Third Phase project consists of (a) constructing33 kV, 11 kV and LV overhead lines and related substations for specificelectricity requirements and for rural development; (b) laying 33 kV under-ground cables and reinforcing substations at Tema for industrial requirements;(c) supply materials and service vehicles; and (d) securing consultantservices.
(a) Constructing 33 kV, 11 kV and LV overhead lines and related substations
Five lines are planned:
(i) From Tarkwa to Aboso:
This 33 kV 95 mm2 cu equivalent double circuit line of 7.5 kmwill link the Volta River Authority 161/33 kV substation atTarkwa to a 33/11 kV 2 x 10 MVA substation to be built atAboso. This line will enable the Aboso Glass Factory to besupplied with the electricity needed (9 MW, 24 hours/day) toexpand from the present output of 37 tons/day of bottLes to60 tons/day by end of 1977 and 90 tons/day in 1978 1
(ii) From Accra to Teshie-Nungua (east of Accra):
This component of the project consists of a 5.7 km doublecircuit line (33 kV, 95 mm2 cu equivalent), two 2.35 km 33 kVcables and a 33/11 2 x 10 MVA substation to be built at Teshie.The Ghana State Housing Corporation is presently implementinga six-phase construction program of 2,200 dwellings at Teshie;completion is expected for 1979. This construction programincludes houses, a 200-bed hospital, six schools, commercialbuildings; overall this development will require about 1.7 MWin 1979 and about 9 Gwh/year by 1980;
1/ The African Development Bank has given a loan in Units of Account of5 million (about US$ 6 million) to finance this expansion of the factory.

ANNEX 1Page 2 of 3 pages
(iii) From Accra to Weija Waterworks of GWSC (west of Accra):
This 33 kV, 95 mm2 cu equivalent double circuit line of8.5 km is intended to supply, through a 33/3.3 kV 2 x 5 MVAsubstation, the GWSC (Gha a Water and Sewerage Corporation)pumping station at Weija_ and an irrigation area that islocated 6 km beyond Weija. From the waterworks to theirrigation area, only a single circuit line is envisaged.The initial (1979) requirements of the Weija waterworks areabout 2.5 MW and 12 GWh/year; the requirements of theirrigation project, which is sponsored by the Ministry ofAgriculture (Irrigation Department), are about 1.5 MW and9 GWh/yea,.;
(iv) From a Volta River Authority 161/33 kV substation nearAsanwinso to the Sefwi-Wiawso-Bibiani area:
This 86.5 km, 33 kV 95 mm2 cu equivalent single circuitline will supply existing industries (sawmills at Sefwi-Wiawso; bauxite at Awaso; gold at Subin; and a metal andwood complex at Bibiani) through seven 33/11 kV substationswith a total installed capacity of 11.45 MVA; related LVdistribution lines are also included. This component,which is also a first phase rural electrification scheme,will bring electricity to seven townships and about30,000 people. The electricity requirements of the areaare estimated at about 7.1 MW and about 35 GWh/year by1980;
(v) From Kumasi to NSuta and Kumawu:
This 91 km, 33 kV 95 mm2 cu equivalent single circuit lineis intended to supply about 15.3 GWh in 1980 with a maximumdemand of about 4.1 MW through four new 33/11 kV substationsand 15 new 33/11 kV/LV substations with a total installedcapacity of 14.55 MVA; related LV distribution lines are alsoincluded in the component. This line would allow the elect-rification of rural areas (12 townships with a total popula-tion of about 40,000 people) and the shutting down of two ofECG's isolated diesel generating plants; it would also supplya sawmill (2.5 MW) planned to be constructed at Kumawu, aquarry, a tire retreading factory, water pumping stations,and schools.
1/ This water pumping station is a component of a project co-financed by IDA(Credit 499-GH).
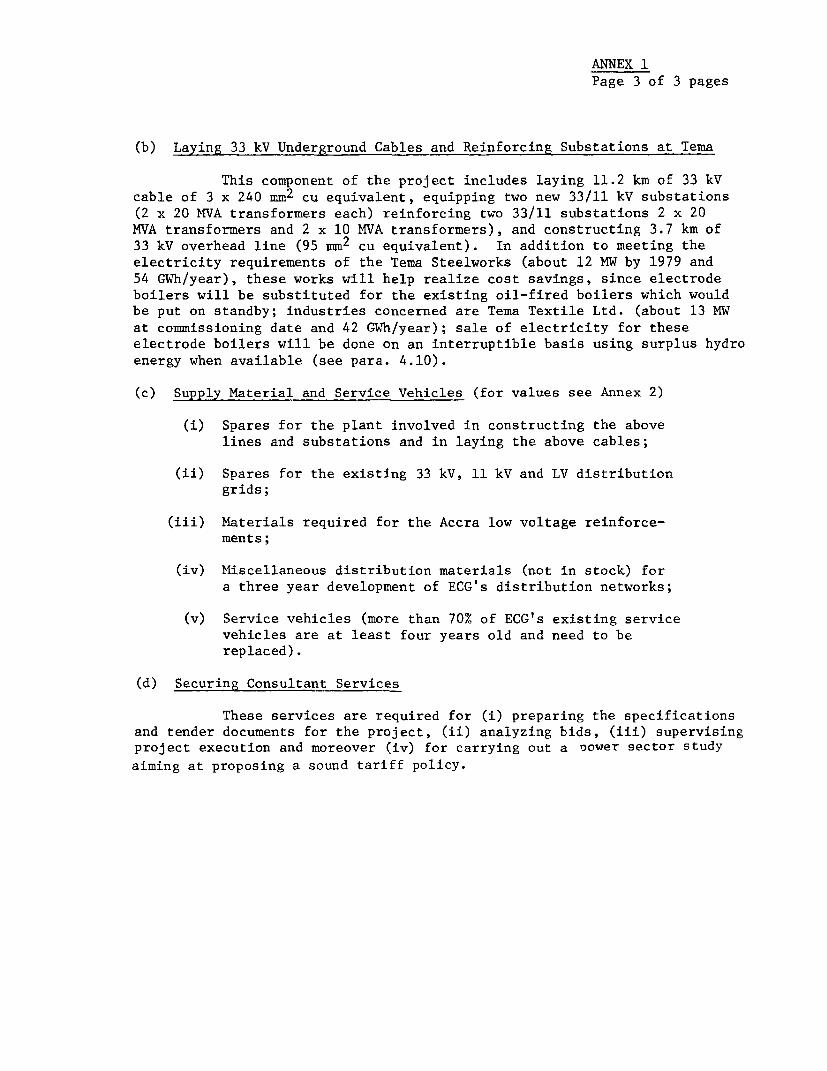
ANNEX 1Page 3 of 3 pages
(b) Laying 33 kV Underground Cables and Reinforcing Substations at Tema
This component of the project includes laying 11.2 km of 33 kVcable of 3 x 240 mm2 cu equivalent, equipping two new 33/11 kV substations(2 x 20 MVA transformers each) reinforcing two 33/11 substations 2 x 20MVA transformers and 2 x 10 MVA transformers), and constructing 3.7 km of33 kV overhead line (95 mm2 cu equivalent). In addition to meeting theelectricity requirements of the Tema Steelworks (about 12 MW by 1979 and54 GWh/year), these works will help realize cost savings, since electrodeboilers will be substituted for the existing oil-fired boilers which wouldbe put on standby; industries concerned are Tema Textile Ltd. (about 13 MW
at commissioning date and 42 GWh/year); sale of electricity for theseelectrode boilers will be done on an interruptible basis using surplus hydroenergy when available (see para. 4.10).
(c) Supply Material and Service Vehicles (for values see Annex 2)
(i) Spares for the plant involved in constructing the abovelines and substations and in laying the above cables;
(ii) Spares for the existing 33 kV, 11 kV and LV distributiongrids;
(iii) Materials required for the Accra low voltage reinforce-ments;
(iv) Miscellaneous distribution materials (not in stock) fora three year development of ECG's distribution networks;
(v) Service vehicles (more than 70% of ECG's existing servicevehicles are at least four years old and need to bereplaced).
(d) Securing Consultant Services
These services are required for (i) preparing the specificationsand tender documents for the project, (ii) analyzing bids, (iii) supervisingproject execution and moreover (iv) for carrying out a oower sector study
aiming at proposing a sound tariff policy.

GHANAElectricity Corporation of Ghana (ECG)
Third Expansion Phase
Construction Schedule
1976 1977 1978 1979
1. Aboso Glass Factory _______________ XXXXXXXXXXXXXX XXXXX-
2. Teshie Housing Program _______________ XXXXXXXXXXXXX XXXXX
3. Weija Waterworks (and irrigation) --------------- XXXXXXXXXXX
4. Tema ______________ XXXXXXXXXXX
5. Sefwi-Wiawso-Bibiani Scheme ______________ XXXXXXXXXXXXXX-
6. Kumasi-NSuta-Kumawu Scheme ______________ XXXXXXXXXXXX--__
7. Supply of spares and materials for ----- XXXXXXXXXXXXXreinforcement and developmentprogram
8. Supply of service vehicles ______________ XXXXXXX
_~~~~~~~~ _
- Preparation of specifications and tender documents; bids' evaluation and award of contract
XXXX Manufacturing, shipping and delivery >
Construction of facilities concernedrt

ANNEX 2
GHANAElectricity Corporation of Ghana (ECG)
Third Expansion PhaseCost Estimate
(by category of materials)
Foreign Local Total Foreign Local Total--- Million Cedis--- --- Million US$-----
1. 33 kV, 11 kV, and LV overhead lines 5.7 4.0 9.7 5.0 3.4 8.4
2. 33 and 11 kV underground cables 2.0 .4 2.4 1.7 .4 2.1
3. 33/11 kV substations (without trans-formers) 2.4 1.3 3.7 2.1 1.1 3.2
4. Supply and installation of transformers(33/11 kV, 33/0.4 kV and 11/0.4 kV) 1.8 .2 2.0 1.5 .2 1.7
5. Supply of spares for the proposed project .3 - .3 .3 - .3
6. Supply of spares for ECG's existing grids .5 - .5 .4 - .4
7. Supply of materials for the Accra lowvoltage reinforcement .3 - .3 .2 - .2
8. Supply of materials for normal develop-ment over a 3-year period 1.9 - 1.9 1.7 - 1.7
9. Supply of service vehicles 1.7 - 1.7 1.5 - 1.5
10. Engineering services .3 .2 .5 .3 .2 .5
11. Total Base Line Cost 16.9 6.1 23.0 14.7 5.3 20.0
12. Contingencies (Physical and Price) 3.8 3.9 7.7 3.3 3.4 6.7
13. TOTAL PROJECT COST 20.7 10.0 30.7 18.0 8.7 26.7

ANNEX 3
GHANAElectricity Corporation of Ghana (ECG)
Third Expansion PhaseCost Estimate
(by category of expenditures)
Foreign Local Total Foreign Local Total--- in Millions Cedis--- ---- in Millions US$----
1. Construction of 33/11 kVand LV overhead lines andunderground cables 7.7 4.4 12.1 6.7 3.8 10.5
2. Construction of and equip-ping 33/11 kV distributionsubstations 4.2 1.5 5.7 3.6 1.3 4.9
3. Supply of materials 3.0 - 3.0 2.6 - 2.6
4. Supply of service vehicles 1.7 - 1.7 1.5 - 1.5
5. Engineering services .3 .2 .5 .3 .2 .5
6. Total Base Line Cost (inmid-1976 prices) 16.9 6.1 23.0 14.7 5.3 20.0
7. Contingencies (Physicaland Price) 3.8 3.9 7.7 3.3 3.4 6.7
8. TOTAL PROJECT COST 20.7 10.0 30.7 18.0 8.7 26.7

ANNEX 4
GHANAElectricity Corporation of Ghana (ECG)
Third Expansion PhaseDisbursement Schedule
Estimated disbursements on the proposed loan are expectedto be made approximately as follows:
…--------in US$ million Equivalent------------------1st Quarter 2nd Quarter 3rd Quarter 4th Quarter Total
1977 _ 6.1 3.0 1.5 10.61978 0.9 1.6 1.1 0.9 4.51979 0.8 0.7 0.3 0.2 2.01980 0.6 0.3 - - 0.9
18.0
The cumulative disbursement at the end of each quarter isapproximately as follows:
------------------in US$ million Equivalent- ---lst Quarter 2nd Quarter 3rd Quarter 4th Quarter
1977 - 6.1 9.1 10.61978 11.5 13.1 14.2 15.11979 15.9 16.6 16.9 17.11980 17.7 18.0 18.0 18.0

ANN~EX 5
GHANA
Electricity Corporation of Ghana (ECG)Trhird E~xpansion Phase
Demand and Energy Requirements (1970-1981)
------------------Actual-------------------- -----------------Forecast-------------------
1970 1971 1972 197 3 197h 1975 1976 1977 1978 1979 1980 1981
Maximum Demand (MW)
VALCO 250 244 295 315 315 315 315 boo 400 o 400 4oo 400
ECG - Interconnected System 106 117 126 135 146 163 172 189 2214 258 27~ 290
- Isolated Stations 6 5 5 7 8 10 11 12 13 11, 16 18
Mines 34 37 38 38 40 42 42 44 46 18 50 52
Akosombo (Township &Textiles) 5 5 7 6 6 8 8 8 8 8 8 8
CEB - - 1 20 25 25 30 40 50 50 50 50
Subtotal 401 408 472 521 540 563 578 693 741 778 799 818
- Losses (+) 11 11 13 14 15 18 19 23 25 28 29 30- Diversity(-) 28 34 9 15 7 15 16 20 23 24 26 27
TOTAL Estimated GenerationPeak 384 385 476 520 548 566 581 696 7143 782 802 821
Firm Capability 594 593 797 799 800 802 803 804 805 806 848 950
Reserve +210 +208 +321 +279 +252 +236 +222 +108 +62 +24 +16 +129
- Surplus (+)- Deficit (-)
Gross Energy Consumption
Sales
VALCO 2,012 1,919 2,264 2,626 2,734 2,518 2,700 3,329 3,329 3,329 3,329 3,329
ECG - Interconnected System 565 659 699 768 840 874 1,003 1,171 1,366 1,518 1,578 1,665
- Isolated Stations 20 20 23 26 32 36 42 47 53 58 65 78
Mines 207 227 243 243 256 271 271 279 292 305 318 330
Akosombo (Township &Textiles) 22 30 30 35 30 34 35 39 41 43 45 148
CEB 1 100 128 141 173 244 313 313 313 313
Subtotal 2,826 2,855 3,260 3,798 4,020 3,874 4,224 5,109 5,394 5,566 5,648 5,759
(Annual growth in %) (1.0) (14.2) (16.5) (5.8) (-3.6) (9.0) (20.9) (5.6) (3.2) (1-5) (1 .9)
Losses (+) 76 74 84 100 go 92 142 170 189 198 206 216
/TOTAL Gross Consumption(Generation) 2,902 2,929 3,344 3,898 14,110 3,966 4,366 5,279 5,583 5,764 5,854 5,975
Firm Energy 4.083 4.083 5.623 5,626 5,632 5,636 5,642 5,647 5,653 5,658 5,665 6,644
Balance +1,181 +1,154 +2,279 +1,728 +1,522 +1,670 +1,276 +368 +70 -106* -189* +669
N.B. - In order to set out the balance of power and energy of the hydroelectric grid, excluding the isolated stations, thelatter were assumed to be self-sufficient so as to cover just the corresponding electricity requirements.
* Energy deficit to be made-up by drawing down reservoir Level of Volta Lake.

ANNEX 6Table 1Page 1 of 2 pages
GHANA
ELECTRICITY CORPORATION OF GHANA
SCHEDULED TARIFF PRIOR TO OCTOBER 1, 1976
All tariffs on monthly basis
1. Domestic US$
up to 30 kWh (per kWh) 0.050 0.043
30 - 60 kWh (per kWh) 0.035 0.031
over 60 kWh (per kWh) 0.025 0.022
minimum monthly charge 2.00 1.74
2. Commercial
a. Maximum demand less than100 kVAup to 50 kWh 5.00 4.35
51 - 100 kWh (per kWh) 0.060 0.052over 100 kWh (per kWh) 0.050 0.043
b. Maximum demand not less than100 kVAdemand charge per kVA maximumdemand 2.50 2.17
minimum demand charge 3.00 2.61
Energy charge - per kVAmaximum demandup to 170 kWh (per kWh) 0.018 0.016
171 to 340 kWh (per kWh) 0.016 0.014over 340 kWh (per kWh) 0.012 0.010
3. Combined Premises
up to 50 kWh 3.00 2.6151 to 100 kWh (per kWh) 0.050 0.043over 100 kWh (per kWh) 0.040 0.035
4. Industrial
a. Maximum demand less than 100 kVAEnergy chargeup to 50 kWh 5.00 4.3550 to 100 kWh (per kWh) 0.06 0.052over 100 kWh (per kWh) 0.05 0.043

ANNEX 6TABLE 1Page 2 of 2 pages
¢__ US$b. Maximum demand not less than 100 kVA
1. High voltage metering demand chargeper kVA maximum demand 2.40 2.10Minimum demand charge per month 120.00 104.35Energy charge per kVA maximum demand
up to 170 kWh 0.018 0.016170 to 340 kWh 0.014 0.012over 340 kWh 0.010 0.008
2. Medium voltage metering demandcharge per kVA maximum demand 2.50 2.17Minimum demand charge 120.00 104.35Eniergy charge per kVA maximum demand
up to 170 kWh (per kWh) 0.018 0.016170 to 340 kWh (per kWh) 0.016 0.014over 340 kWh (per kWh) 0.012 0.010
5. Street lighting (per kWh) 0.060 0.052
6. Flat rate lighting - maximum three lampseach lamp less than 40 watts 0.60 0.522each lamp 41 to 60 watts 0.75 0.652

ANNEX 6TABLE 2Page 1 of 2 pages
GHANA
ELECTRICITY CORPORATION OF GHANA
SCHEDULED TARIFF SINCE OCTOBER 1,1976
All tariffs on monthly basis
1. Domestic ¢ US$
up to 30 kWh (per kWh) 0.060 0.05230 - 60 kWh (per kWh) 0.040 0.034over 60 kWh (per kWkTh) 0.030 0.026minimum monthly charge 3.00 2.60
2. Commercial
a. Maximum demand less than 100 kVAup to 50 kWh 6.65 5.7851 - 100 kWh (per kWh) 0.080 0.069over 100 kWh (per kWh) 0.067 0.058
b. Maximum demand not less than 100 kVAdemand charge per kVA maximum demand 3.33 2.89The maximum demand charge per monthshall not be less than 333.00 289.56
Energy charge - per kVA maximum demandup to 170 kWh (per kWh) 0.024 0.021171 to 340 kWh (per kWh) 0.022 0.019over 340 kWh (per kWh) 0.016 0.013
3. Combined Premises
up to 50 kWh 4.00 3.4751 to 100 kWh (per kWh) 0.065 0.056over 100 kWh (per kWh) 0.055 0.047

ANNEX 6TABLE 2Page 2 of 2 pages
4. Industrial ¢ US$
a. Maximum demand less than 100 kVAenergy chargeup to 50 kWh 6.65 5.7850 to 100 kWh (per kWh) 0.080 0.069over 100 kWh (per kWh) 0.067 0.058
b. Maximum demand not less than 100 kVAi. high voltage metering
demand charge per kVA maximum demand 3.20 2.78The maximum demand charge per monthshall not be less than 320.00 278.26
Energy charge per kVA maximum demandup to 170 kWh 0.024 0.021170 to 340 kWh 0.019 0.016over 340 kWh 0.014 0.012
ii. Medium voltage meteringdemand charge per kVA maximum demand 3.33 2.89The maximum demand charge per monthshall not be less than 333.00 289.56
Energy charge per kVA maximum demandup to 170 kWh (per kWh) 0.024 0.021170 to 340 kWh (per kWh) 0.022 0.019over 340 kWh (per kWh) 0.016 0.013
5. Street lighting (per kWh) 0.080 0.069
6. Flat rate lighting - maximum three lampseach lamp less than 40 watts 0.072 0.062each lamp 41 to 60 watts 0.090 0.078

ANNEX 6Table 3Page 1 of 3 pages
GHANAELECTRICITY CORPORATION OF GHANA
Outline of Draft Terms of Reference for a Tariff Study forGhana's Electric Power Sector
Objective
The purpose of the study is to derive a tariff structure for thesale of electricity to customers of both VRA and ECG which reflects asclosely as possible the costs to the national economy of meeting the demandfor electricity and to determine the appropriate levels of tariffs whichshould be charged to the various categories of customers of both VRA andECG having regard to:
(i) financial requirements of VRA and ECG;(ii) Government social policy and development
objectives, and(iii) the economic costs of other forms of energy
such as petroleum products, their prices,the substitutability of different energysources, and the resultant cross elasticityof demand.
Guidelines for Study Execution
Analysis of Cost Structure
(a) The relevant costs are not financial costs to ECG and VRA ofexpanding and operating its system to meet the demand but the incremental coststo the economy. Strictly speaking, therefore, shadow prices (for capital,labor and foreign exchange) rather than actual prices to VRA/ECG should be usedas appropriate for measuring costs and any taxes on VRA/ECG's inputs should bededucted and subsidies added back. However, the consultant cannot be expectedto calculate the appropriate shadow prices to use but must rely on guidelinesfrom the authorities. Failing this, he will have no alternative but to usethe actual prices of inputs (duly corrected for taxes and subsidies), althoughit is suggested that, in any case, the opportunity cost of capital for discount-ing future costs should be taken as 12%.
(b) It is expected that the first step would be to analyse the longrun and short run marginal costs of generating, transmitting and distributingelectricity at different places, times and voltage levels to different con-sumers over the next few years. This would require due attention to the dailyand seasonal variations in forecast system demand and, to the extent possible,in forecast demands of various consumer classes. Much of the required informa-tion for this purpose may have to be specially collected, e.g. by taking sub-

ANNEX 6Table 3Page 2 of 3 pages
station readings, by enquiring about shift working, seasonal work patterns,etc., and by statistical analysis of available load curves. The basis forthe estimates of marginal costs would be the development program for theperiod 1977-85, the proposed operating regime and proposals for subsequentexpansion.
(c) For the time periods when demand does not come up against thesystem capacity constraint (allowing for the reserve margins set to maintainsecurity of supply) marginal costs would be simply marginal running costs(short run costs) grossed up to allow for losses at the different voltagelevels and, where relevant, in different regions. The relevant losses areincremental losses, even if they can be estimated only approximately, notaverage losses.
(d) At periods when an increase in generation would bring the systemup against the security constraint, the marginal cost of meeting demand wouldbe the addition to all system costs resulting from adding to generation capac-ity and/or storage, transmission and distribution in order to provide theincreased supply with an unchanged probability of failure. These are long runcosts.
(e) It would also be necessary to study the incremental costs attri-butable to poor power factors for these types of consumer (the larger ones) whocan be expected to improve their power factor in response to suitable tariffincentives. The most important cost to concentrate on is the extra MVA capacityrequired to cater for these poor power factors.
Existing Tariffs
(f) It is envisaged that the next step would be to examine the exist-ing tariff structure and rates and compare them with the structure of marginalcosts of supply derived from the foregoing analysis. Large differences betweenthe two may be an indication that the existing system is giving the wrong pricesignals to consumers. Examination of the existing system should pay particularattention to the types of metering in use and the quality of meter maintenance,since this would provide some guidance to what types of tariff are feasible.Other features to look for in examining the existing system are whether it isdifficult to administer, conducive to disputes or conducive to fraud, sincethese will provide useful pointers to improvement in devising the new tariffstructure.
New Tariff Proposals
(g) With the information thus collected, if should be possible tomake a first set of proposals for changing the existing tariff system so thatthe incentives (and disincentives) it provides to consumers correspond moreclosely to the schedule of marginal costs derived. These proposals would con-sist of a classification of consumers and a tariff (or set of tariffs) for eachclass, together with any connection charges and changes for reactive powerwhich can be justified. They would have to be modified as necessary to take

ANNEX 6Table 3Page 3 of 3 pages
account of the following:
(i) Any strong arguments for slanting electricity tariffsbecause of price distortions (e.g. of substitutes forpublic electricity supply) elsewhere in the economywhich are likely to affect electricity sales in theabsence of such slanting.
(ii) The availability of surplus hydro energy when shortrun marginal costs are applicable and lower costinterruptible power can be sold to industries.
(iii) The need for VRA and ECG to meet rate of returncovenants.
(iv) Any income redistribution objectives of the government,e.g. the provision of a low price social block for lowincome consumers.
(v) Practicality and cost. There is a trade-off betweenthe cost of administering any tariff structure (whichdepends largely on the cost of metering and billing)and the extent to which it can reflect the structur-ing of marginal costs. Complex metering, forexample, since the response of small consumers to theextra incentives (or disincentives) it offers wouldnot justify the expense.

ANNEX 7Table 1Page 1 cf 2 pages
GHANA
Electricity Corporation of Ghana
Third Expansion Phase
Incremental Load Forecast
Undiversified Consumption
Maximum Demand (kW) GWh
Accra-Teshie
19781979 1,550 8.11980 1,700 8.7
Growth rate until 1994 12% 12%
Accra-Weija(i) Weija Waterworks
1978 1,600 7.41979 2,400 11.61980 2,900 13.71981 3,355 16.81982 3,882 18.91983 ' 4,492 21.51984 5,200 24.7GrowthContinuing until 1994 7% 7%
(ii) Irrigation
1978 -1979 - 1984 1,400 9.8After 1984Growth rate until 1994 2% 2%
Kumasi-Kumawu(i) Industries
1978 _1979 6,720 32.81980 6,720 32.8Growthrate until 1994 6% 6%

ANNEX 7Table 1Page 2 of 2 pages
Undiversified Consumption(ii) Towns Maximum Demand (kW) GWh
1978 _ _1979 1,393 5.51980 1,462 5.8C-'owthrate until 1994 6% 6%
Sefwi-Wiawso-Bibiani(i) Industries
19781979 6,720 32.8
(ii) Towns
1978 -1979 424 1.6Combined Growthrate towns and industries 10% 10%until 1994
Tarkwa-AbosoGlass Factory
1978 9,000 41.41979-1985 9,000 55.21985-2008 13,000 79.7
Tema Expansicn and Reinforcement(i) Firm load
1978 11,400 63.61979 11,600 65.11980 11,800 66.4Growthrate until 1994 3% 3%
(ii) Interruptible load
1978 11,400 85.01979 14,300 106.31980 16,600 123.81981 17,000 126.81982 17,300 129.21983 17,600 131.01984 17,620 131.2Surplus power will not be available after 1984.

ANNEX 7Table 2
GHANA Page 1 of 8 pages
Electricity Corporation of Ghana
Third Expansion Phase
Demand Forecasts, Rate of Return Calculations
Introduction
1. The material given in this Annex provides an amplification on theassumptions, methodology, and issues discussed in Chapter 4.
Demand Forecast
2. Domestic loads were forecast using the following assumptions:
(i) for the Teshie housing development, 0.5 krW maximumdemand per dwelling with a 50% load factor and nodemand diversity at system peak;
(ii) for the rural development areas of Sefwi-Wiawso andKumawu, 18 watts per capita maximum demand with nodiversity from system peak and a 45% load factor.
3. Industrial loads were forecast on the basis of written requests fromindustries for immediate and their forecast of future needs. Consideration wasalso given to the industrial potential of the areas served by each subproject.
4. In general load growth on the facilities provided by the project wasassumed to continue until the capacity of the line was reached - approximately15 years in most cases. If the line capacity had not been reached in 15 yearsit was assumed to remain constant thereafter. This approach was used becauseof uncertainty of demand for newly served areas and the consideration that ifthe project could not be justified with 15 years load growth, it was likely anuneconomical project in any event.
Accra-Teshie
5. The Ghana State Housing Corporation is undertaking a constructionprogram at Teshie of 2,200 dwellings in 6 phases to be completed in 1979. Thisportion of the ECG project will supply power to these dwellings (houses andapartments), to a 200 bed hospital, six schools and to commercial premises.Estimated demand is 1.7 MW and 9 GWh by 1980. Given the proximity to Accraand the potential for the area, a 12% growth rate in consumption has been fore-cast.
Accra-Weija Scheme
6. Power is required to increase pumping capacity at Weija waterworksand for an irrigation project 6 km beyond Weija. The water works is ovned bythe Ghana Water and Sewerage Corporation and supplies the Accra-Tema area.The expansion of pumping capacity is part of a Bank financed scheme while theirrigation project is sponsored by the Ministry of Agriculture. Power require-ments for the two schemes are estimated at about 4 MW and 21 GWh initially in
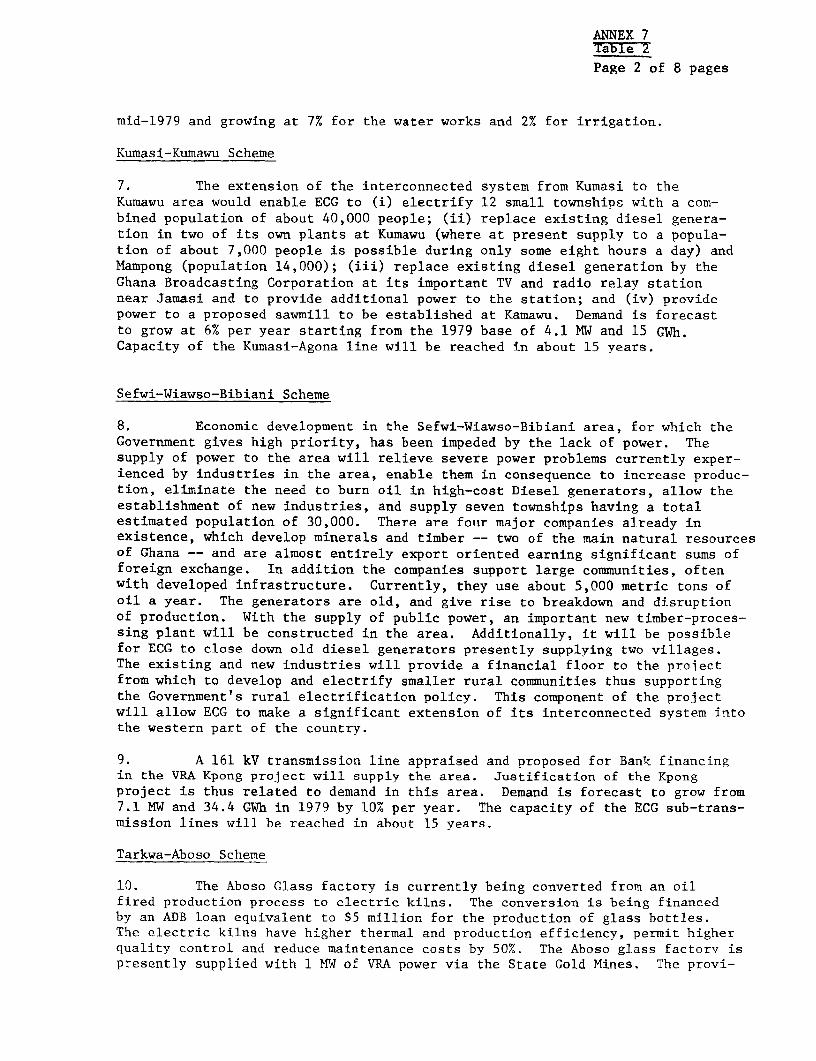
ANNEX 7Table 2
Page 2 of 8 pages
mid-1979 and growing at 7% for the water works and 2% for irrigation.
Kumasi-Kumawu Scheme
7. The extension of the interconnected system from Kumasi to theKumawu area would enable ECG to (i) electrify 12 small townships with a com-bined population of about 40,000 people; (ii) replace existing diesel genera-tion in two of its own plants at Kumawu (where at present supply to a popula-tion of about 7,000 people is possible during only some eight hours a day) andMampong (population 14,000); (iii) replace existing diesel generation by theGhana Broadcasting Corporation at its important TV and radio relay stationnear Jamasi and to provide additional power to the station; and (iv) providepower to a proposed sawmill to be established at Kamawu. Demand is forecastto grow at 6% per year starting from the 1979 base of 4.1 MW and 15 GWh.Capacity of the Kumasi-Agona line will be reached in about 15 years.
Sefwi-Wiawso-Bibiani Scheme
8. Economic development in the Sefwi-Wiawso-Bibiani area, for which theGovernment gives high priority, has been impeded by the lack of power. Thesupply of power to the area will relieve severe power problems currently exper-ienced by industries in the area, enable them in consequence to increase produc-tion, eliminate the need to burn oil in high-cost Diesel generators, allow theestablishment of new industries, and supply seven townships having a totalestimated population of 30,000. There are four major companies already inexistence, which develop minerals and timber -- two of the main natural resourcesof Ghana -- and are almost entirely export oriented earning significant sums offoreign exchange. In addition the companies support large communities, oftenwith developed infrastructure. Currently, they use about 5,000 metric tons ofoil a year. The generators are old, and give rise to breakdown and disruptionof production. With the supply of public power, an important new timber-proces-sing plant will be constructed in the area. Additionally, it will be possiblefor ECG to close down old diesel generators presently supplying two villages.The existing and new industries will provide a financial floor to the projectfrom which to develop and electrify smaller rural communities thus supportingthe Government's rural electrification policy. This component of the projectwill allow ECG to make a significant extension of its interconnected system intothe western part of the country.
9. A 161 kV transmission line appraised and proposed for Bank financingin the VRA Kpong project will supply the area. Justification of the Kpongproject is thus related to demand in this area. Demand is forecast to grow from7.1 MW and 34.4 GWh in 1979 by 10% per year. The capacity of the ECG sub-trans-mission lines will be reached in about 15 years.
Tarkwa-Aboso Scheme
10. The Aboso Glass factory is currently being converted from an oilfired production process to electric kilns. The conversion is being financedby an ADB loan equivalent to $5 million for the production of glass bottles.The electric kilns have higher thermal and production efficiency, permit higherquality control and reduce maintenance costs by 50%. The Aboso glass factorv ispresently supplied with 1 MW of VRA power via the State Gold Mines. The provi-

ANNEX 7Table 2Page 3 of 8 pages
sion of a separate supply will allow the Gold Mines to increase production inaddition to perm-itting the increase of production of bottles from 3,000 tonsper year to about 21,000 tons by 1980. Bottles are currently in short supplyin Ghana and 12,000 tons would have been imported in 1975, if import licenceshad been granted for the entire quantity demanded.
Tema Expansion and Reinforcements
11. The upgrading of supply to 33 kV from 11 kV and the direct connectionof two textile firms and a steel works to the VRA substation will permit (i)increases in production, (ii) the use of electrode boilers for steam generationusing surplus hydro energy, and (iii) will relieve existing facilities to allowfor additional load growth in Tema. Tema steelworks is planning to install afoundry, to rehabilitate its existing steelworks and to install an additionalfurnace to increase production. Additional firm power requirements areexpected to be 12 MW and 54 GWh The Ghana Textile Manufacturing Company isinstalling electrode boilers for steam generation. GTMC demand will increasefrom 7 MW and 42 GW.h Similarly, Tema Textiles is installing electrode boilersthereby increasing demand by 13 MW and 83 GWh.
Methodology for Comparing Costs and Benefits
12. The study life was taken as 33 years corresponding to the physicallife of the facilities provided by the project. Salvage value was assumed tobe nil. All costs and benefits were expressed in 1976 US dollars with localcomponents converted at a shadow exchange rate of 1.70 cedis/$. Present valueswere computed as at the beginning of 1976.
Generation Costs
13. The long run marginal cost of generation in Ghana will rise as Kpong,Bui, and thermal plants are brought on line according to the Acres EngineeringPower and Energy Studies report for VRA of May 1975. Firm loads for each ECGproject component must bear the long run marginal cost of generation as explainedin Chap. 4, para 4.05. The calculation of the long run marginal cost as of thebeginning of 1976 is based upon the costs of Kpong as given in the Kpong apprai-sal report and Acres' estimates of the cost of Bui and steam-electric thermalplants which are at present the most economical means of meeting projected loadgrowth. The long run marginal cost is expected to remain constant as thermalplants are added and as economies of scale offset real price increases in capi-tal costs. The capital costs of generating plus the necessary transmission faci-lities together with operating and maintenance costs are summarised below:
Average Capital CostInstalled Annual Gener- Trans- Annual
On-line Project Capacity Energy ation mission O&M FuelMW GWh $/kW l0b$ $mills/kWh
1980 Kpong 160 970 1,030 1.9 .047 -1985 Bui 170 1,040 1,165 27.9 .049 - /11990 Steam-electric 150 985 377 1.6 .193 58.0--
/1 Based on crude oil price of $12/bbl.

ANNEX 7Table 2Page 4 of 8 pages
14. The service life of Kpong and Bui are taken to be 50 years whilethat of steam-electric plants, 25 years. Average incremental costs basedon the sector forecast shown in Annex 5 were calculated as an aDproximationof the longrun marginal cost. The result is shown in Figure 1 for variousdiscount rates. As a point of reference, the average incremental cost ofenergy from Kpong is 20.3 $mills/kVIh but the total average incremental costincluding future generation plans is 22.9 $mills/kWh as at the beginningof 1976.
15. The cost of generation and transmission is shown as a presentvalue for 6% and 11% discount rates in Table 3. It is necessary to presentthe cost in this manner because the average incremental cost per kwh forgeneration and transmission depend on the discount rate. These costs cannot be treated as discrete cash flows but must be considered as economiccosts which depend on the discount rate. The discount rate cap not be fixedpriori because of the joint nature of the distribution and generation invest-
ments. An overall rate of return must be found; thus, it was necessary totreat generation costs as shown in Figures 1 and 2.
Low Voltage Distribution Costs
16. Low voltage distribution costs must be included in the overallprogram to supply electricity to final residential and commercial consumers.These costs will not be incurred for industries taking 33 kV supply. Totaldistribution costs of $300/kV7 were used in the appraisal of the Kpong reportfor subtransmission and low voltage. Low voltage is typically 50% of totaldistribution cost; therefore, $150/kW of annual incremental demand has beenadded to project costs for subtransmission. Additions to low voltage facili-ties is much more closely in phase with annual increases in peak power (x4)demand as these facilities are installed primarily to serve new customers andinvestments are less lumpy.
Additional Transformers
17. Additional transformer capacity must be added during the study lifeto some subprojects in order to permit loads to grow to line capacities. Thecost is estimated to be $10/kVA. These costs do not add substantially toprogram capital investment costs.
Valuation of Benefits
Liberian Tariff as a Proxy for Benefits
18. The 1976 Tariff and distribution of consumption in Liberia is shownbelow using a shadow exchange rate of 1.2 L$/US$.
% consumption $US/kwi-
Domestic 37 0.064Commercial 31 0.052Industrial 22 0.043Government and Street lighting 10 0.058
100 0.055 average

ANNEX 7Table 2Page 5 of 8 pagLs
19. The mix of consumption in the towns served by this project has beenassumed to be the same as for ECG overall in 1981 in order to compute theaverage value per kWh using 75% of the Liberian tariff as a proxy for bene-fits of consumption in these towns.
ECG 1981 % US$/kWh
Domestic (including 10% tax) 20 0.0528Commercial 18 0.0390Industrial 61 0.0323Street lighting 1 0.0435
100 0.0377 average
20. The average price which will be paid under the 1976 ECG tariff inUS$ at the shadow exchange rate of 1.70 cedis/$ is:
ECG 1981 % US$/kWh
Domestic (including 10% tax) 20 0.0225Commercial 18 0.0428Industrial 61 0.0156Street lighting 1 0.0472
100 0.0222 average
A comparison of the table above and that in para. 18 shows that the streetlighting and commercial rates are quite similar under both methods of valua-tion but domestic and industrial consumption are valued 135% and 148% more,respectively, using 75% of the Liberian tariff as the proxy for benefits,while the overall increase in value of benefits is 70%.
Interruptible Electricity for Steam Generation
21. If electrode boilers are used to generate steam which is currentlyproduced by burning oil, the benefit attributable to the use of electricityis the resource cost saving to Ghana. This saving is the crude oil plusrefinery and transportation costs but excluding taxes and dealer margins.If the quantity of steam produced is increased in the future and the indust-rialists' choice is between oil and electricity, then the benefit of electri-city consumption can be measured by the consumer cost of the oil alternativewhich includes tax and dealer margins.
22. The value of electricity used for steam generation in place of oilis shown below.
Official Rate Shadow RateCedis US$ Cedis US$
per kWh oil equivalentResource cost saving - existing 0.0090 0.0078 0.0132 0.0078steam generation
Consumer cost saving - additional 0.0128 0.0111 0.0142 0.084steam generation
These values are based on the 1975 crude oil price of $13.50/bbl.

ANNEX 7
Table 2Page 6 of 8 pages
Firm Industrial Loads At Tema
23. All loads at Tema other than the interruptible load for steam genera-tion at Tema are treated as firm loads which bear the long run marginal cost ofgeneration and transmission in addition to the project costs. The benefits ofthe firm consumption are valued at the 1976 tariff since there is no substitutefor this supply or other proxy for evaluation.
Diesel Generation Savings
24. Fuel and operation and maintenance costs will be saved for existingdiesel generators. Savings will be 0.050 $/kwh based on the following assump-tions.
$ /kMh
O&M 0.008Fuel at 0.3 kg/kWh and $147/ton 0.042
0.050
25. Existing generators at many locations must soon be replaced at acapital cost of $500/kw capacity.
Diesel Pumping
26. The alternative to ECG supply for pumping at Weija is diesel pumping.If the engine is coupled directly to the pump, the cost of the electric motoris saved. The energy equivalent cost of diesel pumping is estimated to be.
V,/kwh elec tricity euLivalent
capital cost 0.005O&M 0.008Fuel 0.042
Total 0.055
27. Specific cost and benefit assumptions relating to particular sub-projects are discussed below.
Aboso Glass Factory
28. The ADB appraisal report of the loan for the Aboso Glass Factorvassumes the price of electricity will be at the 1975 rate of 0.013 cedis/kwhin calculating projected income. The anticipated rate of return is about 20%by 1980. Assuming all other costs for the Glass Factory remain constant anda minimum acceptable financial return of 12%, the maximum value of electricityis about 3.4 times the budgeted amount or 0.026 $/kWh at the shadow exchangerate. ssuming that the 1976 tariff increase is passed on to Glass Factorycustomers this value becomes 0.034 $/kWh in 1976 terms.

ANNEX 7Table 2Page 7 of 8 pages
Rates of Return
29. The rate of return for each subproject and for the total projectwas determined by finding the discount rate which equalized the presentvalue of costs and benefits. The present values were normalized to a perkWh basis by dividing the present values of costs and benefits by thepresent value of consumption, that is:
PV(costs) = PV(benefitsPV(consumption) PV(consumption)
PV(costs) = PV(project) + PV(additional capital)+ PV(generation + transmission
PV(benefits = PV(oil savings) + PV(capital contributions)+ PV(other savings) + PV(revenues)
30. Rates of return for each subproject are as follows:
Non-substituable load valued at
Special1976 Load Tariff 1.7 x 1976Tariff Eliminated Tariff(1) (2) (3)
1. Accra-Teshie 8.4 8.4 18.52. Accra-Weija 21.4 21.4 21.43. Kumasi-Kumawi 2.6 2.6 7.54. Sefwi-Wiawso-Bibiani 5.7 5.7 11.05. Tarkwa-Aboso 14.9 14.9 14.46. Tema 0.1 5.5 13.9
Overall 10.0% 10.5% 14.2%
31. In column (1) the 1976 tariff is used to value consumption benefitsfor which there is no substitution such as diesel pumping at Weija or evi-dence of willingness to pay such as with the Aboso Glass Factory. In column(2) consideration is made of eliminating the special load tariff for thethree industries served at Tema and setting the tariff for firm power at thenormal industrial tariff. The interruptible load is still valued at the costof oil saved by using electrode boilers. In column (3) all firm load consump-tion for which there is no substitute or other proxy is valued at 1.7 timesthe 1976 ECG tariff. The firm load at Tema is valued at the full industrialtariff. ECG revenues account for approximately 30% of total benefits incolumn 1. The graph below shows the variation of the overall project rate ofreturn with increases in ECG tariff over the average 1976 level following theelimination of the special load tariff.

ANNEX 7Table 2Page 8 of 8 pages
32. The main conclusions that can be drawn from the rate of return cal-culation are that tariff levels and structure require review and adjustmentin order to prqWVide economically efficient price signals to consumers. Thisis particularly true for the special load tariffs.
20.0
Variation of Rate of Return withIncrease in ECG Tariff
15.0
0 .W
X Q
10,0_
1.0 1.5 2.0 2.5
Increase in average value of ECG tariff(times 1976) for portion of benefitsvalued using ECG revenues as proxy.

i Z ~ e _ F A I i
* 2
. . . . . . . * , . ... .
iti .,3 3 ¢,,2: - ......
- A
! | ~~~~~~~~~~~~~~~~~~~~~~~~~~~~~~~~I
| 4 , e z R a
j.~~~~~~~s
ag g 8> -gN I gz,U
__X<r!gg~~~~~~ ~ 2'!Xt1;~ -!a@-R2_ofo o5S$° s

TF V
:1 4~~~~~~~~~~~~~~~~~~~~~~~~~~~~~~~~~~~~~4
25tt.~~~~~~~~~~~~~~~~~~~~~~~~~~~~~~~~~~~~~~~~~~~~~~~~~~~~~~~~~~~~~~~~~~~~~~~~~~~~ I v-i K~~~~~~~~~~~~~~~~~~~~~~~~~~~~~~~~~~~~~~~~~~~~~~~~~~~~~~~~~~~~~~~~~~~~~~~~~~~~~~~~~~~~~~~~~~~~~~~~~~
TF~~~~~~~~~~~~~~~~~~~~-
q~

S-;-, _is n t S
4 I , X 0~~~~~~~~~~~~~~~~~~~~~~~~~~~~~~~~~~~~~~~~~~~~~~~~~~~~~~~~~~~~~~~~~~~~~~~~~~~~~~__ ~LK
-4- -,4,*40 CEfS , 4t
tt~~~~~~~~~~~~~~~~~~~~~~~~~~-
WL 0'Tt a TX
[~~~~~~~~~ 9 0 0 0 m tI L " - ;0; 0- -
._-V 0 i I; ± ----------
l~~~~~~~~~~~~~~~~~~~~~4+11 , |~M- 7_,

GHANAELECTRICITY COnPORATION OF GHANA
TIURD EXPANSION PHASEORGANIZATION
i . -- - -- - CHIEF - - mm -SECRETAR_Y
CHIEF INTERNAL amD F
+ ACCOUNTAT No on I ENGNEER LEGAL OFFICER
[- | ' | _. | ~~~~~~~~~~DEPUTY
SERVICES BUGETI fINANCIAL CHIEF PLANNING & OPERATiONS & POWER COMMERCIAL
SEVS STOllES ACCOUN35 SlOllES DEVELOPMENT CONSTRUCTION STATIONS ENGINEER
REGIONAL MANAGERS
ACCRA TEMA TAKOHADI KUMASI KOFORIOUA CAPE COAST | AMAL | HOLGATANGA HO SUNYANI
World Baiik-16123

ANNEX 9Table 1
GHAMA
ELECTRICITY CORPORATION OF GHANATIIIRD EXPANSION PEASE
INCOME STATEMENTS
--------- ACTUAL ----------------------- ------------------------- FORECAST--------------------------------
1971 1972 1973 1974 1975 1976 1977 1978 1979 1980 1981 1982
3Y1O ENERGY SALES GWH 608 640 712 773 819 941 1096 1277 1403 1465 1550 16983920 AVG PRTCE PER KWH 0.025 0.025 0.025 0.025 0.029 0,032 0.038 0.038 0,038 0,038 0.038 0,038
4105 THILOUSAND CEDT!,4110 OPE:RA II NG RFVENI $5411 5-4200 . 15504 .. 16463 __12B22 . 12322 .23824 -- 30112 -416A48 -__8526 -. 53314 -55620 --58200 - 6A52442'52 IOIAL SALES RElV 15504 16463 17822 19397 23874 30112 41648 48526 53314 55670 58900 645244270 0 THFER _ -. . --- 0 Q . -.- _.-.- 0 --- 1600 --- 5300 -- 15000 __263D0 -- 430004530 TOTAL. .- 155DO4 _16463 -.1822 _123Y2 _.23824 _.30112 -- 41648 __50126 _-58614 - -2Q62Q _85200 _lD2524
4601 OPERATrNG EXPENSES4602 - - -
4640 PURCHASED POWn 5392 5785 633q 6886 7414 9617 14244 16803 19170 20357 21471 233994650 GIUATION AO STANDhY 10(33 1122 136q 2415 3626 3800 4300 4800 5300 6000 6700 75004660 DIE'RIBuIrTlON 1409 1707 1705 2579 3535 3900 3900 3900 3900 3900 3900 390046t30 IRflNSI 3I'I 285 384 448 663 835 900 900 900 900 900: . 900 9004700 AtiMIN RECION 1134 1329 1337 2057 2863 2800 2800 2800 2800 2800 2800 28004710 ADMIN--HEAi OFFICE 1197 1266 1343 1.270 1255 1500 1500 1500 1500 1500 1500 15004720 OTHER 926 222 -125 0 0. 0 0 0 0 0 0 04730 BULK TAXI" INCUEASES 0 0 1i 0 0 0 o 3900 7100 11400 19000 365004950 DEPRECIATION 2161 2844 3051 3202 3365 4604 5788 6504 7244 8628 10163 113064975 TAXES - - 0 --- Q 0 ------Q ------- _ - - ._ D 22DQ A_4D ___5600 __.9300 A-120D00 130004990 roi AL .13532 _14652 -- 15462 __1lY22 __22823 .- 212l1 __36132 __45102 -53514 -64285 -28934 _.100805501Q OFERATING INCOME 1967 1804 2365 325 981 2991 5516 5019 5100 5885 6766 67195020 OTHER INCOME NE -- 522 _ _288 623 _._1044 ___1310 _ 460 - 6 .- .-- -,D ___ _460 ..46D .___460 _ 6Q5030 NET INCOME BEF INT 2539 2592 298q 1369 2291 3451 5976 5479 5560 6345 7226 71795040 TNT CHARGED OF .. 1022 .- 1243 ___219Y2 _-2052 ___2026 . 1202 --. 1502 .- __1223 ___1146 ---- 22S -. 2238 _ __2Q 405060 NET INCOME 1460 649 789 -690 215 1744 4469 4186 4414 5347 4988 5139
FUTURE TARIFF INCREASES(%I) - - - - - - - 3 7 15 14 15RATE OF RETURNON AV. NET FIXED ASSETS - 4.3 5.4 0.7 2.1 5.2 8.0 7.0 7.0 6.9 7.0 6.9ON ECG RATE BASE - 7.1 7.1 2.6 3.3 6.5 10.0 8.0 8.0 8.0 8.0 8.0OPERATING RATIO 7. 89 87 98 9f 90 87 90 91 92 92 94REV/GROSS PLANT 0.29 0.28 0.28 0.33 0.33 0.36 0.39 0.40 0.41 0.42 0.48DEPREC/GROSS PLANT 4.95 4.87 4.69 4.63 5.00 5.00 5.00 5.00 5.00 5.00 5.00
JANUARY 31, 1977

ANNEX 9Table 2
GHiANiAELECTRICITY CORPORATION OF GHANA
THIRD EXPANSION PHASEFORECAST FUND FLOWS
(o '000)
1P76 1.977 1978 1979 1980 1976-1980 1981 L 982TO TAL
60056007 ----.6010 INTERNAL. SOIJRCES6020 -NET INCOME BEF IN 3451 5976 5479 5560 6345 26811 7226 71796030 -DEPRECIA1'ION 4604 5788 6504 7244 8628 32768 10163 113066040 - CONSUMER CONTRIB -____50 _ 2305 _.__50 __._.5D _. _sn ___2505 _____5Q6060 TOTAL. 8105 14069 12033 12854 15023 62084 17439 18535
6080 OPERATIONAL RE-6081. QU:[REMENTS.0i90 WORKING CAPITAL -702 :1700 2600 2000 3300 8898 3200 74006100 D-E:EEB'r SER1,I IC E 3426 6475 4606 4683 4891 24081 5367 69636110 -D2IVI _DENDS _2 20 __2Q .. 2Q000 __8000 _2000 _..20006140 TOTAL. ____2224 __1Q125 . _2206 .. 8683 __0121 _.40272 _1562 _1163636160 NET AVAIL-ABLE6170 1::'ROM OPERATIONS 5381 3894 2827 4171 4832 21105 6872 2172
6190 CONSTRUCTION6:1.91 REQUIREME:N'T'S6210 -:Rll:'SED PROECT 0 14505 5554 2248 655 22962 0 06220 F LJ'TURE FR OJECT 0 0 0 0 7600 7600 13900 159006230 OTHER SOO 500 500 500 500 2500 SOO 500
6295 TOTAL .__.88 15005 ... ....... 654 .- 2Z48 __8255 . 33350 _14400 gQi&400
63:1.() B.LANCE TO FINANCE -4593 11111 3227 -1423 3923 12245 7528 14228
63.i0F'1NANCE D BY:6340 1::RO:11::''O.;E.:D LOAN 0 11018 3567 1332 448 16365 0 06350) FUTTR LOAN 0 0 0 0 3800 3800 7000 80006395 OTH-ER BOlRROWINGS . . ------… 0 --- _ …… __0 ------ __ - -_ 06460 TCDT Al . 0 11018 '3567 1332 4248 20165 7000 8000
6570 ERRORS & OMISSIONS 0 0 O0 0 0 0 06575 SURPLJ US (DEFICIT)6580 Oi F::lUNDWS 4593 -93 340 2755 325 7920 -528 --62286600 AC(ClJ MlU.L A'T'EDL 4593 4500 4840 7595 7920 7920 7392 1164
6710 NE'T' AVAILABLE6720 FROM OPE:RATIONS/6730 -CONSTRREU4]:ON 1i26 4 I…6740 -1:LANT IN C[F11::R-% 5.0 3.2 2.1 2.7 2.5 3.0 3.2 0.96750 DEBT SE:RVICE COVER 2.4 2.2 2.6 2.7 3.1 2.6 3.2i 2.7
JANUARY 31, 1977

ANNEX 9
Gr.ulA ~~~~~~~~~~~~Table tGHAXAILECTRICITY CO.PORArl0a OF GAbAA
THIRD EXPANSION PHASEBALANCE SHIEETS
1971 1972 1973 1974 1975 1976 1977 1978 1979 1980 1981 19612
7520 ---7540 ASSETS/550 --7560 PLANr IN OPERATION 56207 58644 66664 69788 75687 108462 .123060 137097 152678 192435 214103 2381547570 LESS: DEPRECIATION __143Z3 __l2214 __20101 __23301 __26656 __.1922 __52321 __6458D __28928 _2623B _116282 19116275130 NET PLANT 41834 41430 46563 46487 49031' 66540 70739 72517 73750 96197 , 97116 96992
7600 WORK IN PROGRESS 5091 13584 9849 8237 4167 2167 14993 21662 25215 12628 27344 44754
LIT 1U9381M3TS 0 0 a 0 192 4. UO 480 UO 4U 480 480
7625 CURRENT ASSETS7627 -CASH ANDi BANKS7630 OPERArIONAL REQLJ 5469 7011 7068 4338 4371 3200 4600 4800 5400 6300 7100 91007631 TEMPORARY SURF' 0 0 0 0 0 4593 4500 4840 7595 7920 7392 11647632 -ACCOUNTS REC 6021 6340 5254 5900 10211 10000 10000 13000 15000 18000 21000 270007635 -INVEN'TORIES 2682 2891 3726 6124 7302 8000 8000 8000 8000 13000 1ER00 t30007640 -URAL SLRT=XFICATION 240 764 0- 555 871 lOO 0 0 0 0 0 07645 -OTHER II _4020 -- _1223 ---- _382 ____436 ____584 -- 4- -_ 4 ...... . 49Q ..- A _. 9Q . . .-47670 TO-TAL 18482 18979 16435 17353 23339 27993 27500 31040 36395 40620 43892 45664
7690 TOTAL. 65407 73993 72847 72077 76729 97180 113712 125699 135840 149925 168832 . 187890
7710 LIABILITIES7720-7730 EQUITY7770 -CAPITAL 17312 17312 17312 17312 17312 17312 17312- 17312 17312 17312 17:312 173127820 -RETAINED EARNINGS 9478 9095 9072 8663 8781 10525 12994 15180 17594 20941 23929 270607870 RESERVE-RURALS 283 474 842 1590 2803 2803 2803 2803 2803 2803 200:3 28037910 RESERVE-MAINTENANC 1125 1250 1125 1125 0 0 -0 0 0 0 0 )7985 -REVALUATION RESER ___._Z22 .__2022 ___3641 -- 2942 .__3586 -_23122 __30512 -- 38301 __46228 _59391 __64923 2.. 256557995 TOTAL 28920 -30153 31992 31137 32482 53839 63628 73596 83987 95447 109017 1228.38
8010 LONG TERM DEBT 25360 32355 29061 28076 27497 25778 32316 33685 32785 34760 39447 44031
80030 CUR'NT LIABILITIES8040 -ACCOUNTS PAYABLE 5954 4944 4150 5932 8637 7500 7300 7900 8500 9100 9.00 10 708050 RURAL ELECTRIF. ---- _ 38 ------ .---- -_--0 ___1200 -- 0 …0- ______a ------ _ 0 ____ .… . _Q.8090 TOTAL 5954 4944 4538 5932 8637 9400 7300 7900 8500 9100 9700 10300
8108 CONSIJMER CONTRIBUT .. S1;73 -3 6541 ___2256 ___6932 __8113 --- 8163 _10468 __51S _10568 _10618 -... 1066S. l2189100 TOTAL 65407 73993 72847 72077 76729 97180 113712 125699 135840 149925 168832 I387fl90
9220 DEBT/DEBT A EQUITY 47 52 48 47 46 32 34 31 28 27 27 29221 DEBT/EQUTT - 0.9 1.1 - -,- -0.I 0.8 O.. 0.* -b0. 0.4 0.4 0.4 tr.49230 CURRENT RATIO 3.1 3.8 3.6 2.9 2.7 3.0 3.8 3.9 4.3 4.5 4.5 4.49240 RECEIVARLES/REV X 39 39 29 30 43 33 24 26 26 25 25 :9245 RECEIVABLES-DAYS 140 139 106 110 154 120 86 93 92 92 89 909250 NET/GROSS PLANT X 74 71 70 67 65 61 57 53 48 50 45 419270 PLANT INCREASE X 0 4 14 5 8 3 2 0 0 15 0 0
9280 ANNUAL REVALUATION 0.0 0.0 0.0 0.0 0.0 4040 11.0 11.0 11.0 11.0 11.0 11.0
JANUARY 31, 1977

ANNEX 9Table 4
GHANAELECTRICITY CORPORATION OF GHANA
THIRD EXPANSIOil PHASEDEBT SERVICE SCHEDULE
(0 '000)
1976 1977 1970 l J` 3I 1976-1980 1 9 R..3
900 DEBT STATEMENI950-
1000 IDA- L8 *l;H1040 -AMORT'EZArION 244 1446 552 586 627 34 55 66- 7.1310tt0 -BALANCE 9887 8441 7889 7303 6676 0 6009 52961110 -INTEREST (6.25%) 626 573 510 475 437 2620 396 353
1t500 IDA-256--GH1540 - AMORrIZATION 896 816 816 816 816 4160 816 8161580 - BALANCE 4237 3421 2605 1709 973 0 1S77 6591610 -INTERES1 (7.25%) 340 278 218 159 100 1095 41 -18
2000 KFW-I2040 --AMORTIZAIION 250 1560 501 501 501 3313 501 5012080 -BALANCE 6016 4456 3955 3454 2953 0 2452 19512110 -INTEREST (5.5%) 338 288 231 204 176 1237 149 121
2500 KFW-- II2540 -AMORTIZAInON 329 658 329 329 329 1974 329 3292580 -BALANCE 2862 2204 1875 1546 :1-17 0 888 5592610 -INTEREST (7.25%) 219 184 148 124 100 775 76 52
3000 BICC3080 -BAL.ANC1E 1717 1717 1717 171 1717 0 1717 17173110 -INTEREST (6.0%) 103 103 103 103 103 5t5 103 103
3500 BRITISH SUPPL]ERS'3580 --BALANCE t059 1059 1059 1059 1059 0 1059 10593610 -INTEREST (8.0%) 82 82 82 82 82 410 82 82
4000 PROFPOSED LOAN
4030 -BORROWINGS 0 11018 3567 1332 448 16365 0 04040 -AMORTIZATION 0 0 0 0 0 0 0 10544080 -BALANCE 0 11018 14585 159:17 16365 0 16365 1531l4110 -INTEREST (8.50%) 0 468 1088 1296 t372 4225 1391 134641.60 -COMMITMENT CHGE (0.7n5) 0 20 27 8 2 57 0 041.80 - LIC-X 100 100 100 100 100 0 0 04190 LliIC 0 488 1115 1305 1374 4282 0 0
4500 1:IJLJRE l_OAN4530 BORROW INGS 0 0 0 0 3800 3800 7000 80004580 -BALANCE 0 0 0 0 3800 0 10800 188004610 -INTEREST(8.50%) 0 0 0 0 190 190 730 14804660 -COMMITMENT CH(3E (0.75%) ( 0 0 0 56 56 86 304680 --I:rDC--X 0 0 0 0OO 100 0 100 1004690 -IDC 0 0 0 0 246 246 816 1510
9500 DEBT iUMMARY9510 --BO)RROWJNGS 0 11018 3567 1332 4248 20165 7000 80009520 -REPAYMENTS 1719 4480 2198 2232 2273 12902 2313 34139530 -BALANCE 25778 32316 33685 32785 34760 34760 39447 440349550 -COMMITMENT FEES 0 20 27 8 58 113 86 309560 -INTEREST 1707 1975 2381 2443 2560 11066 2968 35209570 -INTEREST g CF 1707 1995 2408 2451 2618 11179 3054 35509580 -DEBT SERVICE 3426 6475 4606 4683 4891 24081 5367 69639590 -IIDC 0 488 1115 1305 1620 4528 816 15109595 TOTAL OFENING 0 0 0 0 0 0 0 0
9660 AVE INT X 6.41 6.87 7.30 7.37 7.75 7.14 8.23 8.50
JANUARY 31, 1977

ANNEX 10Page 1 of 2 pages
GHANAELECTRICITY CORPORATION OF GHANA
THIRD EXPANSION PHASE
Assumptions Underlying Financial Forecasts
1. General: The 1976 forecast of operating expenses, other thanpurchased power, and working capital are based on actuals up to June 1976.Projections of operating expenses are shown in constant terms. Price con-tingencies are shown separately.
2. Energy Sales: Forecasts are based on appraisal estimateswhich are substantially in line with ECG's own projections and the projec-tions prepared by consultants (Acres) within the framework of the Kpongfeasibility report. The 1976 estimate is in line with actual sales up toJune 1976.
3. Average Revenue/kWh: The basis is the expected result of thetariff increase of October 1976.
4. Future Tariff Increases: Projections are tailored to provideECG with the additional revenues to achieve the required 8% return on ECG'srate base.
5. Purchased Power: The basis is the forecast power purchasestimes the average VRA rate resulting from the September 1976 increase.Additionally an overhead allowance of 0.2 Mills/kWh has been added.
6. Generation and Standby: The 1976 estimates were increases10% p.a. to reflect the sales growth to ECG's minor centers supplied bydiesel stations.
7. Distribution, Transport and Administration: The 1976 estimatesare held constant to reflect the targets under the proposed project toincrease staff productivity and to renew ECG's vehicle park.
8. Future Bulk Rate Increases: Projections are based on VRA'srevenue requirements to meet its agreed rate of return targets.
9. Price Congingencies: Estimates are based on the recently con-cluded three year contract with ECG's unions implying salary/wage increasesof 25% in 1977 and 5% thereafter. A new contract has been assumed for 1980.Unit fuel costs have been assumed to increase 10% p.a. Miscellaneous mater-ials are expected to increase initially 25% p.a. with yearly rates droppingto 15% by 1980.

ANNEX 10Page 2 of 2 pages
10. Depreciation: 5% on average gross fixed assets, an approximatereflection of historical values.
11. Other Income: A constant sum of 0 300,000 has been assumed toreflect income from installation charges and miscellaneous fees and profits.0 160,000 have been allowed for investment income.
12. Debt Service: Interest - on existing debts as per actual loandocuments. For the proposed Bank and on-lent IDA Credit, the Bank's standardterms have been applied. Future borrowing is estimated to cost 10% p.a.
13. Amortization: On existing debts, the scheduling is in linewith the Government's approval (i) to require payments of all arrears on theon-lent IDA I and KfW I Credits by 1977 and (ii) to extend the maturities ofthe on-lent IDA II and KfW II Credits from 1977 to 1982 and 1984 respectively.The Bank's standard terms have been applied to the proposed lending to ECG.
14. Construction Program: Proposed project as per appraised costinformation and construction program. The next major investment program hasbeen estimated on the basis of unit investment cost of US$ 300 (1976 prices)per kW demand. This basis has been derived from the cost of the proposedproject. Minor miscellaneous investments have been estimated at roughly0 500,000 p.a. as per ECG's information for 1976/77.
15. Plant in Operation: The proposed project is assumed to befully in service by the end of 1980.
16. Investments: Entry reflects ECG holding 96,000 ordinaryshares of a local cable manufacturer.
17. Cash-Operational Requirements: Estimates reflect requirementsof 1 month payroll and fuel expenses, 2 months purchased power expenses and 3months debt service.
18. Accounts Receivables: Starting in 1977 estimates are based on3 months billing.
19. Inventories: Held constant at 1976 levels to reflect ECG'sefforts to control further increases.
20. Rural Electrification-Receivables: 1976 entry reflects theGovernment payment of 0 1.0 as the first installment. In 1977 the Governmentis expected to have reimbursed ECG fully. Thereafter, regular settlement hasbeen assumed.
21. Accounts Payable: Estimates are based on the mid 1976 result.As ECG will actually be paying VRA's September 1976 billing in 12 monthlyinstallments, 0 790,000 are therefore judged to remain outstanding in thisrespect at the end of 1976. Accounts payable are estimated to grow at¢ 600,000 p.a. reflecting approximately the growth rate in sales.
22. Rural Electrification-Payables: 1976 entry reflects Governmentadvances for capital works in rural areas.

ANNEX 11
GHANAElectricity Corporation of Ghana (ECG)
Third Expansion Phase
Performance Indicators
A. EFFICIENCY INDICATORS 1975 1976 1977 1978 1979 1980 1981
I. Sales (kWh'000) per employee 160)to be determined after staff plan study iscompleted as recommended in para. 5.06.
II. Distribution losses (in %) 9.7 10.0 10.0 10.0 10.0 10.0 10.0
B. STAFFING PROFILE(a) % of daily rated employees 46)to be determined after staff plan study is(b) % of university and voca- 25)completed as recommended in para. 5.06.
tional trained staff
C. MARKET DEVELOPMENT (Sales-GWh)Minor centers 29 33 38 43 48 54 63All centers 819 941 1,096 1,277 1,403 1,465 1,550
D. FINANCIAL INDICATORSOperating cost (excluding energy to be determined once the assets are revaluedpurchased and depreciation) to as recommended in para. 6.13.revalued fixed assets
Financial rate of return 3.3 7.0 8.0 8.0 8.0 8.0 8.0
Operating ratio 92 90 90 90 90 90 90
Receivables on total revenuefrom energy (%) 43 33 25 25 25 25 25
% material in stock to sales to be determined after revaluation of invent-ories and review of inventory management sys-tem as recommended in para.5.11
I

PTt ~~~~~~~~~~~~~~~~~~~~~~~~~~~~~TA I~~~~~~~~~~~~~~~~~~~~~~BRD 12230U VOLTA fi _e,
U's MAY 1''76
' . 0 K | N .
* S~~~~~~~~~~~~~~~~~~~~~~~~~~~~~~~~~~~~~~~~~~~a
\ jjn W S t > > a o 5'40-
jG H ANA . Ofako Q L A
PROJECT _r-g.-~
...
~> LOCATION, f
STATION , TESHIE
7 AirporT / =.
POWER HOUSE OPEN P1Of~~~
A t- 5@ it y ? Q j;tr'35'B > __1 D nv CUoom Nn N uAg. a G H A N A
WE-JA 3sWATERWORKS = ' q LA 7 D t -PRGJECT COMPONENTSMILITARY INTHE ACCRA AREA
_r / t 5 7 \ t _ 4 ;f >, I; Q;, , X # ; ,! ROJECT WORKS
MIN iTRYOF AGRICULTURE LAObLc
IEESTON-AR,EA-; rN rChris 33kv Overhead Lmneshris~~~~ovsvBorg 33kv ~~~~~~~~Un,dergrovnd Cables
# / - J | B ' t T "'.' _ _ J ; t : = ;; lEes!b3ti e<- altf;tby tit z rl 0sl¢dXIEXI*IN
-& f : RFLF 0 0 n >,; 2 * VRA MAIN STATION,161/33kv
r' ACCRA A > 9 2 e S i<0 & ; a F; 331T1 kv Subsrations
-~~~~~~~ U . , ~ ~ ~ ~ ~ ~ ~ ~ ~ ~ ~ ~ ~~~~---Roodsu -t---', Roitroods
nAr M.Z PA; * Botianow R 0 RiversNUn 61Ž11 NA,~~~~~~~~~~~~~~~~~~~~~~~~~~~~~~~~~~~~~~~~~v


_ _ _ _ _ _ _ _ _._. .__ _ _ _ _:__ _ _ _ _ _t__ _ _ _ _ _ _ _ _'__ _ _ I_ 1I R D 1 2 2 3 1
OtJA ~~~~~~~~~~~~~~~--~~~~~~~~L ~~~~~~~~ ~~MAY 197
2 GHANA{~~~~~~~~~~~~~~~~~~~~~~~~~~
ACCRA
{1~~~~n 09 Oc,vev
TEM SUBTANSMSSIO GRIDfl! , A, ;v'' < ;.tW' .S;'- .0-~~~~~~~~~~~~~~~~~~~~~~~~~~~~~~~~~~~~~~~~~~~~~~~~~~~-
-- 33kv Undergroun Ca'eble, ,.Hs;A, o ,,................A.0 Wi''
Ai Resnforcemeet of Substations
1k v Ca blIe s *A ; i_A fA
5 ~~~~~O Consuner Transformer Stations ' . i
* Rood Netmork U*u 7Lf tx
O OO0 1 0 00 1 500 J;zi ; / |iu
o0 2000tn 3000 0oo 000 0000~m*_t<G A
FEET gij> m v-5


MAY 1976
UP P E R V O L T A X GHANA
__ _ _ .BK MAIN ELECTRICITY FACILITIESBOLGATANGA (] VRA new station related to the project
- S V /c ______ 33 KV lie tn be constructed ueder the project
6--161 KV llne to be coottru,tsd by VRA
- ---- F69 KV -ns to be constructed by VRA
PWALAGU - ',', Government rural electritrcaton progrem
36/36 U VRA s.bstations
16t KV VRA treestessee system in sen lce
…------- 33/11 KV ECG t-ra.sm.sioo lIce is strob-
SENU Center servedS Center s-ne by diese
-10- * WA 0 Centers seaod by hydro 10l
_ Diestl standby station
. Possible hydro projts
R_ , PONG-TAMALE 26/13 26 MW imtalled / 13 MW fire
a. k < I- * eX -*- In 2 lternaticool Bnundarbes
ENDI 0 20 40 60 6 0*TAMALE 0 S ~~~~MILES
7 KILOMETERS
WENCHI Le
I~~~~__ ttvtw3 c
jBEREKUM Iz
SUNYANI ULJ
, EAWAMAN ASANTOFIN = _ 3 ATi
.S 4 nP'SE . \ f~~~~~~BRIKS
w Sl *\B+SAMAANG | B_KWAI I?UN50 AKOSOM6o) SAM SITE
-6- \ p;/17 X s(DUN511 7 AKWATI,<HMKFRDA-'PNC
t sL! 26/ /JO 3URO 88/1 ADEISO4? ¢ ~ ~ = E k WKT
*) } 26/ 3 ) / \> tu $ LEGO N-- 'hi, _ 2 uw S LOrJb
KOJOKRT f 1rt3/l SWEDRU Avl 1013
31 tAanctd-Obafft1Os
____ PSteC]!~ AHOSO ; 63/169 SASEHO SENEGA . --TANOSO A EMN P , E A64, -' y - /
C 2,.L.,~~~~~~~~~~~~~~~~~j TjIJPPER ~ A
ESUASO) SAOS AVOCGliu ,~ '> If VOLTA
t G~~~~~IERIA
_______! If V f GSIRAvb< M EROON
01,~~~~~~~~~~~~~Q 0Mos V CEA A ,)GANON