residential research prime central...
TRANSCRIPT

Bank of England governor Mark Carney was likened to an ‘unreliable boyfriend’ by Treasury Select Committee member Pat McFadden in June.
The accusation was prompted by a perception Carney had given mixed signals about when the base rate will rise from its historic low of 0.5%.
The merits of raising interest rates, introducing stricter affordability tests and curtailing the government’s Help to Buy scheme are part of a wider debate over how far the government and central bank should intervene in the UK housing market to cool price inflation.
Prime central London buyers are not typically swayed by modest interest rate rises or stricter affordability tests.
Instead, slowing growth shows market forces are alive and well as increasingly price-sensitive buyers cause the market to self-correct.
There is uncertainty surrounding next May’s general election and how potential tax changes could affect the market but there is also a sense buyers are cautious about asking prices after 44 consecutive months of growth.
As figure 1 shows, exchanges, viewings and new applicants were down in June 2014 versus the same month last year.
Despite the fact underlying demand is softening, price growth was 8.1% in the year to June 2014 after a monthly rise of 0.8%.
Though prices are still growing and there is no indication a decline is likely, initial asking prices are now achieved with less frequency.
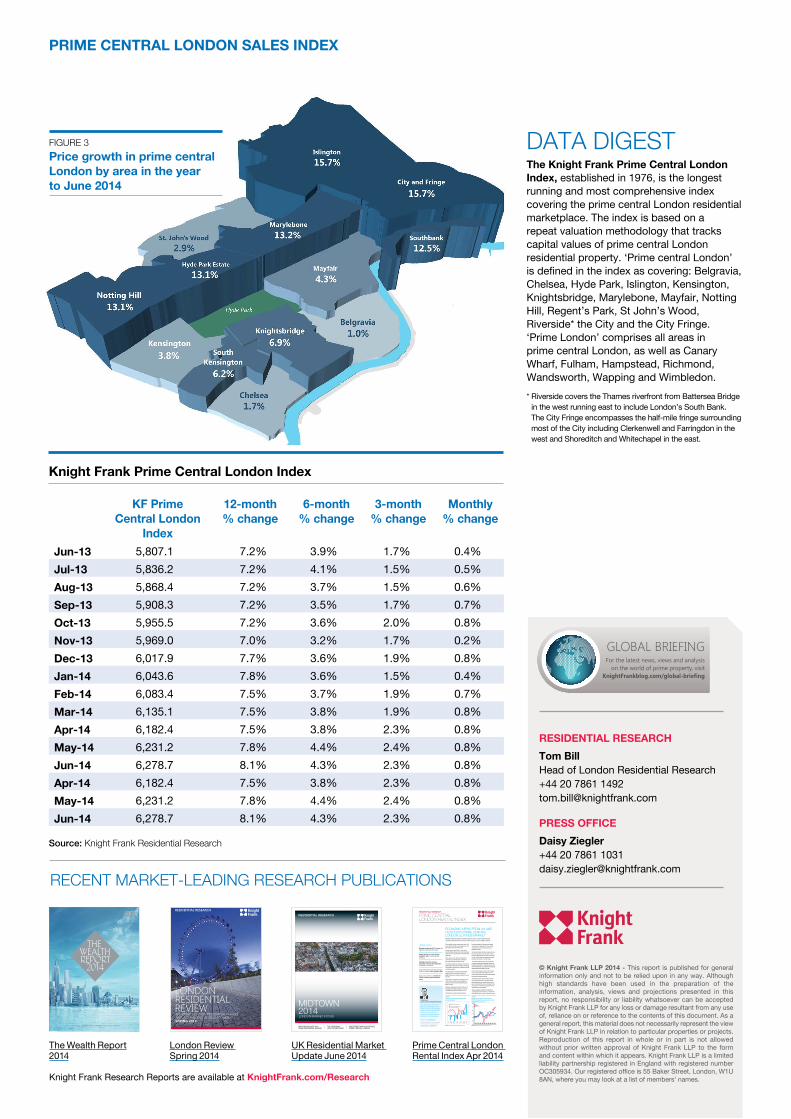
Price growth was strongest in the Islington and City & Fringe markets, where prices rose 15.7%, as the map on page 2 shows.
Elsewhere, Hyde Park, Marylebone and Notting Hill also recorded strong rises as buyers continued to look beyond the traditional markets further south.
To some degree, prices in these districts are catching up with areas further south such as Chelsea and Belgravia, which may start to act as a brake on growth.
By price bracket, the sub-£2 million market recorded the strongest growth of 13.6% in the year to June. That compared to 4.9% in the £5 million to £10 million price bracket and 3.5% for £10 million –plus properties.
JUNE 2014Prices rise 0.8% in June as annual growth reaches 8.1%
After 44 months of growth, there are signs buyers have become more cautious
Exchanges, viewings and new applicants are down on a year ago
Strongest growth was 15.7% in the eastern areas of Islington and City & Fringe
Strong growth north of Hyde Park means values will start to catch up with traditional prime areas further south
TOM BILL Head of London Residential Research
“Slowing growth shows market forces are alive and well as increasingly price-sensitive buyers cause the market to self-correct.” Follow Tom at @TomBill_KF
For the latest news, views and analysis on the world of prime property, visit Global Briefing or @kfglobalbrief
PRIME CENTRAL LONDON ASKING PRICES MODERATE AS MARKET SELF-CORRECTSAs policy makers intervene to cool UK house price growth, the market in prime central London is self-correcting, says Tom Bill
RESIDENTIAL RESEARCH
PRIME CENTRALLONDON SALES INDEX
FIGURE 1 A decrease in exchanges, viewings and new applicants
FIGURE 2 Price growth in prime central London by price bracket (Rebased to 100)
Source: Knight Frank Residential Research Source: Knight Frank Residential Research
Jan
13Fe
b 13
Mar
13
Apr 1
3M
ay 1
3Ju
n 13
Jul 1
3Au
g 13
Sep
13Oc
t 13
Nov 1
3De
c 13
Jan
14Fe
b 14
Mar
14
Apr 1
4M
ay 1
3Ju
n 14
95
100
105
110
115
120
125 Up to £1m£1m to £2m£2m to £5m£5m to £10mOver £10m
Instructions
June 13 June 14
Exchanges Viewings New applicants
-24.7%-36.7%
-5.5%-14.1%
RESIDENTIAL RESEARCHTom Bill Head of London Residential Research +44 20 7861 1492 [email protected]
PRESS OFFICE Daisy Ziegler +44 20 7861 1031 [email protected]
© Knight Frank LLP 2014 - This report is published for general information only and not to be relied upon in any way. Although high standards have been used in the preparation of the information, analysis, views and projections presented in this report, no responsibility or liability whatsoever can be accepted by Knight Frank LLP for any loss or damage resultant from any use of, reliance on or reference to the contents of this document. As a general report, this material does not necessarily represent the view of Knight Frank LLP in relation to particular properties or projects. Reproduction of this report in whole or in part is not allowed without prior written approval of Knight Frank LLP to the form and content within which it appears. Knight Frank LLP is a limited liability partnership registered in England with registered number OC305934. Our registered office is 55 Baker Street, London, W1U 8AN, where you may look at a list of members’ names.
PRIME CENTRAL LONDON SALES INDEX
RECENT MARKET-LEADING RESEARCH PUBLICATIONS
Knight Frank Research Reports are available at KnightFrank.com/Research
UK Residential Market Update June 2014
London Review Spring 2014
The Wealth Report 2014
Prime Central London Rental Index Apr 2014
MIDTOWN EVOLVES AS A PRIME RESIDENTIAL MARKET
THE CROSSRAIL UPLIFT IN MIDTOWN
INVESTMENT ANALYSIS VERSUS PRIME CENTRAL LONDON
RESIDENTIAL RESEARCH
MIDTOWN 2014LONDON MARKET FOCUS
RESIDENTIAL RESEARCH
LONDON RESIDENTIAL REVIEWTHE PRIME LONDON RESIDENTIAL MARKET AND A CHANGING GLOBAL ECONOMY SPRING 2014
LOCAL SALES AND LETTINGS MARKET PERFORMANCE
CHINESE BUYERS MAKE THEIR MARK
THE INVESTMENT CASE FOR PRIME LONDON
THE GLOBAL PERSPECTIVE ON PRIME PROPERTY AND WEALTH
thewealthreport2014
Prime central London rental values rose 1.6% in the first half of 2014, cementing a recovery that began at the start of the year.
Monthly growth was 0.9% in June, which was the highest increase since the index was produced on a monthly basis more than three years ago.
There was a -0.4% decline compared to June 2013 but if rental values continue to rise, annual growth will return in July.
The lettings market has started to rebound as global economies return to health, prompting companies to expand and increase corporate relocation budgets.
As a result of this more positive sentiment, global corporate relocation enquiries to Knight Frank are on course to be 50% up on last year.
Furthermore, viewings were up 26% on June 2013 and the number of new prospective tenants rose 36% over the same period, as figure 1 shows.
Business confidence across the UK was at its highest in at least 22 years, a survey by Lloyds Banking Group showed in June.
Global stock markets reacted positively
to the news that the US economy added more jobs than expected in June, cutting unemployment to the lowest rate since September 2008.
As figure 2 shows, the Dow Jones index has been a lead indicator for the prime central London lettings market over the last decade and its current trajectory suggests upwards pressure will remain on rental values.
The positive US economic data has started to boost markets like Kensington, which are typically more reliant on financial services and have benefitted as US companies increasingly relocate less senior staff to London.
As the map on page 2 shows, the recovery is at an early stage and the picture is not uniform across prime central London despite the positive underlying trends.
The lettings market is also likely to benefit from slowing demand in the sales market as buyers become more cautious over the pace of price growth and as uncertainty over the outcome of next May’s general election intensifies after the summer.
There are already signs the uncertainty is causing buyers and vendors to consider the rental option, as they have in previous cycles.
JUNE 2014Monthly growth was 0.9% in June, the highest in more than three years
Annual decline of -0.4% will turn positive in July if monthly growth continues
Viewings rose 26% and new prospective tenants increased 36% compared to June 2013
Corporate relocation enquiries to Knight Frank on course for 50% growth in 2014
Buyers and vendors to consider the rentals market as general election looms
TOM BILLHead of London Residential Research
“The Dow Jones index has been a lead indicator for the prime central London lettings market over the last decade and its current trajectory suggests upwards pressure will remain on rental values.”
Follow Tom at @TomBill_KF
For the latest news, views and analysis on the world of prime property, visit Global Briefing or @kfglobalbrief
ECONOMIC NEWS FROM UK AND US BOOSTS PRIME CENTRAL LONDON LETTINGS MARKETRental values in prime central London rose in June and financial markets indicate the recovery will continue, as Tom Bill explains
RESIDENTIAL RESEARCH
PRIME CENTRALLONDON RENTAL INDEX
FIGURE 1Viewings, prospective tenants and prices increase
FIGURE 2Performance of PCL rental index, FTSE 100 and Dow Jones index in the last decade (rebased to 100)
Source: Knight Frank Residential Research Source: Knight Frank Residential Research60
80
100
120
140
160
180
May
-05
May
-06
May
-07
May
-08
May
-09
May
-10
May
-11
May
-12
May
-13
May
-14
1.0%
0.8%
0.6%
0.4%
0.2%
0.0%
-0.2%
-0.4%
-0.6%
-0.8%
180
160
140
120
100
80
60
40
20
0Inde
x of
new
pro
spec
tive
tena
nt a
nd v
iewin
g vo
lum
es, r
ebas
ed to
100
in J
une
2013
Jun-
13
Jul-1
3
Aug-
13
Sep-
13
Oct
-13
Nov
-13
Dec-
13
Jan-
14
Feb-
14
Mar
-14
Apr-1
4
May
-14
Jun-
14
Monthly change in prime rents PCL FTSE 100 Dow Jones Volume of new prospective tenants
Volume of tenant viewings
FIGURE 3 Price growth in prime central London by area in the year to June 2014
DATA DIGESTThe Knight Frank Prime Central London Index, established in 1976, is the longest running and most comprehensive index covering the prime central London residential marketplace. The index is based on a repeat valuation methodology that tracks capital values of prime central London residential property. ‘Prime central London’ is defined in the index as covering: Belgravia, Chelsea, Hyde Park, Islington, Kensington, Knightsbridge, Marylebone, Mayfair, Notting Hill, Regent’s Park, St John’s Wood, Riverside* the City and the City Fringe. ‘Prime London’ comprises all areas in prime central London, as well as Canary Wharf, Fulham, Hampstead, Richmond, Wandsworth, Wapping and Wimbledon.* Riverside covers the Thames riverfront from Battersea Bridge
in the west running east to include London’s South Bank. The City Fringe encompasses the half-mile fringe surrounding most of the City including Clerkenwell and Farringdon in the west and Shoreditch and Whitechapel in the east.
Knight Frank Prime Central London Index
KF Prime Central London
Index
12-month % change
6-month % change
3-month % change
Monthly % change
Jun-13 5,807.1 7.2% 3.9% 1.7% 0.4%Jul-13 5,836.2 7.2% 4.1% 1.5% 0.5%Aug-13 5,868.4 7.2% 3.7% 1.5% 0.6%Sep-13 5,908.3 7.2% 3.5% 1.7% 0.7%Oct-13 5,955.5 7.2% 3.6% 2.0% 0.8%Nov-13 5,969.0 7.0% 3.2% 1.7% 0.2%Dec-13 6,017.9 7.7% 3.6% 1.9% 0.8%Jan-14 6,043.6 7.8% 3.6% 1.5% 0.4%Feb-14 6,083.4 7.5% 3.7% 1.9% 0.7%Mar-14 6,135.1 7.5% 3.8% 1.9% 0.8%Apr-14 6,182.4 7.5% 3.8% 2.3% 0.8%May-14 6,231.2 7.8% 4.4% 2.4% 0.8%Jun-14 6,278.7 8.1% 4.3% 2.3% 0.8%Apr-14 6,182.4 7.5% 3.8% 2.3% 0.8%May-14 6,231.2 7.8% 4.4% 2.4% 0.8%Jun-14 6,278.7 8.1% 4.3% 2.3% 0.8%
Source: Knight Frank Residential Research