prime central london sales index - october 2014 - knight...
TRANSCRIPT
Prices in prime central London were flat in October, ending a four-year period of uninterrupted growth.
The positive run began in November 2010, the same month Ireland became the second European country after Greece to receive a bailout as concerns grew over the future of the eurozone.
Ireland has since left its bailout programme and the economic risks that drove buyers into the safety of London property have been superseded by political risks that have created a mood of caution. As a result there is growing evidence that asking prices are having to adjust to more subdued market conditions.
The risks include the possibility of a ‘mansion tax’ after next May’s general election, a proposal that pre-dates the Irish bailout by a year, though it is a prospect that has moved into the foreground as the election approaches.
Its potential impact remains difficult to assess given a lack of detail but the behaviour of prices in prime central London suggests a certain level of risk is already priced in.
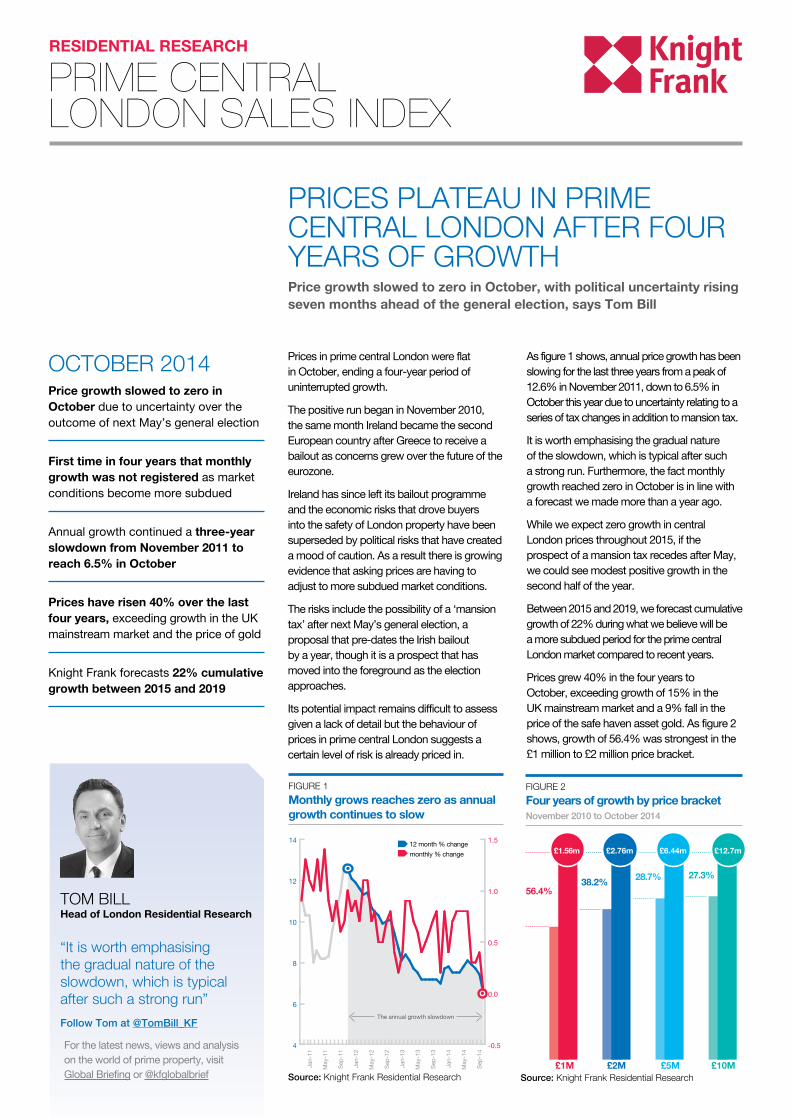
As figure 1 shows, annual price growth has been slowing for the last three years from a peak of 12.6% in November 2011, down to 6.5% in October this year due to uncertainty relating to a series of tax changes in addition to mansion tax.
It is worth emphasising the gradual nature of the slowdown, which is typical after such a strong run. Furthermore, the fact monthly growth reached zero in October is in line with a forecast we made more than a year ago.
While we expect zero growth in central London prices throughout 2015, if the prospect of a mansion tax recedes after May, we could see modest positive growth in the second half of the year.
Between 2015 and 2019, we forecast cumulative growth of 22% during what we believe will be a more subdued period for the prime central London market compared to recent years.
Prices grew 40% in the four years to October, exceeding growth of 15% in the UK mainstream market and a 9% fall in the price of the safe haven asset gold. As figure 2 shows, growth of 56.4% was strongest in the £1 million to £2 million price bracket.
OCTOBER 2014Price growth slowed to zero in October due to uncertainty over the outcome of next May’s general election
First time in four years that monthly growth was not registered as market conditions become more subdued
Annual growth continued a three-year slowdown from November 2011 to reach 6.5% in October
Prices have risen 40% over the last four years, exceeding growth in the UK mainstream market and the price of gold
Knight Frank forecasts 22% cumulative growth between 2015 and 2019
TOM BILL Head of London Residential Research
“It is worth emphasising the gradual nature of the slowdown, which is typical after such a strong run” Follow Tom at @TomBill_KF
For the latest news, views and analysis on the world of prime property, visit Global Briefing or @kfglobalbrief
PRICES PLATEAU IN PRIME CENTRAL LONDON AFTER FOUR YEARS OF GROWTHPrice growth slowed to zero in October, with political uncertainty rising seven months ahead of the general election, says Tom Bill
RESIDENTIAL RESEARCH
PRIME CENTRALLONDON SALES INDEX
FIGURE 1 Monthly grows reaches zero as annual growth continues to slow
FIGURE 2 Four years of growth by price bracket November 2010 to October 2014
Source: Knight Frank Residential Research Source: Knight Frank Residential Research
27.3%28.7%38.2%
£1M £2M £5M £10M
56.4%
4
6
8
10
12
14
-0.5
0.0
0.5
1.0
1.5
Jan-
11
May
-11
Sep-
11
Jan-
12
May
-12
Sep-
12
Jan-
13
May
-13
Sep-
13
Jan-
14
May
-14
Sep-
14
The annual growth slowdown
12 month % change monthly % change £1.56m £2.76m £6.44m £12.7m
RESIDENTIAL RESEARCHTom Bill Head of London Residential Research +44 20 7861 1492 [email protected]
PRESS OFFICE Daisy Ziegler +44 20 7861 1031 [email protected]
© Knight Frank LLP 2014 - This report is published for general information only and not to be relied upon in any way. Although high standards have been used in the preparation of the information, analysis, views and projections presented in this report, no responsibility or liability whatsoever can be accepted by Knight Frank LLP for any loss or damage resultant from any use of, reliance on or reference to the contents of this document. As a general report, this material does not necessarily represent the view of Knight Frank LLP in relation to particular properties or projects. Reproduction of this report in whole or in part is not allowed without prior written approval of Knight Frank LLP to the form and content within which it appears. Knight Frank LLP is a limited liability partnership registered in England with registered number OC305934. Our registered office is 55 Baker Street, London, W1U 8AN, where you may look at a list of members’ names.
PRIME CENTRAL LONDON SALES INDEX
RECENT MARKET-LEADING RESEARCH PUBLICATIONS
Knight Frank Research Reports are available at KnightFrank.com/Research
Mayfair Report 2014London Review Summer 2014
The Wealth Report 2014
Prime Central London Rentals Index September 2014
THE EPICENTRE OF LUXURY LONDON
THE RETAIL EFFECT ON RESIDENTIAL PRICES
RESIDENTIAL RESEARCH
MAYFAIR 2014LONDON MARKET FOCUS
REGAINING ITS STATUS AS LONDON’S LEADING ADDRESS
RESIDENTIAL RESEARCH
CAUTION RISES IN THE PRIME LONDON SALES MARKET
TEN AREAS OF LONDON WHERE PRICES MOVE IN UNISON
THE LETTINGS MARKET RECOVERY
LONDON RESIDENTIAL REVIEWSHORT-TERM UNCERTAINTY COOLS DEMAND IN PRIME LONDON SUMMER 2014THE GLOBAL PERSPECTIVE ON PRIME PROPERTY AND WEALTH
thewealthreport2014
-3%
-2%
-1%
0%
1%
2%
3%
Oct
-13
Nov
-13
Dec-
13
Jan-
14
Feb-
14
Mar
-14
Apr-1
4
May
-14
Jun-
14
Jul-1
4
Aug-
14
Sep-
14
Oct
-14
2.1
2.2
2.3
2.4
2.5
2.6
2.7
2.8
2.9
3.0
3.1
Oct
-13
Nov
-13
Dec-
13
Jan-
14
Feb-
14
Mar
-14
Apr-1
4
May
-14
Jun-
14
Jul-1
4
Aug-
14
Sep-
14
Oct
-14
Rental values in prime central London rose for the eighth successive month in October, recovering to a level last seen two years ago.
In October 2012, rental values were at the early stage of a shallow decline that took place against the background of a tepid economy and a strong sales market.
Two years later, the International Monetary Fund forecasts that UK economic growth will outpace other developed countries in 2014, at the same time demand in the sales market has shown signs of cooling ahead of next May’s general election and uncertainty surrounding the possibility of a mansion tax.
Monthly growth of 0.5% in October took the annual increase in rents to 2.6%, which was the highest rate since December 2011.
Furthermore, demand in the third quarter of 2014 exceeded the same period last year, with tenancies agreed up by a quarter and tenancies started rising by a third, as figure 1 shows.
With UK economic data remaining mixed, the prime central London rental market is still not in full-blown recovery mode.
Though the number of new prospective tenants and viewings rose in October compared to the same month last year, the number of tenancies started is likely to end the month down, which reflects the hesitant nature of the recovery.
The positive IMF forecast should be balanced against data from accountant E&Y that showed the number of profit warnings issued by UK companies between July and September was the highest in the period for six years.
In a further move that may dampen demand in the short term, mortgage lenders have cut rates as the likelihood of an imminent interest rate rise recedes. Lenders are also attempting to bolster their loan books after a slower period that followed the introduction of stricter lending criteria earlier this year.
In positive news for investors, rental yields recorded their biggest monthly increase in more than three years, rising to 2.9% in October. As figure 2 shows, the spread between prime central London yields and the so-called risk-free rate of a ten-year government bond has widened notably in recent months.
OCTOBER 2014Rental values rose 0.5% in October, the eighth successive rise
Annual growth was 2.6%, the highest rate since December 2011
In the third quarter of 2014, tenancies agreed rose by a quarter and tenancies started increased by a third
Rental yields rose to 2.9%, recording the biggest monthly gain in more than three years
The spread between prime central London yields and UK government bonds has widened
TOM BILL Head of London Residential Research
“The prime central London rentals market is not in full-blown recovery mode despite the broad upwards trend” Follow Tom at @TomBill_KF
For the latest news, views and analysis on the world of prime property, visit Global Briefing or @kfglobalbrief
RECOVERY IN RENTS AND YIELDS REMAINS HESITANT IN PRIME CENTRAL LONDONRental values climbed in October as the UK economic recovery strengthened and yields saw the strongest improvement in three years, as Tom Bill explains.
RESIDENTIAL RESEARCH
PRIME CENTRALLONDON RENTAL INDEX
FIGURE 1 Rising demand and rental values Annual growth
FIGURE 2 The strengthening investment case
Source: Knight Frank Residential Research Source: Knight Frank Residential Research
DO
WN
UP
Tenancies agreed
Tenancies commenced
+15%+24% +34%
New prospective
tenantsl July to September 2014 vs 2013
Prime central London yield (%) Ten-year UK government bond yield (%)
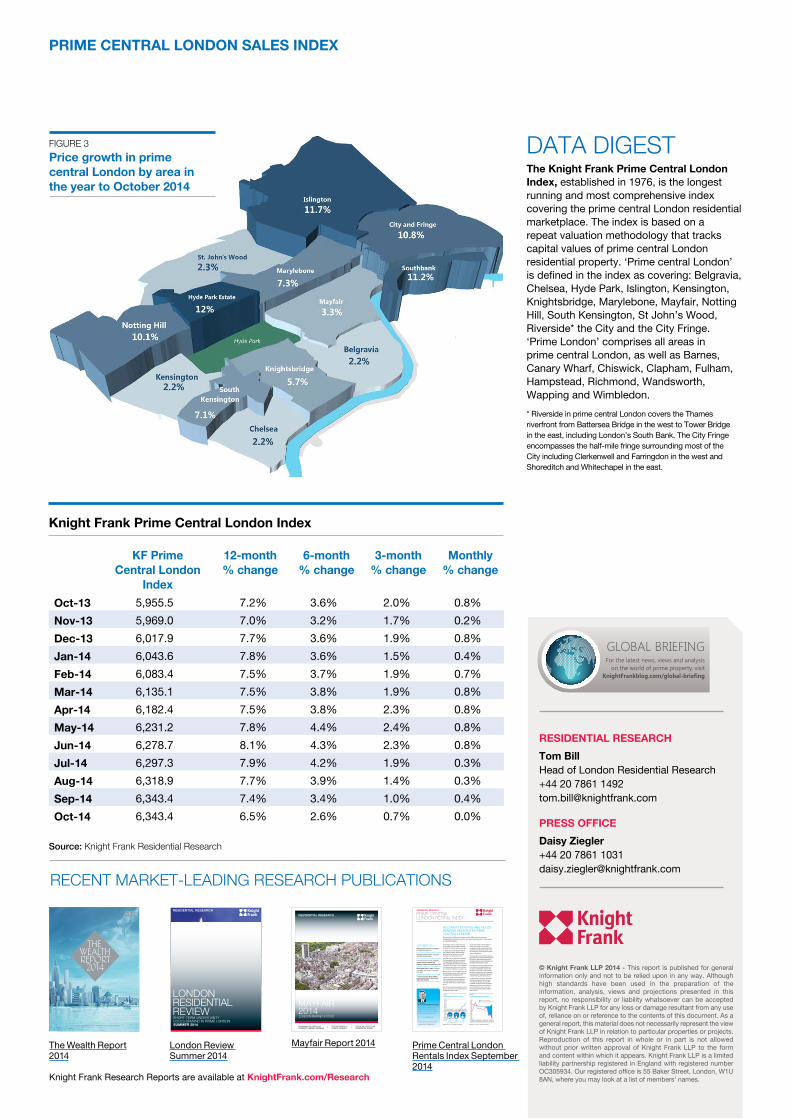
FIGURE 3 Price growth in prime central London by area in the year to October 2014
DATA DIGESTThe Knight Frank Prime Central London Index, established in 1976, is the longest running and most comprehensive index covering the prime central London residential marketplace. The index is based on a repeat valuation methodology that tracks capital values of prime central London residential property. ‘Prime central London’ is defined in the index as covering: Belgravia, Chelsea, Hyde Park, Islington, Kensington, Knightsbridge, Marylebone, Mayfair, Notting Hill, South Kensington, St John’s Wood, Riverside* the City and the City Fringe. ‘Prime London’ comprises all areas in prime central London, as well as Barnes, Canary Wharf, Chiswick, Clapham, Fulham, Hampstead, Richmond, Wandsworth, Wapping and Wimbledon.* Riverside in prime central London covers the Thames riverfront from Battersea Bridge in the west to Tower Bridge in the east, including London’s South Bank. The City Fringe encompasses the half-mile fringe surrounding most of the City including Clerkenwell and Farringdon in the west and Shoreditch and Whitechapel in the east.
Knight Frank Prime Central London Index
KF Prime Central London
Index
12-month % change
6-month % change
3-month % change
Monthly % change
Oct-13 5,955.5 7.2% 3.6% 2.0% 0.8%Nov-13 5,969.0 7.0% 3.2% 1.7% 0.2%Dec-13 6,017.9 7.7% 3.6% 1.9% 0.8%Jan-14 6,043.6 7.8% 3.6% 1.5% 0.4%Feb-14 6,083.4 7.5% 3.7% 1.9% 0.7%Mar-14 6,135.1 7.5% 3.8% 1.9% 0.8%Apr-14 6,182.4 7.5% 3.8% 2.3% 0.8%May-14 6,231.2 7.8% 4.4% 2.4% 0.8%Jun-14 6,278.7 8.1% 4.3% 2.3% 0.8%Jul-14 6,297.3 7.9% 4.2% 1.9% 0.3%Aug-14 6,318.9 7.7% 3.9% 1.4% 0.3%Sep-14 6,343.4 7.4% 3.4% 1.0% 0.4%Oct-14 6,343.4 6.5% 2.6% 0.7% 0.0%
Source: Knight Frank Residential Research