research report 003 - health and safety · pdf fileinvestigation of shedding of slings from...
TRANSCRIPT

HSE Health & Safety
Executive
Investigation of shedding of slingsfrom crane hooks - phase 2
Prepared by Sparrows Offshore Services Ltd
for the Health and Safety Executive 2003
RESEARCH REPORT 003

HSE Health & Safety
Executive
Investigation of shedding of slings from crane hooks - phase 2
Colin Duncan Sparrow Offshore Services Ltd
Denmore Road Bridge of Don
Aberdeen AB23 8JW
Vic Sessin Independent Consultancy Engineering
Loughton Essex
This report details the investigation into the phenomenon of Interrupted Simple Harmonic Motion (ISHM) and it’s influence on the potential for indiscriminate shedding of slings and pennants for crane hooks.
The findings of this report are that the final pendulum length of a system, which has side-lead, off-lead or a combination of side-lead and off-lead whilst hoisting, is a critical factor which determines if the system is susceptible to indiscriminate shedding.
The hookblock accelerations relating to systems operating with Simple Harmonic Motion or Interrupted Simple Harmonic Motion are recorded and analysed.
The recorded data is treated to determine the sensitivity of the system to a variety of variables.
This report and the work it describes were funded by the Health and Safety Executive. Its contents, including any opinions and/or conclusions expressed, are those of the authors alone and do not necessarily reflect HSE policy.
HSE BOOKS

© Crown copyright 2003
First published 2003
ISBN 0 7176 2696 2
All rights reserved. No part of this publication may bereproduced, stored in a retrieval system, or transmitted inany form or by any means (electronic, mechanical,photocopying, recording or otherwise) without the priorwritten permission of the copyright owner.
Applications for reproduction should be made in writing to: Licensing Division, Her Majesty's Stationery Office, St Clements House, 2-16 Colegate, Norwich NR3 1BQ or by e-mail to [email protected]
ii

Table Of Contents
Table Of Contents .................................................................................................. iii
Executive Summary ................................................................................................ v
1.0 Introduction.................................................................................................. 1
2.0 Background.................................................................................................. 3
2.1 Involved Parties ........................................................................................... 3
2.2 Description Of System ................................................................................ 3
2.2.1 Effective Length....................................................................................... 3
2.2.2 System Damping...................................................................................... 4
2.2.3 Sources of Damping ................................................................................ 4
2.3 Final Pendulum Length Definition .............................................................. 5
2.4 Scenarios ..................................................................................................... 6
2.4.1 Scenario 1 (S1)......................................................................................... 6
2.4.2 Scenario 2 (S2)......................................................................................... 7
2.4.3 Scenario 3 (S3)......................................................................................... 7
2.5 Critical Pendulum Length ........................................................................... 8
2.6 Frequency Coupling Effects ....................................................................... 8
2.7 Energy Transfers Within The System......................................................... 8
3.0 Test Programme .......................................................................................... 9
4.0 Data Analysis ............................................................................................. 11
4.1 System Inputs ............................................................................................ 11
4.2 Critical Pendulum Length Versus Pennant Length ................................. 11
4.3 System Outputs ......................................................................................... 13
4.3.1 Maximum Acceleration Values.............................................................. 13
4.3.2 Mean And Median Accelerations .......................................................... 16
4.4 Baseline Hookblock Analysis ................................................................... 17
4.5 Chain Pennant Analysis ............................................................................ 18
4.5.1 Chain Pennant Construction Effects .................................................... 18
iii

4.6 Dynamic forces.......................................................................................... 19
4.7 Scenarios ................................................................................................... 23
4.7.1 Scenario 1 .............................................................................................. 23
4.7.2 Scenario 2 .............................................................................................. 23
4.7.3 Scenario 3 .............................................................................................. 23
4.7.4 Description of Scenario 3 Incidents encountered. .............................. 24
4.8 Sling Shedding Mechanisms .................................................................... 28
4.9 Summary Of Results ................................................................................. 29
5.0 Conclusions ............................................................................................... 31
6.0 Recommendations..................................................................................... 33
7.0 Recommended Further Work.................................................................... 35
Appendix 1 Test Equipment And Methods ................................................... 37
Appendix 2 Critical Pendulum Length Data Analysis .................................. 47
Appendix 3 Critical Length Ratio Data Analysis .......................................... 55
Appendix 4 Acceleration Data Analysis ....................................................... 59
Appendix 5 Baseline Hook Block Data analysis .......................................... 63
Appendix 6 Chain Pennant Accelerations .................................................... 67
Appendix 7 Photographs ............................................................................... 71
Appendix 8 Base Data Table.......................................................................... 77
Appendix 10 References.................................................................................. 81
iv

Executive Summary
This report details the investigation into the phenomenon of Interrupted Simple Harmonic Motion (ISHM) and it’s influence on the potential for indiscriminate shedding of slings and pennants for crane hooks.
The findings of this report are that the final pendulum length of a system, which has side-lead, off-lead or a combination of side-lead and off-lead whilst hoisting, is a critical factor which determines if the system is susceptible to indiscriminate shedding.
The hookblock accelerations relating to systems operating with Simple Harmonic Motion or Interrupted Simple Harmonic Motion are recorded and analysed.
The recorded data is treated to determine the sensitivity of the system to a variety of variables.
The main finding of this report include the following:
· Any system in which ISHM occurs is at risk of indiscriminate shedding of unloaded slings and pennants.
· If shedding does occur it is possible that the shed sling /pennant will land outside of the working radius of the crane. The crane operator is also at risk not only from direct impact of shed pennants but from secondary impact caused by the possibility of a pennant travelling down the boom hoist rope.
· The energy with which shed slings and pennants impact the ground may often be in excess of the potential energy of the pennant.
· The risk of shedding can dramatically be reduced by control of hook to attached pennant / sling eye geometry.
· If shedding does not occur there is still the potential for serious damage to lifting equipment, lifting accessories or surrounding equipment if the system is allowed to operate with ISHM.
· Pennant length is potentially the most critical factor in determining the critical pendulum length of any given system.
· The swivel action of a hook block has an insignificant effect on the critical pendulum length of a system.
· The pivot action of a hook block has a significant effect on the critical pendulum length of a system. If no pivot action is present then the critical pendulum length of the system will increase dramatically.
v

vi

1.0 Introduction
The forces and their effects arising from a phenomenon identified and termed ‘Interrupted Simple Harmonic Motion’ (ISHM) by Vic Sessin of Independent Consultancy Engineering during the Phase 1 shedding test programme at the Health and Safety Laboratory, was found to be a major cause for the indiscriminate shedding of unloaded slings & pennants from crane hooks.
The findings from the Phase 1 study are contained within HSE report OTO2001 054.
At the request of the Health & Safety Executive (HSE), Sparrows Offshore Services were contracted to set-up and control a test programme to further investigate the phenomenon of Interrupted Simple Harmonic Motion (ISHM) and it’s effects on the potential for the shedding of slings & pennants. This further study was instigated from the findings of the Phase 1 study. The aim of this phase of testing was to investigate the underlying conditions likely to cause shedding and gather data on the motions involved with respect to Interrupted Simple Harmonic Motion.
Both Phase 1 and Phase 2 of the study into the indiscriminate shedding of slings and pennants, and supporting videos, were initiated and funded by the Offshore Safety Division of the Health & Safety Executive.
1

2

2.0 Background
2.1 Involved Parties
The tests documented within this report were conducted at the Sparrows Offshore Services Training Centre located at Tyrebagger Quarry, Aberdeen, Scotland.
Sparrows Offshore Services were contracted to conduct the test programme and prepare the final report.
Data acquisition services were provided by AV Technology Limited (AVT) to Sparrows Offshore on a sub-contact basis.
Independent Consultancy Engineering provided consultant services to the test programme on behalf of the HSE.
2.2 Description Of System
The system under study consists of two main elements: 1) Hoist line: This can be considered as a driving pendulum with decreasing
length at a fixed rate. 2) Sling / Pennant: This can be considered as a driven pendulum of fixed length
where the driving displacement / accelerations are provided by the hoist line.
Pendulums And Simple Harmonic Motion
When considering a theoretical simple pendulum and it’s equations of motion it is found that the angular acceleration of the system is proportional to the sine of the angular displacement from vertical. The motion is therefore not simple harmonic. If, however, the angular displacement is small then the sine of the angle tends towards the angle and the system can be considered to move with approximate Simple Harmonic Motion.
It should be noted that at shorter pendulum lengths encountered in the test programme the angular displacement from vertical of the system increases greatly thus moving the system further away from Simple Harmonic Motion. In order to simplify the analysis of the system and collected data it has been assumed throughout the report and analysis that the system operates with either approximate Simple Harmonic Motion or Interrupted Simple Harmonic Motion.
2.2.1 Effective Length
The actual effective length of a pendulum is determined by calculating the mass moment of inertia of the whole system around the rotational origin of the system, in this case the rotational origin is the point of contact between the hoist line and the boom tip sheave. The mass moment of inertia for the test system consists of the following elements:
3

1) Hoist line self weight for it’s length at any point in time. 2) Hook block mass acting at hoist line length. 3) Sling / pennant mass moment of inertia around attachment point to hook
block. Note: this is a function of the sling / pennant line self weight and the mass at the free end (if present).
4) Sling / pennant mass moment of inertia relative to system origin point. 5) Dynamic forces arising from motion of sling / pennant relative to the hook
block. As the system moves further away from Simple Harmonic Motion the dynamic forces will increase.
However, to aid the formulation of practical guidelines for use in normal service conditions the following assumptions have been made:
· The suspended sling / pennant will be considered to act as a simple pendulum if there is a concentration of mass at the free end.
The effective length will be considered as follows:
· Main hoist line effective length = final pendulum length, i.e. ignore effects of line mass.
· Sling / Pennant effective length = sling / pennant length
These assumptions allow the ratio of main hoist line final pendulum length to sling / pennant length to be compared directly and can be considered more practical for in service conditions than the calculation of individual system component effective lengths.
2.2.2 System Damping
Simple pendulum theory assumes the use of either an undamped system or a simply damped system which decays to zero. The test system, as with all real life systems, does not fall into the first of these categories. The damping of the test system at the start conditions (longest line length) can be approximated to a simply damped pendulum, i.e. if left alone the motion of the system will decay to zero. This is the case with all the induced side-lead angles and hoist speeds. The system can still be approximated to a simply damped system whilst operating with Simple Harmonic Motion.
2.2.3 Sources of Damping
The main sources of damping within the system are as follows:
· Air resistance to the hoist line, hookblock and test sling / pennant. As the hoist line length decreases the effective cross-sectional area encountering air resistance decreases thereby reducing the amount of damping encountered.
· Boom deflections. The boom of the test crane is 150 ft long and is required to accommodate an amount of deflection in normal working practice.
4

· Sling / pennant motion. The motion of the sling / pennant once S2 conditions (refer to section 2.4.2 for description of Scenarios) are encountered will often act to dampen the motion of the hook block.
· Flexibility of the main line. Simple pendulum theory is based upon the assumption that the length of the system is governed by a stiff, mass-less rod. In reality, the hoist line will flex and bend in response to the forces encountered.
· Length of the sling / pennant. The length of the pennant for a given stiffness has an influence on the damping characteristics of the pennant. The influence of air resistance and self-damping due to flexing of the pennant increases with increasing pennant length.
· Hook and hook block swivel & pivot action. Swivelling and pivoting of the hook and hook block add additional nodes into the overall system.
An accurate mathematical model for this physical system would be in reality extremely complex and would be valid for scenario 1 situations only, i.e. approximate simple harmonic motion conditions. The main area of complexity is the modelling of the line flexibility and the hookblock to sling / pennant interaction.
When scenario 2 conditions are encountered the system motions become chaotic and Interrupted Simple Harmonic Motion conditions prevail.
Therefore, the mathematical modelling of the physical test system has not been carried out within this project as it is deemed outside the workscope and of limited practical value due to the wide variation of hoist line, hookblock and sling / pennant which are operating in the field.
2.3 Final Pendulum Length Definition
The Final pendulum length is defined as follows: § Single Fall – Length from whip line sheave tangent point to centre of line
termination socket eye.
5

lFinaPendulum Length
Figure 1 – Single Fall Final Pendulum Length
§ Two Fall – Length from centre point of termination socket eye to hook-block sheave tangent point.
Final Pendulum Length
Figure 2 – 2 Fall Final Pendulum Length
2.4 Scenarios
In order to classify the observed sling motions during testing three scenarios were identified.
2.4.1 Scenario 1 (S1)
6

Hook block hoisted to the designated stop position with attached sling / pennant swinging in a predictable manner. A predictable manner was defined as the harmonic motion of the sling / pennant remaining in phase with the harmonic motion of the hook-block at all times.
See figure 3 below.
Hook block Pennant
Direction of swing
Figure 3 – Scenario 1 (S1) Motions
2.4.2 Scenario 2 (S2)
Hook block hoisted to the designated stop position with attached sling / pennant swinging in a chaotic manner. A chaotic manner is defined as the non-harmonic motion of the sling / pennant regardless of the hook-block motion. The sling / pennant may strike the crane boom tip and potentially wrap around the boom tip or boom section.
Direction of swing
Pennant mass higher than hook block
Pennant no longer following hook block motion
Figure 4 – Scenario 2 (S2) Motions
2.4.3 Scenario 3 (S3)
Hook block hoisted to the designated stop position with attached sling / pennant swinging in a chaotic manner. The sling / pennant disengages from the hook and falls
7

to the ground. Note: This was the most hazardous scenario and was expected for every test run.
2.5 Critical Pendulum Length
The Critical Pendulum Length is defined as the Final Pendulum Length of the system at which the pennant / sling starts to display Scenario 2 behaviour. A prime focus of the test programme was to collect data to determine the sensitivity and repeatability of the Critical Pendulum Length with respect to the system input variables.
2.6 Frequency Coupling Effects
The critical length ratio points towards the onset of ISHM being as a result of frequency coupling effects between the main line and the test pennant. As stated in section 2.2 the test pennant acts as a driven pendulum. To accurately compare the critical length ratios of the test system to realistic frequency coupling effects would be extremely difficult due to the complexity of the system and in particular the damping factors. Further investigation into frequency coupling effects would require in depth analysis and quantification of various damping forces acting on the system and therefore frequency coupling analysis has not been carried out within the scope of this report.
2.7 Energy Transfers Within The System
It is apparent from the collected data and visual observations that the system contains a great deal of energy. Investigations into the theoretical energy transfers within the system indicate that the complexity of the system makes it extremely difficult to accurately quantify the energy levels. The magnitude of the energy transfers for any given test run are dependent upon the influence of the various damping factors for that test run.
When a system is operating purely within scenario 1 it is proposed that the majority of the energy transfer is from the hookblock to the pennant. However, observations of scenario 2 test runs indicate that energy will transfer from the hookblock to the pennant and visa versa due to the chaotic motions encountered, e.g. inversions of the hook block, shocks and impacts etc….
Meaningful analysis of the energy transfers could only be achieved whilst the system is operating with scenario 1 behaviour and only once the system damping factors are determined. Therefore, this analysis has not be conducted as part of this report.
8

3.0 Test Programme
The tests were conducted on the Sparrows Offshore Services owned Stothert & Pitt OS100 Pedestal Crane based at the Sparrows Offshore Services Training Centre.
Details of the test equipment, instrumentation and procedures are contained within appendix 1.
9

10
4.0 Data Analysis
The test programme yielded a large amount of data. The data has been categorised into broad areas:
System Inputs Initial condition & system variables
System Outputs Accelerations, forces and scenarios
4.1 System Inputs
The system inputs under consideration are as follows:
· Hoist speed
· Initial side-lead Angle (All references to side-lead angle refer to the initial side-lead angle unless otherwise stated).
· Fall configuration
· Pennant length
· Pennant mass
· Masterlink
· Swivel action of hookblock
· Pivot action of hookblock
The effect of each input can be compared by analysing the data in order to determine the Critical Pendulum Length of the system.
Appendix 2 contains the analysis results with respect to the Critical Pendulum Length of the system.
Once the Critical Pendulum Length has been identified for a given set of input values it is possible to examine the data in terms of ratio of the Critical Pendulum Length to the pennant length.
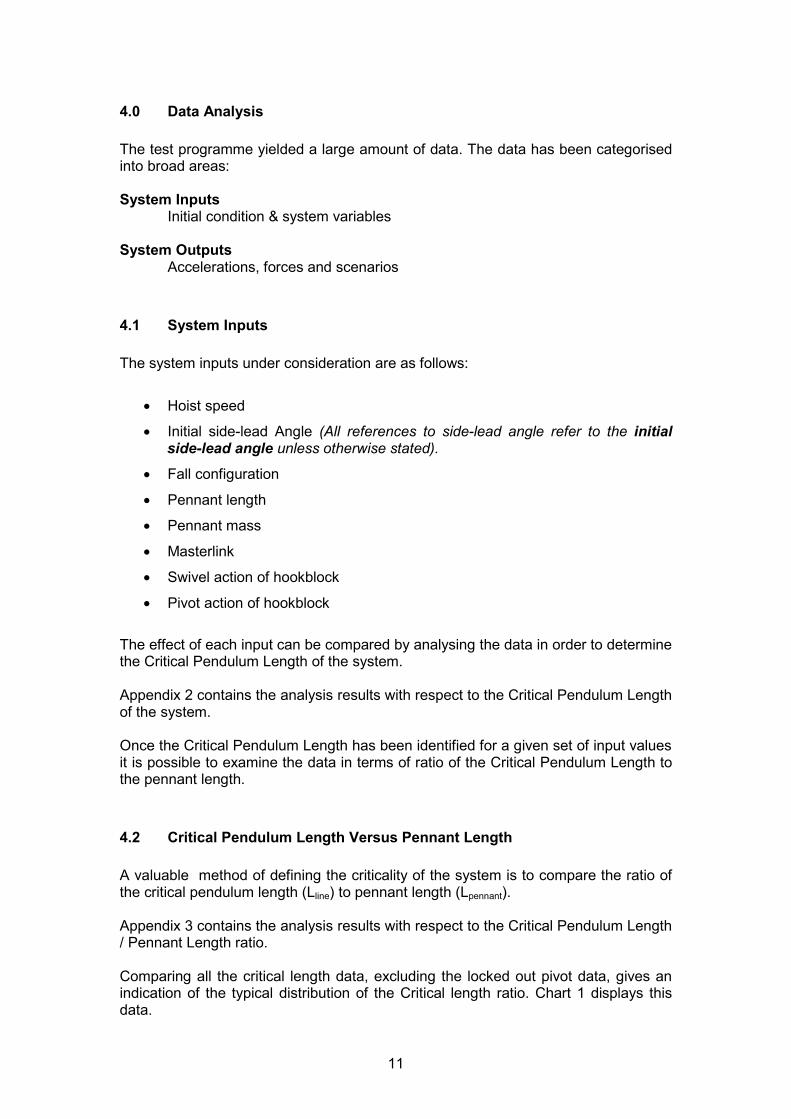
4.2 Critical Pendulum Length Versus Pennant Length
A valuable method of defining the criticality of the system is to compare the ratio of the critical pendulum length (Lline) to pennant length (Lpennant).
Appendix 3 contains the analysis results with respect to the Critical Pendulum Length / Pennant Length ratio.
Comparing all the critical length data, excluding the locked out pivot data, gives an indication of the typical distribution of the Critical length ratio. Chart 1 displays this data.
11
Critical Length Ratio - All Data (Excluding Locked-out Pivot) C
ritic
al L
engt
h R
atio
3.0
2.5
2.0
1.5
1.0
0.5
0.0
0 5 10 15
Side-lead Angle (°)
Chart 1 – Critical Length Ratio All Data (Excluding Pivot Lock-out)
It can be seen from Chart 1 that for a functional hookblock operating in either single fall or two fall the critical length ratio lies between 0 and 1.8. The data spread remains reasonably constant for each side-lead angle, the magnitude of the spread in ratio is approximately 0.5 for 10° and 15° with maximum values of 1.6 and 1.8 respectively. It is expected that at higher side-lead angles the ratio will increase.
12
20

4.3 System Outputs
The system outputs can be defined in terms of the following:
· Hookblock accelerations
· Dynamic forces on crane components
· Scenario encountered
The following sections, 4.3.1 to 4.7, investigate the system outputs in more detail.
4.3.1 Maximum Acceleration Values
Chart 2 shows the maximum acceleration values recorded for the test programme against the scenarios encountered.
Maximum Value Comparison
Acce
lera
tion,
g (m
/s2)
35
30
25
20
15
10
5 0
High High Low Low Frequency Frequency Frequency Frequency Horizontal Vertical Horizontal Vertical
Chart 2 – Maximum Acceleration Values
It can be seen from the results that the maximum high frequency horizontal and vertical accelerations are of a similar magnitude. This is due to the nature of the high frequency analysis where discreet events are marked rather than the overall motion of the hookblock.
The low frequency maximum values indicate that if a system operates entirely within the S1 region then the maximum low frequency acceleration is approximately 50% of the maximum S2 acceleration.
S1 S2 S3 S2& 3
13

14
Of particular interest are the maximum low frequency S3 accelerations. These are of a similar magnitude to the S1 accelerations and indicate that the shedding of a sling / pennant will prevent the build up of extreme low frequency accelerations.
Charts 3 and 4 show the data scatter obtained in terms of low frequency and high frequency accelerations.
Low Frequency Accelerations - All Data
S2/3 Trendline, y = 0.6694xS1 Trendline, y = 0.9354x
0
1
2
3
4
5
6
7
0 2 4 6 8 10 12Horizontal (m/s^2)
Verti
cal (
m/s
^2)
S1
S2/3
S2/3 Trendline(Linear)S1 Trendline(Linear)
Chart 3 – Low Frequency Acceleration Data Scatter
High Frequency Accelerations - All Data
S2/3 Trendline, y = 0.6122x
S1 Trendline, y = 1.3683x
0
5
10
15
20
25
30
35
0 5 10 15 20 25 30 35Horizontal (m/s^2)
Verti
cal (
m/s
^2)
S1S2/3S2/3 Trendline (Linear)S1 Trendline (Linear)
Chart 4 – High Frequency Acceleration Data Scatter

By plotting a linear trendline for each data set (with trendline passing through chart origin) the ratios of the vertical to horizontal accelerations can be compared. Table 1 shows this comparison.
Whilst it is recognised that the use of a linear trendline does not fully describe the complexity of the acceleration data scatter it does allow a basic insight into the underlying trends in the data..
Data set Ratio Horizontal to Vertical S1 Low Frequency 0.9354
S2/3 Low Frequency 0.6694 S1 High Frequency 1.3683
S2/3 High Frequency 0.6122
Table 1 – Vertical To Horizontal Linear Trendline Ratios
By comparing the data in Table 1 it can be seen that when S1 conditions prevail then the ratio of vertical to horizontal accelerations lies between 0.9 and 1.4. When S2/3 conditions are experienced then the ratio of vertical to horizontal accelerations lies between 0.6 and 0.7.
It can therefore be said that, in general, when the system remains within Scenario 1 conditions the vertical accelerations are of approximately the same magnitude or greater than the horizontal accelerations. However, when Scenario 2/3 conditions are encountered the horizontal accelerations are generally of a higher magnitude than the vertical accelerations.
15

4.3.2 Mean And Median Accelerations
Chart 5 shows the low frequency mean and median values encountered during the test programme.
0
1
Low
l
Low
i l
Low
l
Low
i l
(m/
)
S1 S2 S3
Low Frequency Mean & Median Comparison
0.2 0.4 0.6 0.8
1.2 1.4 1.6 1.8
Frequency Horizonta
Mean
Frequency Vert caMean
Frequency Horizonta
Median
Frequency Vert caMedian
Acce
lera
tion,
g
s2
S2& 3
Chart 5 – Low Frequency Mean & Median
It can be seen from this chart that the mean S1 values are approximately 40% to 50% lower than the mean S2 and S3 values.
Appendix 4 examines the analysed acceleration data in more depth.
From the analysed results it can be seen that when the critical pendulum length has been passed and the system is experiencing S2 conditions the maximum low frequency accelerations encountered at the hookblock are higher than the accelerations encountered when the system is operating with simple harmonic behaviour. In particular, the low frequency horizontal accelerations are generally higher than the vertical accelerations encountered. This is in direct comparison to the situation during S1 conditions where the vertical accelerations are generally of a greater magnitude than the horizontal accelerations and supports the visual observations of the hookblock being extremely mobile when S2/3 conditions are encountered.
16

4.4 Baseline Hookblock Analysis
Certain segments of the test plan were conducted in order to gather data on the base hookblock motions without a test pennant or sling.
Single fall and two-fall baseline data was acquired in order to determine the accelerations encountered without the effects of a suspended sling / pennant and thereby compare the effects of the fall mode on the hookblock stability.
The baseline hookblock data cannot be categorised in terms of scenario 1, 2 or 3 as no sling or pennant is attached.
Observations of the hook block motions during the baseline tests revealed that, whilst the test would start with pure side lead, the hookblock would often begin to alter it’s swing towards off lead. Two fall configurations were particularly prone to this motion. This situation limited the minimum pendulum length which could be safely tested without the hookblock striking the boom. It is evident from the observations that the pendulum effect of attached slings and pennants was a major factor in maintaining the initial side lead swing direction.
Appendix 5 contains the baseline hookblock acceleration analysis.
Analysis of the baseline hook block data reveals that two fall systems are prone to higher magnitude horizontal accelerations than single fall hook block, even at longer pendulum lengths. This is of particular interest as it confirms the visual observations and theoretical expectations. Some two fall hook block designs incorporate an inherently high metacentric height from the bottom of the sheave, this tends to lead to a corresponding larger magnitude of horizontal accelerations than that obtained from a single fall block which is rigged to produce longer pendulum lengths. This phenomena arises because of the fact that the two fall block, as rigged, can experience a secondary tilting moment around the sheave groove and rope wrapping axis producing in itself a extra acceleration force over that felt by the single fall block.
This "negative stability" feature will tend only to exist for the two fall block configuration. The use of three part or more lines act as constraints on the hookblock degrees of freedom as well as decreasing the maximum achievable hoist speed. Therefore, hookblocks reeved in multi-fall configurations with more than two falls are deemed likely to remain stable.
17
4.5 Chain Pennant Analysis
The majority of the testing performed was undertaken with wire rope slings and pennants as these are the most commonly used lifting accessories within the UK Oil and Gas industry. However, a number of chain pennants were also tested in order gain an insight into the differences in behaviour. The chain pennant investigation did not include all the variables covered by the wire rope investigation.
Visual observations of the behaviour of the chain pennant lead to the conclusion that chain pennants behave in a unique manner in both Scenario 1 and Scenario 2 situations compared to wire rope construction pennants. In Scenario 1 situations the chain would appear to “bend” about it’s central axis more readily than a wire rope pennant. In scenario 2 situations the chain pennant motion was much more chaotic than a wire rope pennant and would appear to whip and writhe within it’s own length more readily due to it’s lack of stiffness.
Appendix 6 contains the chain pennant acceleration data analysis.
4.5.1 Chain Pennant Construction Effects
Chain pennant behaviour varies from wire rope pennant behaviour in the following ways:
· The mass of the chain has a more significant effect on the “effective length” of a pennant compared to an equivalent length and rating wire rope pennant. Chain pennants will have a shorter “effective length” than wire pennants of equivalent overall length and free end mass concentrations.
· Each link of the chain acts as a mini nodal point. This feature appears to visually damp the motion of the pennant whilst operating in scenario 1. However, when operating in scenario 2 the nodes allow the chain to writhe and flex within it’s own length much more than with wire rope construction.
The effects arising from the addition of nodal points (other than Masterlinks) to wire ropes are unknown at this time. Section 7.0 recommends a course of study which may lead to further understanding of the effects.
18
4.6 Dynamic forces
The forces at work within the system can be summarised in terms of two categories:
· Centripetal forces due to the overall displacement motion of the hookblock – these forces can be approximated as low frequency cyclic forces.
· Shock loads due to impacts, snatching of hookblock & pennant and other similar events - these forces can be considered discreet, non-cyclic forces.
The damaging forces within the system manifest themselves as line tension acting at the boom tip. These forces take the following forms:
Direct loading – the force is parallel to the centre of the boom causing a vertical bending or pitching of the boom. The boom tip sheave carries the load in the base of the sheave.
Side loading - the force acts on the inside flank of the boom tip sheave causing the boom to bend with a yawing motion.
The analysis of the forces developed in the boom tip can be simplified by considering the tension in the hoist line due to the maximum vertical accelerations experienced.
During scenario 1 situations when the hookblock moves with approximate Simple Harmonic motion the forces generated are mainly centripetal resulting from the swing of the hookblock. These forces will be of low frequency and magnitude and therefore considered non-damaging.
During scenario 2 situations the hookblock is no longer operating with simple harmonic motion and the hook block motions will cause shock loads to travel down the line. The magnitude of the shock loads can be approximated by considering the maximum vertical accelerations of the system.
Several assumptions have been made in the following analysis of the system forces: · The maximum force manifests itself as pure hoist line tension. The hoist line
tension comprises the static self weight of the hook block, mg, and the dynamic force arising from the vertical acceleration.
· It is assumed that the vertical centre line of the hookblock is parallel to the hoist line centre line at the point of maximum acceleration.
· It is assumed that the total force developed by the vertical acceleration is transmitted to the boom tip sheave.
· The dynamic force is calculated based upon mass of the hookblock only. The mass of the hoist line and the suspended pennant is not included in the calculations. Additional dynamic forces imparted by the motion of the pennant are also not included in the calculation.
Chart 6 displays the force statistical analysis of the theoretical forces encountered at the boom tip sheave in terms of line tension.
19

Vertical Force Statistics
Line
Ten
sion
, N
20,00019,000
18,000
17,00016,000
15,000
14,000
13,00012,000
11,000
10,000
9,000
8,0007,000
6,000
5,000
4,000
3,0002,000
1,000
0 Mean Median Mode Standard Minimum Maximum
Deviation
iVertical Low frequency Vertical H gh Frequency
Chart 6 – Boom Tip Forces / Line Tension (Based upon mass of hookblock only)
Table 2 tabulates the data for Chart 6.
Statistic Low frequency Force, N High Frequency Force, N Mean 2,559 3,611
Median 2,801 3,128 Mode 2,935 2,813
Standard Deviation 850 2,187 Minimum 1,597 1,607 Maximum 6,880 15,615
Table 2 – Force On Boom Tip Statistics
The maximum dynamic force encountered is 15.6 kN. This is well within the safe working load of the crane and crane components if considering the hoist line to be within an acceptable off lead or side lead angle from perpendicular. However, it is possible for the chaotic motion of hookblock to cause this maximum load to act on the flank of boom tip sheave.
The effect of the accelerations and related forces can be further analysed in terms of the magnification of the static force line tension.
Table 3 compares the mean and maximum force values to the theoretical “hoisting factor, Fh,” used by the Lloyds Register of Shipping.
20
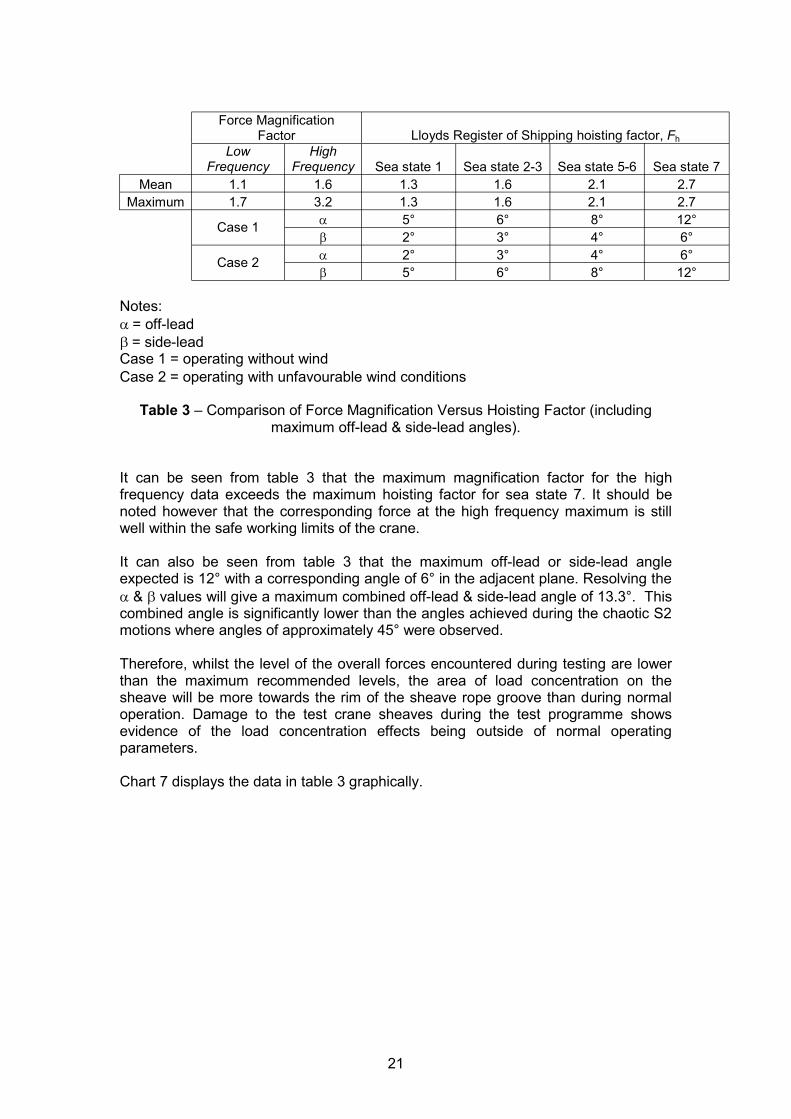
Mean
Force Magnification Factor
Low Frequency
High Frequency
1.1 1.6
Lloyds Register of Shipping hoisting factor, Fh
Sea state 1 Sea state 2-3 Sea state 5-6 Sea state 7 1.3 1.6 2.1 2.7
Maximum 1.7 3.2 1.3 1.6 2.1 2.7
Case 1 a
b
5° 2°
6° 3°
8° 4°
12° 6°
Case 2 a
b
2° 5°
3° 6°
4° 8°
6° 12°
Notes: a = off-lead b = side-lead Case 1 = operating without wind Case 2 = operating with unfavourable wind conditions
Table 3 – Comparison of Force Magnification Versus Hoisting Factor (including maximum off-lead & side-lead angles).
It can be seen from table 3 that the maximum magnification factor for the high frequency data exceeds the maximum hoisting factor for sea state 7. It should be noted however that the corresponding force at the high frequency maximum is still well within the safe working limits of the crane.
It can also be seen from table 3 that the maximum off-lead or side-lead angle expected is 12° with a corresponding angle of 6° in the adjacent plane. Resolving the a & b values will give a maximum combined off-lead & side-lead angle of 13.3°. This combined angle is significantly lower than the angles achieved during the chaotic S2 motions where angles of approximately 45° were observed.
Therefore, whilst the level of the overall forces encountered during testing are lower than the maximum recommended levels, the area of load concentration on the sheave will be more towards the rim of the sheave rope groove than during normal operation. Damage to the test crane sheaves during the test programme shows evidence of the load concentration effects being outside of normal operating parameters.
Chart 7 displays the data in table 3 graphically.
21

Mean & Maximum Force Magnification Factors Versus Sea State
Hoi
stin
g Fa
ctor
/ Fo
rce
Mag
nific
atio
n 3.5
3.0
2.5
2.0
1.5
1.0
0.5
0.0
Fh, Sea state 1
Fh, Sea state 2-3
Fh, Sea state 5-6
Fh, Sea state 7
Low Frequency High Frequency Fh, Sea state 1 Fh, Sea state 2-3 Fh, Sea state 5-6 Fh, Sea state 7
Mean Maximum
Chart 7 - Force magnification versus hoisting factor
It must be stressed that the forces contained within this report are the forces experienced during the test programme. Forces experienced in similar situations in everyday service may be significantly higher or lower than these forces. In particular, if the final pendulum length of the system is made ever shorter then the hook block accelerations and therefore the boom tip forces will increase.
22

4.7 Scenarios
4.7.1 Scenario 1
From the tests conducted it can be said that any system operating purely within Scenario 1 at all times is deemed safe from shedding. However, this does not mean that boom strikes may not occur if the off-lead / side-lead angles are unfavourable.
4.7.2 Scenario 2
From the tests conducted it was apparent that the severity of Scenario 2 conditions vary greatly from a mild whipping action of the sling / pennant with negligible influence on the hook-block motion to violent swinging and whipping of the sling / pennant with a significant influence on the hook-block motion. In some extreme instances the hook-block itself would be inverted. This was particularly prone to occur in two-fall configuration due to the inherent instability of the block.
It should be noted that the final pendulum length of the line has a significant effect on the likelihood of the boom being struck. If the final pendulum length of the line is shorter than the suspended sling/pennant then the likelihood of boom strikes increases dramatically.
From a point of practicality the transition from Scenario 1 to Scenario 2 is not visually apparent whilst hoisting is in progress. In many cases Scenario 2 behaviour will be apparent just before hoisting stops. However it is not until hoisting has stopped that Scenario 2 behaviour manifests itself fully (see Figures 6 & 7).
It was also observed that occasionally the hookblock swinging motion would cease whist the test pennant was still extremely active. An example of this can be seen on the HSE video VO3/2002 produced as a companion to this report.
During the test programme the quickest way to recover control of a system and move it from scenario 2 behaviour to scenario 1 behaviour was to lower the hookblock. This however is not without dangers as the pennant may have snagged on the boom out of view of the crane operator.
4.7.3 Scenario 3
Scenario 3 is always proceeded by Scenario 2. In general it was found that the more visually severe the Scenario 2 then the higher the probability that Scenario 3 would occur. However, it must be noted that even very mild scenario 2 conditions can cause shedding to occur and a system cannot be deemed safe until it is operating back in Scenario 1.
23

4.7.4 Description of Scenario 3 Incidents encountered.
Out of the 581 shedding tests conducted, 329 were deemed as scenario 2. As the testing progressed the team were able to accurately specify test conditions which would generate a scenario 2 result.
Figure 8 highlights a sample of the shed sling / pennant landing areas in relation to the bottom dead centre of the crane.
A typical offshore installation is also displayed on figure 8 showing how the potential shed sling / pennant landing sites can affect a large area of the installation and surrounding area.
24
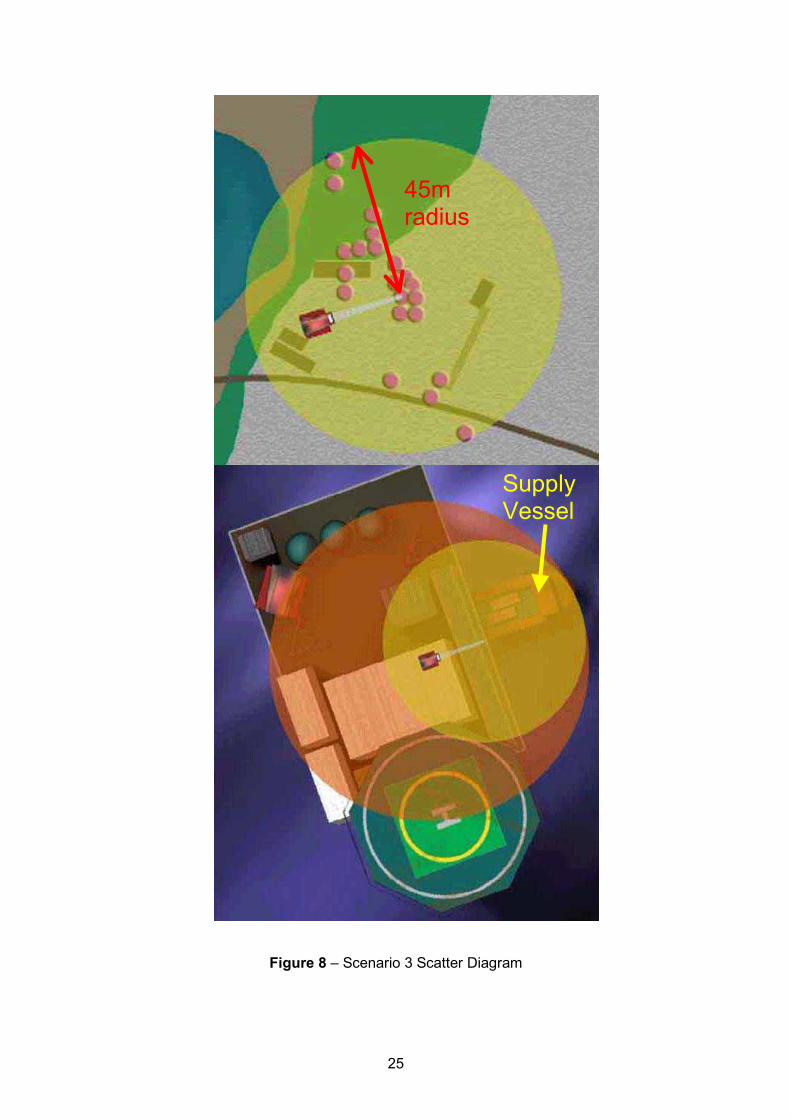
45m
Supply Vessel
radius
Figure 8 – Scenario 3 Scatter Diagram
25

Chart 8 shows the distribution of the S3 landing distances (assuming on same plane as bottom dead centre point). 50% of the shed pennants landed within 5 metres of bottom dead centre point and 80% of the shed slings fell within 20 metres of the bottom dead centre point.
0
2
4
6
8
10
12
14
16
18
0 5 10 15 20 25 30 40 50
(m )
0%
l i
S3 Landing Distribution
35 45
Dis tance from Bottom Dead Ce ntre
Freq
uenc
y
10%
20%
30%
40%
50%
60%
70%
80%
90%
100%
Cum
m u
lativ
e %
Frequency Cummu at ve %
Chart 8 – S3 Landing Site Distance Distribution
Of notable interest is the maximum distance achieved by shed pennants. On four occasions shed pennants landed between 40 to 45 metres from the bottom dead centre point.
On two occasions the shed pennant landed on the boom hoist ropes and then proceeded to slides down the ropes.
On the first such incident the pennant came to a standstill at the boom hoist sheave located at the tip of the A-frame (see Photos 3 & 4) (Appendix 7).
On the second occasion the pennant slid off the boom hoist ropes and landed on the roof of the crane machinery cab. The load closing hook on the free end of the pennant was found to have opened under the impact of landing (see Photo 5) (Appendix 7).
Opening of the load closing hook due to impact occurred on two occasions. The first incident was the pennant landing on the machinery cab. The second incident involved the hook impacting a training load container and opening. After impacting the container the hook came to a rest buried in the ground (Photo 6) (Appendix 7).
It is apparent from the examination of the pennant impact sites that most of the shed pennants left the hookblock with a large degree of energy – much more than pure gravitational potential energy. Impact sites on soil would often result in the pennant mass being buried into the ground. Landing sites on the stone chips surrounding the bottom dead centre point of the boom tip would often contain powdered stone. Pennants which landed on the test area wooden decking often left deep rope imprints
26

in the wood. Photos 7 to 9 (Appendix 7) show some of the landing sites encountered during the test programme.
It is apparent that if a shed sling or pennant were to hit any personnel then serious injury or even fatality could occur. At particular risk are supply vessel crews as escape routes from any falling sling or pennants are often scarce.
27

4.8 Sling Shedding Mechanisms
Once S2 conditions are encountered the probability exists that sling shedding will occur. The mechanisms of shedding are as follows:
· The movement of the sling / pennant captive end such that it will ride up the inside of the hook. Subsequent relative motion of the captive end to the hook can result in the full force of the sling / pennant motion acting to overcome the spring catch.
· Twisting of the captive end relative to the plane of the hook will allow the spring catch to be overcome if the dimensions of the captive end are of a critical size.
· Accelerations induced in the hookblock can open a gravity latch hook due to inertia without the captive sling / pennant acting on the latch. This “inertia opening” mechanism was observed frequently during the testing of hook block “Hook 6”. The gravity latch could often be seen to open and would close with a discernable clicking noise during S2 events.
· Spring loaded catches are also susceptible to “inertia opening”. The video accompanying this report contains several instances where inertia related opening of spring catches can be seen. This is a significant finding as previous studies assumed shedding of slings from hooks with spring loaded catches only occurred when the catch was physically overcome by direct contact between the spring latch and the captive eye.
· A masterlink will not protect the sling / pennant from shedding if the dimensions are unfavourable.
· As previously reported in Phase 1 and verified during the test programme, direct impacts can cause load closing hooks to open. However it is also suspected that the motion of the pennant captive end during Scenario 2 conditions may potentially operate protruding trigger mechanisms on certain types of load closing hook.
28

4.9 Summary Of Results
The various elements contributing to changes in critical pendulum length can be summarised as follows based upon the results gathered during the test programme:
· Hoist Speed – increasing hoist speed increases the critical pendulum length. At extremely low hoist speeds the effects of damping become more influential.
· Side-lead / Off lead Angle – increasing the side-lead / off-lead angle increases the critical pendulum length of the system.
· Hook Pivot Action – locking-out the hookblock pivot action dramatically increases the critical pendulum length of the system.
· Hook Swivel Action – locking out the hook swivel action has a marginal effect on the critical pendulum length.
· Fall mode – operating in either single fall or two fall mode has no discernable effect on the critical pendulum length other than the limitations on the maximum hoist speed when operating in two fall mode.
· Sling / Pennant Length – the length of the sling / pennant has a significant effect on the critical pendulum length of a system. Increasing sling / pennant length increases the critical pendulum length of the system.
· Sling / Pennant Mass – as long as enough mass is concentrated at the end of the pennant to allow it to be considered as a simple pendulum then the mass of the pennant has no discernable effect on the critical pendulum length of the system.
· Masterlink – the presence of a masterlink has no discernable effect on the critical pendulum length of a system.
29

30

5.0 Conclusions The following conclusions can be drawn from the test programme.
· As the hoist speed decreases the critical pendulum length of the system decreases.
· The transition from Scenario 1 to Scenario 2 is not visually apparent whilst hoisting is in progress. Scenario 2 only manifests itself visually once hoisting has stopped.
· In general, the more severe the Scenario 2 then the higher the probability that shedding may occur if the pennant / hook interface will physically allow shedding to occur. However, it must be noted that the even very mild scenario 2 conditions can cause shedding to occur and a system cannot be deemed safe until it is operating back in Scenario 1.
· The final pendulum length of the line has a significant effect on the likelihood of the boom being struck. If the final pendulum length of the line is shorter than the suspended sling / pennant then the likelihood of boom strikes increases dramatically.
· The swivel action of a hook block has an insignificant effect on the critical pendulum length of a system. This is most likely due to the main line accommodating any induced swivelling motions. However, a swivel action should always be included in the design as this aids loading & unloading of the hookblock.
· The pivot action of a hook block has a significant effect on the critical pendulum length of a system. If no pivot action is present then the critical pendulum length of the system will increase dramatically.
· At high hoisting speeds and initial side-lead angles up to 15° the critical length ratio of final pendulum length to pennant length is between 1.1 to 1.8 if the hookblock has a serviceable pivot action. If the pivot action is not functional or does not exist then the critical length ratio will increase dramatically.
· If shedding does occur it is possible that the shed sling /pennant will land outside of the working radius of the crane. The crane operator is also at risk not only from direct impact of shed pennants but from secondary impact caused by the possibility of a pennant travelling down the boom hoist rope.
· The energy with which shed slings and pennants impact the ground may often be in excess of the potential energy of the pennant.
· Pennant length is potentially the most critical factor in determining the critical pendulum length of any given system.
· In general, when Scenario 2/3 conditions are encountered the horizontal accelerations are generally of a higher magnitude and the vertical accelerations.
· It is apparent that if a shed sling or pennant were to hit any personnel then serious injury or even fatality could occur. At particular risk are supply ship crews as escape routes from any falling sling or pennants are often scarce.
· No witness marks are evident of the base acceleration data plots when shedding occurs (see figures 6 & 7).
· The use of hoists on multi-fall of three part or more lines act as constraints on the hookblock degrees of freedom as well as decreasing the maximum
31

achievable hoist speed. Therefore, hookblocks reeved in multi-fall configurations with more than two falls are deemed likely to remain stable
32
6.0 Recommendations The following recommendations can be drawn from the results of the test programme. These recommendations are primarily for action by designers, operators and training providers:
Training Specific: · Ensure all crane operators are aware of the dangers of hoisting any lifting
accessory when side-lead and / or off-lead conditions exist. Even if shedding does not occur, any scenario 2 situation can potentially cause damage to the crane. It is extremely difficult to detect the critical pendulum length while hoisting and therefore the operator may exceed this length and find themselves in difficulty without warning (Section 4.7).
· Ensure all crane operators are aware of the dangers of hoisting any lifting accessory at high speed towards the crane over-hoist limit (Section 4.7).
· Some crane designs incorporate “anti-two block” systems where pilot relief valves are tripped when specific blocking faces on the hookblock and boom tip make contact. These types of crane are at increased risk of crane and component damage and shedding due to the extremely short pendulum lengths involved at the point of “anti-two block” system activation. Operators of these types of crane should be made particularly aware of the dangers of hoisting with side and/or off lead (Section 4.9).
· Operators should be made aware that the quickest way to regain control of a chaotic system is to lower the hookblock as long as it is safe to do so. Particular attention should be paid to avoid any snagging of the sling / pennant on the boom or other crane components.
· Do not, on cranes equipped with more than one hookblock, operate the crane with a sling / pennant attached to the stowed hookblock. Slewing and booming motions will still induce side-lead and off-lead on stowed hookblocks and shedding may occur if carrying a sling or pennant. Particular care should be taken when working with supply vessels as the main line hookblock is often parked whilst operating with a whip line and these operations often require large amounts to corrective slewing and booming motions as the operator keeps station with the vessel (Section 4.9).
All Involved Parties: · The overhoist limit should not be relied upon during any normal lifting
operations unduly as its main function is as a protective safety device to prevent overhoisting the hookblock into the sheaves (Section 4.7).
· Where ever practically possible, set the overhoist limit to give a longer final pendulum length than the longest anticipated sling / pennant for the normal usage of the crane. This will reduce the likelihood of boom strikes damaging the crane (Section 4.7 & Section 5.0, paragraph 4).
· Every consideration should be given to the installation of hoist speed limit systems to provide progressive maximum hoist speed reduction similar to boom hoist systems would allow for safer operation of cranes. A suitable system would begin reducing the maximum achievable hoist speed as the system approaches the critical pendulum length for the application and
33

provide maximum reduction as the hookblock approaches the overhoist stop position (Section 4.9).
· Ensure all crane operators are aware of the risks of sling shedding particularly when using hooks with spring loaded catches, gravity latches or other non positive locking devices. Spring loaded catches should be fitted with strong springs and the latch should be of a low inertia construction, e.g. steel pressing or similar. Load closing hooks should not be considered safe from shedding as impacts of the pennant with the hook may cause them to open (Section 4.8 & HSL Report ME/01/28).
· Ensure that all hookblock pivoting motions are free and in good service. Seized or stiff pivoting actions will severely increase the critical final pendulum length of the system. Any single fall blocks in service without a designed-in pivot function should be replaced with a hookblock with a designed-in pivot action if possible (Section 4.9).
· If a scenario 2 has been experienced, or thought to have been experienced, stop the crane and perform a thorough examination of the crane and lifting accessories in accordance with LOLER SI2307. Damage may have occurred even without contact with the boom or other components (Appendix 9). Key areas for examination include:
o Hoist rope and boom hoist rope for kinks and breaks o Damage to sheaves o Damage to the boom or equipment attached to the boom tip or boom
e.g. cameras, lights etc.. o Sling/pennant rope, hard eyes, hooks etc..
· Wherever practically possible, use a physical locking device such as a locking pin on the hookblock hook to physically prevent shedding from occurring (Section 4.8).
Please refer to HSE report OTO2001/054 for other related recommendations.
34
7.0 Recommended Further Work
The following recommended further work topics can potentially lead to enhanced safety as part of the HSE Key Programme of Work – number 6 if pursued.
· Conduct dynamic mathematical modelling of system in order to allow designers to compare the effects of a wider range of hookblock / pennant combinations. The mathematical model should be refined enough to account for the effects of damping variables and effects on critical pendulum length. The model should also take into account the effects of the angular displacement from vertical of the system with regards to approximate SHM behaviour. Any additional model correlation testing should also be formulated at this point. The output of the mathematical system model should also consider interfacing with the HSE Crane Operation Simulator project.
· Additional investigation into the critical pendulum lengths versus nodal points may be conducted. However, it is recommended that any testing into this area is preceded by mathematical modelling in order to refine any subsequent test programme. The use of laboratory based models should be considered where necessary.
· Further investigation into suitable hook types and masterlink combinations which are resistant to shedding.
· Investigate suitable methods of positively locking hooks and determine current market availability and suitability.
· Investigate fully the operations required to regain control of a system operating with ISHM.
· Investigate the feasibility of fitting suitable hoist speed limiter devices to currently used cranes.
· Investigate the potential effects of shedding on offshore installations with regards to the scatter diagram. The study should also review currently known or suspected incidents of shedding or crane damage due to ISHM.
· Investigate the potential damaging effects of the forces encountered with regards to sheave design and material.
35

36

Appendix 1 Test Equipment And Methods
This appendix contains the details of the test instrument and acquisition set-up.
Test Crane
The crane was originally built by Stothert & Pitt as a prototype offshore pedestal crane. Sparrows purchased the crane from Stothert & Pitt and installed it at the Tyrebagger site for the purposes of training crane operators.
Specifications:
§
§
Boom Length Boom construction
150ft (45.7m) Tubular lattice
§
§
§
Maximum working radius Minimum working radius Main Hoist
45.7m 16m Single hoist drum, used for main and
§ Boom Hoist whip line duties Rope luffing
§ SWL Derated to 2.7 tonnes max. §
§
Power plant Main hoist line / whip line
14l Cummins Diesel 20mm 35x7 RHO 6.8Te SWL
§ Load Monitoring System Datainstrument MIPEG 2000Speed Indicator function
with Routilising
pe a
rotational shaft encoder fitted to hoist winch.
Data Acquisition
Acceleration data was collected using the following equipment:
· 3 off SUNSTRAND accelerometers orientated to measure tri-axial motions of hookblock.
· Floating Cable Pulley System (see 3.1.3 for more details on this system).
· PC based data acquisition system running nCode ‘dAtagate’ software to collect and store dynamic data to hard drive.
· Data analysis using nCode ‘nSoft-E’ data analysis software macros.
37

Floating Cable Pulley System
In order to record the hookblock accelerations during testing it was necessary to devise a method of allowing an instrumentation cable to keep track with the hookblock but also remain in a safe area to avoid excessive snagging or damage to the cable.
After several trials the system utilised consisted of the following:
· Accelerometer box and electrical junction box attached to hookblock
· Floating instrumentation cable fixed at each end to a junction box.
· Fixed pulley at boom tip to guide Floating Cable.
· Floating pulley to extend / retract Floating Cable.
· Tension line fixed to Floating Pulley.
· Fixed pulley to guide tension line.
· Counterweight attached to end of Tension Line.
· Fixed cable leading from boom tip junction box to data acquisition hardware.
Figure 5 shows a schematic of this system.
Fi l
FiPull
FlPull
Fl
Fi
l
Junction Box
xed Pul ey
xed ey
oating ey
Counterweight
oating Cable
xed Cable
Acce erometer + Junction Boxes
Tension Line
Figure 5 – Pulley System Schematic
The pulley system extended or retracted the floating cable as the hookblock was raised or lowered and maintained tension within the floating cable in order to prevent looping of the cable. Weak links were designed into the cable system in order to allow easy maintenance & repair in the event of snagging or other cable damage.
The floating cable was lubricated using a wax based “cable pulling” lubricant.
38

The counterweight consisted of a number of shackles attached to masterlink and the overall weight could be adjusted to compensate for wind conditions, pulley system resistance etc…
The fixed cable running from the boom tip to the data acquisition hardware was attached to the boom cable tray. A number of connection points were located in convenient areas to allow storage of the cable without entanglement during the phases when testing was not occurring.
The pulley system worked equally well in both single fall and two fall modes. On several occasions the floating cable was snagged and even cut but generally repairs to the system were not regularly required. Due to the overall design of the system any necessary repairs could be carried out extremely quickly with the minimum amount of disruption to the test programme.
Photo 1 (Appendix 7) shows a view of the boom tip fixed pulley.
Hook Release Mechanism
In order to control the direction of shedding, the tests were conducted using side lead only. The side-lead angle was controlled at the start of each test using a side line with an automatically releasing hook. The initial side lead angle was varied between 5 ° to 20°. The hook release system consisted of a modified hook fitted with a horizontal line for controlling the side-lead angle and a vertical line which rotated the modified hook as hoisting began and thereby released the hookblock. The hookblock was fitted with a short soft sling attached at it’s horizontal centre of gravity. The end of the sling was placed in the modified hook during the test set-up. The crane operator would then slew the crane until the boom was in line with the bottom dead centre position. The test would now be ready to begin. As the operator began hoisting the vertical line would rotate the modified hook thereby releasing the soft sling and the hookblock.
By accurately recording the length of the horizontal line the side lead angle could be changed within approximately 10 minutes and a high degree of repeatability maintained. Photo 2 (6) shows the hook release mechanism in action.
39

Test Slings/Pennants
The following table, Table 4, details the test slings / pennants used throughout the test programme:
Name Description Length Captive end Rope Dia Free End Desc
Free End Mass
Overall Mass
Wire Pennants P1 4700 x 19mm with 2 No 8.5Te shackles
on end, loop height 300mm 4.6m Soft Eye, 300mm
loop height 19mm Twin Shackles 5.0kg 14kg
P2 As P1 plus 6.5Te masterlink 200 x 115mm (centres)
4.6m Masterlink, 115 x 200mm
19mm Twin Shackles 4.5kg 15.0kg
P3 orange sheathed cargo handling penant with hook
N/A N/A N/A N/A N/A N/A
P4 As P1 but without shackles on end 4.6m Soft Eye 19mm N/A N/A 9.0kg P5 As P1 but with Crosby Hook 4.6m Soft Eye, 300mm
loop height 19mm SH16-8 Safety
Hook 5.5kg 14.5kg
P6 As P1 but with lighter BK Hook 4.6m Soft Eye, 300mm loop height
19mm BK Hook 3.5kg 12.5kg
P7 As P6 but with 6.5 Te masterlink 4.6m Masterlink, 115 x 200mm
19mm BK Hook 3.5kg 14.0kg
P8 orange sheathed cargo handling penant 10 Te, with masterlink & BK75 hook
5.2m Masterlink, 180 x 290mm
27mm BK75 Hook 10.5kg 38.0kg
P9 Wire Penant approx 20 mm, soft eyes, approx 2.5m
2.6m Soft Eye 21mm Soft Eye N/A 7.0kg
P10 As P5 but new 19mm rope and 25 ft overall length
7.6m Soft Eye 19mm SH16-8 Safety Hook
5.5kg 18.5kg
P11 P5 with added mass-Shackle S01 4.6m Soft Eye 19mm SH16-8 Safety Hook + SO1
9.5kg 18.5kg
P12 P5 with added mass-Shackle S02 4.6m Soft Eye 19mm SH16-8 Safety Hook + SO2
13.5kg 22.5kg
P13 P10 with added mass - Shackle S01 7.6m Soft Eye 19mm SH16-8 Safety Hook + SO1
9.5kg 22.5kg
P14 P10 with added mass - Shackle S02 7.6m Soft Eye 19mm SH16-8 Safety Hook + SO2
13.5kg 26.5kg
P15 WB1 with Masterlink & hook at ends (Simulate M/Link in centre)
Wire Brothers WB1 Wire brothers (from pipe) each with 4.5Te
shackle WB2 4-way wire brothers with master link 2.9 Masterlink 16.5mm Hard Eyes N/A 19.5kg WB3 8Te Wire brothers with masterlink, with
crosby 10-8 hooks parked on m/link 6.3 Masterlink 12.5mm Wire loop N/A 19.0kg
WB4 As WB3 but with free hooks 3.3 Masterlink 12.5mm Crosby 10-8 Hook each leg
2.5kg each leg
19.0kg
Chain Pennants CP1 Chain pennant, masterlink, 3Te hook 2.7 Masterlink Ø9mm
Link Fitted Hook 2.5kg 8.5kg
CP2 Chain penant, single leg, 6.5 Te masterlink, 3Te hook
2.7 Masterlink Ø9mm Link
Fitted Hook 2.5kg 9.0kg
Misc C1 Chain pair 2m Masterlink N/A Barrel Hooks 2kg each
leg 14kg
Accessories SO1 Shackle N/A N/A N/A N/A N/A 4.0kg SO2 Shackle N/A N/A N/A N/A N/A 8.0kg
Table 4 – Test Slings & Pennants
It should be noted that the majority of the test pennants were constructed using wire rope grips to form the end terminations. This construction method was used purely for expediency during the test programme and no loads were carried with these pennants. The use of pennants and slings constructed using wire rope grips is not recommended for lifting operations.
40

Hookblocks
The following table details the hookblocks used during the test programme:
Name Description Mass Hook type Single Fall
Two Fall
Hook 1 8 tonne sprung latch, swivel & pivoting hook, swivel link above hook
160 kgs
Spring Latch ü X
Hook2 As Hook 1 but with swivel 160 Spring Latch above hook-block kgs ü X replaced by link
Hook3 Orange Overhoist ball, with 2 links above and swivel action ball
approx. 500 kg
Load Closing ü X
Hook 4 Hook 2 with additional cheek-plates, 2-fall & single fall, swivel & pivoting hook
273 kg Spring Latch
ü ü
Hook 5 Overhoist ball with locked out swivel action.
193 kg Load Closing ü X
Hook 6 2-fall, gravity latch hook 272 kg Gravity with locked out pivot Latch X ü
action.
Table 5 – Test Programme Hookblocks
41
Test Procedures
A number of test procedures were written in order to control the live test element of the project. All involved personnel were briefed of the test procedures prior to conducting any live tests
Repeatability Of Test Conditions
Repeatability of the critical test variables were controlled as follows:
Side-lead Angle Side-lead angle was controlled by using the hook release mechanism.
Hoist Speed The hoist speed for each test was controlled by the crane operator using 100% throttle. The OS 100 crane used has two speed settings: low speed & high speed. The actual hook block vertical speed is dependent upon the fall configuration of the crane. The tests were conducted using single fall and two fall configurations only.
These speeds are as detailed in Table 6.
Configuration High Speed Low Speed Single Fall 82.8 m/min 45.8 m/min Two Fall 42.7 m/min 24.8 m/min
Table 6 – Test Programme Hoist Speeds
The measurement of the hoist speed was conducted by reading the rotary encoder signal via the MIPEG SLI (Safe Load Indicator) system. The RSI (Rope Speed Indicator) encoder output is based upon mean rope speed for a given drum rotational speed.
An experimental error exists within the speed recording due to the actual line speed variations dependent upon the wrap layer of the rope., i.e. as the line spooling on the drum moves up a layer there is a step function change in the actual line speed whilst the drum rotational speed remains constant.
Other sources of error will be introduced when changing between single fall and two fall configurations. These include:
· Reeving fleet angles.
· Change in working radius – Changing the configuration from single fall (on whip line sheave) to two fall (on main line sheaves) for the same boom angle reduces the working radius by approximately 1.5 metres. In order to maintain the physical test radius of 20 metres it was necessary to lower the boom from the single line position thereby reducing the resistance in the system.
· System rolling resistance due to number of sheaves.
42

Results Analysis
The following channels of information were recorded for each test run:
· Channel 1A & 2A = High frequency horizontal accelerations.
· Channels 1B & 2B = Low frequency horizontal accelerations.
· Channel 3A = High frequency vertical accelerations.
· Channel 3B = Low frequency vertical accelerations.
· Rope Speed = RSI signal.
· Event Marker – used by observer to mark points of interest such as end of hoisting or shedding.
Where:
· Horizontal (X & Y) = transverse normal to axis of hoist line. The two horizontal accelerometers were also normal to each other. The horizontal accelerations are positive for accelerations in directions +X & +Y and decelerations in -X & -Y.
· Vertical (Z) = in-line with the vertical axis of the hookblock. The vertical accelerations are positive for accelerations in +Z (where +Z is downward) and decelerations in -Z.
Note: Unless specifically mentioned the vertical accelerations results contained within this report are dynamic accelerations only. Gravitational acceleration or self-weight has been zeroed out at the initial instrumentation calibration stage. The vertical accelerations (Z) in figures 6 & 7 show a negative mean offset however, as the data was treated in order to obtain the amplitude of the acceleration from the mean, this offset does not effect the subsequent data analysis.
Figure 6 shows a typical output plot of the base data acquisition for a scenario 2 situation.
43

End of hoisting
Hookblock release Impacts
Increasing amplitude & frequency
Constant hoist speed
Spike on all channels due to impact or snag
Figure 6 – Typical Scenario 2 Base Data Plot
In figure 6 the large amplitude spikes on all frequency channels in this particular case are due to the pennant striking the hook block or snagging on the boom.
Figure 7 shows a typical output plot of the base data acquisition for a scenario 3 situation.
44

Start of hoisting
End of hoisting
Pennant shed Pennant landed
Figure 7 – Typical Scenario 3 Base Data Plot
The plots presented in figures 6 & 7 are useful in terms of visualising the motions and parameters within the system. Of particular interest are channels 3A and 3B showing an ever increasing frequency and amplitude of motion as the system approaches the end of hoisting.
Figure 7 was an S3 test. The pennant was shed almost immediately as soon as hoisting stopped but the hook block remains active. This plot is typical of the S3 plots obtained in that the actual shedding point cannot be positively identified from the acceleration data. The event marker plot indicates the pennant has been shed and is in flight by the use of multiple marks.
Acceleration Results Treatment
The base acceleration results obtained were converted to MS Excel format and the horizontal accelerations treated to determine the resultant horizontal acceleration. The accelerations were filtered into low frequency and high frequency accelerations.
Low Frequency (0 Hz to 20 Hz): accelerations in this range describe the overall displacement activity of the hook block. High Frequency (0 Hz to 300 Hz): accelerations in this range describe impacts and shock loadings experienced by the hook block.
45

46
Appendix 2 Critical Pendulum Length Data Analysis
This appendix contains the supporting analysis for section 4.1 in the main body of the report.
Hoist Speed
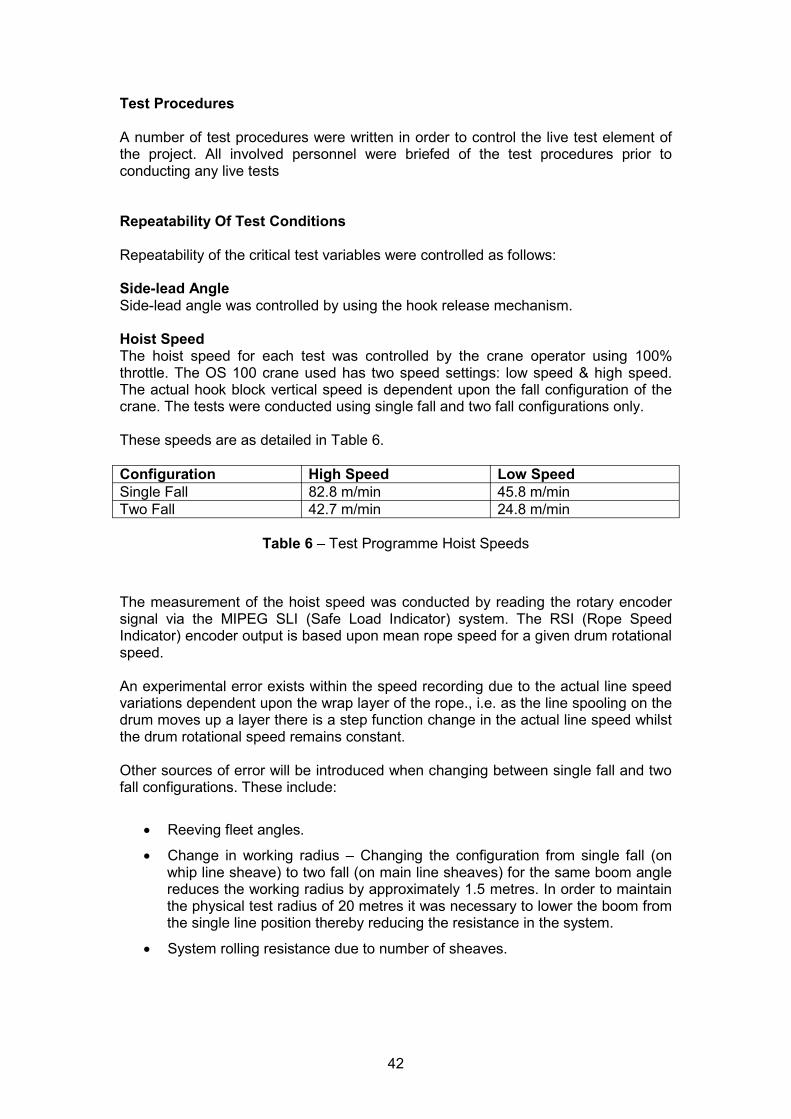
Chart 9 shows the comparison of critical pendulum length for changes in hoisting speed for both single fall and 2 fall configurations.
Hook 4, Single & 2 Fall Speed Comparison
0
1
2
3
4
5
6
7
8
9
)
Si
Si
ll igh
ll
Crit
ical
Pen
dulu
m L
engt
h (m
ngle Fall, High Speed
ngle Fall, Low Speed
2 Fa , HSpeed
2 Fa , Low Speed
5 10 15 20 Side Lead Angle (°)
Chart 9 – Hoist Speed Comparison
Fall Mode Side-lead Angle Hoist Speed Critical Pendulum Length (m)
Single 10° 83 m/min 7.5 Single 10° 46 m/min 6.6 Single 15° 83 m/min 7.8 Single 15° 46 m/min 7.6
Two Fall 10° 43 m/min 6.9 Two Fall 10° 25 m/min 5.2 Two Fall 15° 43 m/min 6.9 Two Fall 15° 25 m/min 5.8
Table 7 – P5 Critical Pendulum Length Comparison
From Chart 9 & Table 7 it can be seen that the hoist speed change for the single fall configuration reduces the critical pendulum length by 0.9 metres at 10° side-lead and 0.2 metres at 15° side-lead.
47
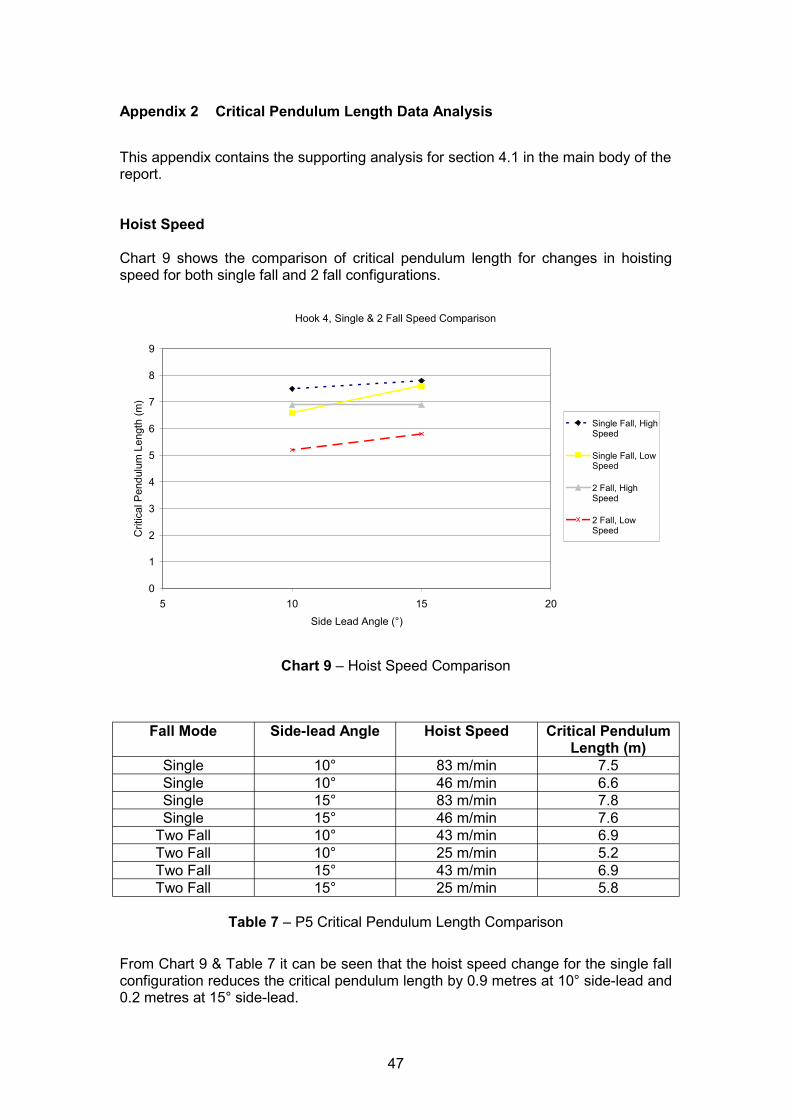
For the Two Fall configuration there is a more significant decrease in the final pendulum length between the high speed and low speed. The decreases are 1.7 metres at 10° side-lead and 1.1 metres at 15° side-lead.
It should also be noted that the low speed single fall data is comparable in magnitude to the high speed two fall data as the hoist speeds are similar.
Therefore, at hoist speeds of 25 to 40 m/s or over, the critical pendulum length of the system is not greatly influenced by the hookblock hoist speed. However, at hoist speeds of between 40 to 25m/s or lower, the hookblock hoisting speed has an increasing influence on the critical pendulum length. As the hoist speed reduces the critical pendulum length reduces. This is mainly due to the effects of system damping and the greater exposure time to the damping influences while hoisting at lower speeds.
Effect of Side-lead Angle
Chart 10 shows the comparison of critical pendulum length for changes in side-lead angle for both single fall and 2 fall configurations.
Hook4, Sidelead Comparison, Single Fall & 2 Fall
0
1
2
3
4
5
6
7
8
9
i)
l ll
l
l
l
Crt
ical
Pen
dulu
m L
engt
h (m
Hook4, P5, Low Speed, Sing e Fa
Hook4, P5, Low Speed Two Fal
Hook4, P5, High Speed Sing e Fall
Hook4, P5, High Speed Two Fal
0 5 10 15 20 Side Lead Angle (°)
Chart 10 – Side-lead Angle And Fall Mode Comparison
It can be seen that, as expected, while the initial side-lead angle of the system reduces then the critical pendulum length reduces. This is consistent with observations that hoisting with zero side-lead angle at full speed is safe (as long as the operator stops hoisting at a suitable height for the crane).
48

Effect Of Fall Mode (Single versus 2 fall)
Chart 10 also shows the comparison of critical pendulum length for single fall and 2 fall configurations of the same hook block (Hook 4). It can be seen that the single fall configurations have only small change in the critical pendulum length for the two speeds.
Visual observations of scenario 2 conditions indicate that the two fall block is extremely unstable and would often appear to completely invert around it’s horizontal axis.
Effect of Pennant Length & End Mass
Chart 11 shows the comparison of critical pendulum length for changes in pennant length.
Two Fall, Length Versus Mass Variations (Locked out Pivot)
Crit
ical
Pen
dulu
m L
engt
h (m
)
20
18
16
14
12
10
8
6
4
2
0
i
i
Two Fall H gh Speed P10 Variations
Two Fall H gh Speed P5 Variations
10 15 20 Side lead Angle (°)
Chart 11 – Length Versus Mass Comparison
Chart 12 compares the critical pendulum lengths for P5 and P10 which have the same end mass but different lengths.
49

Single Fall, Pennant Length Comparison
12 C
ritic
al P
endu
lum
Len
gth
(m)
10
8
6
4
2
0
8 8.4
7.2
10.3 Single Fall, P5
Single Fall, P10
5 10 15 20 Side Lead Angle (°)
Chart 12 – Length Variation Comparison
It can be seen from Charts 11 & 12 that as the length of the pennant increases then the critical pendulum length increases. It can also be seen from Chart 11 that the variations in free end mass have an insignificant effect on the critical pendulum length.
This is consistent with the principles of simple pendulum theory. Simple Pendulum theory dictates that the mass of a pendulum has no effect of the natural frequency of a pendulum but rather the natural frequency of a pendulum is a function of the length of the pendulum.
However, a variety of tests were conducted with slings without significant mass concentrations at the free end. These particular slings (P8 & WB3) displayed extremely stable S1 behaviour. From these tests it can be concluded that although variations in the mass concentration at the end of a pennant have an insignificant influence on the critical pendulum length, there must be a significant mass concentration at the free end of the pennant to allow the pennant to act as a simple pendulum.
The relationship between the critical pendulum length and the sling / pennant length is explored further in section 4.2.
50

Effect Of Masterlink
Chart 13 shows the comparison of critical pendulum length for the addition of a Masterlink at the captive end of the pennant.
P5 With & Without Masterlink, Single Fall @ High Speed
Crit
ical
Pen
dulu
m L
engt
h (m
)
10
9
8
7
6
5
4
3
2
1
0
li
Hook 5, P5
Hook 5, P5 with Master nk
5 10 15 20
Side lead angle, (°)
Chart 13 – Masterlink Comparison
From Chart 13 it can be seen that there is an insignificant difference in the critical pendulum length of the system when a masterlink is introduced.
However it should be noted that during S2 occurrences the activity of the masterlink on the hook block was subjectively less violent than the motion of the soft eye on the hookblock.
51
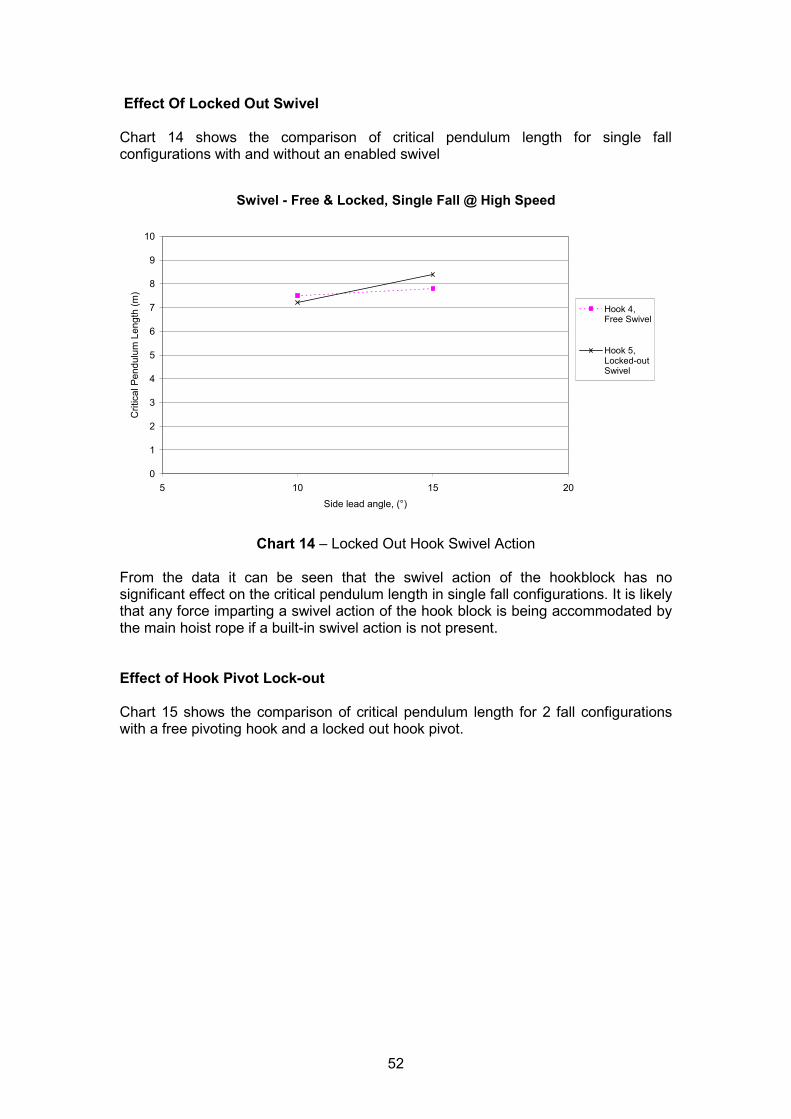
Effect Of Locked Out Swivel
Chart 14 shows the comparison of critical pendulum length for single fall configurations with and without an enabled swivel
Swivel - Free & Locked, Single Fall @ High Speed
Crit
ical
Pen
dulu
m L
engt
h (m
)
10
9
8
7
6
5
4
3
2
1
0
l Hook 4, Free Swive
Hook 5, Locked-out Swivel
5 10 15 20
Side lead angle, (°)
Chart 14 – Locked Out Hook Swivel Action
From the data it can be seen that the swivel action of the hookblock has no significant effect on the critical pendulum length in single fall configurations. It is likely that any force imparting a swivel action of the hook block is being accommodated by the main hoist rope if a built-in swivel action is not present.
Effect of Hook Pivot Lock-out
Chart 15 shows the comparison of critical pendulum length for 2 fall configurations with a free pivoting hook and a locked out hook pivot.
52

Pivot - Free & Locked, 2 Fall @ High Speed C
ritic
al P
endu
lum
Len
gth
(m)
15
14
13
12
11
10
9
8
7
6
5
4
3
2
1
0
12
6.9
Hook 4, Free Pivot
Hook 6, Locked-out Pivot
5 10 15 20 Side Lead Angle (°)
Chart 15 – Locked Out Hook Pivot Action
It can be seen that locking out of the hook pivot action has a dramatic effect on the critical pendulum length. The critical pendulum length of the system has increased by 5.1m.
53

54

Appendix 3 Critical Length Ratio Data Analysis
This appendix contains the supporting analysis for section 4.2
Chart 16 shows the comparison of the ratio of critical pendulum length (Lline) to pennant length (Lpennant) for a variety for speeds and initial side-lead angle in single fall.
Critical Length Ratio - Single Fall
Crit
ical
Len
gth
Ratio
2.0
1.8
1.6
1.4
1.2
1.0
0.8
0.6
0.4
0.2
0.0 0 5 10 15 20
Hook4, P5 100%
Hook4, P5 50%
Hook4, P6 100%
Hook4, P7 100%
Hook5, P5 100%
Hook5, P7 100%
Hook5, P10 100%
Side-lead Angle (°)
Chart 16 – Single Fall Critical Length Ratio Comparison
From Chart 16 it can be observed that, as expected, the critical length ratio decreases as initial side-lead angle decreases. With the exception of the P10 data, the critical length ratios for each side lead angle all lie within a narrow band.
The P10 data is consistent with the assumption that the amount of damping of a pennant increases as the pennant length increases.
Chart 17 compares the critical length ratio in terms of hoist speed.
55

P5 Critical Length Ratio - Single Fall
0
1
l
0.2
0.4
0.6
0.8
1.2
1.4
1.6
1.8 C
ritic
a L
engt
h R
atio
15° SF 10° SF 5° SF
0 20 40 60 80 100 Hoist Speed (m/s)
Chart 17 – Hoist Speed Critical Length Ratio Comparison
Chart 17 indicates that for the single fall speeds tested the critical length ratio is influenced less by the hoist speed than it is by the side-lead angle.
Critical Length Ratio - Hook 4 Two Fall
0 5 10 15 20
2 Fall,
2 Fall,
Fall,
0.0
0.2
0.4
0.6
0.8
1.0
1.2
1.4
1.6
1.8
2.0
Crit
ical
Len
gth
Rat
io
Hook4, P5 100%
Hook4, P5 50%
Single
Hook4, P5 50%
Side-lead Angle (°)
Chart 18 – Two Fall Critical Length Ratio Comparison
Chart 18 compares the critical length ratios for Hook4 in two fall mode. The single fall low speed values have also been included in order to show the comparison between single and two fall modes with similar hookblock speeds. It can be seen that the
56

critical length ratio reduces as the hoist speed reduces in two fall mode. This is consistent with the critical pendulum length results and the subjective observations made during the test programme. It supports the argument that when operating at low hoist speeds in two fall (or more) mode the exposure time to damping forces is much greater and therefore the hookblock motions are significantly reduced by the time the hookblock nears the boom tip.
Comparing the two fall 100% data with the single fall 50% data indicates that the critical length ratio is not as sensitive to variations in the fall mode if the hookblock hoisting speed is comparable.
The following chart, Chart 19, shows that once the hoisting speed is above a certain level, in this case between approximately 25 & 40 m/s, then the critical length ratio remains reasonably stable for a given side-lead angle.
Critical Length Ratio - Hook 4, P5 - Single Fall & Two Fall
Crit
ical
Len
gth
Rat
io
1.8
1.6
1.4
1.2
1
0.8
0.6
0.4
0.2
0 0 10 20 30 40 50 60 70 80 90 100
15° 10° 5°
Hookblock Speed (m/s)
Chart 19 – Hoist Speed And Side-lead Angle Critical Length Comparison
Of particular interest is the comparison between the two fall results for the Hook4 and Hook6. Chart 20 plots the obtained data.
57

ll Criti i i
io
0
2
4
6
8
10
12
14
16
18
20
Crit
i) l
l
Two Fa cal Length Rat o And Pendulum Length - Free P vot & Locked Out Pivot
0.0
0.5
1.0
1.5
2.0
2.5
3.0 C
ritic
al L
engt
h R
at
cal P
endu
lum
Len
gth
(m
CriticaLength Ratio
CriticaPendulum Length
Hook4, P5 50%, Free Hook4, P5 100%, Free Hook6, P5 Hook6, P10 Pivot Pivot Combinations 100%, Combinations 100%,
Locked-out Pivot Locked-out Pivot
Chart 20 – Locked Out Pivot Action Critical Length Ratio
It can be seen from the results that locking out the pivot action dramatically increases the Critical Length ratio. However, comparing the Hook 6 data for the P5 combinations and the P10 combinations shows that although the critical pendulum lengths are significantly different, the critical length ratios are of a similar magnitude.
58
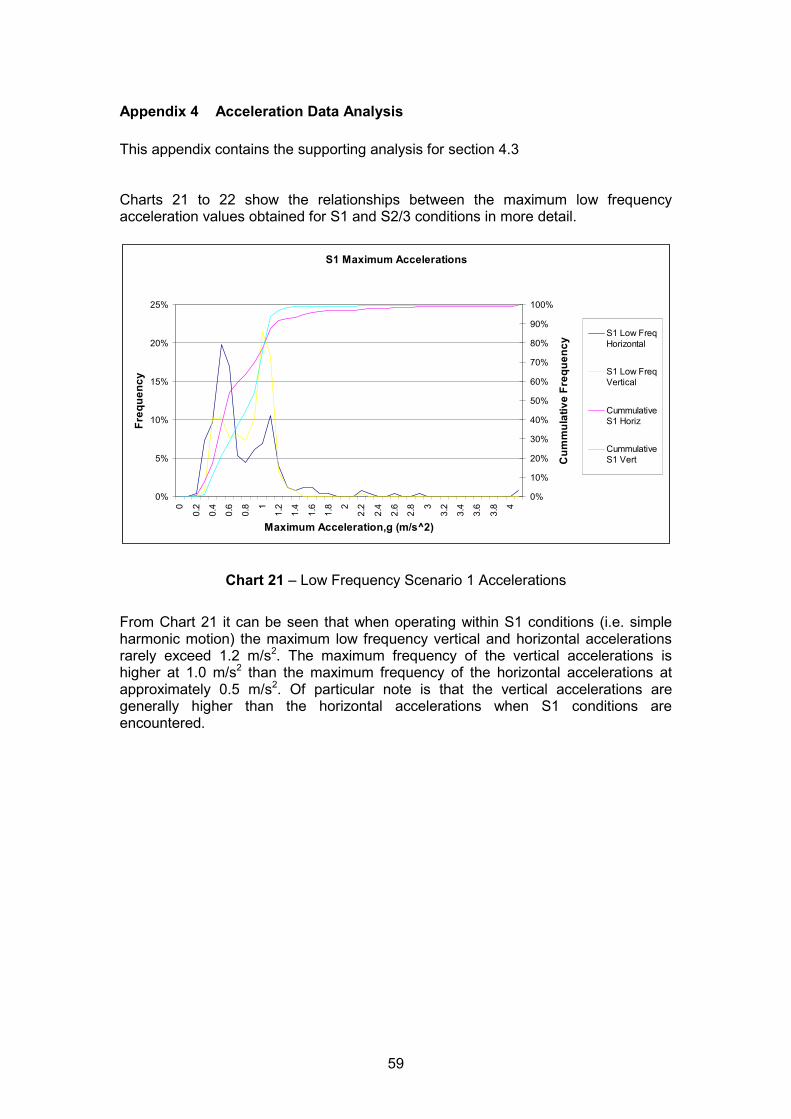
Appendix 4 Acceleration Data Analysis
This appendix contains the supporting analysis for section 4.3
Charts 21 to 22 show the relationships between the maximum low frequency acceleration values obtained for S1 and S2/3 conditions in more detail.
i
0%
5%
10%
15%
20%
25%
0 1 2 3 4
l (m/ )
0%
10%
20%
30%
40%
50%
60%
70%
80%
90%
i l
i l
l iiz
l i
S1 Maximum Accelerat ons
0.2
0.4
0.6
0.8
1.2
1.4
1.6
1.8
2.2
2.4
2.6
2.8
3.2
3.4
3.6
3.8
Maximum Acce eration,g s^2
Freq
uenc
y
100%
Cum
mul
ativ
e Fr
eque
ncy S1 Low Freq
Hor zonta
S1 Low Freq Vert ca
Cummuat ve S1 Hor
Cummuat ve S1 Vert
Chart 21 – Low Frequency Scenario 1 Accelerations
From Chart 21 it can be seen that when operating within S1 conditions (i.e. simple harmonic motion) the maximum low frequency vertical and horizontal accelerations rarely exceed 1.2 m/s2. The maximum frequency of the vertical accelerations is higher at 1.0 m/s2 than the maximum frequency of the horizontal accelerations at approximately 0.5 m/s2. Of particular note is that the vertical accelerations are generally higher than the horizontal accelerations when S1 conditions are encountered.
59

i l i
0%
5%
0 0.2 0.4 0.6 0.8 1 1.2 1.4 1.6 1.8
2 2.2 2.4 2.6 2.8 3 3.2 3.4 3.6 3.8
4
l i (m/ )
0%
10%
20%
30%
40%
50%
60%
70%
80%
90%
100%
li
i l
l
l i /3 iz
l i /3
S2 & S3 Max mum Acce erat ons
10%
15%
20%
25%
Maximum Acce erat on, g s^2
Freq
uenc
y
Cum
mu
atve
Fre
quen
cy
S2/3 Low Freq Hor zonta
S2/3 Low Freq Vertica
Cummuat ve S2Hor
Cummuat ve S2Vert
Chart 22 – Low Frequency Scenario 2 & 3 Accelerations
From Chart 22 it can be seen that the maximum low frequency accelerations for the vertical and horizontal directions are of a similar magnitude and distribution when S2 & S3 conditions are encountered. It can also be seen that there are little or no maximum acceleration less than 0.4 m/s2. Comparison of the cumulative plots shows that approximately 50% of the maximum horizontal accelerations are of magnitude 1.4 m/s2 and above compared to approximately 30% of the vertical maximum accelerations.
i i i
0%
5%
10%
15%
20%
25%
0 0.2 0.4 0.6 0. 1.2 1.4 1.6 1.8 2 2.2 2.4 2.6 2. 3.2 3.4 3.6 3.
i i / )
0% 10%
20% 30%
40% 50%
60% 70%
80% 90%
i
l
/l
l i
l iS2/
Vert cal Accelerat on Compar son
8 1 8 3 8 4
Max mum Accelerat on, g (m s^2
Freq
uenc
y
100%
Cum
mul
atve
Fre
quen
cy S1 Low Freq
Vertica
S2 3 Low Freq Vertica
Cummuat ve S1 Vert
Cummuat ve 3 Vert
Chart 23 – Low Frequency Vertical Accelerations
Chart 23 shows the comparison between the maximum low frequency vertical accelerations for S1 and S2/3 conditions. It can be seen that whilst both S1 and S2/3 conditions will produce a maximum frequency between 1 & 1.2 m/s2, approximately 40% of the S2/3 scenarios will encountered higher maximum accelerations than 1.2 m/s2. Approximately 90% of the S1 scenarios encountered will not produce maximum low frequency vertical accelerations greater than 1.2 m/s2.
60
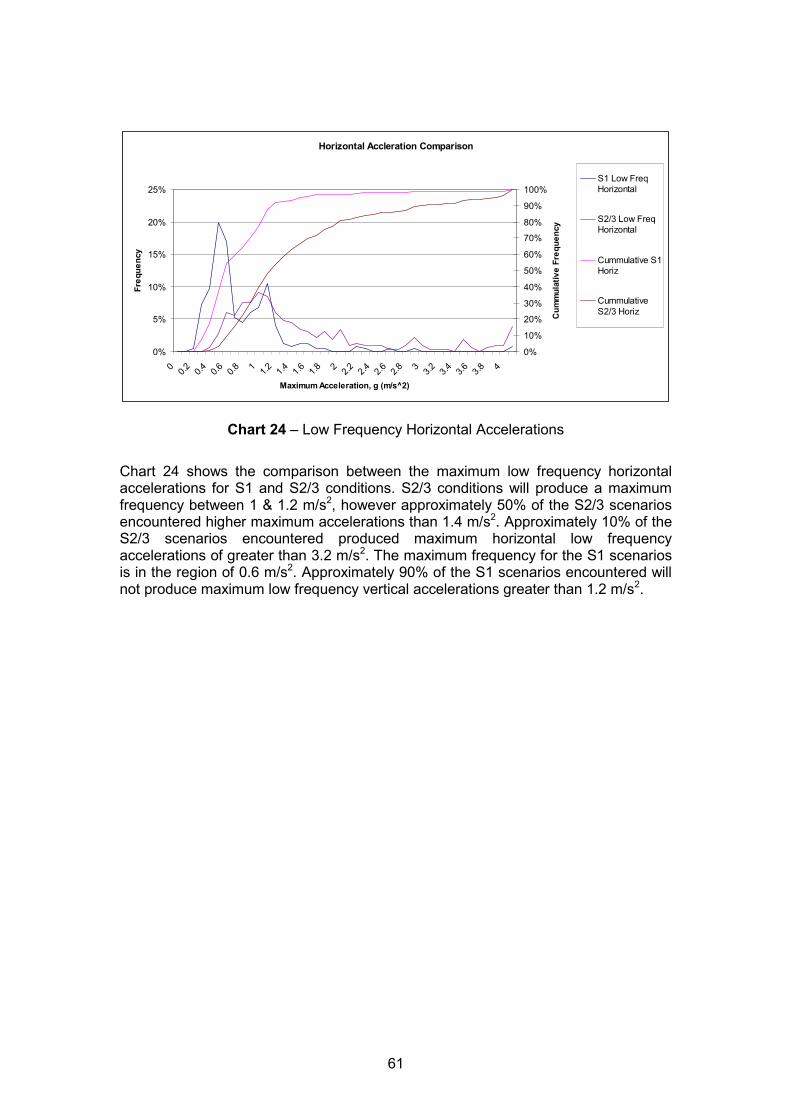
Hori i
0%
5%
0 0.2 0.4 0.6 0.8 1 1.2 1.4 1.6 1.8
2 2.2 2.4 2.6 2.8 3 3.2 3.4 3.6 3.8
4
l i (m/ )
0%
10%
20%
30%
40%
50%
60%
70%
80%
90%
100%
li
i l
/i l
l iiz
l iS2/ iz
zontal Accleration Compar son
10%
15%
20%
25%
Maximum Acce erat on, g s^2
Freq
uenc
y
Cum
mu
atve
Fre
quen
cy
S1 Low Freq Hor zonta
S2 3 Low Freq Hor zonta
Cummuat ve S1 Hor
Cummuat ve 3 Hor
Chart 24 – Low Frequency Horizontal Accelerations
Chart 24 shows the comparison between the maximum low frequency horizontal accelerations for S1 and S2/3 conditions. S2/3 conditions will produce a maximum frequency between 1 & 1.2 m/s2, however approximately 50% of the S2/3 scenarios encountered higher maximum accelerations than 1.4 m/s2. Approximately 10% of the S2/3 scenarios encountered produced maximum horizontal low frequency accelerations of greater than 3.2 m/s2. The maximum frequency for the S1 scenarios is in the region of 0.6 m/s2. Approximately 90% of the S1 scenarios encountered will not produce maximum low frequency vertical accelerations greater than 1.2 m/s2.
61

62
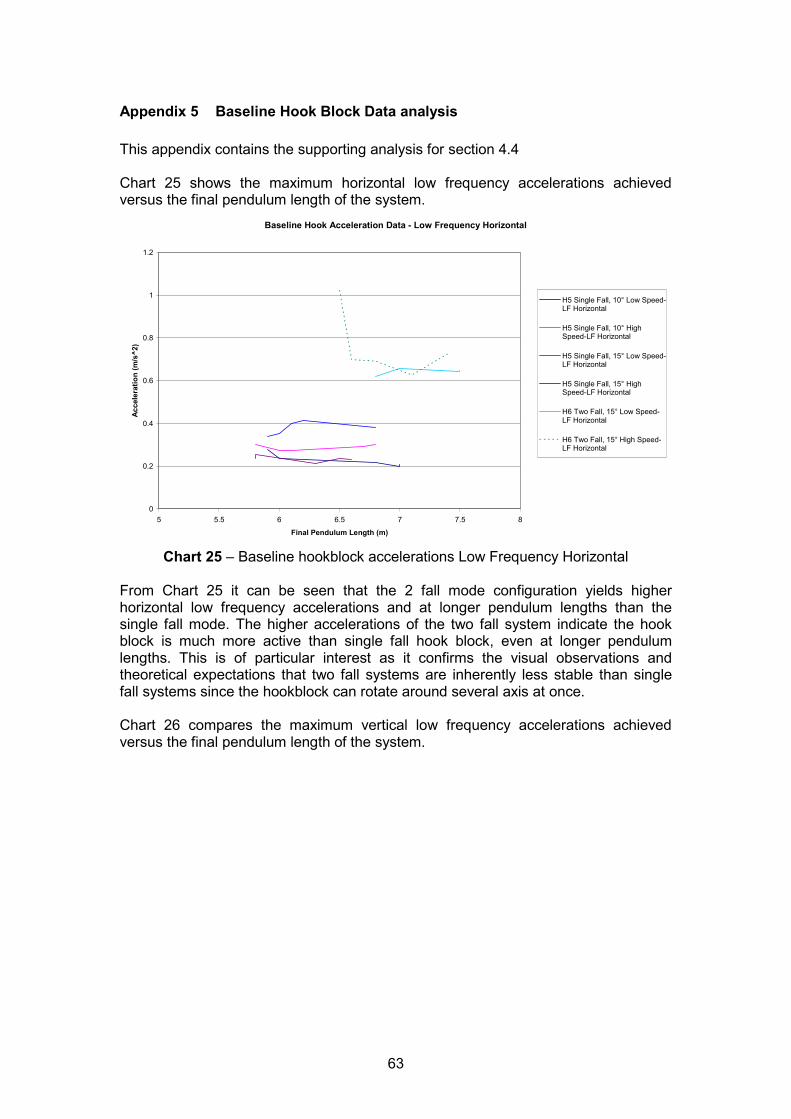
Appendix 5 Baseline Hook Block Data analysis
This appendix contains the supporting analysis for section 4.4
Chart 25 shows the maximum horizontal low frequency accelerations achieved versus the final pendulum length of the system.
Baseline Hook Acceleration Data - Low Frequency Horizontal
Acce
lera
tion
(m/s
^2)
1.2
1
0.8
0.6
0.4
0.2
0
H5 Si lli
H5 Si lli
H5 Si lli
H5 Si lli
lli
lli
ngle Fa , 10° Low Speed-LF Hor zontal
ngle Fa , 10° High Speed-LF Hor zontal
ngle Fa , 15° Low Speed-LF Hor zontal
ngle Fa , 15° High Speed-LF Hor zontal
H6 Two Fa , 15° Low Speed-LF Hor zontal
H6 Two Fa , 15° High Speed-LF Hor zontal
5 5.5 6 6.5 7 7.5 8
Final Pendulum Length (m)
Chart 25 – Baseline hookblock accelerations Low Frequency Horizontal
From Chart 25 it can be seen that the 2 fall mode configuration yields higher horizontal low frequency accelerations and at longer pendulum lengths than the single fall mode. The higher accelerations of the two fall system indicate the hook block is much more active than single fall hook block, even at longer pendulum lengths. This is of particular interest as it confirms the visual observations and theoretical expectations that two fall systems are inherently less stable than single fall systems since the hookblock can rotate around several axis at once.
Chart 26 compares the maximum vertical low frequency accelerations achieved versus the final pendulum length of the system.
63

Baseline Hook Acceleration Data - Low Frequency Vertical
Acce
lera
tion
(m/s
^2)
1.2
1
0.8
0.6
0.4
0.2
0 5 5.5 6 6.5 7 7.5 8
Final Pendulum Length (m)
ll
ll
ll
ll
ll
ll
H5 Single Fa , 10° Low Speed-LF Vertical
H5 Single Fa , 10° High Speed-LF Vertical
H5 Single Fa , 15° Low Speed-LF Vertical
H5 Single Fa , 15° High Speed-LF Vertical
H6 Two Fa , 15° Low Speed-LF Vertical
H6 Two Fa , 15° High Speed-LF Vertical
Chart 26 - Baseline hookblock accelerations Low Frequency Vertical
From Chart 26 it can be seen that as the initial side lead angle increases then the vertical low frequency accelerations of the system increase. There is less differentiation between the single fall and two fall vertical accelerations with a 15° side lead angle than with the horizontal accelerations.
Chart 27 displays the high frequency horizontal accelerations.
Baseline Hook Acceleration Data - High Frequency Horizontal
3.5
3 ll
HF Hori
llHF Hori
llHF Hori
llHF Hori
llHori
llHori
H5 Single Fa , 10° Low Speed-zontal
H5 Single Fa , 10° High Speed-zontal
H5 Single Fa , 15° Low Speed-zontal
H5 Single Fa , 15° High Speed-zontal
H6 Two Fa , 15° Low Speed-HF zontal
H6 Two Fa , 15° High Speed-HF zontal
Acce
lera
tion
(m/s
^2)
2.5
2
1.5
1
0.5
0 5 5.5 6 6.5 7 7.5 8
Final Pendulum Length (m)
Chart 27 - Baseline hookblock accelerations High Frequency Horizontal
From Chart 27, as with Chart 25, it can be seen that the horizontal high frequency accelerations for the two fall block are significantly higher at longer pendulum lengths than the single fall mode.
64

Chart 28 displays the high frequency vertical accelerations.
Baseline Hook Acceleration Data - High Frequency Vertical
Acce
lera
tion
(m/s
^2)
1.6
1.4
1.2
1
0.8
0.6
0.4
0.2
0
ll
ll
ll
ll
ll
H6 Two Fall
H5 Single Fa , 10° Low Speed-HF Vertical
H5 Single Fa , 10° High Speed-HF Vertical
H5 Single Fa , 15° Low Speed-HF Vertical
H5 Single Fa , 15° High Speed-HF Vertical
H6 Two Fa , 15° Low Speed-HF Vertical
, 15° High Speed-HF Vertical
5 5.5 6 6.5 7 7.5 8
Final Pendulum Length (m)
Chart 28 - Baseline hookblock accelerations High Frequency Vertical
From Chart 28 it can be seen that, as with the low frequency vertical accelerations, there is less differentiation between the single fall and two fall vertical accelerations with a 15° side lead angle than with the horizontal accelerations. Once again as the initial side lead angle increases then the vertical low frequency accelerations of the system increase.
65

66

Appendix 6 Chain Pennant Accelerations
This appendix contains the supporting analysis for section 4.5
Chart 29 displays the chain pennant low frequency acceleration distribution encountered.
CP2 Acceleration Data - All Low Frequency
0%
10%
20%
30%
40%
50%
60%
70%
80%
0%
10%
20%
30%
40%
50%
60%
70%
80%
90%
100%
//
llll
Freq
uenc
y
Cum
mul
ativ
e Fr
eque
ncy S1 Low Freq Horizontal
S1 Low Freq Vertical S2 3 Low Freq Horizontal S2 3 Low Freq Vertical cumu ative S1 Horiz cumu ative S1 Vert cumu ative S2/3 Horiz cumu ative S2/3 Vert
0 0.2 0.4 0.6 0 8 1 1. .2 1.4 1.6 1 8 2 2. .2 2.4 2.6 2 8 3 3. .2 3.4 3.6 3.8 4
Maximum Acceleration, g (m/s^2)
Chart 29 – Chain Pennant Low Frequency Accelerations
It can be seen from the data that the when S2/3 scenarios are encountered the low frequency accelerations are of approximately twice the magnitude of the S1 scenario accelerations.
Chart 30 compares the S1 low frequency horizontal and vertical accelerations. CP2 Acceleration Data - Low Frequency S1
0% 0%
l
10%
20%
30%
40%
50%
60%
70%
80%
Freq
uenc
y
10%
20%
30%
40%
50%
60%
70%
80%
90%
100%
Cum
mul
ativ
e Fr
eque
ncy
S1 Low Freq Horizontal S1 Low Freq Verticacumulative S1 Horiz cumulative S1 Vert
0 0.2 0.4 0.6 0.8 1 1.2 1.4 1.6 1.8
2 2.2 2.4 2.6 2.8 3 3.2 3.4 3.6 3.8
4
Maximum Acceleration, g (m/s^2)
Chart 30 – Chain Pennant Low Frequency Scenario 1 Accelerations
67

It can be seen from chart 30 that approximately 80% of the S1 accelerations are lower than 0.7 m/s2.
Chart 31 compares the S2/3 low frequency horizontal and vertical accelerations. CP2 Acceleration Data - Low Frequency S2 & 3
0%
5%
10%
15%
20%
25%
30%
35%
40%
45%
0%
i
Freq
uenc
y
10%
20%
30%
40%
50%
60%
70%
80%
90%
100%
Cum
mul
ativ
e Fr
eque
ncy
S2/3 Low Freq Hor zontal S2/3 Low Freq Vertical cumulative S2/3 Horiz cumulative S2/3 Vert
0 0.2 0.4 0.6 0.8 1 1.2 1.4 1.6 1.8
2 2.2 2.4 2.6 2.8 3 3.2 3.4 3.6 3.8
4
Maximum Acceleration, g (m/s^2)
Chart 31 – Chain Pennant Low Frequency Scenario 2 & 3 Accelerations
It can be seen from Chart 31 that approximately 40% of the vertical accelerations are between 1.0 and 1.2 m/s2.
Chart 32 compares the cumulative low frequency S2/3 accelerations for chain pennants against all the recorded data.
68

S2 & S3 Cumulative Maximum Accelerations
100%
90%
80%
70%
60%
l i
l
liz
l
Cummu ative S2/3 Hor z -All Data
Cummu ative S2/3 Vert -All Data
Chain Pennant cumu ative S2/3 Hor
Chain Pennant cumu ative S2/3 Vert
Freq
uenc
y
50%
40%
30%
20%
10%
0%
0 0.2 0.4 0.6 0.8 1 1.2 1.4 1.6 1.8
2 2.2 2.4 2.6 2.8 3 3.2 3.4 3.6 3.8
4
Maximum Acceleration, g (m/s^2)
Chart 32 – Chain Pennant Versus All Data Low Frequency Comparison
Chart 33 compares the S2 & 3 low frequency means and medians for the chain pennant data versus all the data.
i il
0
0.5
1
1.5
2
2.5
3
Low
i l i l
Low
i l i
i l
l (
)
in
l
Low Frequency Mean & Med an Compar son - Chain Pennant Versus Al Data
Frequency Hor zonta
Mean
Low Frequency
Vert caMean
Frequency Hor zonta
Med an
Low Frequency
Vert caMedian
Acc
eer
atio
n, g
m/s
^2
S2& 3 ChaPennant S2& 3 Aldata
Chart 33 – Low Frequency S2 & 3 Mean And Median Accelerations
It can be seen from Charts 32 & 33 that the low frequency accelerations for the chain pennant are higher than the accelerations for the overall S2 & 3 data. This indicates that whilst it is more difficult to induce scenario 2 conditions with a chain pennant, once induced, the accelerations and related forces involved are higher.
69

70

Appendix 7 Photographs
Photo 1 – Boom tip fixed pulley
Photo 2 – Hook release mechanism with hookblock held ready to release
71

Photo 3 – Shed pennant come to rest on A-frame tip
Photo 4 – Shed pennant come to rest on A-frame tip. View from A-frame tip
72

Photo 5 – Shed pennant come to rest on crane machinery cab. Load closing hook opened on impact
Photo 6 – Shed pennant imbedded in ground after impact with container. Load closing hook opened on impact with container
73

Photo 7 - Shed pennant impact damage to fence
Photo 8 – Wire rope pennant (P5) imbedded in ground on impact
74
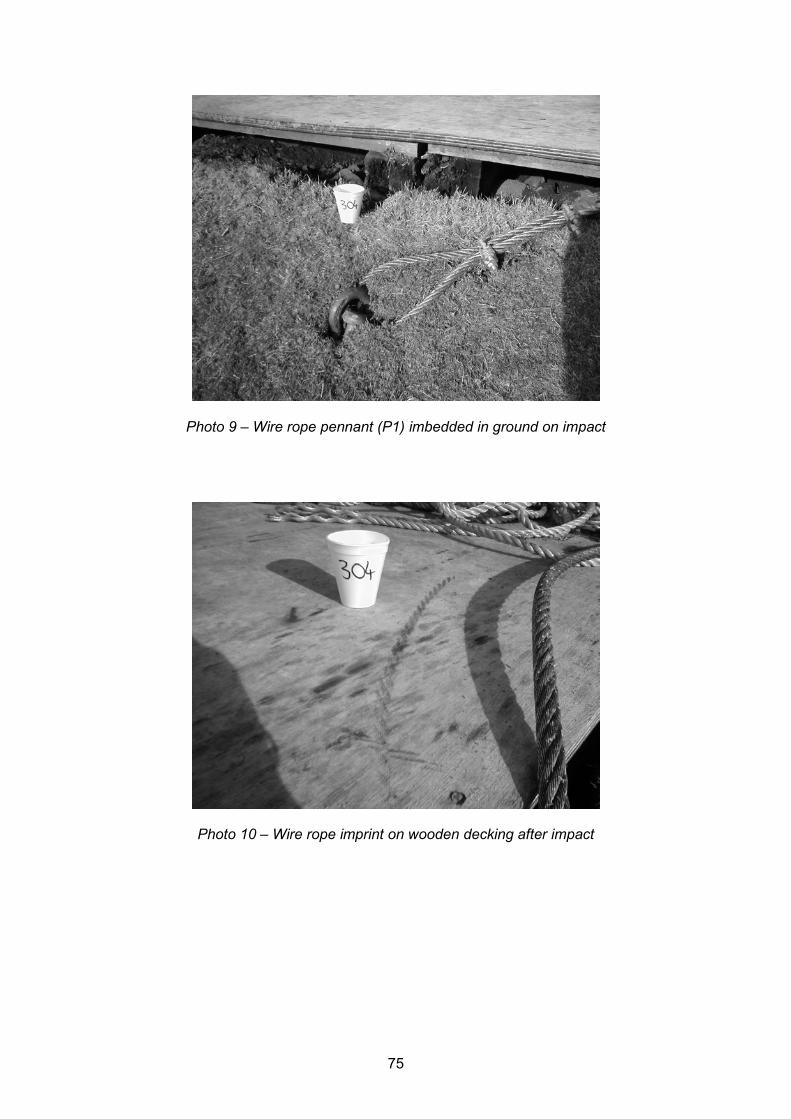
Photo 9 – Wire rope pennant (P1) imbedded in ground on impact
Photo 10 – Wire rope imprint on wooden decking after impact
75

76

Appendix 8 Base Data Table
Hookblock Load Angle Falls Speed Speed Desc
Critical Length, m
Pennant Length, m
Critical Length Ratio
Single Fall Data Hook 4 P5 15° Single 83 m/min 100% 7.8 4.6 1.70 Hook 4 P5 10° Single 83 m/min 100% 7.5 4.6 1.63 Hook 4 P5 5° Single 83 m/min 100% 3.5 4.6 0.76 Hook 4 P5 15° Single 46 m/min 50% 7.6 4.6 1.65 Hook 4 P5 10° Single 46 m/min 50% 6.6 4.6 1.43 Hook 4 P6 15° Single 83 m/min 100% 8 4.6 1.74 Hook 4 P7 15° Single 83 m/min 100% 8 4.6 1.74 Hook 5 P5 15° Single 83 m/min 100% 8.4 4.6 1.83 Hook 5 P5 10° Single 83 m/min 100% 7.2 4.6 1.57 Hook 5 P5 15° Single 46 m/min 50% 7.8 4.6 1.70 Hook 5 P10 15° Single 83 m/min 100% 10.3 7.6 1.36 Hook 5 P10 10° Single 83 m/min 100% 8 7.6 1.05 Hook 5 P7 15° Single 83 m/min 100% 8.2 4.6 1.78 Hook 5 P7 10° Single 83 m/min 100% 7.4 4.6 1.61
Two Fall Data Hook 4 P5 15° Two Fall 43 m/min 100% 6.9 4.6 1.50 Hook 4 P5 10° Two Fall 43 m/min 100% 6.9 4.6 1.50 Hook 4 P5 5° Two Fall 43 m/min 100% 3.4 4.6 0.74 Hook 4 P5 15° Two Fall 25 m/min 50% 5.8 4.6 1.26 Hook 4 P5 10° Two Fall 25 m/min 50% 5.2 4.6 1.13 Hook 6 P5 15° Two Fall 43 m/min 100% 12 4.6 2.61 Hook 6 P11 15° Two Fall 43 m/min 100% 12.6 4.6 2.74 Hook 6 P12 15° Two Fall 43 m/min 100% 12.5 4.6 2.72 Hook 6 P10 15° Two Fall 43 m/min 100% 18 7.6 2.37 Hook 6 P13 15° Two Fall 43 m/min 100% 17.9 7.6 2.36 Hook 6 P14 15° Two Fall 43 m/min 100% 17.5 7.6 2.30
Chain Pennant Data Hook 4 CP2 10° Two Fall 43 m/min 100% 5.9 2 2.95
Miscellaneous Data Hook 6 SHU 15° Two Fall 43 m/min 100% 7.5 N/A N/A Hook 6 P15 15° Two Fall 43 m/min 100% 9 N/A N/A Hook 5 NONE 10° Single 83 m/min 100% N/A N/A N/A Hook 5 NONE 10° Single 46 m/min 50% N/A N/A N/A Hook 5 NONE 15° Single 46 m/min 50% N/A N/A N/A Hook 5 NONE 15° Single 83 m/min 100% N/A N/A N/A Hook 6 NONE 15° Two Fall 43 m/min 100% N/A N/A N/A Hook 6 NONE 15° Two Fall 25 m/min 50% N/A N/A N/A
77

78
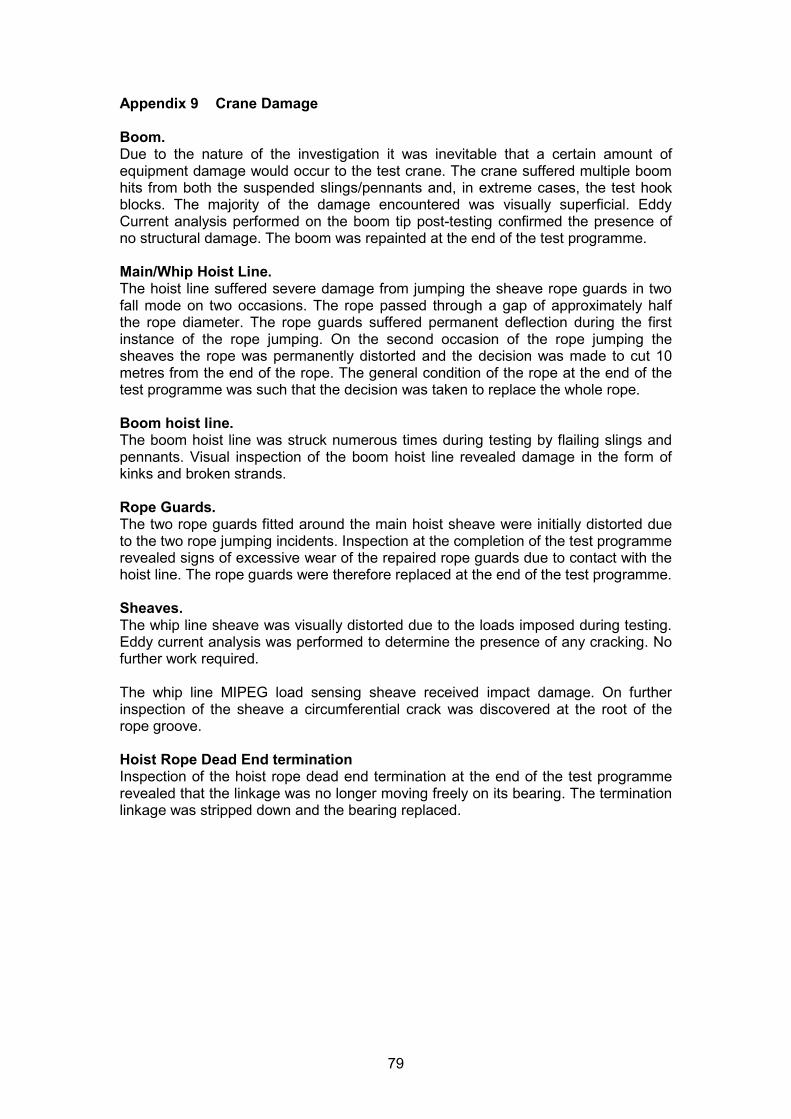
Appendix 9 Crane Damage
Boom. Due to the nature of the investigation it was inevitable that a certain amount of equipment damage would occur to the test crane. The crane suffered multiple boom hits from both the suspended slings/pennants and, in extreme cases, the test hook blocks. The majority of the damage encountered was visually superficial. Eddy Current analysis performed on the boom tip post-testing confirmed the presence of no structural damage. The boom was repainted at the end of the test programme.
Main/Whip Hoist Line. The hoist line suffered severe damage from jumping the sheave rope guards in two fall mode on two occasions. The rope passed through a gap of approximately half the rope diameter. The rope guards suffered permanent deflection during the first instance of the rope jumping. On the second occasion of the rope jumping the sheaves the rope was permanently distorted and the decision was made to cut 10 metres from the end of the rope. The general condition of the rope at the end of the test programme was such that the decision was taken to replace the whole rope.
Boom hoist line. The boom hoist line was struck numerous times during testing by flailing slings and pennants. Visual inspection of the boom hoist line revealed damage in the form of kinks and broken strands.
Rope Guards. The two rope guards fitted around the main hoist sheave were initially distorted due to the two rope jumping incidents. Inspection at the completion of the test programme revealed signs of excessive wear of the repaired rope guards due to contact with the hoist line. The rope guards were therefore replaced at the end of the test programme.
Sheaves. The whip line sheave was visually distorted due to the loads imposed during testing. Eddy current analysis was performed to determine the presence of any cracking. No further work required.
The whip line MIPEG load sensing sheave received impact damage. On further inspection of the sheave a circumferential crack was discovered at the root of the rope groove.
Hoist Rope Dead End termination Inspection of the hoist rope dead end termination at the end of the test programme revealed that the linkage was no longer moving freely on its bearing. The termination linkage was stripped down and the bearing replaced.
79

80

Appendix 10 References
The following publications are recommended further reading:
1 Offshore crane operator and Banksman/slinger integrated safe operating procedures – revision 3 2001 Sparrows Offshore Services SI01_03
2 Report on the investigation into the snagging of hooks and their indiscriminate shedding of slings/pennants – phase 1 2001 HSE OTO 2001 054
3 Code For Lifting Appliances in a Marine Environment January 1987 Lloyds Register of Shipping
4 The snagging of hooks and shedding of slings hazards of crane operations May 2002 Health & Safety Laboratory ME/01/28
5 Technical guidance on the safe use of lifting equipment offshore 2002 HSE Books HSG221
6 Sight your hook – an investigation into the snagging of crane hooks and the shedding of slings January 2002 Health & Safety Laboratory Visual Presentations Services (VIDEO) Edit master 1123
7 Unsolicited sling shedding – an investigation into the shedding of unladen slings and pennants from crane hooks August 2002 HSE (VIDEO) VO3/2002
81

Printed and published by the Health and Safety ExecutiveC30 1/98
Printed and published by the Health and Safety Executive C1.25 03/03

ISBN 0-7176-2696-2
RR 003
780717626960£25.00 9

Inve
stigatio
n o
f shed
din
g o
f slings fro
m cra
ne h
ooks - p
hase
2
HS
E B
OO
KS