research chapter 1. introduction to it · 1 chapter 1. introduction to it research table of...
TRANSCRIPT

1
Chapter 1. Introduction to ITResearch
Table of ContentsOverview of a Research Project ....................................................................................... 1The Research Experience ............................................................................................... 1Research Teams ............................................................................................................ 2The Research Life Cycle ................................................................................................ 2Research Products in IT ................................................................................................. 2Types of Research ........................................................................................................ 3Research Methods in IT ................................................................................................. 4Example of Different Research Methods in a Study ............................................................ 4
Overview of a Research ProjectResearch in most disciplines involves studying natural or sociological phenomena in order tounderstand them better. Information Technology research is concerned with developing new theoriesand mechanisms to improve current practice in constructing computer systems. In this respect IT issimilar to engineering: while some IT research involves only ideas or theory, this is rare. It is far moreoften the case that ideas are validated through practical implementation and evaluation. It should notbe assumed, however, that all IT research focuses on computing systems rather than on human factors.In applied or action research, projects address specific problems in the real world that can be improvedthrough creative use of computers; much research is devoted to improving the human interface tocomputing; etc. In these projects, research methods used in commerce and the humanities become partof the repertoire of IT researchers as well.
Most research projects comprise four main stages. These do not occur strictly in sequence. There isconsiderable iteration involved, as insights gained in later stages enable earlier decisions to be revisedor reconsidered. The four main stages are:
1. identify a research question to address
2. collect information on the problem and on existing knowledge relevant to it
3. explore and evaluate one or more possible answers
4. report the results and conclusions
Not all of these steps will apply to all projects. Some of the best research simply identifies a newproblem, without investigating answers. No research project can omit the last stage however; if workis not published it cannot be part of the body of knowledge in the discipline.
The Research ExperienceShould you embark on a research project? What can you expect from the experience? Some of the mainattractions of research are the wonder and excitement invoked by building, observing or understandingsomething that no-one has created, seen or understood before. Research success is a major personaltriumph that leads to recognition, and the privilege of adding to human knowledge. Researchers enjoythe thrills of discovery, the ability to meet and work with others who are deep thinkers and passionateabout their subject, including (if not locally, then at conferences and seminars) invaluable talks withleaders in the field who will pass on their enthusiasm and their insight. In research, you have anenormous degree of freedom in choosing what you want to work on, who you want to work with,
Introduction to IT Research
2
how you will do so and how you will manage your time. Moreover, project outputs will bring aboutchange and improvement in the lives of others. While research is mainly about innovative ideas andexperimentation, most of a researchers time is spent doing things that indirectly support and contributeto this: reading, planning, talking, conducting meetings, writing, etc. Researchers have to deal withfrustrations and disappointments as well, and often the cause is beyond the researchers control (failureor inaccessibility of underlying technology/tools, inadequacy or privacy of expected data, lack ofresources, etc.). At other times, experiments fail, hypotheses turn out to be wrong, or ones results areconsidered incorrect, insignificant or a duplication of others.
Research TeamsResearch should not be conducted in isolation. Where projects are tackled by a single individual whodoes not meet regularly with any others, the person has the extra burden of putting effort into obtainingfeedback and discussing new developments in the field. Working in a team provides a network forsupport and shared responsibility; it enables larger projects to be tackled and makes it easier for oneto specialize in specific aspects because there are others to address remaining issues; and it developsteamwork skills, which are vital both within and outside the research sphere. The downside is thatthe overall quality and rate of progress are highly sensitive to the performance of others, and groupmanagement overhead is introduced. Managing a research team requires that individual roles andresponsibilities are made clear to all, authorship of articles fairly agreed upon from the outset andreviewed when necessary, and regular meetings held with appropriate records/minutes.
The Research Life CycleAll research should be seen as part of a much larger quest to better understand and harness humanknowledge and experience in a discipline. Each project is part of a broader process - building on whathas gone before, and adding ideas, theories and artifacts that can in turn be built on by others. In IT,this development typically comprises the following phases:
1. A new problem, new constraints, new opportunity or new approach is identified
2. Initial solutions, methods, algorithms, designs, theorems, programs, architectures, hardware ormodels are proposed
3. These are evaluated and refined, and different improvements to many of these ideas are investigated
4. Solutions are compared
5. A framework or taxonomy of the problem and solution space is devised; theorems are proved aboutthe limits on any solutions; the existence of an optimal solution is considered and compared withcurrent solutions; etc.
6. The best solutions are adopted by the community, commerce, industry and researchers in otherdisciplines or fields
Not all of these phases occur in all research some problems are too expensive to evaluate, or too largeand varied to draw any conclusions about the solution space.
Research Products in ITIT research results or products take the following forms:
• a literature review
• programs
• architectures

Introduction to IT Research
3
• systems or prototypes
• theorems
• models
• user/expert surveys
• user/expert experiments
• system content (ontologies, knowledge bases, class libraries, graphics toolboxes, etc.)
• measurements
• hardware
• analysis of existing research in the area
• published papers and books (without this, the research remains incomplete!)
Types of ResearchResearch can be
• Pure or applied
• Qualitative and/or quantitative
• Empirical (experimental) and/or analytical
• Laboratory or action research
An applied research question has a clear and definite benefit in pointing to a solution or improvementfor a practical problem. In contrast, when the solution to a research problem has no evident bearing on areal-life situation, but is of interest to the research community to give them better understanding, this istermed pure research. The cost of not knowing the answer to a pure research question is hard to measureas it revolves around the cost of lacking knowledge, which affects our ability to solve other, and moresignificant, research problems. But the cost of having no answer to an applied research problem can bemeasured in terms of money, health, lifestyle or the like. Whereas pure research addresses somethingwe wish to know (or know better), applied research tackles something we wish to do (or do better). Aresearcher should be aware of whether they are interested in pure or applied research, and should nottry to mix the two. For example, researchers should not relate their work to a practical problem if it ispure research and is not, in fact, demonstrably necessary in order to solve that practical problem.
Quantitative research is concerned with analysis done in terms of numbers; qualitative data describesartifacts and events scientifically without numbers. Qualitative research is more exploratory in nature,involving procedures such as interviews and observation. Quantitative research measures or countspre-determined properties and phenomena; its results are easier to interpret.
Empirical methods are based on observation (surveys, case studies, experiments). These observationsshould be accurate and as general as possible (i.e. applicable to as many cases as possible). Suchresearch can formulate a new theory or test an existing theory to confirm or refute it. Analyticalmethods involve modeling, simulation, formal proofs and analysis; they permit phenomena to bestudied without building prototype systems or involving human participants.
Action research studies a social situation with a view to improving it; for example research directed atimproving education or health care. It is problem-focused and context-specific, and involves a cycle ofresearch, change and evaluation. Information gathering centres on understanding situations as ongoingprocesses happening in the real-world environment. Problem definition and analysis is an importantaspect of action research; it aims to give a clear picture of the possible benefit of research on a practicalaspect of our lives, and then studies how this might be achieved.

Introduction to IT Research
4
Laboratory research involves controlled measurement and interpretation of data in order to testhypotheses and theories. The problem with such controlled experiments is that an artificialenvironment is different from reality. The benefit of the scientific method of laboratoryexperimentation is that careful control enables accurate, reliable and repeatable studies to be done; withextraneous factors kept constant and independent variables systematically altered by the researcher.
Research Methods in ITThe main research methods that can be employed to answer a research question are listed below. Morethan one of these methods will be used in most research projects, in order to tackle the same problem/task from a number of different perspectives:
1. literature reviews
2. prototyping
3. modelling
4. laboratory experiments and tests
5. field studies (observation and experimentation in real environments)
6. case studies (detailed analysis of a specific application)
7. surveys (interviews and questionnaires to assess human factors in IT)
8. mathematical proofs
9. heuristic evaluation
10.usability studies
11.statistical analysis
Each of the eleven methods listed above is a skill to learn, rather than a recipe to follow. Thereare difficulties to overcome, choices to make, and time/resource constraints requiring simplifyingassumptions. Subsequent chapters will address some of these issues.
Technical research goals are most often met through the use of models, languages, algorithms andmathematical proofs; goals involving the human side of computing are typically met using surveys,case studies and experiments.
Note that programming does not constitute research, but software prototypes play an important rolein experimental IT research. They enable properties to be studied, ideas to be validated, alternativesto be compared, measurements to be made, usability analysis to be conducted and field/case studiesto be done. They are also a valuable source of new problems and insight.
Study papers in your subject area to see the methods used to conduct and to present research; it isbest to use the same methods if you aim to publish in that field. The chances of choosing the rightmethods are greater, since they have proved successful for others; it will also be easier to convince thecommunity of your research results if the methods used are what they expected.
Example of Different Research Methods in aStudy
As an example of how different research methods can be employed, consider the following situation.The research question: “How can the new technology <T> be adapted to run on very small computers?”can utilize the various methods in the following ways:

Introduction to IT Research
5
1. a literature review will familiarize you with <T>, with the properties of small computers, and withany work already done on using <T> with small machines
2. a prototype implementation of <T> on a small device can demonstrate its feasibility, evaluate andcompare alternative implementations, and/or indicate what problems need to be solved in this newcontext
3. a model of the new technology or of small computers can be built and studied to enable current andfuture research to understand more about the problem
4. a prototype implementation can be tested and performance measurements recorded and analysed
5. the use of small computers in a particular real life context can be studied to determine the viabilityand demands on <T> in this domain, or a prototype can be used in the field and problems andlimitations observed
6. a specific use of <T> on a particular device in some real world application can be studied todetermine problems and potential solutions/improvements
7. an assessment of <T> by users with small machines such as mobile computers can be determinedby surveying a representative sample etc.
The particular methods chosen will depend on how much or how closely existing research has alreadystudied <T> in the context of small machines. It will also be governed by the interests of the researcher(e.g. some prefer to focus on low-level system implementation issues, others who prefer the human sidemay look at usability aspects, etc.), the availability of expertise and resources, the skills the researcherhas and the skills s/he wishes to learn, etc. The only methods that are always essential are conductinga literature review at the outset, and publishing results on completion of the work. These first and lastskills are imperative for anyone entering the research field.

1
Chapter 2. Ethics in Research
Table of ContentsWhy does unethical research behaviour arise? .................................................................... 1Unethical conduct in research ......................................................................................... 1Plagiarism .................................................................................................................... 2Multiple publications ..................................................................................................... 2Accusations of unethical conduct ..................................................................................... 3Institutional responsibilities ............................................................................................. 3Three places to give credit in a publication ........................................................................ 3Who should be credited ................................................................................................. 4Undeserved credit ......................................................................................................... 4Agreement from authors ................................................................................................. 4Ethical conduct for researchers ........................................................................................ 4Peer review safeguards .................................................................................................. 5Research results and the general public ............................................................................. 5Data Availability .......................................................................................................... 5Patents and Agreements ................................................................................................. 6Ethics in observations .................................................................................................... 6Confidentiality .............................................................................................................. 6Contracts in experimentation ........................................................................................... 6
Why does unethical research behaviourarise?
It happens, though very rarely, that researchers are tempted to falsify results or to steal ideas because ofpressure to achieve more, or better, or faster. Another reason is for monetary gain, where the researcherhas a financial interest in a particular product or company that will be affected by the research results.Lastly, unethical conduct can be a result of ignorance – for example, failing to prepare participants inan experiment appropriately, failing to negotiate agreements with external bodies, etc.
Unethical conduct in researchThe worst type of unethical behaviour is deliberate deception - reporting experimental results whichare fabricated or altered (falsification), or reporting others work or words as one’s own (plagiarism).There are many other forms of unethical or unprofessional conduct in research, which can arise whiledoing the research, when performing experiments, in publishing results, or in handling misconduct.Unethical behaviour during research:
• Undertaking work despite a conflict of interest
• Ignoring proprietary rights
• Misuse of research funds
• Sexual harassment
• Incorrect reporting of publications in a curriculum vitae, funding request, etc.
• Malicious interference with the research of others
• Stealing data when permission to use it was refused
Unethical conduct in experiments:

Ethics in Research
2
• Compromising the privacy or confidentiality of subjects
• Secret observation or recording of the activities of others
• Risking harm to others
• Accessing confidential data in secret or otherwise breaching security
• Using inaccurate or unreliable data
• Destroying data or results so others cannot access them
Unethical publication:
• Stealing ideas
• Plagiarism
• Incorrectly attributing work/ideas to people not involved
• Claiming untrue, distorted or non-existent results
• Concealing known problems with the work reported
• Presenting work in an overly complex way
• Publishing the same idea(s) in multiple places
Inappropriate behaviour concerning accusations of misconduct:
• Failure to report unethical behaviour by others
• Malicious accusation of others
• Cover-ups of unethical practice
• Lack of due process when handling complaints of unethical
• behaviour
• Reprisals against those who identify unethical conduct
PlagiarismPlagiarism is the stealing of words and ideas from others. This can take several forms - presentingresearch solutions, models, techniques and results as one’s own when they are taken from anothersource; repeating the words of others as if they were one’s own; duplicating paragraphs or sentencesfrom another text but changing the actual words to make it appear different; etc. One way of knowingwhether you are plagiarizing a document or not, is to check whether you are typing in your owntext while looking at that work (rather than typing your own thoughts or your own notes); if so, youare directly or indirectly using their material and presenting it as your own. Once research has beenpublished, it becomes part of the body of knowledge and can be used and referred to by others – whomust acknowledge the source by an appropriate citation. Before that, if ideas are taken from workseen in privileged grant applications, research proposals or manuscripts, to use the idea is to stealintellectual property. Research remains private property until publicly published or disseminated.
Multiple publicationsIt is unethical to publish the same paper in two different places, or to publish two very similar papers.It is equally unethical to submit the same, or very similar papers, to more than one journal/conference
Ethics in Research
3
at a time (even if acceptance rates are low or slow). If more than one paper is published as a result ofa single piece of research, each should have a unique idea not present in any of the others, and eachshould reference the others to make the connection explicit. Multiple publications that cover virtuallyidentical material are unethical, and can perhaps also be attributed to pressure to build up a certainnumber of publications. Many funding agencies and academic institutions now focus on applicants’best three to five recent papers, and pay less attention to the sheer volume of publications.
Accusations of unethical conductUnethical research practice places one’s entire research career at risk, and also the reputation of one’sinstitution. Such mistakes become known outside the research community, can involve the press oreven civil courts, and thus adversely affect the entire discipline.
When a researcher is accused of unethical behaviour, this can potentially damage not only theindividual(s) concerned but also their institution, students, team members, sponsors, collaborators andclients, as well as journals/proceedings where the work was published, and the person(s) making theaccusation. The process whereby such accusations are handled needs to ensure fair treatment of allthese parties. They should only be informed of the potential problem after a preliminary investigationhas been conducted that indicates that a valid case may indeed exist. The outcome of the preliminaryinvestigation should determine which parties might be affected and should be informed.
During a preliminary investigation the accused has the right to protection and due process (e.g.reviewing the evidence). The identity of the person making the accusation should be confidential,and the accused individuals should be informed in writing before any investigation, even preliminarychecks, are instigated.
Since the impact of misconduct is so great, anyone who becomes aware of such behaviour has a dutyto report it. This can be very difficult, as it is difficult to guarantee anonymity. It is best to discuss theissue with a colleague before putting any accusation in writing – once it is in writing, authorities areobliged to act and to act publicly. Many institutions appoint an official or committee to be in chargeof research ethics, who are the best people to approach.
Institutional responsibilitiesUniversities and other research institutions need to frame codes of conduct for research practice,to safeguard against such situations. These must also provide protection for individuals accused ofunethical conduct, to ensure they are justly able to address such accusations and avoid prejudicialtreatment, with proper procedures set up to deal with complaints. This will also reduce the risk of theinstitution needing to resort to the courts to settle such problems.
An institution where research is undertaken needs to appoint a body to give confidential advice incases of suspected misconduct, and an individual/group to whom formal accusations are submitted.Should the accusation be considered plausible by this group, they take over the responsibility of settingin motion appropriate procedures to handle the allegation and to safeguard the rights of all involved.
If an accusation of unethical conduct is found, after due process, to be invalid then the individualsaccused should be informed immediately and their record should reflect this outcome in a way agreedto by the institution and the individuals, so as to be as satisfactorily dealt with as possible from theviewpoint of those wrongly accused. If an allegation of unethical behaviour is upheld after a fair andthorough investigation, then innocent people who have been affected should be assisted as much aspossible, and financially compensated where appropriate.
Three places to give credit in a publicationIn the world of research, it is crucial to give credit wherever credit is due. In a paper, credit is given inthree places – the list of authors, the acknowledged contributions from others, and the list of references.It is generally accepted that the earlier a name appears in the list of authors, the more prominent the role

Ethics in Research
4
of that person in the research, and equal contributors are listed in alphabetical order. Where people ororganisations have assisted in lesser ways, including acquisition of data or funding, their input shouldbe stated in the acknowledgements section. This includes those paid for their contribution, such astechnical officers and the like. References place a piece of research in context, by relating it to workthat supports the same or alternative views, and acknowledging others’ ideas that have been used ormodified. These citations are important for researchers, as citation counts have a strong influence on,for example, an individual’s access to funding, promotion, or appointment to an academic/researchpost.
Who should be creditedModern research projects have grown in size and complexity, and it is common for large teams towork together, and thus for several authors to be named on a paper. Authorship of papers should bediscussed by a research team early in a project, and reviewed when there are changes to the projectplan, to make sure that the correct people are acknowledged as contributors for each output. If a seniorresearcher has defined and initiated a project in which a junior has subsequently participated, thesenior researcher gets the major credit for their discoveries. At the same time, where a junior makesan important research contribution in their own right, the senior researchers with whom that personworks must recognize them as major contributor in those publications.
Undeserved creditAn author should at least be involved in the conception, design, implementation or analysis of thework presented in the paper, have played a part in writing or revising the article, and have agreed toits publication in that form under their name. Participation by virtue of position alone (as group leaderor supervisor for instance) is not an acceptable reason for naming someone among the authors or apaper; doing so is deliberately misleading others and falsely giving the individual recognition that isundeserved. Yet in some research groups, the leader’s name appears on every paper published by thegroup; and in many departments the supervisor’s name appears on every paper produced by students s/he supervises. Sometimes a person is added to a list of authors when they had little if any involvementwith the work being reported there (but it is politic to include them for extraneous reasons).
When listing their publications in a CV, grant proposal or the like, researchers must make cleardistinctions between submitted, accepted and published works; and between refereed and non-refereedpublications. Similarly, correctly distinguishing between applications and grants is essential whenreferring to current or planned research.
Agreement from authorsWhen the work of a research team is reported, a primary author (sometimes called an “executiveauthor” or “chief author”) must be selected, and given the role of ensuring that the correct authorsare listed, that all authors agree to submitting the final draft under their name, and that all necessaryacknowledgements are included. A letter to this effect should be signed by all authors and kept onfile, to guard against possible future disputes. Some journals require all named authors to sign a formstating that they contributed substantially to the work and are (jointly) accountable for what appearsin the paper. Someone who is willing to take part of the credit for a publication must also be preparedto take responsibility for the mistakes, and should not try to hide behind an excuse that they were notinvolved in the section at fault. If this is indeed the case, a footnote indicating involvement in differentsections should have been included in the paper from the outset.
Ethical conduct for researchersConsideration of possible ethical issues is an essential part of research. Researchers must be aware ofand adhere to sound ethical practice in their work, with respect for honesty and truthfulness, privacyand confidentiality. It is assumed by all institutions conducting research that their staff are aware of

Ethics in Research
5
their responsibility towards the profession and the public to be ethical in their experimentation andreporting. Researchers should only participate in work which they are competent to do; they shouldseek out criticism and debate, should publish and present their work widely, so that the researchcan benefit from scrutiny and elaboration by their peers. Professional bodies like the Association forComputing Machinery and others provide a code of ethics for their members. Most institutions havepolicies governing such conflicts of interest, to protect their integrity and public confidence in theirresearch.
Peer review safeguardsThe process of review and revision that precedes publication is critical in preventing an individual’ssubjectivity from influencing accepted knowledge. It is also a powerful way of ensuring thatresearchers are more thorough and careful in the conduct and presentation of their work. The useof identical or similar techniques to prove conclusions give rise to accepted standards for researchmethods and methodologies.
Until well into the seventeenth century, scientists were reluctant to advertise their findings becauseothers would claim to have had the idea first. Then Henry Oldenburg, secretary of the Royal Society ofLondon, pioneered the practice of peer review and scientific journals – he guaranteed rapid publicationin the society’s Philosophical Transactions, and the support of the society if priority came intoquestion. Irrespective of who discovers a result, idea or technique first, it is the first to publish it whois recognized as its originator, and who gets the credit in all subsequent citations.
Research results and the general publicThe consequences of research are impossible to foresee. Nevertheless, the team has a duty to considerthe possible social implications of their technique/results and to draw the community’s attention tothese if they are cause for concern. One possibility is to arrange a public debate or discussion panel,and to use this to find a consensus view.
Research results should not be disclosed to the public via the media, on the Internet, or at gatheringsbefore they have been accepted by peer review. It is irresponsible to broadcast findings without havingthem screened by some quality-control mechanism. Releasing controversial results in this way risksmisinterpretation and over-reaction to results that may prove incorrect. Where issues of concern makesuch prior notice advisable, the unpublished nature of the results must be clearly reported at the sametime; and appropriate public authorities should be approached rather than the general press. It is onlywhere public authorities fail to react that the media should be informed of such results, and again it isimperative that the unpublished, unvetted nature of the work be indicated at that time.
Data AvailabilityOnce research has been published, scientists are expected to make available their data and resultsfor others to share. Someone who fails to do so should not be trusted or respected. Data used inpublished work should be available for other researchers to use or to discuss. It should also be kept fora suitable period (depending on the project, typically about 5 years) for examination in the event of anycomplaints or accusations following publication. Institutions should provide guidelines on ownershipand access rights to databases, particularly where confidential information is concerned. Researchersare responsible for enforcing security.
Unlike other fields, such as medicine, computer science does not have widely accepted standardsfor recording experiments [Zobel97]. In any science, records should include the purpose of theexperiment, descriptions of the apparatus and any modifications to it before or during the experiment,the date(s) it was conducted, data collected including rough notes, analysis performed and conclusionsdrawn. Records are important because they are the only lasting evidence of the experiment,and because the discipline of maintaining these properly generally introduces greater rigour andreproducibility. Records will vary depending on the type of experiment, e.g. whether human factors

Ethics in Research
6
are being assessed or execution timings. Recording the latter reliably for example requires knowledgeof hardware, operating systems and cache behaviour. Appropriate choice of hardware and softwareplatform, test data sets and system parameters for running such experiments can be critical and mustbe documented. And of course in computer science the program code is typically an essential part ofthe experiment - yet it is often lost, or if it exists then either it is only the final version that was kept,or else several versions exist and it is not known which was used in which experiment. In addition toresearchers' notes, all code versions should be kept, as well as logs or audit trails of outputs (along withcorresponding inputs) [Zobel97]. This is useful to the researcher in any event, e.g. for later writing upthe work for publication or for performing new analyses.
Patents and AgreementsResearch which has the potential to be financially rewarding can be safeguarded through applicationfor patents. This enables the researchers or their institution to profit from the idea while at the sametime introducing it into the public domain. Those doing patentable work can be required to take extrameasures, such as having their notes validated and dated, to ensure that discoveries are timeouslyreported to the patent official of the institution sponsoring the work. Where research sponsored byindustry or the military cannot be publicly disclosed at all, summaries may be publishable and if soshould be scrutinized in privacy by visiting committees.
Where research is conducted in collaboration with an external body, agreements regarding intellectualproperty rights, confidentiality and any limitations on publication need to be made at the outset, andendorsed by the researcher, their university/institution, the external groups and funders.
Ethics in observationsIf participants in an experiment are being observed by others, they should be informed about thisbeforehand. In most cases, any reticence this causes falls away once the subject becomes immersedin the task at hand. The Internet has given rise to a new form of hidden observation. There is nowan increasing number of systems that log Internet activities such as user interactions, site navigation,chatroom and bulletin board conversations, etc. Individuals can be unaware that this informationis being collected, which raises new problems regarding confidentiality and privacy. Such systemsshould notify users of the logging in advance, just as in other user studies.
ConfidentialitySince much of research involves gathering information, it is important that this activity respects theprivacy of individuals. Anonymity should be assured wherever possible; i.e. no data collected that canidentify individuals; however this can be impractical e.g. where studies involve tracking individualsover time. Data collected about people should never be disclosed without their prior consent. Theidentity of an individual should also not be deducible from reports (e.g. by referring to a personalcharacteristic that is unique in the sample).
Contracts in experimentationThe principle of informed consent ensures that participants understand in advance what proceduresthey will be involved in. Participants should be guaranteed that they will not be physically orpsychologically harmed. By the principle of voluntary participation, people should not be forced intoparticipating in research experiments, as is sometimes the case with “captive audiences” at educationalinstitutions, prisons and the like.
Ethical research requires being clear about the agreement between researcher and participant, andthen adhering to this. Contracts are useful in clarifying this and in obtaining proper consent fromparticipants in surveys, interviews, experiments and case studies, and from those providing you withdata of any kind. It is best to ensure that people participating in a research experiment first signa consent form which states the purpose of the project, the tasks they will be performing and the

Ethics in Research
7
confidentiality/anonymity guaranteed. Adding that a subject can withdraw from the experiment at anytime is also advisable.

1
Chapter 3. Conducting a literaturereview
Table of ContentsWhat is a literature review? ............................................................................................ 1Outline of the literature review process ............................................................................. 1Where to start a literature review ..................................................................................... 2Citations ...................................................................................................................... 2Literature searches on the Internet ................................................................................... 3Reading throughout research ........................................................................................... 3Reading Efficiently ....................................................................................................... 4Making notes on your reading ......................................................................................... 4Structure of a literature review ........................................................................................ 5How to critique a paper ................................................................................................. 6Writing the literature review ........................................................................................... 6
What is a literature review?A literature review summarises and evaluates published material in a subject in order to present currentknowledge in a coherent and understandable way. Its purpose is to provide an integrated, organizedoverview of significant literature published on a topic. A literature review can be an end in itself, or apreface to primary research, or a requisite part of a research or grant proposal, or a chapter in a thesis.If it is a first step in achieving some other research goal, this research must be guided to a large extentby what you find in the literature survey – viz. what problem to tackle, how to tackle it, and how topublish your findings. A literature review is not just a description of existing work in some field – itis defined by the guiding concept of your research objective.
A literature review makes a contribution to the discipline by synthesizing existing knowledge intoa framework against which a piece of research can be evaluated. It is a self-contained work, andfacilitates finding out more about the ideas and results it describes by providing a good list of referencesto the sources from which it was compiled.
Outline of the literature review processReviewing the literature in a topic requires three skills: information gathering, critical appraisal andcoherent writing. The first is the ability to scan the literature efficiently, read documents effectivelyand record relevant material; the second is the ability to analyse studies to discover precisely what theycontribute to our understanding of a subject while also being able to detect bias, flaws and limitationswhere these exist. The third skill requires creativity in finding a framework and structure for theknowledge acquired, and the ability to present this in a clear, logical way.
A literature review requires finding some starting point(s), reading and noting what you find, andchanging your list of things to read accordingly – repeating this process until you conclude that youhave covered what is currently available. You then need to find an appropriate way of presenting theinformation you have gathered, and write the review in your own words, with references to the articlesand texts you have read. Of course a literature review can never be complete, because new knowledgeis continually being published. Therefore it is important to keep abreast of the field even after youmove on to the subsequent steps in your research project, and to continue looking for, reading andnoting new ideas as they appear in the literature. To keep reading throughout your career is particularlyvital in a field such as IT which changes so rapidly. Keep up with the latest issues of the key journalsin your field as they arrive, and remember that Computer Science conferences are an excellent wayof tracking what others are doing. In cases where new results appear after you needed them in your
Conducting a literature review
2
own work, it is helpful to note the date they became available and what stage you had then reachedin your research.
Where to start a literature reviewThe best way to start any literature survey is to ask those actively doing research in the field, andalso to ask a librarian. They can advise you which are the best sources to use and how to search themeffectively.
If your research concerns a particular product, process or existing study, then that will clearly giveyou a starting point; without this, finding some good initial references can be time-consuming andfrustrating. Bibliographic databases, CDs of journal abstracts, citation indexes, textbooks, journals andthe Internet can lead you to many initial references. Appropriate search terms are needed to uncoverthe most suitable ones. Write down a list of key words and phrases describing what you are lookingfor, and include synonyms, alternative names and word variations. If your area of interest is broad orunclear, it is helpful to look over recent copies of journals in that field (e.g. ACM Transactions on ) toget a better idea of what you are wanting and which search terms are most likely to lead to this. If youfind references which appear promising but cannot be found in your library or on the Internet, contactthe authors personally as well as their institutions, and try an inter-library loans service. You will besurprised how an email request for a paper can not just lead to a convenient electronic copy being sentto you, but also result in a valuable contact who will give you good insight and advice on the problemyou are researching. Of course, if the author in question is a well-known expert in the field, such arelationship is far less likely – nonetheless, even experts will generally send you a paper by email.
If you are unfamiliar with the subject area, don’t begin with bibliographic databases and researcharticles, as such papers have a narrow focus. You must first obtain a good background in the subject;it will help you to conduct a better search as well as ensuring that you understand the material youread better than you otherwise would have. This can be done by using secondary sources, namelyhandbooks, textbooks, review articles and encyclopedias. Secondary sources summarise and integrateinformation on a subject, drawing from primary sources already published; often they also givebibliographies as well as references to major papers in the field.
Many researchers advocate using a pack of index cards (3” x 5”) to control their search, (and othersuse a database package). The top card contains the Main Research Question you are addressing. Thisquestion will keep changing as your search proceeds, and you may well need to clip together severalsuch cards due to many changes (keep them, do not discard old versions). The remaining cards areheaded Main Topic – each has one major topic to be addressed, and you should produce as manyas you can think of. Keep these in alphabetical order. Start searching for the first topic in catalogs,journals, CDs, bibliographic databases, the Internet etc. When you find relevant documents, look atthe subjects associated with them and use these to expand or contract your search. Annotate your indexcards with comments such as “nothing!” or “too much”.
Explicitly-related literature is directly related to your topic; implicitly-related material is not, butconcerns work that might be applicable to your study. If you use the latter in order to produce aliterature review, you will have to be creative in tying together seemingly disparate pieces of workand relating them to your research problem. If you cannot find enough explicitly-related work andfind yourself settling for implicitly-related papers, you should probably change your research goal.Fortunately, searching such implicitly-related work often gives you good ideas as to what you mighttackle instead –starting with a good background in the area. Moreover, concrete examples of similarwork show what research methods are typically used and how results are presented for publicationin that field.
CitationsWhen paper B references paper A, this is called a citation of A by B. While the number of referencesthat a paper like B makes is finite, easy to determine and does not change, the number of citationsof a paper like A is continually growing, potentially infinite, and difficult to ascertain. The number
Conducting a literature review
3
of citations that an article has is an excellent indicator of its importance. The number of citations tospecific journals, conference proceedings or monographs also has a strong influence on the number oflibraries that stock it. Citation indexes like the Science Citation Index show the patterns of citationsinto and out of journals. Online citation indexes include Citebase (the Open Citations Project) [http://citebase.eprints.org]. When you are conducting a literature search, use a citation index to see howsignificant a work is and how long-lasting its influence; when you are publishing, use a citationindex to see how important the journal is. In addition, many countries like South Africa have ratingsystems for journals based on their citations, and these are a good way of easily discovering the impactand importance of the different journals in your field. A study of citation indexes shows that papersgenerally cite papers of similar impact, and that very few papers receive a large number of citations– these are key papers which no literature survey should miss.
Literature searches on the InternetStart with a well-known search engine such as Google or yahoo, or a well-known bibliographicdatabase, and compile an appropriate Boolean expression involving search terms you are interested inand those you are not interested in. If you are unsuccessful and receive too many or too few results, youwill need to change your search terms and expression, and possibly also the search-engine or databaseyou are using. Ask your librarians for help with search terms and expressions.
There is an increasing number of on-line journals. Thousands of articles, abstracts, reviews, books,theses, etc. are available electronically on the Web – so you should keep your initial search as narrowas possible.
Some helpful Computer Science websites are the CiteSeer citation index [http://citeseer.nj.nec.com/cs], which has electronic copies of the vast majority of publications, bibliographies such as that athttp://liinwww.ira.uka.de/bibliography/index.html, online contents pages of journals such as those ofthe IEEE Computer Society [http://www.computer.org/publications/dlib], technical report libraries(e.g. the Networked Computer Science Technical Reference Library [http://www.ncstrl.org]), digitallibraries available at your institution (e.g. the ACM Digital Library at UCT), as well as the websitesof relevant Computer Science departments and individuals.
Reading throughout researchThe basis of good research is finding and reading good related work. One of your most importantsecondary research goals is to produce a bibliography and review of the topic you are studying. Butto keep reading after this is fundamental to success as a researcher, especially in computing wheremany advances are continually occurring.
Even if you need to study a paper thoroughly, it is helpful to first skim the entire article to get anoverview on which you can “hang” sections when you subsequently read them more carefully thesecond time. Many people find it easier to make notes as they read, but be careful of writing so muchdetail that your reading takes too long.
Some articles in Computer Science are very hard to read. It can help to read them with your supervisor,research group, or others in your department who are interested in the same piece of work. It willbe much slower but will be enormously helpful in raising everyone’s understanding. Larger researchgroups typically find regular get-togethers to discuss papers very beneficial, not only because itfacilitates keeping up with the literature but also because the group will usually look more creativelyat questions raised by a paper than would a single individual.
Giving feedback to others is also an important ingredient of research. It sharpens your critical thinkingskills, enhances your confidence and exposure, and increases the likelihood of others giving youfeedback in turn. In addition to active involvement at research group meetings, conference talks andseminars, it is very helpful to volunteer to review papers for a journal or conference programmecommittee. If you are too inexperienced to do so personally, you should tell reviewers in yourdepartment that you are keen to help them. A written review or critique should be structured,preferably from high-level comments down to lowest-level “nit-picking” criticisms relating to e.g.
Conducting a literature review
4
grammatical and typographical errors (and of course “nit-picking” should be avoided altogether unlessthe paper will be considered for publication). High-level comments give one’s overall impression ofthe paper, suggest improved organization and presentation of the content, mention related work thathas been omitted, and ask questions about alternative approaches, additional supporting evidence,future extensions and the like. To be constructive, try wherever possible to suggest an improvementrather than simply state what does not work.
Reading EfficientlyNaturally it is impossible to read all the relevant background material for your project, in all pertinentbooks, journals, websites, etc. The key is selectivity, not only in choosing your sources but also in howmuch of each you read. At the start of your literature search, you are likely to come across a mix ofhighly relevant, less relevant and irrelevant information. At this stage it is best to read papers quickly toget an overall picture and an idea of how your specific interest fits this. Decide whether it is worthwhilereading the entire document, and if so in how much detail to study it. As your search progresses, youwill find yourself considering few texts that are not truly relevant, but it is still worthwhile using thesame approach.
Can you take a book relevant to your research that you have not read before, read it in 5 minutes, andhave notes covering what you want from it at the end of that time? This requires practice, focus anddiscipline. A technique used by many researchers is to skim the material, looking mainly at headingsand figures, and to use this quick preview to think of questions the text is likely to answer for you -then look for those answers. Another common approach is to look at the table of contents to identifywhich chapters or sections are useful. Read the introduction and conclusion of these chapters, thenlook for sub-headings indicating relevant parts and for key points highlighted in the text itself. Thefirst and last paragraphs of a section generally encapsulate the points that section is covering. If thereare specific systems, people, keywords etc. of interest, look for them in the index. The references areanother way of discovering very quickly what the paper or chapter is about. After the first few minutesyou will have an idea whether the book (or paper) requires more detailed reading, and of which parts.In the case of a book you should rarely be reading more than a quarter of its contents.
Making notes on your readingHaving read a seemingly relevant paper, ask yourself whether or not you should be skeptical of itsclaims. Not all papers are equally sound – the status of the source (e.g. refereed journal through tounknown web site) and of the authors (ranging from guru in the field to completely unknown) givesyou an initial idea of how cautious you should be. The article itself should be read critically, ratherthan accepting at face value what authors profess to have discovered.
When you read a document, ask yourself questions, such as:
• What is the contribution of this work to the field and how does it compare with and relate to papersyou have already read?
• What references does it cite?
• What useful examples does it contain?
• What can I learn about writing from this paper – is it easy or hard to read and why?
• What techniques and research methods have been applied by the authors?
• What is the author’s thesis, i.e. what is s/he trying to convince you of?
• How does the author go about convincing you of this?
• Does the author succeed in convincing you?
• Does the paper explain how the work differs from other work in the field? If not, can you do so?

Conducting a literature review
5
• Does the author suggest future work to follow on what has been reported? What new ideas aregenerated by the research described?
• Does the paper raise any questions in your mind that it does not answer, e.g. relating to potentialproblems with their idea or the ability to apply it in a different context or the possibility ofgeneralizing the results?
Make notes of interesting answers. Summarise the main ideas and the approach taken. If the paperpresents a new way of doing things or a new way of thinking about something, note and describethis too.
Notes help considerably if you return to re-read the paper later or when you come to include it inyour literature review. Whereas note-taking delays reading and can seem tedious, remember that it isextremely difficult to do this well, so see it as a challenge and watch yourself improve with experience.
The amount of notes you make should be tailored according to the degree of relevance of the specificpiece. You should also note any potentially useful research or presentation techniques, which youmight adopt yourself. Use the article to improve your literature search itself, by altering your searchterms and making a note of new references they contain (and why they might be useful to you). Takenote too of references to documents you have encountered before, since the more frequently you comeacross references to the same paper, the more important it is to read it. If your reading raises a questionto which you are unable to find an answer in the literature or in your department, it is worthwhilecontacting the author(s) by email with a clear, concise question phrased in such a way that it can beanswered in a single sentence. Once again, such email contact can result in a great deal of help; inother cases, even busy researchers often find the time to send you a reference where the answer toyour question can be found.
With each good article that you read, you need to keep a complete reference to it for your bibliographyand to make notes in your own words of its content and how it might relate to your own work. It isadvisable to use bibtex to keep an electronic copy of your reference list, this is convenient for yourfuture writing and also for sharing your bibliography with others. Many people add extra fields to theirbibtex entries, such as keywords, or where they obtained the paper.
Structure of a literature reviewA good review organizes material well and includes critical thought. It typically has the followingstructure: the introduction describes the problem area and its significance, the author’s reason for doingthe review, and the organization of the review document. This is followed by a background sectionexplaining any underlying principles, explaining criteria used to categorise, analyse and compare theworks, and also defining and justifying the scope of the review. Your findings are then presented– first, a description of current knowledge, starting with general aspects and gradually focusing onspecific research hypotheses, purposes or questions.
It is usually helpful to divide the material into categories, and to explain how each work differs fromothers in its category. Authors of academic texts often create new taxonomies to describe their researchfindings, but this is often embedded deeply within the document, and inexperienced readers may not beable to “stand back” sufficiently from the content to see the organization of knowledge. The author of aliterature review frequently creates his/her own taxonomy of the topic, based on historical developmentor similarities of approach and so on. In your review you should introduce this taxonomy first, andthen for each category in turn explain what it is and why it is important, before describing works inthat category and showing how they fit into this category.
Conclude with a brief summary (keep it at two or three sentences), an indication of any trends,conflicts or themes detected, and preferably some conclusion reached – such as a statement of gapsidentified or issues yet to be adequately addressed (ideally this in turn establishes the need for theresearch undertaken). Make sure that your summary is an accurate summary of what you have actuallypresented in the review. It should summarise major contributions of significant works and maintainthe focus established in the introduction.

Conducting a literature review
6
The review should read as an essay rather than a list of paper summaries, and focus on the findingsand contributions of the works reviewed. Most initial drafts comprise a sequence of text summaries,particularly as the writer may have insufficient confidence at this stage to include his/her own opinionsand knowledge. Start to improve on this in subsequent drafts by linking these summaries – e.g.comparing their differences or highlighting their similarities or simply indicating their relationship toeach other. Later, when you are sufficiently familiar with the field and have done some work in thearea yourself, add your own understanding and evaluation of the material. The value of a review ishow it places each work in context and relates it to other work. Where applicable, it should resolveconflicts among seemingly contradictory studies and point the way forward for further research. In theend, your review should be a description of your understanding of the topic, supported by informationgleaned in the papers you have read.
If you are producing an annotated bibliography, you will need to briefly summarise each item, butshould still follow themes and do some critical assessment of the works. Group the items into sections,with a paragraph introducing each section, and use this to assist in comparing and relating works inthe same section.
How to critique a paperTo critically analyse the literature you review, follow through a set of concepts and questions,comparing works to each other according to how they deal with these concepts and questions;and evaluate the papers you describe, discussing their strengths and weaknesses. To do so, ask thefollowing questions about the documents you include: has the author clearly formulated a problem/issue and established its significance? Has the author evaluated the literature relevant to this problem/issue? How reliable and valid are the measurement and conclusions? How does it contribute to ourunderstanding of the topic and how can it be useful in practice? Does it have any limitations and couldit have been approached more effectively in a different way ? How does it relate to my own researchgoal?
To assess a paper, you need to know what research question or goal it is addressing, what methodswere used to do so, and what results it claims. Look at the evidence or support on which these claimsare based and evaluate their soundness and completeness. Are the claims reasonable? Were the testcases all merely “toy” examples? Are significant aspects missing from the paper? Also consider howthe work fits in with other work in the field, and what follow up steps are suggested. To understanda paper properly, you need to fully understand the problem, the alternatives possible and the choicesmade, the assumptions behind the solution selected and whether these are reasonable, the conclusionsand their justification, and the potential for extending or scaling the solution.
In evaluating each document, ask yourself if the author’s arguments are supported by evidence such ascase studies or statistics, if relevant information has been ignored in order to prove the author’s point,if the work contributes in any significant way to our understanding of the topic. Criticism should bebalanced and justified, set forth for the sake of improved systems or understanding. Any aspect ofexisting work can be criticized – assumptions, arguments, methodologies, results, interpretation. Tochallenge an argument, one can challenge one of its premises, or challenge the fact that the premisestogether imply the conclusion. Examples can be challenged if they are not representative of the claimbeing made; the context, constraints or exceptions to a premise can be used to refute or weaken anargument; the implication that the claim follows the premises can be disputed by means of a counter-example; and so on.
Writing the literature reviewIt is helpful to read other literature reviews before commencing your own, to see how they organizematerial and manage the transition from one topic to the next. Once you have completed your review,ask as many friends and colleagues as possible to read it; their comments will help improve the reviewby indicating what is unclear or difficult to follow.
Avoid detailed descriptions (after all, the original paper is available to the reader of your review). Ingeneral the amount of space devoted to a single work should be proportional to its significance in the

Conducting a literature review
7
field. Limit the number of direct quotations, as these are often too detailed and seldom unaffected bybeing read out of (their original) context. Too many quotations means a variety of writing styles isbeing used, which is disconcerting for the reader and also raises the question of whether the authorsof the review have in fact failed to understand the concept sufficiently well to explain it in their ownwords.
Reporting verbs are used when talking about texts Thompson and Ye (1991) distinguish betweenthose denoting what the author has done (positive examples: points out, emphasizes, notes, subscribesto; negative examples: questions, attacks, dismisses, disputes, opposes, questions, rejects) from thosedenoting the review writer’s stance (factive examples: acknowledges, demonstrates, proves, throwslight on, identifies; counter-factive examples: confuses, ignores, disregards, neglects); non-factiveexamples: believes, claims, proposes, uses). Factive verbs are used where the review writer believesthe author to be correct; counter-factive verbs are used where the author is considered incorrect; non-factive express no opinion on the author’s accuracy or inaccuracy.
For a discussion on writing style and technique, see the chapter on Writing later in the course.

1
Chapter 4. Finding a researchquestion/goal
Table of ContentsThree main types of research .......................................................................................... 1Types of IT research product .......................................................................................... 1Finding a research problem ............................................................................................. 2Questions to ask yourself ............................................................................................... 2Technique-driven research .............................................................................................. 2Following on from an existing paper ................................................................................ 3Discovering it has already been done ............................................................................... 3Document all possibilities ............................................................................................... 3Know the field ............................................................................................................. 4Consult others .............................................................................................................. 4Look inwards ............................................................................................................... 4Narrow your focus ........................................................................................................ 4Phrase your goal as a question ........................................................................................ 5Establish how you will evaluate your work ........................................................................ 5Conduct an Initial study ................................................................................................. 5Research question checklist ............................................................................................ 5
Three main types of researchThere are 3 main kinds of research:
• Integrating existing knowledge into a coherent body of knowledge — here your contribution istwofold: to be comprehensive, and to present the wealth of facts in a comprehensible manner
• Solving a problem for which no known solution exists — here originality is required, and ideallyalso simplicity and generality
• Looking at existing solutions or methods in a new way to improve upon them — here your newapproach should bring benefits like making the solution/method simpler, more effective or morewidely applicable.
Types of IT research productThe outcome of IT research is generally one of the following:
• the definition of a problem
• development of a new theory, solution, model, technique, architecture or system
• improving an existing theory, solution, model, technique, architecture or system
• development of a component, aspect or part of a problem solution or task
• measurement of some properties of a solution (part) e.g. time or space requirements, usability, etc.
• identification of problems and limitations of an existing solution (part)
• a demonstration that one solution (part) is better than an alternative
• identification of factors influencing cost, performance or applicability of a solution (part)

Finding a research question/goal
2
• the demonstration of a tradeoff in the solution space
• analysis of a tradeoff
• a generative, explanatory theory for some problem (part)
• a demonstration of how an existing approach or technique can be used in a new context where itsapplication is not obvious
• description and analysis of a case study that places new demands on an existing approach ortechnique.
When choosing a goal for your research, remember to consider all these possibilities within your fieldof interest.
Finding a research problemMost research is not fundamentally original, but is original in some aspect such as topic, approach,presentation, extension, result, or application area. If the area you wish to work in is relatively new, itis often easier to make a research contribution by tackling one of many problems not yet adequatelyaddressed; while a well-established field requires expert guidance in order to ensure that one studiessuitable aspects.
Look for something that interests you and the research community, and any supervisor or collaboratorsyou hope to work with. If your topic does not really interest you, you will make your research taskmuch harder and slower, because you will not enjoy the work. It will be much harder to be creativeand passionate about it, not only during the problem solving stage but also when writing it up so asto interest and excite others.
If you are unfamiliar with the subject area, don't begin with bibliographic databases and researcharticles, as such papers have a narrow focus. You must first obtain a good background in the subject;it will help you to conduct a better search as well as ensuring that you understand the material youread better than you otherwise would have. This can be done by using secondary sources, namelyhandbooks, textbooks, review articles and encyclopedias. Secondary sources summarise and integrateinformation on a subject, drawing from primary sources already published; often they also givebibliographies as well as references to major papers in the field.
Questions to ask yourselfTo help you choose a research topic, ask yourself:
• What research skills you are best at and what type of research
• requires these? What outcome is most important to you to improve problems in society? To bringcomputing to new kinds of user? To make money? To master some specific application context?
• What application areas out there do you consider messy?
• What new technologies do you know of that could drive change? What new problems could theyraise? How do they affect known problems or tradeoffs? How might they affect another field whichinterests you?
• What kinds of new users are there? What kinds of tasks do they require?
Technique-driven researchFinding an original problem solution is a daunting task. In applied research, the particular setup forwhich a solution is required may be so specific that no-one has tackled that particular problem before.

Finding a research question/goal
3
Other research projects finesse this problem by starting with a specific technique and studying this ina new and challenging application domain. The majority of Computer Science research is technique-driven , i.e. a technique is applied in a new way or to a new application area, rather than problem-or goal-driven. The former type of research involves learning one technique, whereas problem-drivenresearch requires familiarizing oneself with many techniques.
Breakthroughs in one problem area can be considered as solutions to similar problems in otherareas (e.g. using AI techniques in the database field, etc.) When major breakthroughs (e.g. object-orientation) occur, these can provide alternatives for a great many problems, with potentially veryuseful research results. Such research requires thorough knowledge of both the new idea and the newproblem area, and then being creative in applying the former in the new context. For example, if a newdatabase paradigm were developed, it would need to be studied from the viewpoints of data definitionand manipulation languages, query optimization mechanisms, efficient storage and access structures,suitable data models, transactions and concurrency control protocols, distribution, etc.
Following on from an existing paperAs the research lifecycle demonstrates, many advances stem from contradiction of existing ideasand practices. Having conducted a literature review of a topic, it is worthwhile considering whetherany aspects appear incorrect, flawed or incomplete; this may provide a good research project. Someexamples where current work underlies a research contribution are:
• An error is identified and a new result drawn from existing data/experiments
• A taxonomy has incorrectly placed certain systems/models/techniques in the wrong category, andan improved classification is proposed
• A new way of looking at an existing system or problem is suggested
• New data or a new context is discovered which refines or replaces current thinking
• The Future Work section raises a question that interests you
Discovering it has already been doneIt can happen that during the course of your research you come across a paper that has already achievedthe exact research goal you had in mind. If it is a case study or applied research and your case study orenvironment differs from that in the paper, then you can proceed happily, and do your best to follow theapproach used by those authors (unless you have reasons to believe this was inadequate). Otherwise,you can consider modifying your research goal slightly so that your work will differ sufficiently fromthe study you have just located without throwing you too far off your original plan. Or you can considerwhether the existing research you have just discovered has any serious flaw, and change your studyto focus on correcting this.
Document all possibilitiesOne of the hardest aspects of being a researcher is choosing a suitable project. In the beginning, seehow many potential research projects you can brainstorm, and do not eliminate any even if you doubttheir feasibility. Write each down so that it isn't forgotten and so that you have a full record of yourideas, rather than keeping just a few continuously changing ideas in your mind. This will also remindyou that you are making progress at a time when you most need such reassurance. Group the ideasinto sets of similar questions and finally select a question or group that is most appealing in terms ofchallenge and feasibility.
Remember one of the joys of research is that you can do what you choose, according to what interestsyou, so beware of others' influence over you and don't be too easily swayed.
Finding a research question/goal
4
If you cannot find anything completely satisfactory, start with the best idea you have and see where itleads you — actually tackling a problem or prototype system can lead you to appreciate more fully theimportance and the challenge inherent in a research question which might otherwise seem unexciting.
Know the fieldBefore you can make any start on research at all, is it essential to become familiar with the literaturein the subject. Read the key works, look at recent copies of the key journals in the field, and if youlike what you see then continue and do a literature review. Draw a mindmap or concept map of thesubject, and see if this suggests new linkages or areas to explore. Reading academic journals or evenarticles in the popular press dealing with the topic can sometimes raise doubts in your mind or sparkoff related ideas which you can investigate.
Consult othersAsk someone — supervisors, colleagues or even friends can suggest or lead you to a suitable topic ifyou discuss your dilemma with them. Find out what others in the department are doing and whetherthere are aspects or parts they would like you to tackle (and the collaboration they envisage, if any).Look at previous examples of research projects in the same field, to have an idea of scope, process,presentation and quality (ask senior researchers which examples are considered to be the best, andstudy them to understand why this is so)
Look inwardsSome factors influencing one's choice of topic are purely pragmatic — the availability of funding, asupervisor, equipment, software and other resources. It is also inadvisable to select a field where youdo not have adequate background knowledge in the subjects underpinning the area.
It is important to choose a topic you will enjoy — both the problem area and the research methods youwill need to use should appeal to you. Which skills do you particularly want to develop or improve?What are your personal strengths and weaknesses? What do you find appealing or daunting - workingwith people? statistics? theory? complex systems? If you have an outside interest, consider this as apotentially novel context, application area, case study or problem source. You will enjoy working onyour project more, and can use your knowledge of that environment to find special challenges peculiarto that context.
Think about building on your own recent activities, whether this be previous research projects, priorreading, earlier systems or architectures you designed or built, interesting problems encountered atwork or at home, advanced computing courses you enjoyed, etc. Use your own experience to find anovel perspective on a known problem (for example, if you are studying at a foreign university, youcan consider your home country, its languages and its culture, and any special challenges they present).
Narrow your focusBroadly speaking, one needs to choose a topic or subject area, narrow it down to a particular problemor aspect of interest, decide on one or more research questions or goals, and ensure that the questionor goal is sufficiently interesting and significant for you to spend time tackling it and for others tospend time reading about your results. Each of these steps requires a great deal of reading, thinkingand writing.
The amount of literature directly relevant to your topic is a good indicator of whether it is too broador too narrow. Narrow down an area of interest by considering specific (types of) systems, aspects,application areas, user communities, case studies, sub-problems satisfying particular constraints, etc.One way to limit the scope of your work is to consider the major components of the system/problem,and examine the environment it resides in, and then decide which components or links to concentrateon. Alternatively, find similar systems/problems and choose some difference(s) to explore, or considerthe various properties of the system/problem and choose one to study.

Finding a research question/goal
5
Having chosen a question or goal, it should not be researched and tackled without bearing in mindthe framework of existing knowledge into which it must fit. Too narrow a focus, in one's reading andone's work, indicates a lack of balance and an inadequate appreciation of the contribution one wishesto make.
Phrase your goal as a questionOnce you decide on a research goal, to focus on a worthwhile contribution to knowledge in your topic,it is best to formulate one or more questions to answer. If you simply analyse what exists, build ordesign something new, it is not clear what can be learnt from the study or why it is important. Byphrasing your research goal as a question, you focus on what you want to understand, solve or test,and have a far better chance of discovering something significant that others can learn from, use andbuild upon.
Setting one research question is best, but two or three is also acceptable. Do not try to answer fouror more questions in one project. Writing your goal as a question often makes the research methodsrequired reasonably clear. It forces you to be clear and specific, and express the problem in a way thatits solution can be confirmed and evaluated. You can be more formal later and express the questionas a hypothesis you wish to prove or disprove.
After you have decided what you want to study (your topic) and written down what is not known aboutit (your research question), the next step three is deciding what you want to understand and use whenyou find out the answer (your motivation). This 3-step process is not very different from what happensin industry and government, where success also depends on finding a problem, developing a solution,and then showing how others can benefit from what you have found.
Pro forma plans for research projects are also especially useful. These comprise two sentences. Thefirst is the requirement, goal or question the project addresses. The second is a statement of the expectedoutcome of the research.
Establish how you will evaluate your workIf one is unable to evaluate a research product, one cannot know if the research has succeeded inmeeting its goal, and one certainly cannot convince others of this. Defining suitable evaluation criteriacan be an important part of the research, and in the early phases of the research life cycle is in fact partof the problem definition (while in later phases, new criteria are identified). In addition to evaluatingcompleted research, these criteria can be used earlier on to guide the research through feedback fromtests and experiments. Experimental research requires evaluation criteria that are easy to measure,reliable (repeatable), valid (i.e. measuring the right thing) and convincing — e.g. CPU time, percentageof correct answers, etc.
Conduct an Initial studySince choosing a topic involves thinking about the time it is likely to require, one needs to have someproject plan from the very beginning when an idea is first mooted. Even when you are still decidingon a topic, you can already draw up a timetable to have an idea of what your secondary goals would beand how much time they are likely to need. It can sometimes be helpful to conduct a short preliminaryinvestigation to make sure you are happy with your choice of research question before you invest toomuch time into solving it. This could involve building a very small prototype, or conducting an initialexperiment, to get a feel of what this research will involve and how much you enjoy doing it. Whenyou are confident that you have made a good choice for you and have a reasonable idea what you willbe undertaking, then you can move on to the next stage of writing a formal research proposal.
Research question checklistHaving chosen a research topic, confirm that it meets the following checklist of criteria:
Finding a research question/goal
6
• It does not aim too high. The process of research can be as important as the goal, so do not aimfor a major breakthrough or for studying and problem/task that will require more time than youcan afford.
• It does not aim too low. Ensure that the question or goal is sufficiently interesting and significantfor you to spend time tackling it and for others to spend time reading about your results. Check itssignificance by writing down in one sentence why you are asking that question and what you expectto understand once you have the answer.
• It meets expectations/regulations. If you are doing a thesis, researching for an employer orconsulting company, being funded by an organization, or planning to publish in a particular journal,check their expectations — both written ones and unwritten ones (which you can only discover bytalking to others in similar circumstances).
• Resource requirements are in line with what will be available. Compare the time and resources youhave, or are likely to acquire, against what the topic is likely to need. The difference can indicatea change in topic/focus. Alternatively, if the discrepancy is relatively small, time for raising extraresources must be planned into the start of the project.
• There is sufficient expertise you can tap into for feedback. Find out if there is sufficient local know-how and research activity, and consider the likelihood of finding collaborators locally and furtherafield.
• It is not governed by your place of work. If you choose an application area relevant to your employer,or a project instigated by your employer, think carefully about the likelihood of your changing jobbefore the research is completed.
1
Chapter 5. Project Management
Table of ContentsWhat is a project plan? .................................................................................................. 1What goes into a project plan? ........................................................................................ 1The Network Plan planning method ................................................................................. 2Devising the network ..................................................................................................... 3Adding time ................................................................................................................. 3The critical path ........................................................................................................... 3The Workpackage planning method. ................................................................................. 4Using the Workpackage plan .......................................................................................... 5Project Scheduling ........................................................................................................ 6Auditing the Time Schedule ........................................................................................... 6Advantages of planning ................................................................................................. 7Project Control ............................................................................................................. 7The Workpackage Variance Report .................................................................................. 7Variance Analysis ......................................................................................................... 8
Negative variances ................................................................................................ 9Positive variances ................................................................................................. 9A mixture of variances .......................................................................................... 9
Progress Control ........................................................................................................... 9Conclusion ................................................................................................................. 10
What is a project plan?In time, researchers learn how to manage themselves, how to work under the management of another,and how to manage others. Management encompasses planning, organization and control. We startby considering project planning techniques. A plan is a summary of how one intends to carry outa particular task. A plan is a formal statement of the nature of future events and activities and howthey are to be carried out to achieve specific goals. A project plan, therefore, includes answers to thefollowing three fundamental questions:
1. What is going to be done? A statement of the final goal of the project and a series of well definedintermediate tasks needed to achieve that goal. Each of these intermediate tasks should providesome tangible output or deliverable
2. When is it going to be done? The completion date of each intermediate task, including thecompletion date of the final project.
3. Who is going to do it? The need for human resources as a function of time, including the possibleneed for resources available from outside the organisation or from other departments within theorganization.
What goes into a project plan?The skeleton of your plan is derived from the research methods you choose for your project. Forexample, if you are doing a case study, you will need to include the following stages:
1. Literature review
2. Selection of one or more groups to study (i.e. choice of environment, people, task)
3. Case study design

Project Management
2
4. Questionnaire and interview design
5. Pilot study
6. Design refinement
7. Case study execution: observation and survey
8. Information analysis
9. Writing up results
This skeleton should then be fleshed out to be as detailed and specific as possible, and documented asclearly as possible, using charts like those described below. In addition to activities, make sure you areaware of the appropriate programming tools that can reduce your work, and plan which software to use.Plan collaboration with others, work out the roles of team members and plan regular meetings (or otherforms of contact, in the case of remote partners). Decide which resources you will use for managingdistributed projects, such as coding standards and version control systems. Ensure that resources areavailable when needed. Research resources can take many forms - finance, equipment, software,literature sources, data sources, research/laboratory assistants, experts/consultants, documents, testers,and so forth. A research plan should be annotated with resource needs, and acquisition of resourcesincluded in the schedule where a need is manifested.In order to control a project, account has to bekept, not only of financial expenditure, but also of time spent. This implies that every person involvedin the project keeps a personal time record, something which the majority of people abhor and someprofessional persons do as a rule. Without such a record of time spent on the project by each individual,it is impossible to exercise control.
The Network Plan planning methodThe Network Plan approach to project planning interprets a project plan as consisting of a collectionof events interconnected by activities. The term event" is used to merely indicate the startingand terminating points for one or more activities or a block of activities. The various events areinterconnected to form a graphic project Network Plan.
The logical interconnections between activities, or events, express technical, organisational and otherconditions. For example, before starting an activity or block of activities, certain other activities haveto be completed, certain activities or sequence of activities can be executed in parallel, and so on.There are occasions when the completion of an activity must coincide with or precede the start of anactivity in a parallel branch of activities. This dependency is indicated by a broken arrow, indicatingan activity which requires no time.
An example of a Network Plan, with events identified by 3-digit numbers and activities labelled withexpected number of person-hours, can be seen below.
Figure 5.1. An example Network Plan
Project Management
3
Software packages exist for building and analyzing Network Plans. The features offered differ slightlyacross tools, and also differ slightly from those discussed here.
Devising the networkThere is seldom a single completely natural way in which to partition the work into constituentactivities, and in which to connect them. The knowledge about an activity is never complete until thework has been done. Rather than use this as an excuse to avoid planning, a conscious decision has tobe made on what activities leading to which events have to be performed, which of the activities areindependent and can thus be executed in parallel, and in which sequence to perform the activities.
If several levels of the network chart are necessary, an event on the network chart at level i will expandto a network chart at level i+1. This is a natural process, the amount of detail increasing from the lowerlevels upwards. Developing a project plan is often a trial--and--error, iterative process, working backand forth between a very general chart, and highly detailed lower-level charts.
Adding timeAfter drawing the chart, extend it by estimating the time required for each activity. A network chartextended in this way, is often called a Programme Evaluation and Review Technique (PERT) chartor Critical Path Method (CPM) chart. The difference between CPM and PERT is not fundamental,but rather one of viewpoint. In a PERT type of network chart, events are designated explicitly andemphasized by their placement in boxes. In a CPM plan the events would not be shown; activitieswould follow directly upon one another. In general, CPM is used by industries like the constructionbusiness, where the project includes well defined subtasks, with a low level of uncertainty. PERTcharts are more likely to be used in research, where uncertainties abound and responsibilities areseldom well defined.
The first step in introducing time to the chart is to prepare a list of realistic activity times, in consultationwith the people allotted the work. A frequent mistake is to assume that the work can always be doneduring overtime or late at night if the estimate is too low. Make sure that nothing has been overlookedand pay attention to things that may potentially go wrong. Programmers invariably underestimate thetime required to perform a task by a factor of 2 or more.
The critical pathIn the Network Plan project planning method, the critical path is the sequence of activities whichdetermines the earliest time at which the project can be completed. Once the critical path is known,one looks for those paths which are not critical but near critical. Such a subcritical path may, due to amissed delivery date, suddenly become the critical path. Or, if the activities along the critical path areexpedited, the earliest project completion time may become a function of a subcritical path.
The second step in the chart analysis is to go through the Network Plan and determine for each eventthe following three times:
The earliest completion time is recorded in the lower lefthand quadrant of each event: the time,assuming that the start is at time zero, when (all its predecessors and) the event can be regarded ascompleted.
The latest completion time is indicated in the lower righthand quadrant of each event. This is thelatest time that an event can be completed without delaying the completion time of the project. Latestcompletion times are calculated backwards, starting at the end and tracing backwards through allpossible paths.
Slack time, the difference between the latest completion time and the earliest completion time, isindicated in the upper righthand quadrant. This is the length of time for which the event could bedelayed without holding up the project. The sequence of events for which there is no slack time isthe critical path.
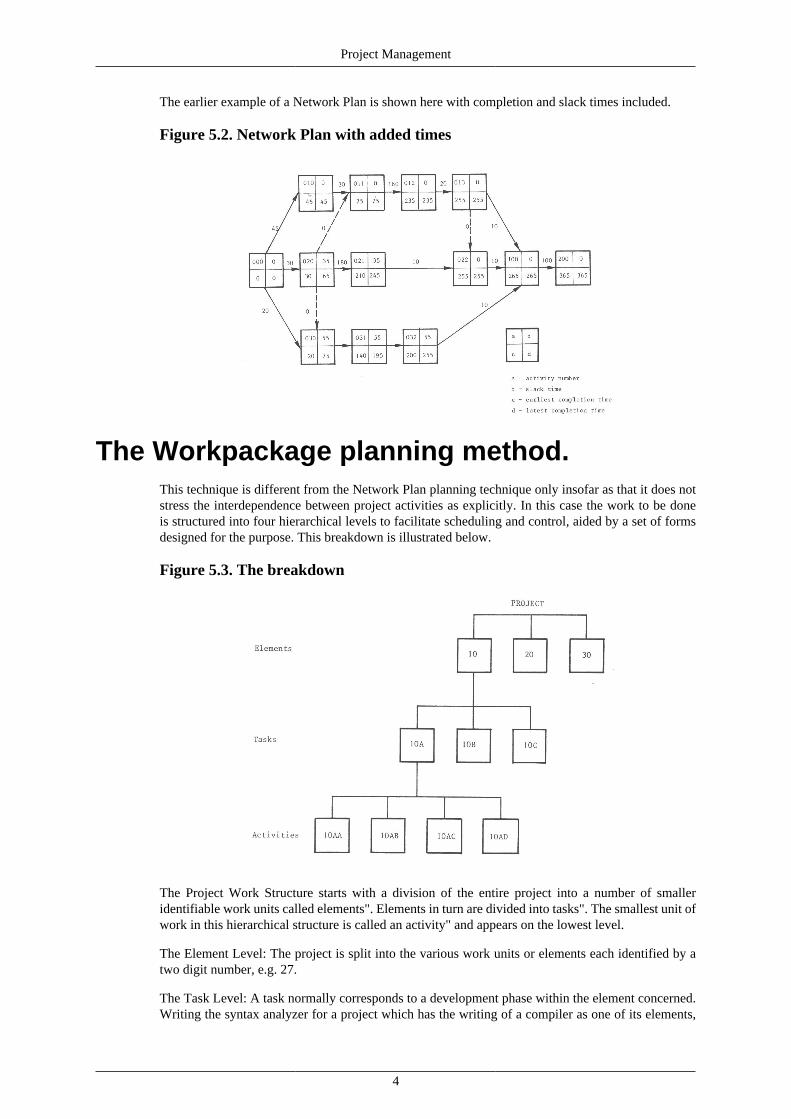
Project Management
4
The earlier example of a Network Plan is shown here with completion and slack times included.
Figure 5.2. Network Plan with added times
The Workpackage planning method.This technique is different from the Network Plan planning technique only insofar as that it does notstress the interdependence between project activities as explicitly. In this case the work to be doneis structured into four hierarchical levels to facilitate scheduling and control, aided by a set of formsdesigned for the purpose. This breakdown is illustrated below.
Figure 5.3. The breakdown
The Project Work Structure starts with a division of the entire project into a number of smalleridentifiable work units called elements". Elements in turn are divided into tasks". The smallest unit ofwork in this hierarchical structure is called an activity" and appears on the lowest level.
The Element Level: The project is split into the various work units or elements each identified by atwo digit number, e.g. 27.
The Task Level: A task normally corresponds to a development phase within the element concerned.Writing the syntax analyzer for a project which has the writing of a compiler as one of its elements,
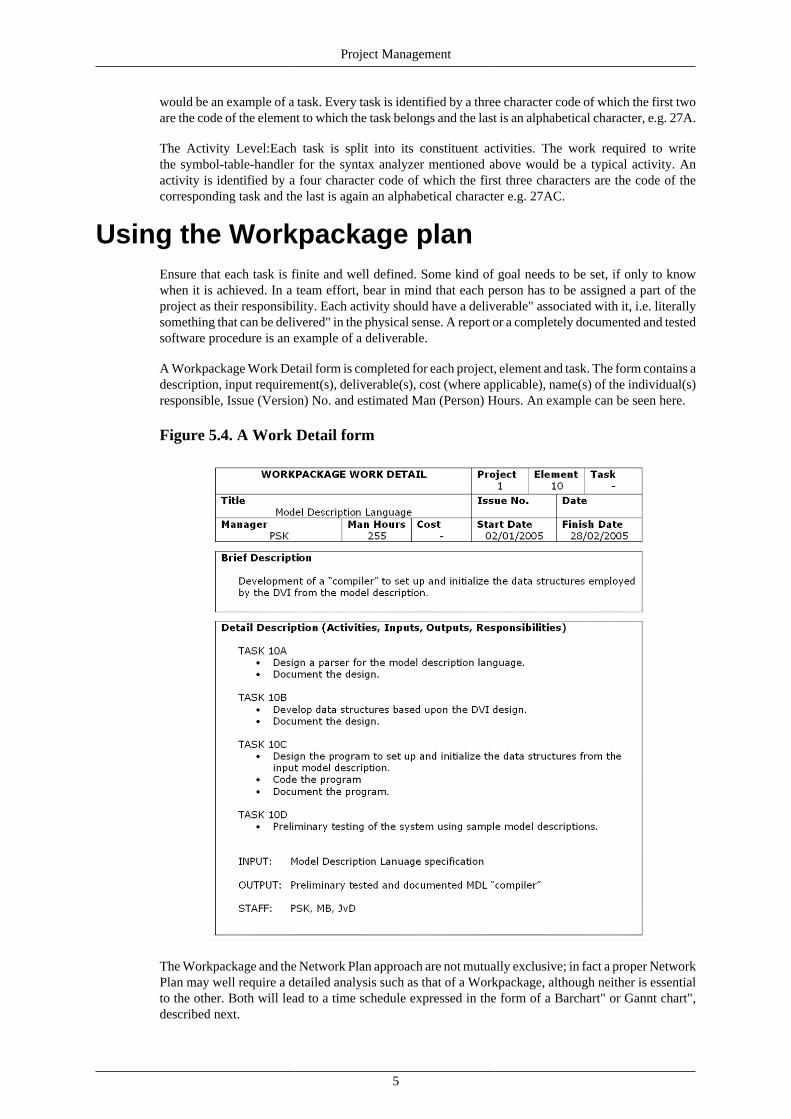
Project Management
5
would be an example of a task. Every task is identified by a three character code of which the first twoare the code of the element to which the task belongs and the last is an alphabetical character, e.g. 27A.
The Activity Level:Each task is split into its constituent activities. The work required to writethe symbol-table-handler for the syntax analyzer mentioned above would be a typical activity. Anactivity is identified by a four character code of which the first three characters are the code of thecorresponding task and the last is again an alphabetical character e.g. 27AC.
Using the Workpackage planEnsure that each task is finite and well defined. Some kind of goal needs to be set, if only to knowwhen it is achieved. In a team effort, bear in mind that each person has to be assigned a part of theproject as their responsibility. Each activity should have a deliverable" associated with it, i.e. literallysomething that can be delivered" in the physical sense. A report or a completely documented and testedsoftware procedure is an example of a deliverable.
A Workpackage Work Detail form is completed for each project, element and task. The form contains adescription, input requirement(s), deliverable(s), cost (where applicable), name(s) of the individual(s)responsible, Issue (Version) No. and estimated Man (Person) Hours. An example can be seen here.
Figure 5.4. A Work Detail form
The Workpackage and the Network Plan approach are not mutually exclusive; in fact a proper NetworkPlan may well require a detailed analysis such as that of a Workpackage, although neither is essentialto the other. Both will lead to a time schedule expressed in the form of a Barchart" or Gannt chart",described next.
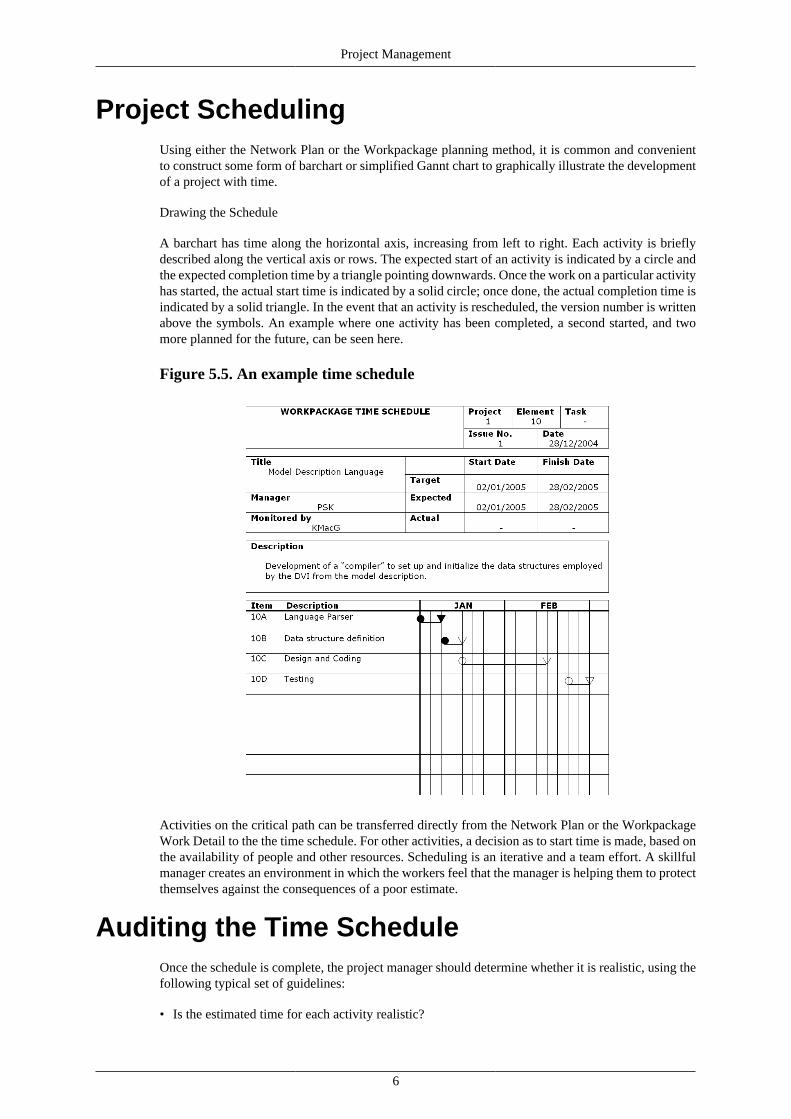
Project Management
6
Project SchedulingUsing either the Network Plan or the Workpackage planning method, it is common and convenientto construct some form of barchart or simplified Gannt chart to graphically illustrate the developmentof a project with time.
Drawing the Schedule
A barchart has time along the horizontal axis, increasing from left to right. Each activity is brieflydescribed along the vertical axis or rows. The expected start of an activity is indicated by a circle andthe expected completion time by a triangle pointing downwards. Once the work on a particular activityhas started, the actual start time is indicated by a solid circle; once done, the actual completion time isindicated by a solid triangle. In the event that an activity is rescheduled, the version number is writtenabove the symbols. An example where one activity has been completed, a second started, and twomore planned for the future, can be seen here.
Figure 5.5. An example time schedule
Activities on the critical path can be transferred directly from the Network Plan or the WorkpackageWork Detail to the the time schedule. For other activities, a decision as to start time is made, based onthe availability of people and other resources. Scheduling is an iterative and a team effort. A skillfulmanager creates an environment in which the workers feel that the manager is helping them to protectthemselves against the consequences of a poor estimate.
Auditing the Time ScheduleOnce the schedule is complete, the project manager should determine whether it is realistic, using thefollowing typical set of guidelines:
• Is the estimated time for each activity realistic?

Project Management
7
• Are all assumptions mentioned and valid? It is common to receive underestimated times based uponthe existence of resources that have never been explicitly specified and will be unavailable whenneeded.
• The impossible always happens. An estimate based upon the 100 percent availability of equipmentor personnel is inviting trouble.
• Refer back to the records of previous projects to learn from the mistakes or estimates made there.
Advantages of planningIf it turns out that the resource or time requirements exceed what is available, the project then has to bescrapped or re-planned, or additional resources motivated for. In the latter case the carefully preparedplan serves as an excellent basis for such a motivation. Even where there are no evident problems,plans put one in an excellent position to ask under what conditions the schedule, cost or requirementscan be improved. And when you plan your time upfront in a realistic way, you will not be discouragedduring stages of lower productivity, as these will have been recognized and anticipated from the outset.
Project ControlA plan is of no use unless control is exercised to ensure the plan is adhered to, or that action istaken timeously when this is not the case. Project control thus involves regular checking of progressagainst the current project schedule, and taking appropriate action wherever tasks are delayed orpostponed or producing inferior outputs. If scheduled tasks have not been started as planned, or aretaking significantly longer than anticipated, this needs to be carefully considered to identify the causeof the problem and the best remedy. This can mean giving the individual concerned greater assistance,support, encouragement and incentive; it can mean revising the plan in the light of new knowledgeor problems; it can mean changing the allocation of people to tasks; etc. It is the nature of researchthat the process cannot be spelt out in detail at the outset and then simply executed as plan changeis to be expected, and plans revised accordingly as the research proceeds and you learn more aboutthe problem. If tasks are being completed on time, project management requires checking that theyhave been adequately done this can involve using appropriate software testing procedures, obtainingfeedback from others through user testing or seminar presentation, etc.
The documents produced during the project planning and scheduling phases form the input to projectcontrol. Overall control is guided by regular reports of the variance between actual times spent versusbudgeted time (and of financial expenditure vs budget, where applicable). Although these variancereports do not indicate whether the project is on schedule or not, they do indicate whether humanresources are being used at the rate predicted. Depending on the reason for a variance, it may serveas a warning of impending problems.
The Workpackage Variance ReportThis form must be completed at the end of the planning phase and for each subsequent reporting periodfor every task, element and complete project (or, in the case of the Network Plan, for each activity).This report comprises the following fields, as can be seen in the example below:

Project Management
8
Figure 5.6. A Variance Report
• Item: The code of the element, task or activity to which the row refers.
• Reporting Period: The number of actual hours spent on the item during the current reportingperiod..
• Work in Progress (WIP): The total number of hours spent to date on an item on which work hasstarted but has not yet been completed. This includes the time spent during the current period..
• Cumulative: The total number of hours spent to date on the item. Once work on an item has beencompleted, this number will remain the same from one reporting period to the next. Otherwise itwill be the same figure as that in the column marked WIP..
• Target: This column contains the original hour estimate for the item at the time of planning orreplanning..
• Expected: The current estimate of the number of hours required to complete the work on the item.This number may vary from one reporting period to the next as work progresses and new informationcomes to hand. Such new information may also effect the time estimates for items on which workhas not yet started..
• Variance: This is the field which contains the difference between the target and expected numberof hours.
A/E. If the work on the item is still in progress, an E for expected will be filled in; otherwise A foractual.
Variance AnalysisThe variance report discussed above is the primary source of information concerning the status of theproject and how that status was reached. Depending upon the number of person-hours expended perday, a variance report should be completed every one to four weeks.
Project Management
9
Negative variancesNegative variances on almost every item of the project imply that work expended is in excess of thetarget total. If the manager knows that an intense effort has been made to advance the project, thenegative variances are a confirmation of this decision. If the increased rate of work was not a consciousdecision, it is clearly necessary to determine whether the project is on schedule and not experiencingtechnical difficulties. If there are severe technical difficulties, another planning iteration is obviouslycalled for. On the other hand, if all items are behind schedule, the negative variances are early warningsignals of an important problem. If the project is on schedule and there is a continual pattern of negativevariances, the original time estimates may have been too low. Again a new iteration of the planningprocess is required. A careful audit of the personal time reports of those working on the project mayon the other hand reveal a typical human problem. Because the project appeared to be running well,there may have been a tendency to free load on the project, i.e. idle time could be charged to it withoutarousing suspicion. Equally, the unjustified time charges against the project may have been made byindividuals on another project which is in trouble. A manager who uncovers either type of dishonestyshould make this discovery known without embarrassing the individuals concerned. The same is truewhen anyone consistently underestimates the time required for an activity in an attempt to reflectfavourably on their own capabilities.
Positive variancesVariances consistently positive indicate that less manpower is being used than originally estimated. Ifthe project is on schedule, all is well. However, little time spent on a project indicates people failing towork on the project at the planned times. This may be because they are stuck with technical problems,lack resources or have been assigned other work. If the job is on schedule and no technical difficultiesare reported, then it could be one of those rare situations where things go better than predicted. On theother hand, the original estimates may all be too high. Overestimates are generally troublesome in thatmore resources may be kept available than are needed. This has direct implications for the productivityof the team which ultimately will effect everyone concerned.
A mixture of variancesA mix of relatively minor positive and negative variances, in a project that is on schedule, is a cause forrejoicing. But be wary of a natural human tendency to make the actual time expended agree with theestimate. This kind of dishonesty will only become evident in one of two ways: either the original timeestimates were close, and the project schedule will eventually suffer; or the original time estimateswere too high and will adversely affect productivity of the team.
Progress ControlThe basic data used to plot project progress with time are two percentages -Actually completed andCompleted + WIP. As an approximation of the status of the project, these are a valuable managementtool. Models do not have to be exact analytical representations of the real world; they need only beclose enough to be useful as a control tool.
The following are typical patterns which should reveal trouble:
• Going nowhere: reporting period after reporting period elapses, but the Actually Completedpercentage changes very little.
• Forever 95% complete: some tasks, elements or projects move very well up to a high level interms of Actually Completed percentage and then they just remain there. The Completed + WIPpercentage would soon show that the project is behind schedule however, since some activitiesalways seem to be 85% or 95% complete, but never 100%.
• Too good to be true: a continual, remarkable high level of agreement between Actually Completedpercentage and elapsed estimated time is a clue to dishonest reporting. If allowed to continue, this
Project Management
10
situation usually degenerates to the forever 95% complete case, since the reported percentages bearlittle relation to work progress.
• Sudden surprises: an activity is making progress as expected in terms of Actually Completedpercentages when suddenly a dip occurs. This is quite acceptable as a single occurrence, but it maynevertheless be wise to establish the reason for the sudden lack of progress.
• Lack of cooperation: one may occasionally find someone who refuses to give their estimate of thepercentage of work completed on an activity. This can be an indication of trouble with the activityor, worse yet, with the individual. Failure to keep or obtain the records discussed leads to a crisismanagement approach which only compounds the problems in out-of-control situations.
ConclusionMost creative people have an inherent bias against paper work, and resent the record keeping andanalysis required for project control. For this reason those activities should be kept minimal and thereporting processes as simple as possible.

1
Chapter 6. Research Proposals
Table of ContentsWhen are you ready to write a research proposal? ............................................................. 1Research proposal structure ............................................................................................ 1Additional material ........................................................................................................ 2Grant/funding proposals ................................................................................................. 2Help in writing a proposal .............................................................................................. 2
When are you ready to write a researchproposal?
It is not wise to rush into writing a proposal unless you are sure that you have a research goal that isfeasible and suitable for your interests and background. To check this, make sure that the followingstatements are true for you:
• I am familiar with related research in this area
• I have a good understanding of the steps that will be involved in achieving these goals
• I have the ability to successfully conduct each of these steps
• I am sufficiently motivated and enthusiastic about all the steps in this project
• I am convinced that the results of this research will be useful to others
Research proposal structureA research, thesis, or grant proposal usually comprises the following sections:
1. Title. Give a meaningful title that summarises your planned research project.
2. Executive summary. Describe the project and its importance in about 250 words.
3. Research goals. Give short- and long-term goals, and their significance, explaining what differenceyour research output will make to current theory and practice. List the main research questionsyou are asking, and if anyone else has said the problem/task is important to study, then say so.While you cannot know what your research outcomes will be, give an indication of what outputsand results you envisage.
4. Existing research. Review the current knowledge in the field. and include your own past researchto show your familiarity and competence in the subject. Make sure it is clear how your researchdiffers from what already exists, and how it relates to this.
5. Methods and experiments. These should be outlined in sufficient detail to show that they arefeasible and suitable. Assess the difficulty of your goals and describe previous experience you havewith similar goals, methods or experiments. Consider what risks exist and how you will minimizethese. Show that you already have a plan for evaluating your research outputs your work will bewasted if you do not know how you can evaluate your success or goal achievement.
6. Timetable. List major tasks and their expected completion dates.
7. References. In a thesis proposal, this should include papers you plan to read and an annotatedbibliography for those you have already read, showing that you can group these papers into suitablecategories and are aware of the key articles in the field.
Research Proposals
2
Additional materialIf the financing of the research is as issue, a budget must be included. Itemise what will be required,with cost estimates and motivation. Every such item must be essential to the viability of the work, andyou must explain clearly why this is so. (Note: this section is omitted in a thesis proposal)
Where applicable, attach CVs of researchers and supporting documents from your own or any otherinstitution wishing to be involved as collaborator or funder.
Depending on the type of proposal, a draft table of contents for the final report can be a concise yetdetailed outline of what is envisaged. This is more suitable for projects of fixed, short-to-mediumscope - a Masters thesis is a good example.
Grant/funding proposalsIn order to convince funding bodies that your research proposal deserves an appropriate research grant,you will need to show that
• the problem being addressed is important
• you have the experience and ability to solve it within time and budget
This can be done in the following way:
1. Your research problem can be shown to be important by showing that it is likely to lead to newdiscoveries within its field or to have substantial impact on other fields. Show that is has thepotential to contribute to better understanding of the field, and where applicable, that it can help toachieve an extrinsic industrial or sociological goal through improved technology. If your researchis capable of facilitating the distribution or effectiveness of science education, this should also beexplained.
2. Your suitability for the work will be rated according to your recent research performance, thesoundness of your research proposal (including the methods and approach you plan to follow)and the adequacy of resources you will have at your disposal (according to equipment and peopleavailable and budget requested).
Help in writing a proposalTo help you write a research proposal (or any other research article), first work out how you wouldexplain your project to someone who is not a Computer Scientist, or at the very least to a ComputerScientist who has no knowledge of your area of specialization (e.g. AI or databases). This will bringto light any hidden uncertainties or fuzziness in your own thinking; it will make it easier to explaincomplex aspects of the work in a more understandable way; and it will prepare you for those occasionsin the future when you will indeed be required to discuss the work with people outside your discipline(potential clients, sponsors, employers, end-users, sources of useful data, etc.) Some general guidelineson describing research ideas can be found in the section on Research Writing.

1
Chapter 7. Experimentation
Table of ContentsMost IT research is experimental ..................................................................................... 1Planning the experiment ................................................................................................. 1Criteria for successful experiments ................................................................................... 2Example ...................................................................................................................... 2Hypothesis testing ......................................................................................................... 2Experiments with human subjects .................................................................................... 3Finding a representative sample ....................................................................................... 3Dividing subjects into groups .......................................................................................... 3A single group repeating a task ....................................................................................... 3
Most IT research is experimentalExperiments are at the heart of the scientific method, where hypotheses are confirmed or refutedthrough carefully controlled artificial test situations. One of the differences between systemdevelopment in industry and in research, is the quest for new knowledge and for evidence tosupport such claims. Therefore, with the exception of formal or theoretical studies, IT researchrequires conducting experiments to backup claims about new computing techniques, systems, models,architectures, etc. A major difference between a software/hardware development project and a researchproject is that the latter involves a hypothesis (new knowledge whose truth we want to evaluate), thedesign and execution of experiments to test this hypothesis, and the careful and rigorous analysis ofdata from these experiments to see whether they support the hypothesis. In this way new knowledge isgained by building systems or models, and observing and analysing their usage. A computer scienceresearch publication that does not include experiment results contributes ideas only, without anyevaluation of these ideas. Experiments can be exploratory, or can be structured so as to answer specificquestion(s) or to test hypotheses. The kind of experiment most common in IT is an experiment whichsets out to validate a new model/system/architecture/approach by implementing a prototype that showsit is feasible and practical, or that it behaves as was predicted. Another type of experiment in computingis that which compares a new model/system/architecture/approach proposed by the researcher withcurrent practice; while others are designed to establish optimum parameter values or resource needs.Experiments should also be conducted when a critical decision is made, to avoid proceeding furtherwithout confirmation that a good choice was made. This is crucial particularly when working in thecontext of safety critical systems.
Any research should state a hypothesis at the outset and end with a conclusion as to whether thehypothesis was supported or refuted. In some cases where the research focuses on building a system,this hypothesis may be stated along the lines of "System P is good for task X" or "System P is betterthan rival systems Q and R for task X", or similar sentences with the word system replaced by model,technique or theory [Bundy97]. The context in which P is better also needs to be stated. It is seldompossible to test all types of task X, so the range of such tasks must be classified so that a representativesample can be used in the experiments. At the same time the meaning of "better" needs to be preciselydefined (for example P may be more widely applicable, easier to use, faster, consuming less resources,or the like), and in a way which is explicit and measurable. A useful check that a hypothesis isacceptable is to imagine a scenario in which the hypothesis is refuted.
Planning the experimentWhen an experiment is designed, researchers should document their goal/hypothesis and experimentalprocedure, and then scrutinize this from an outsiders viewpoint to see what criticisms could be leveledat their proposal. As ever, it is preferable to also seek such feedback from colleagues and friends. Theexperiment can then be modified to take these criticisms into account; or where this is not possible,the goal/hypothesis can be altered or limited accordingly.

Experimentation
2
A pro forma plan is a brief indication of the requirement being tested and the finding we hope to reachin an experiment. Its first sentence states the requirement and its second sentence summarizes theanticipated result. A pro forma report is written after the experiment, and also comprises a first sentencegiving the requirement and a second giving the findings of the experiment. Here is an example:
Pro forma plan: It is required of the ticket machine that first-time users should be able to operate itsuccessfully without prior training. We intend to carry out laboratory tests of the machine to confirmthat at least 95 per cent of users can complete normal purchases without difficulty.
Pro forma record: It is required of the ticket machine that first-time users should be able to operate itsuccessfully without prior training. We have carried out laboratory tests of the machine in which over97 per cent of users completed normal purchases in less than 60 seconds. [Newman and Lamming]
References: W.M. Newman & M.G. Lamming. Interactive System Design. ISBN 0-201-63162-8.Addison-Wesley: 1995.
Criteria for successful experimentsThe purpose of a laboratory experiment is to obtain precise measurements for a system (measures ofperformance, reliability, usability, or whatever criteria are of interest). To achieve this requires tightcontrol over experimental conditions so that extraneous influences are factored out.
For a prototyping experiment to demonstrate an idea is valid requires some measure by whichfeasibility can be established (e.g. response time). To compare two systems or approaches to determinewhich is better requires suitable performance indicator/s (e.g. resource utilization, time, or error rate).To test a hypothesis, at least two measurable variables are needed, in order to study the relationshipbetween them. Experimental research thus requires finding performance criteria that are convincing,verifiable, easy to measure, and measuring the right thing.
The aim of experimental techniques is to minimize the effect of bias in research and facilitateindependent verification of observations. If experiments are repeatable and use well-known methods,then others can more readily accept research results. An experiment succeeds if it measures only theeffect that it sets out to measure, without interference from other influences, and if its results can begeneralized to other cases (or to other cases satisfying assumptions underlying the experiment).
An experiment should be designed so as to learn something that is generally applicable, and not justtrue for the particular instances involved in the research. To generalize from experiments requires thatan adequate number of experiments is performed, which in turn depends on the number of extraneousfactors that are possibly affecting results. If a researcher wants to demonstrate that an idea is feasibleand implementable, only one experiment is necessary. To show that one system/approach is betterthan another, requires running two experiments - one with each alternative - and comparing results. Itis best to use well-known benchmarks for such experiments, where these exist. Showing a relationshipbetween variables or testing a hypothesis will require more experiments, so that any influence fromextraneous factors can be counteracted.
ExampleAs an example, consider experiments conducted to evaluate MYCIN, the medical diagnosis expertsystem. Initially, experts were given MYCINs diagnoses and recommended treatments and asked torate them. Later experiments used improved measures: experts were given diagnoses and treatments,some of which had been done by other experts and some of which were done by MYCIN, and askedto rate these without knowing which were which. This removed bias, and also showed up that expertopinions were not always reliable and needed to be averaged out.
Hypothesis testingThe hypothesis being tested in an experiment is one that predicts a relationship between two eventsor characteristics, called variables. The variable that is systematically manipulated by the researcher

Experimentation
3
in an experiment is called the independent variable because the conditions to test this variable areset up independently beforehand. The variable being measured to see how it is affected is called thedependent variable because its value depends on the setting of the other variable.
If there is a control and an experimental test, and only one variable is different for the two, then it canbe argued that differences between the two tests are a result of the differences in that variable. But thismeans that extraneous variables need to be kept constant in an experiment, with only the experimentalvariable changing so that its effect (alone) can be determined. Experimental research involves varyingone or more independent variables to assess their effect, controlling extraneous variables to preventtheir influencing results, and creating different experimental conditions to study.
A graph or bar chart helps in comparing two sets of results easily. Statistical tests like the student t-test can be used to test if differences are significant, and hence if the hypothesis has been confirmed(or not).
Experiments with human subjectsIf an IT experiment is concerned with system behaviour or performance, it is easier to control theeffects of extraneous factors; if it involves humans (e.g. usability studies), then a number of participantswill be needed to balance out the effect of the many extraneous characteristics of the individualsthemselves.
If two systems compared in an experiment turn out to be very similar in performance (or error rate, orwhatever is being measured), it can be due to a poor selection of test tasks or to extraneous differencesbetween control and experimental groups.
Finding a representative sampleFor an experiment to give a good indication of what will occur in the real world, we require a realisticgroup of users tackling realistic tasks. The small fraction of future users and tasks that are involved inan experiment is called the sample, and it is important to obtain a representative sample. If we havea sufficiently large sample that is representative of the target population, then the mean performancemeasured in the experiment should be very close to the real mean (for the population as a whole).
Dividing subjects into groupsTo limit the effect of extraneous characteristics of human subjects, participants should be dividedinto a control and an experimental group, without being told the difference between the two groups.(Ideally, researchers observing them should not know which group they are looking at either. Suchdouble-blind experiments are seldom possible in computing however). One approach is to randomlydivide participants into two groups, on the assumption that the groups will thus be equivalent/comparable. It is best to test this assumption by interviewing, questioning or testing the two groupsbefore the experiment starts, and then forming two balanced groups accordingly. The technique knownas matched-participants creates pairs of subjects having matching characteristics; the group is thendivided into two equivalent halves by splitting each pair. This will also enable you to do before-vs-after comparisons on each group, by repeating the test, interview or questionnaire afterwards.
A single group repeating a taskA problem with dividing subjects into two groups is that, unless there are enough subjects available,the groups can be very small and so the effect of any individual differences can be pronounced. Asan alternative, all participants can do the control case first and then do the experiment afterwards (orvice versa). This removes the possibility of extraneous factors affecting different results shown by thetwo groups (since it is the same group of people every time), but it is only applicable if subjects do notlearn or change during the first experiment, thus affecting their performance in the second one. Thisapproach is certainly best when systems and not humans are involved. Otherwise, the order effect can

Experimentation
4
be reduced by halving the group of subjects, so that one half does A and then B, while the other doesB and then A (called counterbalancing).
1
Chapter 8. Prototypes
Table of ContentsWhat is a prototype? ..................................................................................................... 1The role of prototypes in research .................................................................................... 1Why build a prototype? ................................................................................................. 1When to build a prototype .............................................................................................. 2Low- and high-fidelity prototypes .................................................................................... 2Prototyping steps .......................................................................................................... 2Problems with prototyping .............................................................................................. 2
What is a prototype?A prototype is a simplified system, designed and built to focus on certain aspects while ignoring others.For example, a prototype might ignore user interface issues entirely, or it may be built solely for easeof development without concern for efficiency, or it may implement only some parts of a system andomit others entirely, etc. A prototype is easier to study and reason about than an abstract model, andquicker to produce than a complete working system. It can also be easier to analyse than a full systembecause unimportant aspects have been factored out. A prototype is never the major contribution ofresearch, but it is often a helpful tool for achieving some other research goal.
The role of prototypes in researchPrototypes are mainly used in the following ways in IT research:
• To demonstrate that an idea is practical and feasible, by implementing it in some prototypical form
• To enhance an idea/model/system/architecture/approach, and develop it in more detail - bydiscovering problems, solutions and alternative opportunities in the course of prototype construction
• As a vehicle for conducting an experiment, to test some property of a system or approach — e.g.performance, usability, integration etc.
• To study the use of some technique in a particular application context, one which has characteristicsdifferent from other environments where the technique has so far been applied
Why build a prototype?Constructing prototypes enables us to study, test and improve on ideas and designs. The moreprototype systems developed and explored, the more we will learn and the more our research willbenefit. The longer a research project proceeds without constructing a prototype, the more time is beinginvested in an untested concept; and the more choices are being made without verification. Researchersrun the risk of developing in more and more detail an idea that is unsound, flawed or inferior.
Building a prototype to test an idea is a type of formative evaluation, so-called because it is being testedin order to help form the solution to the research problem. A prototype facilitates testing decisionsalready made (are there any problems with what has already been done?) and assists in future decision-making (what is the best alternative for the next step?). Prototypes are particularly useful for checkingsystem performance, but partial systems can also be built to answer specific questions about certaincomponents or aspects of a system.

Prototypes
2
When to build a prototypePrototyping is used extensively in engineering. Where there is an accepted theory, model or methodof analytical testing this is used initially and prototyping is left until a design is almost complete;otherwise prototypes are built early in the project.
To build a prototype to evaluate an idea, that idea must first be developed in sufficient detail tomake implementation possible. You need to identify the components (including hardware, users andexternal software) and the interactions of interest, what information they require, and how to representthis. Overall system requirements need to be decomposed into tasks and operations, which mustthen be allocated to individual components. Relationships between components and operations mustbe decided, for example the temporal ordering of operations and the information passed betweencomponents
Low- and high-fidelity prototypesLow-fidelity prototypes do not look very much like the system envisaged, but are quick and cheapto construct and test, and are useful particularly in the early stages of the research project. A Wizardof Oz prototype is an example of a low-fidelity prototype used in HCI, where an interface design isevaluated by having a (hidden) human respond to inputs in the place of software components whichhave not been built. User interface prototypes can even involve hand drawings and story boarding inthe beginning, to check usability before any software is produced.
Initial prototyping should be fast and simple as possible, to get an idea whether or not the system ison the right track as quickly as possible. Focus on key aspects only, and keep the number of tests andamount of analysis down to a minimum, since only significant benefits and problems are a concernat this stage.
High fidelity prototyping creates systems that are much closer to the final product envisaged. Besidestaking longer to develop and having a higher chance of containing hidden bugs, they can causeresearchers to be distracted by less important details instead of focusing on the issues that the prototypewas intended to explore.
Prototyping steps1. identify the question(s) to be answered by the prototyping exercise
2. design a prototype specifically for answering those questions
3. design an experiment using that prototype to answer the questions
4. implement the prototype
5. conduct the experiment using the prototype
6. process and analyse the results from testing the prototype
7. use the results to answer the questions and direct future research accordingly
Problems with prototypingThe main problems with prototyping are that it is very time-consuming, and researchers find it difficultto throw away prototype code when drawbacks or problems are identified because of the time theyhave already invested in that prototype. To avoid these problems it is best to build partial solutions,and gradually extend (or, when necessary, replace) them to test new aspects as they are considered.

1
Chapter 9. Case Studies
Table of ContentsWhat is a case study? .................................................................................................... 1How many cases are needed? .......................................................................................... 1Research techniques used in case studies ........................................................................... 1Preparing for a case study .............................................................................................. 1
What is a case study?A case study attempts to understand an issue within the restricted context of a real-life situation. Itis not created for research purposes, but is taking place independently, though it can be modified ifnecessary to fit the research project. A case study can be relatively easily organized at a place wherethe researcher has some connection — their work, community or sports organization, a local businessor school, etc. A case study should be conducted in good faith — participants must agree beforehandto their involvement, which should be clearly defined and agreed upon at the outset. Some case studiesare exploratory, others are structured from the outset to obtain answers to specific questions or testa particular hypothesis. The best way to get an appreciation of what a case study involves is to readsome examples.
How many cases are needed?Where possible, it is better to conduct two or three case studies so that comparisons and generalizationsbecome feasible. These should be selected according to the hypothesis being tested. For example ifthe hypothesis is that < X > causes < Y >, then cases having < X > as well as cases not having < X> must be chosen, and also cases where < Y > does not hold, in addition to one or more randomlyselected cases. A single case study is most useful if it is an extreme case, or has one or more uniquecharacteristics that are interesting in their own right.
Research techniques used in case studiesA case study enables far more detailed and customized data and observations to be obtained thansurveys, interviews and experiments involving a sizeable number of participants. A range of techniquescan be applied to the same situation — system measurements, questionnaires, interviews, audio/videorecordings, and observations — and each can be geared to the specific case rather than the topicin general. Furthermore, the researcher can vary over time from being a hidden observer to being adirect participant, and thus gain first-hand experience of the phenomenon being studied in a real-lifesituation. The research output should be available for participants to scrutinize as it is developed, anddiscussion of any problems should be encouraged.
Using a case study in research requires accurate presentation of events, behaviour and perceptions;and obtaining a good understanding of the case as a whole, without omitting any aspects, in order togain a proper and complete grasp of the reality. The findings of a case study are highly subjective, andresearchers should be open about their views when they present their work.
Preparing for a case studyCase studies tend to generate question after question, in an unpredictable way, and hence some sortof framework is needed to control this phenomenon. This can be done by considering basic questionsabout the case: what is it about, how does it work, why does it work like this?

Case Studies
2
A project plan should be drawn up at the start of a case study, to indicate precisely what is beingstudied and how it will be measured.
The project plan should document the questions being investigated or hypothesis being tested, theprocesses involved, the observations needed, the qualitative and quantitative data to be collected, theanalysis to be performed [Yin]. Predicted outcomes should be documented for subsequent comparisonagainst actual results and observations; preferably a number of different predictions should be recorded— those fitting the theory, model or argument being advanced by the research, and those fittingexisting theories and beliefs. It makes no sense to devise a theory, model or argument after the casestudy is complete, since hindsight is an exact science — naturally your “predictions” will then fitobservations, and nothing will be learnt. If results do not match expectations, or only in part, thenconsider revising the theory/model/argument and conducting a second/additional study.
For an exploratory study, the aspects of the system being investigated, and the events and behaviourof interest must be decided beforehand, but researchers must prepare to change focus as issues emerge
References: R.K. Yin. Case Study Research: Design and Methods (2nd ed) . Sage:1994.

1
Chapter 10. Surveys
Table of ContentsWhat is a survey? ......................................................................................................... 1Survey design ............................................................................................................... 1Interviews vs questionnaires ........................................................................................... 2Designing the questions ................................................................................................. 2Using clear language ..................................................................................................... 3Questionnaires .............................................................................................................. 3
Kinds of data gathered from questionnaires ............................................................... 3Simple questions ................................................................................................... 3Other types of question .......................................................................................... 4Preparing a questionnaire ....................................................................................... 5Maximising response rate ....................................................................................... 5Analysing questionnaires ........................................................................................ 5
Interviews .................................................................................................................... 6Conducting interviews ........................................................................................... 6Analysing interviews ............................................................................................. 6
What is a survey?Surveys involve the collection and analysis of information from a group of people drawn from aspecifically targeted group of interest. Surveys of inanimate objects can also be conducted; but wherepeople are the subjects a questionnaire of sorts is usually employed, although interviews are alsocommon. Interviews and sequenced questioning can of course also be employed in action research,case studies and experiments. "Survey research is the method of collecting information by asking aset of pre-formulated questions in a predetermined sequence in a structured questionnaire to a sampleof individuals drawn so as to be representative of a defined population" (Hutton 1990, Blaxter book).
A survey is the planned collection of information in a standardized form that aims to give an overallperspective to a field. It permits a number of variables to be examined, which can be used to testseveral hypotheses and can be analysed in a number of different ways. Surveys are easily replicatedwhen standardized sampling and analysis techniques are used. The accuracy of responses will varyaccording to how well respondents understand the questions and the issues, how much bias exists, andwhether extraneous variables are distorting results.
A survey is typically used in the following standard way: a hypothesis is proposed, a questionnaireand/or interview designed to test the hypothesis, a group of interest ("population") chosen, a sampleselected from the target population, the data collected and analysed, the hypothesis tested.
Survey designTo conduct a survey one needs to know what one is testing for and how to obtain measures ofthis. Having a topic, the characteristic to be studied should be determined first (e.g. knowledge ofquery optimization); then the indicators to measure this decided upon (e.g. questions relating tospecific optimization techniques, questions about the query optimizer manual, etc.) and their relativeweightings established. The more indicators one has for measuring a characteristic, the greater theaccuracy with which that characteristic can be determined. The weightings help in the case wheredifferent indicators for the same characteristic give different measures for that characteristic (e.g.questions relating to optimization techniques would carry more weight than questions relating toknowledge of that part of the manual).
In framing questionnaires and interviews, one should beware of one's own opinions influencing theresearch. Your personality and views have an impact on the questions you select, how you ask them

Surveys
2
and whom you ask; care must be taken to minimize this impact on your work. Usually more than oneiteration is needed, with the questions and/or the hypothesis improved each time. The first iteration(or if this goes badly, the first few) serves as a pilot study; a small sample used for the express purposeof finding problems with the survey. Since the results are not of interest, it is best to target as diversea group of participants as possible in the pilot study, rather than a random sample.
Interviews vs questionnairesQuestionnaires, being pre-determined, limit the scope and amount of feedback compared to interviewswhich, even if highly structured, offer far more flexibility and typically more lengthy responses. It isuseful to follow up the use of questionnaires with some interviews to give more detailed perspective.It can also be helpful to conduct interviews before drawing up a questionnaire, in order to betterunderstand the issues and how to approach them.
A questionnaire is most useful for asking a large number of respondents a highly structured set ofunambiguous questions without their being influenced by an interviewer or the sensitivity of thequestions. If these are sent by mail or e-mail, they enable a geographically distributed populationto be sampled in a limited time, and can be answered at leisure and anonymously by respondents.Interviews are more useful for in-depth probing, for following up on any interesting remarks, forcollecting information on more complex issues (since questions and answers can be clarified wherenecessary), for open-ended questions, for eliciting a large amount of data from individuals, for makingcertain that only one person's views are given, and for ensuring that respondents do not ignore some orall of the questions, nor answer them in the wrong order. A skilled interviewer can also provide someof the benefits of questionnaires - by adhering to a set question structure, and by taking care not toinfluence, bias or distort results through their own reactions and comments. However, unlike the useof questionnaires, large numbers of individuals from diverse locations cannot be interviewed withoutconsiderable resources; hence a survey may need to incorporate both interviews and questionnaires.
Designing the questionsIn a well-designed questionnaire/interview
• only pertinent questions should be asked
• introductory sentences, polite phrasing and non-antagonistic language are needed to maintain a goodrapport
• the correct choice between nominal, ordinal, interval or ratio measurements must be made andcategories must be appropriately chosen
• for category, multiple choice, scale, LPC scale, ranking and grid/tabular questions, the rule of "sevenplus or minus two" should be adhered to - i.e. the number of options that most people can correctlydistinguish and choose between is 7; some can only handle 5 choices and 9 is an upper limit
• with LPC scales, consecutive questions should not have all the good extremes on one side and allthe bad extremes on the other - this should vary from question to question. For example:
Place a cross at the point which best describes the query page:
Easy to Use 1 2 3 4 5 6 7 Difficult to Use Confusing 1 2 3 4 5 6 7 Clear Quick to Use 1 2 3 4 5 6 7 Tedious

Surveys
3
Using clear languageCareful, unambiguous wording of questions and of answers (in the case of category, multiple choice,scale, LPC scale, ranking and grid/tabular questions) is essential for clarity and accuracy in aquestionnaire or interview.
A checklist for the phrasing of questions is given below:
• use simple language
• have concise questions
• elicit information that is suitable for analysis
• a question should cover exactly one aspect and no more
• avoid leading questions and beware of your personal opinions and biases inadvertently showingthrough
• phrase potentially sensitive questions as harmlessly as possible
• use precise questions that are as specific as possible
• clarify whether you want a fact or an opinion
• if time is part of a question (e.g. "currently", "in the past", "regularly") be specific about the periodof interest
• use legible, uncluttered questions attractively laid out for easy completion
• leave sufficient space for legible replies to open-ended questions
• do not have too many questions or questions that are difficult to answer
• avoid jargon, buzzwords or any terms subjects may not know or may misinterpret (when it comesto IT in particular, people are loath to admit ignorance)
Questionnaires
Kinds of data gathered from questionnairesQuestionnaires gather some qualitative data (where respondents can comment freely), but the vastmajority of information collected is quantitative. This data can be of four kinds: interval, nominal,ordinal and ratio data. Interval data is measured on a scale with a set difference between points but withany base/starting point (e.g. dates). With nominal data a coding system assigns a number to representa particular response but the number has no significance (e.g. coding gender as 0 or 1). In contrast,ordinal data permits qualitative responses to be coded in numeric sequence to reflect ordering e.g."useless", "poor", "average", "good", "excellent" could be coded as 1, 2, 3, 4, 5 respectively. Ratiodata comprises measurements on a scale where there is a true zero e.g. distances, incomes, etc.
Simple questionsThere are 8 main types of survey question. The first four simple kinds of question are illustrated byexample below (preceded by the question type in brackets):
1. (quantity or information)
In which year did you matriculate? ___________

Surveys
4
2. (category)
Have you ever undertaken part-time study? [] Yes, currently [] Yes, in the past [] No, never
3. (list or multiple choice)
To which of the following Faculties did you apply first? [] Commerce [] Engineering [] Health [] Humanities [] Science [] None of the above
4. (scale)
How do you feel about your chances of completing this degree? [] Very confident [] Somewhat/fairly confident [] Neutral [] Somewhat concerned [] Very worried [] Not sure how I feel about this
Other types of questionThe four other types of question are somewhat more difficult to answer. They are illustrated byexample below (preceded by the question type in brackets):
1. (LPC scale or "semantic differential scale")
Do you prefer command-line interfaces or graphical user interfaces? Command-Line 1 2 3 4 5 6 7 Gui
2. (ranking)
What IT fields are you most interested in? Rank those of interest in order from 1 downwards: [__] Artificial Intelligence [__] Computer Architecture and Hardware [__] Databases [__] Distributed Computing [__] Graphics [__] Human-computer interaction [__] Networks and telecommunications [__] Programming Languages [__] Other (please state) ______________________
3. (complex grid or table)
How would you rank your skills in the following?
Surveys
5
Very Good Average Weak Not Sure Reading Writing Programming Presentations Teamwork
4. (open-ended)
Do you have any suggestions for better marketing of the degree?
______________________________________________________
______________________________________________________
______________________________________________________
______________________________________________________
Preparing a questionnaireThe layout of a questionnaire should be inviting and the text legible. Questions should be precise andunambiguous; use two simple questions rather than one complex one. Before conducting a survey, tryto find different interpretations of the questions and then re-word them to clarify which interpretationis required. Ask friends or colleagues to do likewise. Avoid phrasing that is negative or presumptiveof a particular response. Limit the use of open-ended questions as they are time-consuming to answerand to analyse, and end by thanking the respondent and asking for any additional comments. As withmost research methods, it is best to conduct a pilot study to detect problems with your questionnaireso that you can improve it; (Blaxter book) reports that as many as 8 attempts at a single questionhave sometimes been necessary! Once a questionnaire has been drafted, it is advisable to show it toan individual or unit that provides consultancy services for surveys, or else to statisticians who cancomment on any potential problems they foresee in analysing responses.
Once a questionnaire has been finalized, researchers must decide which method(s) will be used todistribute it. The post, e-mail, a Web-site and direct visitation are possibilities to consider. Care must betaken in using the Web, e-mail, telephonic or postal surveys if a random sample is required - Web sitequestionnaires can be completed by almost anyone who is online, including people who are not part ofthe population of interest; the Internet itself is not accessible to everyone (particularly in developingcountries); many young people have only cellphones and are excluded if the telephone directory isused; material posted to a household will not be opened by children; etc.
Maximising response rateCandidates are more likely to complete a questionnaire if they know that it is part of a study beingconducted by a reputable organization and they understand significance and usefulness of the research,so include this in the introduction. Careful timing of the exercise can make a big difference to theresponse rate, so check when is most and least convenient for your population. Another useful incentiveis offering participants access to the results of the survey. This can be relatively easily done via theWeb; where resources permit, a hardcopy can be offered to those who have Internet access problems.Response rate is highest if the researcher is present when the questionnaire is completed, or asks thequestions over the telephone; otherwise, some chasing up should be scheduled into the project plan.
Analysing questionnairesQuestionnaire analysis is mainly quantitative rather than qualitative in nature, because of the discretenature of answers to most questions and the volume of questionnaires to be processed. Some form

Surveys
6
of statistical analysis is therefore used. This can be fairly simple - e.g. indicating which proportionof respondents gave specific answers, and which answers to specific questions appear to be related.Here straight forward measures of tendencies (e.g. mean (average), median (middle value) and mode(most common response)) and diversity (e.g. range and standard deviation) can be used. To go beyondthis, e.g. to compare one sample/population with another in order to determine how similar or howdifferent they are, inferential statistics or multivariate analysis is required. The Chi-square test is usedto compare sets of values and the Student's T-test to test means. Using these statistical tests it isimportant to check that the assumptions under which they apply are true for your data, otherwise theymust not be used. For example, the Student's T-test assumes random sampling of interval data witha normal distribution.
If two variables you have measured appear related, this may be due to the effect of some thirdvariable. To demonstrate causality you have to find or suggest a mechanism linking the variablestogether. Multivariate analysis - e.g. cluster analysis, multiple regression, factor analysis - examinesrelationships among three or more variables. These can be performed easily by using the appropriatecomputer package, but it is important to understand their purpose and foundation in order to use suchsoftware.
If the number of responses to a questionnaire is small (e.g. less than 10), results showing theactual number of respondents choosing each answer are more honest and clearer than those givingpercentages. For medium to large surveys, i.e. where the sample size exceeds 20, percentages areeasier to understand and compare.
Interviews
Conducting interviewsAn interview can be recorded either by taking notes or by using a tape/video recorder. Audio/video-taping is intimidating and likely to cause anxiety and reticence in the interviewee Note-taking ischeapest and saves considerable time compared with transcribing from tape, but it distracts bothinterviewer and interviewee (who can become concerned at how much importance is being attachedto what they say/do according to when things are written down). One solution is for the interviewer tobring an assistant - someone with knowledge of the project and subject area who is skilled at takingnotes; if this person remains in the background, neither interviewer nor interviewee/participant needbe distracted by the process.
Analysing interviewsAnalysis of interviews should move from the specific (e.g. enumerations) to the more general (e.g.categorizations and detection of common themes). In order to analyse interview transcripts and notesit is best to compare different interviews, looking for similarities and for significant remarks. Sinceinterview statements are made within a specific context, they must not be quoted without knowledgeof that context, or in the wrong sequence.
1
Chapter 11. Conducting observations
Table of ContentsThe observation process ................................................................................................. 1Observation in Field studies ............................................................................................ 1Recording devices ......................................................................................................... 1Computer-generated logs ................................................................................................ 2Arranging practicalities .................................................................................................. 2Documenting the observation plan ................................................................................... 2Preparation for a field study ........................................................................................... 2Being Unobtrusive ........................................................................................................ 3Collecting observation data ............................................................................................. 3Subjects can aid the recording process .............................................................................. 3
Thinking aloud ..................................................................................................... 3Subject diaries ...................................................................................................... 3
When to stop ............................................................................................................... 4Processing qualitative information .................................................................................... 4Quantitative analysis of observation data ........................................................................... 4
The observation processObservation involves watching, recording and then analyzing events and behaviour. Observationoccurs in laboratory experiments and field studies, where users are watched while executing pre-set tasks, or real-life activities, respectively. While observing users, researchers should record whatis done, how long tasks take, and reactions to events (verbal, facial and body language responses).Written logs, audio and video recordings are the most common methods of capturing what occurs ina usability test.
As with interviews, observations can be highly structured to fit a pre-determined framework, oradaptable to situations as they arise. When observations are highly structured and prior categorisationsof behaviour are used, the process is really just a type of experimentation; the more flexible approachwhere the participants behaviour determines what is studied, is akin to action research.
Interaction with participants can be non-existent (e.g. if observers are simply counting and timingevents), marginal (e.g. if observers talk to participants to capture qualitative data), complete (if theobserver joins the group as a fully-fledged member working on the task at hand) or partial (somewherein between the extremes of non-existent and complete participation, depending on the evaluation).
Observation in Field studiesObservation in a field study is similar to observation in a controlled environment, except that thereis generally a greater emphasis on observing interaction between people in the field. Field studiesare important because computers are not used in isolation but within a particular leisure or workenvironment; so complexities and cultural nuances introduced by the real-life environment should beincluded in observation records.
Recording devicesSince writing is slow and distracts the observer, some backup recording equipment is advisable. Audiotapes are a comparatively unobtrusive backup, but take long to transcribe, particularly if the persondoing the transcribing is not a researcher able to distinguish noteworthy points from insignificantcomments. If a visual record is also required, photographs are usually adequate, and are cheaper and

Conducting observations
2
easier to process than video recordings. Particularly in a field study, photographs of artifacts produced(sketches, notes, etc.) are a useful adjunct to mere recording of activities. The presence of a videocamera can be intimidating to subjects, and make researchers too focused on the specific scene beingfilmed while neglecting other aspects. Of course, video is the most complete and indisputable form ofrecording a particular scene that the camera is focused on. Tools such as Observer Video-Pro (Noldus2000) record time on video tape, allow marked parts to be copied to an edit list, and can synchronisekeyboard entries and other observational data with the video.
Computer-generated logsComputer-generated logs of activities and associated times also give wholly objective evidence. Theyprovide useful backup data which can be easily analysed by appropriate software, and can also beused in large studies involving a great many participants (e.g. on the Web). Since computer logs canbe completely indiscernible, professionalism requires that researchers inform subjects what is beingrecorded and why.
Arranging practicalitiesIn theory, observers can participate fully in the process being observed, or they can play no part in theprocess at all and remain strictly observers only; but in practice something between these two extremeswill often occur. It is worthwhile considering beforehand whether seeing the observer is likely to affectthe behaviour of subjects, and whether a natural or artificial environment is most appropriate. Thiscan be established by first conducting a short pilot study.
The location of equipment users will employ, of observers, and of cameras and microphones, needs tobe decided and tested in advance. For example, one camera may point to the keyboard and another tothe subject. Equipment must be checked to ensure it is functional and correctly used (with appropriatefocus, volume, etc.) Users need to be found, a convenient time arranged, and consent forms producedand signed. Initial instructions need to be written out and checked. Find out a little about participantsso that you can make them comfortable when they arrive by knowing something of what intereststhem. In the case of a field study, observers should acquaint themselves with the environment and taskbeing studied beforehand; this will give them greater credibility in the community and also enablethem to keep better records from the outset.
Documenting the observation planOnce the task has been designed and the behaviour to monitor decided, a detailed report is needed,describing the purpose of each step in the process being observed, what to look for at each such step,and how to record this. This is especially important if a team of observers is employed, to ensure thatthey operate in the same way.
When there is a team of observers, they need to decide what and who each team member will observe.The fewer people or events one is watching, the more accurate and detailed ones notes can be, butit is also helpful to have more than one person observing the same thing so that they can comparenotes. If there are enough people, the job can be divided up, not by the number of observers, but bythe number of observer-pairs. Then each part of the observation job is done by a pair of observers andcan thus benefit from having two perspectives and from observers having someone to discuss events/problems with. By varying the pairing over time, each observer ends up doing a good cross-section ofthe work and has shared experiences with a number of fellow-observers. The assignment of tasks toan observation team needs to be carefully documented in advance.
Preparation for a field studySince field studies do not have the benefit of structure, a framework is useful in keeping observersfocused and providing some way of organizing their records. This comprises a checklist to adhere
Conducting observations
3
to, containing reminds such as: actors, goals/tasks tackled, activities, events, feelings [Goestz andLeCompte 84, Robson 93]. Such a framework guides researchers to know what and whom they shouldobserve when, and what questions/aspects should be addressed in their notes. This framework shouldtake into account the real-world context and include both detail points and observations of the biggerpicture.
References:
• J.P. Goetz & M.D. LeCompte. Ethnography and qualitative design in educational research.Academic Press:1984.
• C. Robson. Real World Research. Blackwell:1993.
Being UnobtrusiveObservers can be present in the test environment, or can observe through a one-way glass or via aremote screen. Observers should cause as little disruption as possible, even it they are marginally,partially or fully participating in what the subjects are doing. Audio, photographic and video equipmentshould also be located and handled as unobtrusively as possible.
Collecting observation dataThe main source of information recorded during an observation is the notes and sketches observersmake by hand (or perhaps using a laptop, but remember that battery charge does not last very long). Inthe course of observing subjects, it can be helpful to both parties if the observer shows the participanttheir notes at a convenient time during the study. Software tools such as NUDIST can sort and searchfield notes for words, phrases and categories, and perform content analysis of large bodies of text.
Quantitative observations are easily recorded as counts in a diagram or table (for example with separaterows for different characteristics/behaviours, and columns for different conditions under which theywere observed). Qualitative information is harder to capture, and requires a judicious mix of adheringto the prepared plan and being guided by interesting developments that occur during the observation.When making notes, observers should flag uncertainties or issues they want to come back to. Afterprocessing observations and synthesizing them, it is best to go over this with the subjects, to detectany misconceptions. In a field study, this should be done daily to check that observers are interpretingcorrectly what they see happening.
Subjects can aid the recording process
Thinking aloud
Since it is impossible for any observer or observation equipment to know what a subject is thinking, auseful technique is to ask them to keep up a running commentary (spoken out loud) on what they aredoing (including what they are looking at) and what they are thinking. The problem is that people willbecome silent sooner or later, typically just when the task becomes interesting or difficult. A requestby the observer to keep talking is obtrusive. One helpful technique for limiting silences is to havesubjects working in pairs, as it is more natural to talk to another person than to oneself.
Subject diaries
In some user studies, participants are asked to keep diaries as a record of their activities and feelings,possibly supplemented by photographs of what they have done, if cameras can be supplied. A templatefor the diary helps to structure this information, which, particularly if it is electronic, can be relativelyeasily transferred into a text database.

Conducting observations
4
When to stopIn a field study it can be difficult to know when to stop if there are neither time constraints nor a needto observe until a specific task is completed. In these situations observers should be guided by theamount they learn each day; they can stop when this becomes insignificant.
Processing qualitative informationIt is best to process notes and recordings as soon as possible after the observations are made. Detailscan be checked, and observers can consult each other in sorting out ambiguities. Facts should bedistinguished from opinions. Interesting and unanticipated events or trends should be identified andthe possibility of exploring them further discussed. A multimedia database should be constructed tocollect and protect all the different types of information.
Qualitative information is best handled by a team of researchers who discuss what they saw and whatthe observed behaviour says to them. Researchers should first skim through observation data - lookingfor what stands out, for patterns, for answers to research questions questions, and for interesting orunexpected events. Such situations are typically when people are at a loss, or have made a mistake,or have reached a conflict situation, etc. If researchers are aware of body language, facial expression,silence, inactivity, voice tone and so forth they are more likely to detect such incidents in audio/videomaterial.
Another type of analysis of qualitative data that is sometimes performed is conversational analysis(e.g. in chat rooms, bulletin boards and the like). This is highly subjective as it relies on interpretinghow people use language, and studying conversations in fine detail.
The interpretation of qualitative observation data is best reported in written form but supplementedwith statistical analysis, photos, audio or video footage where appropriate. This involves collectingsets of evidence illustrating each specific pattern, theme, trend, fact or opinion. Software tools suchas NUDIST can sort and search field notes for words, phrases and categories, and perform contentanalysis of large bodies of text.
Quantitative analysis of observation dataThe written report documenting an observation project should combine quantitative and qualitativefeedback, both for formative studies (done during development, to guide improvements) andsummative studies (done at the end of a project, to evaluate its success or test a hypothesis).
It is possible to convert qualitative information obtained from notes, cameras and tapes intoquantitative data by categorizing and counting events. Categorisation of qualitative information makesit possible to analyse such data, as long as the categories are clear and non-overlapping. The inter-research reliability rating of a categorization scheme measures the percentage of cases categorized inthe same way by two researchers. This should be measured in a pilot study with a small number ofsubjects, to test if a practical categorization scheme has been defined. If this rating is too low, eitherthe researchers were not adequately trained in categorizing what they observe, or else (more usually)the categorization is poor and needs to be revised. Discussion of pilot study cases can help identifyproblems with a proposed categorization.
Tools such as Observer Video-Pro (Noldus 2000) record time on video tape, allow marked parts to becopied to an edit list, and can synchronise keyboard entries and other observational data with the video.If observers use packages to mark videos when specific kinds of event occur, then this information, aswell as computer-generated logs, can be used to analyse duration and frequency of events of interest.Occurrence counts are also useful (taken from such video packages or by counting observer marks inhand-written notes or audio tapes).
Quantitative data can be analysed using simple statistics to find maxima, means, standard deviations,T-tests, etc.
1
Chapter 12. Testing in IT research
Table of ContentsConducting tests in IT ................................................................................................... 1What to measure ........................................................................................................... 1Testing as scientific experiment ....................................................................................... 1Differences between testing and scientific experiments ........................................................ 2
Conducting tests in ITTesting software and hardware is an important part of most IT research projects. It enables new ideasto be validated, alternatives to be compared against each other, problems to be identified and lessonsto be learned for unanticipated behaviour or system properties.
The goals/questions tested should not be too broad (e.g. Is the system easy to learn? or is this algorithmfaster?) specific issues should be addressed and then the test scenario can be easily formulatedaccordingly (eg. Are users able to discover < X > in less than < Y > minutes? or under conditions <C >, does algorithm < A > complete task < T > faster than algorithm < B >?)
What to measureThe measurements for evaluating the success of a software or hardware design will depend onthe system and research question or goal. Speed, error rate, disk utilization, accuracy, scalability,reliability, usability and resource requirements are typical candidates for evaluation.
User testing is the most important technique for usability analysis. This is a type of experiment in whichusers are set specific tasks, and then their times are measured and errors they make are recorded. Othernotes of interest may also be taken, possibly with the aid of observation, questionnaires or follow-up interviews noting for example the manner in which users perform a task when there are severalpossibilities.
It is important for user testing to measure performance, error rates and user satisfaction, since a user-friendly system is one which achieves a good balance between these three key factors. Data collectedduring user testing generally includes time to complete a task, number and types of errors made,number of errors made per unit time, number of times online help/documentation is used, percentageof users able to perform a task successfully.
Testing as scientific experimentAn experiment involves changing one variable and measuring its effect on another variable or property,while attempting to control all other variables/influences so they remain constant. In most cases,systems testing is performed in artificial laboratory situations, where system parameters, data andusage characteristics can all be controlled by the researcher. Software/hardware testing in the fieldtends to be confined to case studies; although field studies of safety-critical systems or of systems withmajor financial impact do also take place.
The human factor in usability analysis makes control more difficult, and researchers must takeprecautions to limit the impact of extraneous factors when designing and performing user testing. Thefollowing controls are typical of a usability study:
• The welcome, introduction and task questions are written out beforehand and are hence identicalfor all participants

Testing in IT research
2
• All subjects are given the same amount of time to explore the system freely at the outset (typically5 to 10 minutes)
• All participants are given the tasks in the same sequence (usually from easiest to hardest, to buildup confidence, and an easy one to end off with)
• Participants are limited to a maximum amount of time on a task, and are made to start the nexttask at that point
• Participants to not have contact with the outside world during the experiment
• All participants complete the same questionnaire after the experiment
• They are all asked their opinion of the system after the test is over
Differences between testing and scientificexperiments
While usability/system testing is much like scientific experiment, it does not try to discover newknowledge, but rather to inform and improve system development. An experiment should be based ona theoretical foundation and targeted at solving a practical problem; its results should help to refinethe theory and alleviate or solve the problem. The procedure should be documented and repeatable,and statistical analysis should be used to determine if results are significant in order to confirm ahypothesis.
In contrast, user testing is about finding problems and comparing alternatives in order to improvea product. Usability testing has relatively few participants (quick-and-dirty tests sometimes involveonly one or two subjects, otherwise 6 to 12 users is the sample size recommended [Dumas and Redish99]). The statistical analysis of usability test data also tends to be simpler than for other scientificexperiments usually nothing more than calculating minimum, maximum, mean and standard deviation.
References: J.S. Dumas & J.C. Redish. A Practical Guide to Usability Testing (revised ed).Intellect:1999.

1
Chapter 13. Modelling
Table of ContentsWhat is a model? .......................................................................................................... 1Advantages of models ................................................................................................... 1Modelling lifecycle ....................................................................................................... 1Proposing a new model .................................................................................................. 2How to devise a new model ........................................................................................... 2
What is a model?A model captures the essential aspects of a system or process while suppressing details. It should beclear and concise. It need not cover all aspects of that system or process, but provide different viewsof it. Examples in IT are the relational model of data, the ANSI/SPARC Database Architecture, thewaterfall model in software engineering, the ISO OSI model for network protocols, etc. A model can beused as a blueprint for developing new systems/processes, or for studying, evaluating and improvingexisting ones.
Models, like prototypes, make it easier to reason about ideas and communicate them more clearly toothers. A model deals with the conceptual behaviour and function of a system whereas a prototype isconcerned with lower-level details such as structure, components, methods and operations. A modelis a simplified, abstract representation of an idea/design; while a prototype is a simplified, concreteimplementation of (aspects of) an idea/design.
Advantages of modelsA model can be used early in your research to help you design a system, case study, process orexperiment, or to formulate a hypothesis. It can also be used at the end of your research to clarify whatthe product of your research is, or to prove some properties it exhibits.
It is commonly accepted that humans can only keep seven (plus or minus two) concepts in mind at atime, and hence the simplification provided by a good model facilitates understanding and reasoningabout a complex system/process. Models can address all aspects of a problem in different modelingviews, because detail is hidden in each view and only relevant aspects highlighted. This is useful forimplementers to ensure that they comprehensively cover all the necessary issues and facets of thesystem/process.
Studying a model can lead to insights that would be harder to gain from consideration of the system/process itself — e.g. if the model is based on a real-world analogy which is familiar and wellunderstood, then new ideas often arise from considering how the real-world metaphor is used. Theformal semantics of the model clarifies the system/process components, flows and requirementscompared with other types of system/process descriptions which are often incomplete, ambiguous orunnecessarily constraining.
Modelling lifecycleWhen a researcher realizes or suspects that s/he has discovered a new problem, a model can helpto express this clearly and concisely and in so doing clarify the problem (and confirm or deny itsexistence). This model can be studied to determine what assumptions it is based on, and then alternativemodels devised based on different assumptions. The assumptions underlying these models are madeexplicit, and the models compared and the implications of different assumptions investigated. Onceseveral models for the system/process have been proposed, more general models can be developed

Modelling
2
that cater for most or all of these initial models. This typically is repeated when new models, notcovered by the general model, are proposed and the general model extended to cater for them, andthis is possibly repeated several times over.
Proposing a new modelIf your primary research aim is to propose a model, you must start by making sure that you are familiarwith all existing models for this situation/problem. If models already exist, you will need to show howyours differs and why it is needed (is it simpler? applicable in some cases where existing models areinadequate? more precise and thus more suitable for analysis?)
The more models already exist, the less interesting it becomes to propose a new one and the moreimportant it is to show significant improvements of using the new model. One way is to show thatit is more general — it can support everything provided by existing models (and possibly still morethat is not supported by any known model). Simplicity is desirable in a model, a model that can beshown to be simpler than existing models and as expressive (or more) can be argued to be better thanexisting models.
Sometimes a new paradigm is introduced in one field of Computer Science (e.g. AI) which you believemight be usable in another field (e.g. databases), so you can attempt to create such a model for usingthe new concept in this other field. If this has already been done, you could consider different aspectswithin the other field (e.g. query processing, concurrency control, distribution, etc.) and find one whichrequires a new model if the new paradigm is used.
It is sometimes unclear if a new problem, process or paradigm requires a new model. If you manageto propose a new model which reveals some interesting new facet of the problem/process/paradigm,or offers some benefit in that context, then your work will be interesting and useful to the researchcommunity.
How to devise a new modelA model can be derived from a prototype design and/or implementation of the system you wish tomodel — capturing its components, flows and essential properties after completing your design orimplementation. Another way to develop a model is to find a suitable real-world analogy (just think e.g.of such well-known models as windows, files, folders, objects, agents, etc.). Using a real-world analogcan often give you greater insight into the system you are modeling, but thinking of the componentsand processes typically associated with the real-world metaphor. For this approach, you need to knowwhat you want to model well enough to understand its essence, to think creatively and to look at yoursystem with an open mind. Alternatively, you can use well known formal models such as logic, sets,formal languages, automata theory and the like.
1
Chapter 14. Usability Analysis
Table of ContentsThe Role of Usability Analysis ....................................................................................... 1Usability analysis in the development lifecycle ................................................................... 1Analytical techniques ..................................................................................................... 1Predictive Modelling ..................................................................................................... 2The GOMS model ........................................................................................................ 2The Keystroke level model ............................................................................................. 2Cognitive walkthroughs .................................................................................................. 3Empirical Analysis ........................................................................................................ 3User Testing ................................................................................................................ 3Field Studies ................................................................................................................ 3Heuristic Evaluation ...................................................................................................... 4
The Role of Usability AnalysisAnalysis aims at assessing how well an idea, design, solution or approach does its job. For most ITresearch, this cannot easily be done with a few simple calculations, but requires designing, developingand testing an experimental system, and then interpreting the results. The aim of an interface evaluation(or usability analysis) is to understand user needs better, to get feedback for improving a design, tocompare alternatives in order to choose between them, or to determine how well a design meets usersneeds and how much they like it.
Usability analysis can be qualitative or quantitative, and most often encompasses both kinds ofassessment. The main qualitative products of usability evaluation are descriptive reports, quotes, listsof problems (possibly with suggested solutions) and anecdotes; quantitative results are performancemeasures and error rates associated with tasks (or calculated from theoretical models, in the case ofpredictive evaluation).
Usability analysis in the developmentlifecycle
Evaluations done during design are known as formative evaluations; those done on the finished productare called summative evaluations. Typically a small number of users comment on early prototypes;this is fed into subsequent redesign and followed by more formal evaluation. Effective research anddevelopment requires knowing how to evaluate systems at different stages of the design-evaluate-redesign cycle. With each evaluation, both designers and users obtain a better grasp of what is required.Evaluation is a good way of ensuring that users are involved in system design; it is also cheaper tofix problems then, rather than after deployment.
Quick-and-dirty evaluations are relatively informal and give rapid feedback of a qualitative naturefrom users or usability consultants. They are useful initially as a short pilot study, followed byone or more iterations of a more thorough design-evaluate-redesign cycle involving modelling,walkthroughs, expert evaluation, user testing, interviews, questionnaires and/or observations. Quick-and-dirty evaluations are also useful in later iterations to check out specific details like the suitabilityof a particular icon.
Analytical techniquesTwo main types of assessment are analytical (through modeling or simulation) and empirical (bybuilding and testing a prototype). Analytical evaluation methods in user studies are:
Usability Analysis
2
1. predictive evaluation using a specific model of interaction
2. cognitive walkthroughs, analysing a task step by step
Empirical methods are:
1. user testing in the laboratory
2. field studies
3. heuristic evaluation by experts
Predictive ModellingIn predictive evaluation, a model of the actions required to perform some task is developed first, andthen these individual actions are analysed to evaluate the task as a whole. A task to be analysed iscalled a benchmark, and forms the basis of comparisons between systems, or between alternativeversions of a system. A few models of human-computer interaction exist which can be used to predicteffectiveness. The most well-known is the GOMS model, and a particular variant of it called thekeystroke-level model.
The GOMS modelThe GOMS model [Card 83] of predictive user modelling stands for Goals Operators MethodsSelection rules. It is a model of the knowledge, thinking and actions employed by users of a system.
• Goals are states a user wants to achieve. They are often decomposed into sub-goals.
• Operators are the thinking and actions needed to achieve those goals.
• Methods are a series of steps to accomplish a goal, i.e. a procedure or recipe.
• Selection rules are used to choose between different ways of achieving the same goal.
With this approach, a set task is modelled in terms of sub-goals, selection rules, methods and theiroperators. This breakdown is then used to analyse that task. The GOMS model is most effective forpredicting performance times. It is also useful for comparing alternative methods of performing thesame task, since different methods can be enumerated along with their predicted performance times.
There are several reports where using the GOMS model was very successful, as the detail breakdownof tasks showed where problems would arise and also precisely what was causing them (e.g. in [Gray93]). Shortcomings of the GOMS model however include its inability to model anything but expertusers in laboratory situations working on a limited set of tasks. Tasks that are complex, take a long timeor have a wide variety of options are not suited to GOMS modeling. It also does not take into accountthe real-world environment in which the system will be used, where distractions, pauses and changesfrequently occur. GOMS models are thus very helpful in predicting performance of experienced usersdo routine tasks, but are limited in scope where other kinds of systems and users are involved.
References:
• S.K.Card, T.P. Moran & A. Newell. The Psychology of Human-Computer Interaction. LawrenceErlbaum Assoc: 1983.
• W.D. Gray, B.E. John & M.E. Atwood.Project Ernestine: validating a GOMS analysis for predictingand explaining real-world performance. Human-Computer Interaction 8(3), pp. 237-309: 1993.
The Keystroke level modelThis model is based on the average amount of time taken to perform common user tasks such aspressing a key or deciding what to do. The predicted time of accomplishing some task is computed bylisting the actions it requires, and adding up the times for each of those steps. This enables systems to
Usability Analysis
3
be compared with each other, new designs to be compared against existing ones, alternative methodswithin a single system to be compared, etc.
A problem with this model is that thinking and decision-making times can vary greatly dependingon the individual and the situation. Another is that it is not always clear where such mental activitiesneed to be factored in (where will users need to think or spend time choosing between options?)and it is important to be consistent if comparisons are to be correct. In keystroke-level analysis,mental preparation steps should generally be inserted before user operations, but this depends onthe operations involved; experience with the method is needed to introduce mental operations in anappropriate way. Some rules for doing so are proposed in [Card 83].
References: S.K.Card, T.P. Moran & A. Newell. The Psychology of Human-Computer Interaction.Lawrence Erlbaum Assoc: 1983.
Cognitive walkthroughsCognitive walkthroughs are used to model how usable a system will be to inexperienced or new users.That is, they provide a means of evaluating how successfully exploratory learning can be done on thatsystem. They are therefore complementary to GOMS models, which focus on experienced usage.
In a walkthrough method, designers walk through a task using the interface, and analyse the processstep by step. Where there are many alternative ways of executing the task, it is sometimes adequateto choose one and sometimes necessary to model a few of these possibilities. In some applicationareas it is necessary to study users in the field in order to understand the tasks they perform, beforewalkthroughs can be attempted.
Walkthroughs are concerned mostly with error handling what errors are possible, how discernible arethey, how easy is error recovery, what are the chances of novice users successfully completing a task,etc. - rather than with performance issues. Cognitive walkthroughs are time-consuming, as all commontasks need to be stepped through and each analysed for a range of different usage conditions.
Empirical AnalysisEmpirical user studies involve testing a prototype system using real users in a laboratory experiment,or by conducting a field study, or through experts applying heuristic evaluation.
It is essential to have at least one pilot study before conducting a test, so that problems with instructions,questionnaires and data analysis can be detected - before time and money is wasted on a full-scaleexperiment. Pilot studies also enable researchers to improve their skills in observing, interviewingand conducting field studies, and to enhance the prototype itself - all of which can lead to substantialimprovements in the quality of the final evaluation.
User TestingIn usability testing, researchers construct a set of tasks for users to perform; measure the speed andaccuracy of the people who execute these, count the number of problems they encounter, and noteproblems encountered, navigation paths used and any interesting or unanticipated events. The test isconducted as a scientific experiment under strictly controlled conditions. Sometimes performance isevaluated against optimal and minimally acceptable times, at other times the experiment is exploratoryin order to improve understanding of user needs and behaviour. Most commonly, two systems arecompared to each other by comparing the performance of a group using the one against that of a groupusing the other. Interviews and/or questionnaires typically follow the test.
Field StudiesThere is a growing trend towards evaluating software in the environment in which it will be used, ratherthan in the laboratory. This enables its usage in natural settings to be observed, recorded and analysed.

Usability Analysis
4
Field studies are essential for critical applications involving health, security or business success,and are strongly recommended for collaborative systems. They are far lengthier than laboratoryexperiments because time is needed for the users to be trained and to adapt to the system in theirenvironment, for databases to be loaded, and for evaluators to obtain sufficient data.
In a field study the aspects to investigate are often finalised only after the system is deployed, oncethe characteristics of usage in that application context become clear. The system should be completeor nearly so, in contrast with laboratory experiments where simplified prototypes are best in the earlystages of the project. Analysis of field studies should emphasise comparison of performance beforeand after the introduction of the system. One of the most valuable results of a field study is often theinsight that the research team gains into the application environment and its demands on the system.
Heuristic EvaluationIn heuristic evaluation one or more user interface experts evaluate a design to identify problems. Acollection of design rules or heuristics is used to guide them. In the sense that expert opinions areobtained, they are the usability equivalent of software inspections and code reviews.
Usability heuristics proposed by Nielson and Molich [Nielsen & Molich 89] include:
• Simple, natural language
• Consistency
• Short cuts provided
• Exits provided
• Feedback provided
• Good error messages
• Minimal memory load
It is best to complement user testing in the field or laboratory with studies that are not dependant onhaving a representative sample of the user population. Heuristic evaluation can be applied in situationswhere cognitive walkthroughs and GOMS analyses are impractical (i.e. for studying situations otherthan the two extreme cases of novice and of routine, experienced usage respectively). Anotheradvantage of heuristic evaluation is that it is performed by outsiders, not the system developersthemselves. Unlike other methods, it requires no advance planning. On the other hand, it is lessrepeatable than other analysis methods, which is why it is preferable to have a number of expertevaluators and to then aggregate the problems identified.
References: J. Nielsen & R. Molich.Teaching user interface design based on usability engineering.ACM SIGCHI Bulletin 21(1), pp. 44-48: 1989.

1
Chapter 15. Introduction to Statistics
Table of ContentsWhat and Why Statistics ................................................................................................ 1Basic Parlance and Ideas ................................................................................................ 2Information Gathering: Correlations and Controlled Experiments ........................................... 3Simple Experimental Design: the two-sample experiment ..................................................... 3Surety in the Face of Variability: Confidence Levels ........................................................... 4The Basics: means, distributions and formula ..................................................................... 4
The Mean ............................................................................................................ 4Normal Distributions ............................................................................................. 5Calculation of Variance and Standard Deviations ........................................................ 6
The t test ..................................................................................................................... 8Comparison of two samples .................................................................................... 8Calculation of confidence intervals ......................................................................... 10
What and Why StatisticsAs software engineers, we need to make informed decisions. The whole process of creating a softwareproduct, from the initial analysis of both the software's context and its requirements through to design,implementation and finally testing, requires the software development team to make decisions.
However, these decisions should not be ad hoc: software engineering, as its name implies, is currentlystriving to become an engineering discipline. As a field, it is working towards finding techniquesand principles that will help to create both reliable and usable software, and to do so in a repeatable,predictable manner.
This underlies the need for our decisions to be informed decisions.
Now, to make informed decisions we need to have information. Sometimes the needed informationis relatively easy to come by, other times not. Even when we have the information we want we canoften be unsure of its value. To help solve these problems we can use methods from the field ofstatistics, an area of scientific enquiry meant for information gathering and analysis. Statistics is themathematical field that concerns itself with decision making, and excels itself with the measurementand quantification of uncertainty.
Statistics is the science of decision making when dealing with uncertainty.
Statistics is useful when the information we need is not straight forward to obtain. For a simpleexample, consider software meant to replace an existing product, with the goal of reducing the numberof errors being performed, both by the software itself, and by the end users of the software. Statisticssupplies us with tools for the measurement of the error rates associated with both the original andnew systems, as well as for the analysis of the final results. It supplies a firm, mathematical basis fordeciding whether the new software reduces the amount of errors, or for concluding that any changesbetween the systems are artefacts of our testing, with the actual error rates between the two systemsbeing identical.
Although statistics is fundamentally a mathematical discipline, its use does not necessarily demandany deep mathematical knowledge. These notes do not concern themselves with the mathematicalunderpinnings of the field. You will not need to be capable of doing more than follow a handful ofsimple formula, each of which use nothing more complicated than simple arithmetic.
Statistics is a large field, and these notes are nowhere near long enough to do anything more thenbriefly introduce the field, giving a hint as to the depth and flavour of statistical analysis. For furtherinformation, the interested reader is pointed to one of the following introductory books on the subject:
• L. Underhill & D. Bradfield (1996). IntroStat. Juta & Co, Ltd: Epping

Introduction to Statistics
2
• R. R. Sokal (1995). Biometry: the Principles and Practice of Statistics in Biological Research.Freeman: New York
Basic Parlance and IdeasStatistics is a tool for dealing with information. We gain information by making observations, bytaking measurements. These 'things' that we measure are called variables. Examples of variables areerror rates or response times in user testing, number of errors per lines of code for software metrics,number of simultaneous connections that a database can carry, etc.
An individual observation is the actual measurement (or observation) of a variable. For example,if 'error rate' is the variable that we are measuring, the actual rate that each person achieves is anindividual observation of that variable. All of the individual observations taken together make up thesample of observations (also known as the sample). In other words, the sample of observations is theset of values obtained when measuring the variable of interest.
There is a special set of observations that needs to be mentioned: the population. The population isthe set of all individual observations about which inferences are to be made. It is the largest sample ofobservations that could ever be taken. How does this differ from a sample of observations? A sampleof observations is defined as being a set of individual observations. The population is the set of allindividual observations. This means that a sample of observations can be a subset of the population.This distinction is necessary because of a problematic fact that occurs in research: it is often extremelydifficult, if not impossible, to obtain all of the individual observations of a variable. Consider thisextended example:
If Microsoft wanted to perform usability testing on their next release of Word, they would first needto identify the variables that they wish to measure, for example the error rates, or perhaps the averagenumber of mouse clicks to perform an operation.
Next, Microsoft needs to obtain individual observations of these variables. The collection of theseobservations is their sample.
Ideally, Microsoft would want to obtain individual observations of each variable from each and everypotential user. However, considering how many people use Word, this is not something easily done.Microsoft would need to satisfy itself with testing only a small portion of Word's potential users.
Because they are not testing all of their potential users, their sample of observations is going to besmaller than it ideally should be: instead of testing everyone, they are only testing some of them.Hence they would only have a subset of the total number of individual observations, a sample of

Introduction to Statistics
3
observations from the population of observations. Naturally, it is the population that one would wantto make inferences about, and one of the goals of statistical analysis is to have our inferences whichare based on a sample of observations remain valid once applied to the population.
Information Gathering: Correlations andControlled Experiments
There are two general methods of determining information about the world:
1. we can either observe the world, noting the relationships that occur between the variables we areinterested in
2. or we can try to manipulate the variables, and then determine what changes these manipulationshave caused
The first method is a 'weaker' form of information gathering than the second, although it is easierto perform and also convenient for the exploratory analysis of data. This method is concerned withcorrelations and regressions, asking questions such as:
• Is there a relationship of some form between the variables we are interested in, and how strong isthis relationship (correlations)?
• If we have values for certain variables, can we predict the values of other variables, and with whataccuracy can this be done (this is known as regression)?
Although extremely useful, correlations (and regression analysis) have one flaw that often means thatwe need to make use of techniques from method two: they fail to make statements concerning thecausality between two variables. Consider:
It can be shown that there is a relationship between users that feel 'stupid' concerning their computerskills, and software that is difficult to use. In other words, there is a correlation between perceivedlevels of one's own 'stupidity' and how 'usable' a software product is. Now, from knowing only that arelationship exists, can one show, whether the system is difficult to use because the users are lackingin computer skills, or that the users perceive themselves as lacking these skills because the systemis difficult to use? This is an illustration of the problem associated with correlations and regressionanalyses: they do not offer a sense of direction in terms of cause and effect. They only state that thereis a relationship between variables, and not what the relationship is.
The techniques of method two are those concerned with controlled experiments. These experimentscontrol all the important factors concerning the variables that we are interested in, and then manipulatesome of these factors in order to determine how they relate to other variables.
Note that experiments differ in two important ways to methods in group one above:
1. Experiments are active: they manipulate variables taking part in the experiment
2. Experiments determine directionality: they can answer questions of cause and effect
There are two types of variables involved in experimental research: variables that we manipulate, andvariables we only observe, and that depend in some way on the manipulated variables. The first groupof variables are known as independent variables, meaning that they do not rely on any other variablespresent in the experiment. The latter set of variables are called the dependant variables, since theydepend on the independent variables.
Simple Experimental Design: the two-sampleexperiment
One of the simplest experimental designs consists of obtaining two samples of the variables that weare interested in. One can see the need for having two samples by thinking about the properties of a

Introduction to Statistics
4
controlled experiment: experiments want to manipulate the independent variables so as to determinethe change that doing so brings about in the dependant variables. This can only be done if we have a'baseline': we need to know what the individual observations for the dependent variables would be ifthe independent variables were not manipulated. Otherwise how can we tell how they have changed?
The sample taken where the independent variables are not manipulated is known as the control group.The sample obtained by manipulating the independent variables is known as the experimental group.
These two samples are then statistically compared to each other to determine if there is a difference thatoccurs between the dependent variables of the two experiments. Without the presence of the controlgroup we could not begin thinking of answering questions of cause and effect.
Note that for a two-sample experiment to work correctly, the only changes between the control and theexperimental samples should occur to the independent variables, otherwise other changes, not beingproperly noted by the experimenters, might influence the dependent variables and corrupt the results.
Not all experiments consist of only two sample groups, there being some that deal with three or moresamples. However, performing and analysing experiments of this kind is beyond the scope of thesenotes.
Surety in the Face of Variability: ConfidenceLevels
When dealing with experiments we often need to know how much confidence we can place in theirresults. This implies that we need to know how well our sample represents the population. In otherwords, we need to know the degree to which our experiment is externally valid.
For example, imagine that we have been hired to replace a company's existing software with a productthat needs to reduce error rates by 15 percent. On testing our new software, we discover that ourproduct reduces error rates by 20 percent. We need to know if our tests hold for all possible individualobservations of the error rates, i.e. for the population of error rates.
It could happen that once we install the software we see only a small reduction in the error rate, orperhaps even an increase. With money at stake, what assurances do we have that the results of ourtesting will hold up in the work environment?
To gain a degree of certainty in our results, statistical analyses are performed on the samples of ourexperiment in order to determine a confidence level that can be attached to the result. A confidencelevel gives us a probability that our results are not within some certain range. For example, a confidencelevel for the above example will give a probability that the new error rate is below 15 percent. Thesmaller the confidence level, the more likely it is that our experiment has valid results.
Often we know what confidence level we are attempting to achieve, and we can then design ourexperiments in attempt to achieve these confidence levels. This 'target' for our confidence levels wecall our significance levels. Note that the only difference between the confidence and significancelevel is that the significance level is target created before the statistical analysis begins, while theconfidence level is the true, calculated level.
If the confidence levels reach the target set by our significance levels, then we say that our resultsare significant.
The Basics: means, distributions and formula
The MeanPerhaps the simplest 'statistic' that is calculated from the sample is the mean, which, as its nameimplies, is the average of the sample:

Introduction to Statistics
5
Figure 15.1. The average
Here N is the number of observations (i.e. the size of the sample), and Xi is an individual observationfrom the sample. The mean is usually represented by:
pronounced X-bar.
We would hope that if the sample was large enough, and constructed randomly enough, that the samplemean would approximate the population mean. Because we usually do not know the population mean,we use confidence levels to give us assurances that the sample mean lies within some distance fromthe true population mean.
The mean is one of the basic units that more complicated statistical analyses are built upon, and willbe used later when performing t-tests.
Normal DistributionsThe end goal of performing statistical research is to learn about the population after only seeingthe sample. One of the assumptions made to simplify this process concerns how the individualobservations are 'spread' through the population. This is known as a distribution.
Figure 15.2. A normal distribution
For example, many populations will tend to have a normal distribution. A normal distribution occurswhen most of the individual observations lie around the population's mean. Fewer observations occurthe more their values diverge from the mean.
If we can assume that the population we are studying has a normal distribution, then we can makeuseful estimates of certain probabilities based on this. For example, it is less likely that the samplemean would lie far away from the true population mean than it is for it to lie close to the mean.

Introduction to Statistics
6
Even though normal distributions each have the same general shape, they can differ from each otherin how quickly their values 'taper off' as you move away from the mean. This 'spread' is measured bya value known as the variance, usually represented as s2. The smaller the variance, the narrower thedistribution. The larger the variance, the broader. The variance needs to be taken into account whenconsidering how close the sample mean could lie to the population mean. Consider two populationsP1 and P2, each, respectively, with a sample S1 and S2. Also assume that P1 and P2 have the samemean, as do S1 and S2, and that P2 has a greater variance than P1. This would allow the sample meanof S2 to lie farther away from the true population mean.
Associated with the variance is the standard deviation, usually denoted as s. Like the variance, thestandard deviation is also a measure of a normal distribution's spread, although in a more readableform: the units associated with the s are the same units associated with the individual observations.The standard deviation defines a range around the distribution's mean (between -1 and +1 standarddeviations around the mean) in which approximately 68.2% of the individual observations lie. Theregion of the distribution laying between +3 and -3 standard deviations of from the mean containapproximately 99.8% of all the individual observations.
Just as we cannot directly calculate the population mean, only the sample mean, we cannot directlycalculate either the population variance or the population standard deviation.
Figure 15.3. The effect of variance
Calculation of Variance and Standard DeviationsAlong with the mean, the variance and the standard deviations form the basic building blocks tostatistical analysis. We have already seen how to calculate the mean, and now we will have a look atcalculating both the variance and the standard deviation.
The first two steps are to calculate the mean, as we have done above, and then to calculate the sumsof squares of differences from the mean:
The squared value is a measure of the distance of Xi (where Xi is an individual observation) to themean, and SS is the sum of these distances. There is an alternative 'shortcut' formula for calculatingthe same value, but which requires less work. It is:

Introduction to Statistics
7
Note that N is, once again, the sample size.
Calculating the Sums of Squares of Differences
We have the following sample of observations
3, 6, 3, 8, 9, 23
First we calculate the mean:
Now we will use the 'shortcut' formula to calculate SS. First we calculate the squared values of thesample:
Next we sum these values:
And then square the mean and divide by N:
And now we perform the final subtraction:
SS = 728 - 12.5185 = 715.4815
And you can check this value by calculating SS using the other formula.
Now that we have SS defined, we can easily define the both the variance and the standard deviation.The variance is simply:
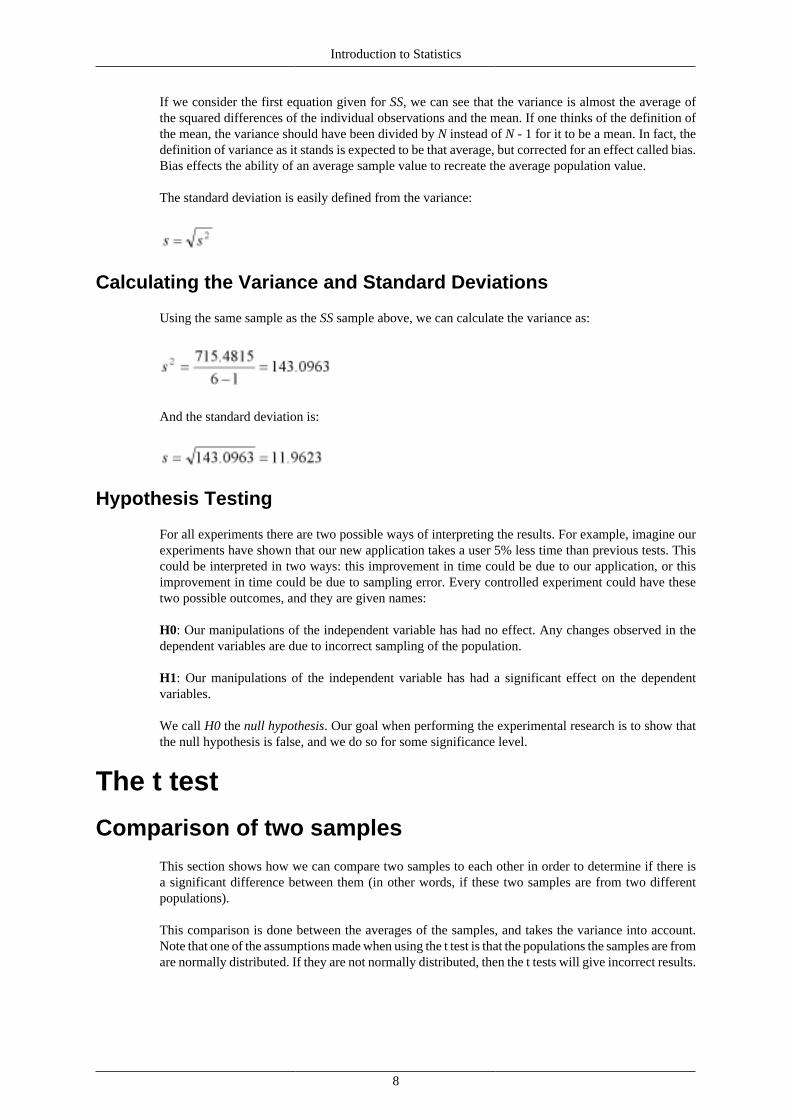
Introduction to Statistics
8
If we consider the first equation given for SS, we can see that the variance is almost the average ofthe squared differences of the individual observations and the mean. If one thinks of the definition ofthe mean, the variance should have been divided by N instead of N - 1 for it to be a mean. In fact, thedefinition of variance as it stands is expected to be that average, but corrected for an effect called bias.Bias effects the ability of an average sample value to recreate the average population value.
The standard deviation is easily defined from the variance:
Calculating the Variance and Standard Deviations
Using the same sample as the SS sample above, we can calculate the variance as:
And the standard deviation is:
Hypothesis Testing
For all experiments there are two possible ways of interpreting the results. For example, imagine ourexperiments have shown that our new application takes a user 5% less time than previous tests. Thiscould be interpreted in two ways: this improvement in time could be due to our application, or thisimprovement in time could be due to sampling error. Every controlled experiment could have thesetwo possible outcomes, and they are given names:
H0: Our manipulations of the independent variable has had no effect. Any changes observed in thedependent variables are due to incorrect sampling of the population.
H1: Our manipulations of the independent variable has had a significant effect on the dependentvariables.
We call H0 the null hypothesis. Our goal when performing the experimental research is to show thatthe null hypothesis is false, and we do so for some significance level.
The t test
Comparison of two samples
This section shows how we can compare two samples to each other in order to determine if there isa significant difference between them (in other words, if these two samples are from two differentpopulations).
This comparison is done between the averages of the samples, and takes the variance into account.Note that one of the assumptions made when using the t test is that the populations the samples are fromare normally distributed. If they are not normally distributed, then the t tests will give incorrect results.

Introduction to Statistics
9
Figure 15.4. t test comparison
The t test involves calculating a value, let us call it t, and then comparing this value to a critical tvalue. This critical value is calculated from a normal distribution, and takes into account your requiredsignificance levels. The critical t value is usually looked up from a table, such as this one
The t test begins by calculating a combined variance for the two samples, using the following equation:
The value N1 + N2 - 2 is called the degrees of freedom (actually, this is a combined degrees of freedom,where the degrees of freedom for a single sample is merely N - 1).
Next, we calculate the standard error of difference:
Finally, we calculate t:
To complete the test requires a table lookup. Note that the table has values for both a 'two-tailed'and a 'single-tailed' significance level. This is named after where in the normal distribution we arelooking for the null hypothesis to lie: the null hypothesis can only be true around the population meanof distribution. If we seek to reject the null hypothesis, we need our sample mean (in this case, thecombined means) to lie far enough away from the population mean in order for us to consider the nullhypothesis as false. This means that we reject the null hypothesis if our sample mean lies at the tailsof the distribution. If we are not concerned in the 'direction' that the sample differs (i.e. whether it isgreater or smaller than the population mean), we use the two-tailed test. Otherwise we use the single-tailed test. We look up a value for the degrees of freedom and required level of significance. If ourcalculated t value exceeds the t value from the tables, then we may reject the null hypothesis.
Note that if we are using a two tailed test, we must ignore the sign of our calculated t value (i.e. if ourcalculated t value is negative, ignore the negative sign).
Using the t test
Suppose that we have two samples

Introduction to Statistics
10
S1: 3, 6, 3, 8, 9, 23 S2: 8, 11, 12, 4, 15, 19
First we calculate SS1 and SS2. SS1 has been previously calculated, and is 715.4815.
Similarly, SS2 is 908.9583 (the reader can confirm this using one of the equations given for calculatingSS). Next, we calculate the combined variance:
We now calculate t:
Now we use the table above to look up a two tailed critical t value (two tailed because we are lookingto reject a null hypothesis that could occur at either end of the distribution). Our degrees of differenceis 10, and our chosen significance level is 0.05 (i.e. there is a 5% chance of the null hypothesis beingtrue). Looking in the table, we see that our critical t is 2.228.
Ignoring signs, we see that our calculated t is less than our critical t, and so we cannot reject the nullhypothesis, and must conclude that the two samples came from the same population.
Calculation of confidence intervalsSometimes it will be necessary to compare the mean of a sample to some value. For instance, perhapswe would like to know if the number of user errors is less than a certain upper limit. Although thiscomparison can be easily made (you just compare the mean to this value), we would still like to knowthe confidence levels associated with this. We can use the t test to do this.
In the case where we only have one sample, the t test is still calculated in a similar manner to theabove, with the only exception being that the formulas are now simply changed to reflect the fact thatonly one sample is being tests.
Figure 15.5. The tails of a distribution

Introduction to Statistics
11
This method of comparison is performed by constructing an interval from the two extreme positions inwhich the population mean may lie. This interval is called a confidence interval. This interval shouldeither lie completely above or below the stated limiting value. For example, if we need the number ofuser errors to be below 10 per day, then this whole interval must lay below 10 per day. On the otherhand, if we wanted to show that the error rates where now above 10 per day, then the whole intervalwould have to lie above this value.
The simplified version of the t test is as follows:
Note that the standard error of differences is now called the standard error of the mean. Now, insteadof calculating a value for t, we calculate the interval:
Where c is a value looked up in the above t test table. It is looked up for a given significance leveland degrees of freedom (which in this case is N - 1). In other words, we can choose the maximumsignificance level, and compute the corresponding confidence level from that. Note that for any givendegree of freedom, smaller significance levels give larger values of c, forcing our confidence intervalsto become larger and larger.
For this test we use the one-tailed values. This is because we are interested in our sample mean beingeither larger or smaller than a given value, but not both.
Confidence Intervals
For the sample
3, 6, 3, 8, 9, 23
determine if the mean of the population that this was drawn from is below 10.
We first begin by calculating SS, as has been done previously. The relevant information is repeatedhere:
SS = 715.4815
Note that the sample mean is below the value 10. Calculating the confidence intervals (note that fromthe formula for determining the interval we can see that this interval always lays around the mean) fora given significance level, and seeing that this interval is below the value 10, will allow us to concludethat the population mean is below the value 10 at the given significance levels.
Now we calculate the variance, which is:

Introduction to Statistics
12
We now calculate:
Let us choose a significance level of 0.05. We need to remember to use a single-tailed value. Our cis 1.943.
Next we calculate the intervals:
So our interval lies from -0.8222 to 18.1554. Comparing this with 10, we see that the interval does notlie completely below this interval: 10 lies within the interval. Hence, at a significance level of 0.05,we must conclude that the population mean is not below the value 10.

1
Chapter 16. The writing process
Table of ContentsThe role of writing in research ........................................................................................ 1
Writing up throughout research ............................................................................... 1The Research Diary ............................................................................................... 2Follow-up notes .................................................................................................... 2Meeting minutes ................................................................................................... 2Writing to get feedback ......................................................................................... 2Giving feedback to others ....................................................................................... 3Getting started ...................................................................................................... 3Overcoming writers block ...................................................................................... 3Overcoming fears when it is done ............................................................................ 4Writing as a team ................................................................................................. 4Obtaining assistance .............................................................................................. 4
Sections and Kinds of document ...................................................................................... 4Document structure ............................................................................................... 4The Introduction ................................................................................................... 5The Conclusion .................................................................................................... 5References ........................................................................................................... 5The Abstract ........................................................................................................ 6The extended abstract ............................................................................................ 6The thesis ............................................................................................................ 6
How to write well ......................................................................................................... 6Preparatory steps before writing .............................................................................. 6The three types of IT publication ............................................................................. 7What to cover ...................................................................................................... 7Writing Style ....................................................................................................... 8Visual presentation ................................................................................................ 8Tables ................................................................................................................. 8Charts ................................................................................................................. 8Graphs ................................................................................................................ 9Preparing to submit a paper .................................................................................... 9Timing your submission ....................................................................................... 10
Presenting evidence and argument .................................................................................. 10Convincing readers of your results ......................................................................... 10Claims and evidence ............................................................................................ 10The place of argument in research .......................................................................... 11The structure of an argument ................................................................................. 11Arguing your case ............................................................................................... 11
Criteria for publishable work ......................................................................................... 12Is your work publishable? ..................................................................................... 12Focus ................................................................................................................ 12Originality .......................................................................................................... 12Significance ........................................................................................................ 12Concerns about your contribution ........................................................................... 12
The role of writing in research
Writing up throughout researchThe most important and lasting output of any research are the publications that document the ideasand results. Despite its vital nature, both novice and experienced researchers frequently delay writing

The writing process
2
up their work because they find writing difficult, and because they lack confidence and are afraid toexpose their work to critical review.
It is best to make writing up an integral part of any research activity from the very beginning. Notonly will this mean that style improves with practice, but equally importantly, it also gives importantdeliverables along the way. By documenting what is done and what is learnt throughout the researchprocess, you ensure that no work is ever wasted. Much time spent in writing is in fact time spenttackling a problem away from the computer. This is not tedious at all it is extremely valuable. Whenwriting up research one often discovers improvements, alternatives or problems which were notapparent before. This new vision is fed right back into the system/solution being described, and thefinal product substantially better as a result of reporting on the work.
The Research DiaryA diary keeping track of your actions, questions, problems, attempts that failed and solutions thatworked is an invaluable tool for organizing yourself, recording your progress and helping yousubsequently write articles on your work. Write down speculations, problems, possible solutions,random ideas, references to follow up, notes on your readings, interesting quotes, paper outlines, and soforth in the same diary as they occur to you. Read through this regularly to see what occurs frequentlyand how such ideas are evolving, to avoid solving the same or a similar problem more than once over(and avoid repeating what proved fruitless), and to have encouraging evidence that you have not beenidle and are indeed making progress.
Benefits of keeping a research diary:
• it provides a reminder of ideas, experiences and actions which would otherwise be forgotten laterwhen you come to report your research
• it gives practice in writing and makes writing a natural part of the research process, rather thansomething seen as a hurdle to avoid as long as possible
• it is a source of comfort and support, particularly if you write down not only problems and solutionsbut also your feelings of frustration, fear or lethargy
• it is encouraging evidence that progress is being made, and that you have not been idle
Follow-up notesYou should also keep a collection of follow-up notes each describes a problem or idea that occurred toyou while focused on some other task, which could not be considered at the time but which someonecould investigate in the future. If you do not jot these down (about a page or two on each) they willbe forgotten altogether or remembered incorrectly.
Meeting minutesAnother form of ongoing writing involves note-taking at research meetings. Ideally, you should haveregular meetings with your supervisor as well as regular meeting with the entire research groupworking in your field of interest. These notes document progress and decisions taken, and providea quick way of remembering the context from one meeting to the next. Meetings themselves areimportant, to make sure you are on the right track, to discover any problems or relevant research ofwhich you were unaware, and to share ideas with others to learn from their feedback so don't be afraidto speak out, even when you are unsure if your thinking is sound (in fact, especially then!)
Writing to get feedbackA successful researcher should actively seek criticism. This is hard for us all, and particularly so if yourpersonality is not suited to this, but remember that it is a part of the research process, and a key one atthat. You will learn resilience to destructive comments and how to listen carefully to constructive, valid

The writing process
3
criticisms. In order to invite criticism, you must present your ideas to others. Much of this will be verbalmake a point of attending conferences, seminars and other events where academics or practitionersget together, and talking to people about your work. Give presentations yourself wherever you can,and if necessary ask your supervisor to arrange a forum where you can do so.
You can also write pre-publication-stage papers to show people in order to gain feedback. Take thesame care with writing these as you would if you were submitting the paper for publication, as it is justas important to make your points clearly to the reader. You should therefore write papers regularlyduring your research, either to give to others directly or as preparation for a presentation. You will seethat explaining your work often leads you to detect where your own thinking is faulty or incomplete.Feedback and criticism naturally can result in finding better ways of solving problems, can show uperrors early and so reduce wasted time, and can point out aspects which you have failed to noticeyourself. It also shows up which parts of your research are the most interesting or innovative, andwhich are the hardest to convince people of, and as a result you will be better focused thereafter.Feedback from readers of pre-publication writing will also improve the quality of your subsequentwritten and oral presentation.
Giving feedback to othersGiving feedback to others is also an important ingredient of research. It sharpens your critical thinkingskills, enhances your confidence and exposure, and increases the likelihood of others giving youfeedback in turn. In addition to active involvement at research group meetings, conference talks andseminars, it is very helpful to volunteer to review papers for a journal or conference programmecommittee. If you are too inexperienced to do so personally, you should tell reviewers in yourdepartment that you are keen to help them. A written review or critique should be structured, preferablyfrom high-level comments down to lowest-level nit-picking criticisms relating to e.g. grammatical andtypographical errors (and of course nit-picking should be avoided altogether unless the paper will beconsidered for publication). High-level comments give ones overall impression of the paper, suggestimproved organization and presentation of the content, mention related work that has been omitted,and ask questions about alternative approaches, additional supporting evidence, future extensions andthe like. To be constructive, try wherever possible to suggest an improvement rather than simply statewhat does not work.
Getting startedThe best way to get started is to simply aim to get it written down, without regard for style or level ofdetail. Later on, you can improve the structure and language, add details, figures, discussion, examplesand so on the important part is to get over the hurdles where you cannot face starting or fail to makeprogress because you are overly concerned about writing perfectly. Start with the part you considereasiest, to help you get going. If you encounter parts where you struggle to explain the work, jot downrough notes to yourself about what should be covered and keep going. The more you write the easierit becomes, and you will find it less difficult to tackle those sections when you return to them.
Overcoming writers blockProcrastination is common, particularly at the start of a writing task. Generally, once the process is setin motion, it is much easier to continue, to extend and refine what already exists. Some activities toget you going at the outset or when struggling to proceed, are:
• make notes on interviews, observations, experiments being performed
• make notes from your research diary
• make notes on any recent discussions with colleagues, team members and others
• draft the outline of a chapter or section, or produce a mindmap
• talk to someone about something that needs to be written

The writing process
4
• work on a diagram, table, reference list or bibliography
• talk to a tape recorder or Dictaphone
• imagine you have to teach a class of students what you have done
• describe the work in the simplest possible way, as if you were talking to a lay person
If you can, enlist the help of friends and colleagues who can offer support, chart your progress andgive feedback on rough drafts. The best such helper is a fellow student who is writing their dissertationat the same time you can reciprocate, and indeed benefit from seeing how they present their work(identifying through reading their thesis both techniques that work well and mistakes that you shouldguard against yourself).
Overcoming fears when it is doneWhen you reach the stage of writing your final report, it is often the case that your work seems obviousand insignificant, and this diffidence can cause you to delay the writing unnecessarily. Rememberthat your perspective arises from your familiarity and experience with the piece of research (whichhas increased enormously since you started), and your work will be more interesting to others than toyourself because of this. Cast your mind back to your original plans and ideas, and this will usuallyshow clearly that the work you are now presenting is not obvious at all.
Writing is hard work, but it is the most important product of your research, and its rewards aresubstantial.
Writing as a teamIf you are writing as part of a team, it is important to decide on a team leader from the outset. Thegroup should write side-by-side, taking turns to write and revise different sections, and discuss the taskas much as possible. With this approach, differences of opinion can be accommodated by agreeing todisagree for the present and return to the issue later in the process.
Obtaining assistanceMany universities have units or individuals who help students with writing. If you are unhappy aboutthe writing you are doing, or if you are not writing in your home language, then you should visit such afacility to get help and advice. If there is more than one such person, try to make an appointment withthe one whose background is most suited to your research field. Before arriving, prepare an outlineof the document and two copies of the current draft. One copy should be kept clean, the other used tohighlight the key phrase of each major section, and to annotate where there are concerns about specificpieces of writing that seem unsatisfactory. It is important to take notes when meeting with the helper,particularly about what needs to be done next, otherwise it can be very difficult to remember specificpoints raised after the visit, when writing is resumed. A similar approach should be used when studentsmeet with their supervisors during the writing-up stage of the research.
Sections and Kinds of document
Document structureA report, thesis or paper must include:
• the context in which the research was done (the study area/problem, motivation behind the project,assumptions made, and how the work relates to existing literature)
• the key issues, ideas or questions (introduced at the outset, forming the thread that ties togethereverything that follows, and addressed in the conclusion to demonstrate what has been learnt)

The writing process
5
• the approach used, any experiments conducted and an honest evaluation of results
• a good structure and adequate linkages to make it easy for readers to find their way through thedocument, understand how sections relate to each other, and be able to start reading at any sectionand still understand the material.
The broad structure of the document follows from the above skeleton context, questions addressed,approach, experimentation, results. In addition, an abstract upfront summarises the work; the keypoints are presented in the introduction before being developed in the body; and the main results arebrought together in the conclusion.
The IntroductionThe introduction is the most important part of any writing, as few readers will read more than this,particularly if you don't grab their attention here. This means you should get to the point directly atthe very start of your introduction. Many papers will instead start with grand sentences describing thetopic or research context. To those who are knowledgeable in the field, this is a waste; to the rest, itis partly or completely incomprehensible. Even if you manage to briefly define the field in a way thatresearchers outside this field can understand it, this will not help if the rest of the paper is such thatthese readers cannot follow the material anyway.
Make it clear from the outset whether or not the system you describe has been implemented and used.The reader has a right to know from the beginning, and certainly this information must not be omittedentirely. If the work has been implemented, describe its usage as precisely as possible in what follows:who has been using it, for what purpose, and with what results. If this usage shows that the idea has notworked out as expected, this is generally just as publishable readers can learn from such an experience;negative results also contribute knowledge to the field.
Establish carefully, from the start, the assumptions and constraints on which the work is based, andhow sensitive it is to these. Discuss why these assumptions are realistic. For example, if the paperdescribes a design which has not been implemented, convince the reader that it has taken into accountthe true characteristics of components used; a theoretical paper must similarly show its assumptionsreflect reality.
The ConclusionConclusions should integrate the results of a paper and bring out the most significant ideas or results ofthe work. Be careful not to repeat much of your introduction in the conclusion rather give perspectivethat was not possible until the paper had been read, and focus on what lessons your readers should takeaway with them. This is the reason the work is published, so state this clearly to ensure that peoplebenefit from the paper, and don't repeat what you have done. Give the context or scope in which theselessons can be applied, by explaining to what extent your ideas are generalisable, and making clearwhat assumptions or constraints you have incorporated. The conclusion is also a good place to mentionor discuss conjectures, wish lists and open problems.
ReferencesWhen you develop the content of your paper, you will naturally cite papers you describe or mentionalong the way. These are then gathered together and form the first draft of your References section,most of which probably come from that part of the paper where you compare your research withrelated work. Remember that your references are there to ensure that any reader, including one lessknowledgeable in the field, is able to fully understand your work without you having to describeeverything in detail. Papers with ideas that you have built on, should be added to your references forthis reason; it also enables you to briefly acknowledge your debt in the body of your article.
Make sure that you reference the most accessible paper on the work you are citing journal or conferencepapers rather than departmental technical reports - and avoid personal communication or unpublished

The writing process
6
paper references wherever possible. Researchers should read and cite authoritative and recent sources,and avoid unreliable sources such as unrefereed articles or Internet publications.
Some documents require references, others a bibliography and, more rarely, there are still others thatrequire both. References provide details of the works you have mentioned in your text; bibliographieslist all relevant material you have consulted during your research (and are hence a super-set of theReferences).
The AbstractThe abstract should be a summary of the technical content of the paper, not a prose table of contents asis often the case (e.g. This paper reviews and presents a solution based on . We describe how this hasbeen implemented, and give performance results for the system, concluding with several directionsfor future work). State the assumptions on which the work is based, the idea/approach used, and theresults. Focus only on this; leave out discussion and argument, and avoid the passive voice. As manypeople read only abstracts, these should be as specific and precise as possible. Write the abstract first,so that this focus is there from the beginning, to keep you from straying into irrelevant descriptionsin the rest of the paper.
The extended abstractAn extended abstract is not a lengthy abstract, but a very short paper. Its purpose is to communicateyour ideas clearly and concisely so that others can quickly understand the essentials of your research;it is also often used to judge your work (e.g. by funding bodies, conference organizers, potentialsupervisors or collaborators, etc.)
The extended abstract should thus summarize the research, its context, how it was executed, and theresults. It should motivate and explain your contribution, comparing it to related work and showingkey results in a way that is easy to assimilate, such as graphs and figures. Do not cover anything thatisn't essential to understanding the main ideas that you wish to convey (e.g. future work or insignificantimplementation details).
The thesisEvery institution has standards and conventions expected of their Masters and PhD theses, and it isnaturally important to obtain these guidelines early on, and also to look at examples of (good) thesescompleted in the recent past. Generally a thesis comprises at least the following sections: Abstract(an executive summary), Introduction (research goals/questions, with motivation, and an outline ofthe thesis content that follows), Literature review, Project description (covering some or all of thefollowing: theory, algorithms, designs, implementation, experiments, results), Conclusion (a summaryrelating back to the goals/questions set in the introduction, giving your main findings and an indicationof future work).
How to write well
Preparatory steps before writingMost research is part of a pipeline building on what others have done before, and in turn hopefullybeing built upon by researchers in the future. As such you have a duty and a responsibility to documentyour work well.
When making a presentation it is important to know your audience and tailor your talk accordingly;it is equally important to know your community of readers when you are writing. This is establishedfrom what you know of the book, journal or conference where you are submitting your work, and canrequire some extra effort to discover, if you are not familiar with that publication or forum. To writeappropriately for your readers, you must know how much knowledge they are likely to have of the
The writing process
7
general subject area as well as the specific topic you are addressing, and whether they have a specialinterest in it (e.g. some journals emphasise theory and others practice/experience). At the very least,authors must take into account how well the problem they are tackling is known to their readers, andif it is considered important (if only a few have this opinion, the document will have to convince theothers early on).
It is helpful to look at review forms when writing your own papers, particularly if you (or yoursupervisor or colleague) have in the past conducted reviews for the very journal or conference serieswhere you are hoping to publish. Naturally you should also carefully study the guidelines for thatparticular journal or the call for papers of the conference you are interested in.
Re-read papers which you noted as being easy to follow, particularly if you are finding some materialdifficult to put across clearly and concisely yourself
Both the research and the writing tasks are greatly facilitated if these highly daunting objectives arebroken down into smaller task of more manageable size. The sub-tasks should not be the same size orlevel of difficulty, so that one is more likely to find the best thing to tackle according to the time andenergy of the moment. If you are feeling tired or demotivated, you can have the satisfaction of gettingall or some of a simple part out of the way choosing a straight-forward section to write ; when you areenergetic and enthusiastic you can choose to tackle the more challenging sections.
The three types of IT publicationThere are three basic types of Computer Science paper:
1. engineering papers describing an implemented system in its entirety, or parts of such a system, toillustrate a specific theme or idea
2. concept papers describing an unimplemented system that uses a novel technique or idea
3. theoretical papers covering formal aspects of computing, performance modeling, securityverification and the like
Implementations are extremely expensive, so an engineering paper reporting on an implementation ofan existing- and still unproven - concept paper is very valuable and deserving of publication. This isequally true if the implementation confirms or refutes the claims of the concept paper. Reviewers aremore skeptical of concept papers, so the standard expected of ideas in such a paper is much higher.If there is any doubt, reviewers will recommend implementing and using the proposed system beforesubmitting the work for publication.
What to coverOne of the main differences between a good and a poor presentation of a piece of work is an appropriatefocus. Avoid the temptation to write down something because you know it (when giving backgroundto the research) or have done it (when describing your contribution). Cover only what is necessaryto understand your main idea, and give just enough detail for your reader to follow. Compare andrelate your research to existing work, to demonstrate your contribution and also to help the readerunderstand your goals and your approach better. For example, mere references, as in The system isbased on the model of A[1] using the language of B[2], with the algorithm of C[3] as extended byD[4] employed for . are not adequate. Poor description of related work may not be this blatant, butmany papers do frustrate readers by omitting one or two sentences that could have saved the readerfrom find and reading the referenced work.
If your paper describes a system, decide at the outset whether you are presenting it in its entirety orjust one aspect, and then write the entire paper accordingly. This will serve you much better than anarticle which tries to do both, changing between overview and focused writing as it proceeds.
A paper that simply describes a system/solution/task is far less informative than one that also makesmention of ideas and avenues of exploration that proved fruitless or inferior. You should also include

The writing process
8
alternatives considered by not explored. It is therefore better to outline the path followed during yourresearch, rather than simply presenting the final product as if you went directly to this solution.
Writing StyleIt is not easy to describe the work you have done briefly yet adequately this requires good writingas well as a good structure/organization to the document, with appropriate figures to refer to.Structure your paper carefully, and follow normal practice for the type of paper and publication,where appropriate. For example, most theoretical papers have a format comprising definition, lemma,theorem, example, corollary.
Avoid forward references ( as described later in section N). If you are forced to use them, give at leastan outline of the term/idea to be covered later, so that the reader can continue with some notion ofwhat this is, even if the details have not yet been given.
Visual presentationMake sure that the visual impact of your paper is not displeasing, as this will give an initial impressionof sloppiness which reviewers will then associate with your work as well as its presentation. Considerusing latex and bibtex for your documents, which are particularly geared towards scientific writing.Bibtex is a useful way of organizing your references, since latex will automatically lookup referencesneeded in a document from among all the references you have collected. If you are not good at layoutand visual presentation, find a colleague who is and ask them for help.
Tables, charts and graphs can tell a story more concisely and strikingly than textual description, and areconvenient ways of showing large amounts of information. Tables are more precise than graphs andcharts, and encourage readers to interpret the information for themselves. Charts and graphs are morevisually appealing and are a way of bringing a specific point home clearly - charts particularly effectivefor highlighting differences in values when the number of values is relatively small, and graphs moreeasily showing many values and more readily showing trends. Tables, charts and graphs should beclearly labeled the axes named and units of measure given, multiple bars or lines distinguished andlabeled separately, and the entire figure given an appropriate caption. Effective documents use simplewriting. They contain interesting examples to illustrate ideas. If program code, models or mathematicsis used, this is also explained in plain English. If your first language is not the language of theconference or journal, it is essential to find a suitable person for whom this is their native tongue, andhave him/her improve your writing with you. On the other hand, if the conference/journal languageis also your own home language, remember that non-native speakers will be reviewing and readingyour paper, so keep to simple sentences and plain language.
TablesThe rows and columns of a table should be given in a logical order, such as alphabetic order,chronological order, increasing/decreasing order, ordered from parts to wholes/totals, etc. Where itmakes sense to do so, include totals, averages and medians. Lay the information out with independentvariables in different rows and dependent variables as the different columns, and if the table is longor has logical subsections, leave blank lines between rows where appropriate. Tables are mostly usedto present numeric data or results, but can occasionally be used for text entries, as long as this is notan oversimplified representation of the information.
ChartsSimpler bar charts are generally easier to read than stacked bars, and 3-dimensional bars are bestavoided altogether. If stacked bar charts are used, it is best to keep the darkest shades at the bottomand the lightest on top, as people tend to over-estimate the size of the dark areas, and use numbersor connecting lines to clarify relative proportions. In general, numbers at the end of each bar help tomake the chart more precise and easily readable. Bar charts are usually read from left to right (or fromtop to bottom, if bars are arranged to lie horizontally one above the other). You can use this fact to

The writing process
9
order the bars in a way that highlights the point you are trying to make e.g. to show an increase ora decrease. Pie charts are usually less informative than bar charts, and particularly ineffective whenthere are many segments or when some segments are particularly small. If you must use a pie chartto specifically show proportions, then arrange the segments clockwise in a logical order (e.g. fromlargest to smallest), and explode or make darkest the segment which is most significant (if applicable).
GraphsGraphs can take the form of lines, connected points, or area plots (which represent proportions byshading the spaces between the lines). For area plots, as for stacked bar charts, it is best to have thedarkest shades at the bottom and the lightest on top. Area plots are harder to interpret than conventionalline graphs, because all but the bottom value are visually affected by the lines below them (i.e. oneneeds to focus on the area between the lines, but it is natural to look at the line itself instead). If severalgraphs are shown on the same set of axes it is important to clearly distinguish the individual lines.This is particularly important with graphs having more than three lines, as these are difficult to readif the lines cross each other. The choice of axis for a multi-line graph, as for a bar chart, can affectthe readers interpretation in subtle ways for example if percentages rather than absolute values areplotted, differences will be accentuated and appear greater than they really are. If the axis range issmall, differences are also accentuated: for example, a difference of 10 looks small if the Y-axis rangesfrom say 0 to 100, but looks significantly large if the Y-axis ranges from say 80 to 100. Hence the Y-axis should be carefully selected to show what is scientifically significant in the given context.
Preparing to submit a paperWriting is an iterative process. As new sections are written, others already drafted are revisited andrefined - in the light of the new context, by incorporating what has been learnt by the writer since thatsection was last tackled, because the text is being reorganized, to reduce the length, etc. As with anycyclic process, it is important to recognize when to stop.
When examining drafts, put yourself in the shoes of a reviewer and ask if there is undue emphasis or de-emphasis of any aspect, or any worrying omission; and write down the main strengths and weaknessesof the paper. Consider changing the paper to address these, or stating in the paper why you have notdone so.
If your document is too long, read it critically for clauses, sentences and sections that are not needed bythe reader at all or that could be summarized briefly instead; delete references and quotations which arenot essential; and replace lengthy descriptions by diagrams or tables (with brief explanations) wherepossible.
• A checklist such as the one below can be used to determine whether a draft is ready for submission:
• title page contains all required information
• number of pages is commensurate with expectations
• appropriate citations have been included and all are listed in the references or bibliography in fulldetail
• spelling and grammar have been checked throughout the document
• the text adheres to the requirements set out by the institution or journal
• each chapter and section is complete and covers the appropriate material
To check your spelling and grammar, make sure you use only complete sentences, and avoid jargonand slang. A spelling checker and word processor, and a friend who is not a Computer Scientist, canhelp with this, particularly as they will not be distracted from their task by the content (as you arelikely to be). Be consistent in your style throughout your document, for example do not use the thirdperson almost everywhere and then suddenly write a section in the first person (etc.)

The writing process
10
Timing your submissionFor successful publication, your paper should be:
• Technically sound
• Correctly timed (the work is complete, rather than almost complete)
• A clear and focused description of your work
• With results adequately and convincingly demonstrated
• Making a sufficiently important/significant contribution that others can build upon
• As interesting and thought-provoking as possible
Make sure that you do not submit your work for publication prematurely. While it is tempting to submitto a conference work that you expect to have finished by the time the conference takes place, thereviewers of your work cannot take your word for this, and will generally advocate that you resubmitwhen the research has indeed been completed. Under no circumstances should you submit a paper thatis incomplete, with notes such as to be included in the final draft.
Presenting evidence and argument
Convincing readers of your resultsThe key question that readers and reviewers of your paper will ask is whether you have convincedthem of the validity of your conclusions. If not, your paper will not lead to others taking up your ideasand using or building upon them, and hence your work will not form part of the research pipelinethat advances the subject. Make sure you give enough evidence in the way of arguments, analysis,surveys, measurements, proofs or evaluations. Try to avoid omitting issues whose absence is likely toconcern your reader. Where you have chosen between alternative design or implementation options,explain how and why you did so; and in general remember to discuss not only what has been done butalso why. Mentioning alternatives that were not implemented or investigated can in itself be useful toreaders by suggesting to them possibilities for future work. One of the best ways to convince peopleof your conclusions is to run experiments or case studies to confirm your claims (whichever is mostappropriate to your task or innovation). Any activities you conducted to convince yourself that yourresearch goal has successfully been achieved should also be described. You should also explain whyyou chose particular evaluation methods and approaches, in the same way as you give reasons forother aspects of your research.
Claims and evidenceEvery paper or thesis has at least one major claim, the point of the research being presented. This isthe core of the piece of writing, and should have the following properties:
1. It is a conclusion reached, rather than a statement on what has been done (e.g. < X > outperforms< Y > rather than we compared < X > and < Y >)
2. It is new and contestable rather than unsurprising (if readers accept the claim immediately, withoutpuzzling over why it should be the case or whether it is true, they will not bother to read muchfurther)
3. It is precise and specific (e.g. Under conditions < Z >, < X > outperforms < Y > because < W >)
If a claim has been explicitly stated as a specific conclusion/result, it naturally provides a numberof pointers as to where evidence is needed and what type of evidence is required. Evidence mustbe accurate, and if any data or measurements are of questionable quality, this should be explained.

The writing process
11
The experiments conducted should be adequate for the topic of a suitable size and sufficientlyrepresentative of the area or population studied. For example, enough users should have participatedin the study, or databases/workloads of suitable size tested, etc. In presenting evidence, be as preciseas you can sensibly be for your particular context, replacing fuzzy language such as a great deal,some, frequently etc. with more concrete evidence like 60% (or whatever value applies, given withappropriate precision).
The place of argument in researchAll research requires some argument, if only to convince others that your idea/approach is sound andbeneficial. Argument is also needed to illustrate why your conclusions follow from your results, whyyour survey/case study/experiment uses appropriate measurement indicators, samples and analyses;why you interpret your observations in a particular way, and so forth.
The structure of an argumentMost people find arguments arising in the course of a conversation easy to handle, and doing so inwriting should not be much more difficult. The main differences are the degree of confidence required(as writing will hopefully be critiqued by many) and the need for an author to cover both sides of theargument. A typical argument involves the following: on the one hand, a claim, with evidence andreasons to support it, and with qualifications indicating under which conditions it holds; on the otherhand, questions and rebuttals from those unconvinced or unclear of the extent of the claim. An authorshould cover as much as possible of both aspects in order to convince the reader.
An argument in a piece of writing therefore has the following ingredients:
• A claim
• Evidence to support the claim
• An explanation why the claim follows from the evidence
• Qualifications indicating the limits/conditions under which the claim holds
• Reservations, questions and rebuttals that could come to mind, with responses that address these
Arguing your caseArguments begin by stating premises and using them to derive new facts. Premises come from factsand definitions established in the literature (quote the source so that skeptics can find details), fromthe conclusions of previous arguments, and from observations made in the course of the research.Examples are widely used to strengthen arguments an argument that something exists needs just oneexample, a complex argument may also have just one or two examples to illustrate at the same timeas clarifying what is meant; arguing that some phenomenon is common or generally causes another,requires a number of diverse examples to convince the reader.
The reasons why the evidence supports and justifies the claim should be given explicitly in a sense,evidence is much like a sub-claim which must itself be explained and justified by further evidence.A collection of quotations from other documents and numbers from experimental results does notconstitute evidence unless the author critically analyses and explains their meaning and interpretation.The point of a graph, table or chart should be explicitly given so that the significance of the datapresented there is clear.
To cover the other side of the argument, i.e. to address concerns the reader may have, an author canstart with their own earlier ideas, describing those which were tried and explaining why they wererejected. Awareness of how a claim contradicts existing belief or practice is essential knowledge,and this aspect must be addressed directly. The evidence should be read critically from an outsidersperspective to identify any alternatives or problems a reader might see; each of these should then be

The writing process
12
described and refuted or conceded. Some typical objections: the author is oversimplifying the problem,counter-examples haven't been considered, etc.
Criteria for publishable work
Is your work publishable?The primary purpose of publication is to present innovative and important contributions to the subject.One way of demonstrating that your work has these properties is to point out who will benefit fromyour research, and how. Another is to explain how your work differs from similar or related papersalready published. A paper must have focus, originality and significance to be worthy of publication.
FocusFor each original idea you believe your paper is contributing, describe it in a single paragraph, tomake sure that the contribution is clearly and explicitly stated. This paragraph/paragraphs should thenbe placed upfront, in the abstract, which people read first. If you cannot describe the idea in a fewsentences, then you should not write the paper until you understand it better. Develop the idea further,formulate it in more detail, apply it in case studies or experiments, or modify it in some way until youare able to capture it clearly and concisely.
OriginalityThe most important criterion for publication is that a paper contains at least one original idea. Toensure this is true of your research, you must be sufficiently familiar with existing knowledge in thefield. The most common failing of rejected papers is that the system/solution/theory/model/language/approach they describe is isomorphic to an existing one described in the literature. Therefore, youmust first and foremost make sure that your literature search has been thorough.
Look critically at your bibliography: if it comprises mainly seminal works, check that a recent paperhas not already published something that you are repeating; or if you reference mainly recent work,check that your idea was not proposed a long time ago. And when you come to convince the reader thatpublished works differ significantly from your own, make sure that you have actually read the papersyou reference (rather than merely heard of them). Then you can explain the differences explicitly andthoroughly, and can argue more convincingly particularly for those readers who actually have readwhat you reference!
SignificanceIf your idea is original and can be succinctly explained in this way, the next question to ask yourselfis how much of what still remains to be said is simply a variation on existing work. If the answer isvery little, consider thinking more creatively and extending your research before submitting the paper.If you are writing a paper where the main contribution is an extension or variation of existing work,ask yourself honestly whether the difference you describe is sufficiently significant to truly warrantreading all the pages you are filling. Alternatively, consider publishing the idea as a short note, shortpaper or even a poster. It may be that you are planning a journal paper when your work would be moresuitable for a conference presentation. Journal articles are typically longer than those in conferenceproceedings, as they should be the more significant contributions to the field, whereas conferencesaim at disseminating new ideas widely and rapidly.
Concerns about your contributionIf you encounter a paper which seems to present what you are aiming to do yourself, remember it isvirtually impossible to be exactly identical. It may be tackling a similar problem/task using a similarapproach. Discoveries of such papers are common in research (particularly if the work is very recently

The writing process
13
published, or is not easily accessible). Add the paper to your literature review, and critically evaluateit with a view to improving your own project. Use the paper to compare and contrast with our ownresearch, and study with interest where it confirms or refutes your own ideas.
Another concern that often arises when writing up research is the feeling that the ideas are little morethan common sense, unworthy of publication because they are obvious or uninteresting. To overcomethis problem it is best to get another's opinion, and to review early entries in your research diary toconvince yourself that the contribution only appears straight forward due to familiarity with the project.

1
Chapter 17. Research Presentations
Table of ContentsResearch Presentations ................................................................................................... 1
The Importance of Presentations .............................................................................. 1Presentation Goals ................................................................................................ 1Choosing what to Cover ......................................................................................... 2The Structure of a Research Talk ............................................................................. 2The Introduction ................................................................................................... 2Related Research .................................................................................................. 2The Body ............................................................................................................ 3Technicalities ....................................................................................................... 3The Conclusion .................................................................................................... 3Knowing Your Audience ........................................................................................ 3Illustrating Ideas with Examples .............................................................................. 3Mention Problems and Concerns ............................................................................. 4
Preparing Slides for a Presentation ................................................................................... 4Limit the Text on Slides ........................................................................................ 4How Many Slides are Needed? ............................................................................... 4Visually Appealing Slides ...................................................................................... 4Powerpoint vs Hand-Written Slides .......................................................................... 5
Preparing for a Presentation ............................................................................................ 5Advance Preparation .............................................................................................. 5Preparation on the Day .......................................................................................... 6
Delivering the Talk ....................................................................................................... 6How to Talk about your Slides ................................................................................ 6Handling Nervous Tension ..................................................................................... 6Answering Questions ............................................................................................. 7Requests for Information ........................................................................................ 7Attention Seekers .................................................................................................. 7Malicious Questioning ........................................................................................... 7
Research Presentations
The Importance of PresentationsTalks are important in getting your name, skills and experience known to others. In particular, a jobtalk should be very well done; conference papers and seminars should likewise make an impression -on other researchers, some of whom can potentially become your employer or collaborator. Unlike ajournal article, a presentation is an opportunity to convey your ideas to a captive audience and at thesame time to get feedback to guide your future work.
Presentation GoalsThe goals of a talk are to communicate an idea and its importance. A conference presentation alsoserves as an advertisement for the paper to appear in the conference proceedings. A seminar tendsto be more detailed, with an emphasis on discussion of the material with the audience. A job talkis similar, but should in addition also show your breadth and depth of knowledge, your interests,the viability of your research and your presentation skills. In an oral/thesis examination, one mustalso show understanding of the topic and clearly demonstrate one's contribution to the field. Unlikeseminars, conference and job talks, it is important to ensure everyone in the audience understandseverything you say in an oral examination or viva!

Research Presentations
2
Choosing what to CoverAs it is not possible to fully acquaint an audience with your research work in the course of apresentation, the talk is an "appetizer" - telling enough about what you have done to make the scopeand contribution of your work clear, and to stimulate interest. If the audience have understood enoughand you have kindled their interest, people will follow up on the details with you afterwards. Whatthen should this appetizer cover? Choose the material you will present according to the backgroundand interests of your audience.
Most research involves a few new ideas and the application of standard tools and techniques.Emphasise what is novel, and omit what is well-known or complicated. Ask yourself what single thingyou would like them to remember afterwards, and focus on this. This will mean that you choose one(or perhaps two) issues to relate in detail, and - out of necessity - the others are omitted entirely orjust mentioned in passing.
The Structure of a Research TalkA well-organised talk, the structure of which is given to the audience upfront, is much easier to followthan a rambling one, or one where it is uncertain where the speaker is heading. At the highest level,a talk usually comprises five man sections:
• Introduction - an informal description of the research
• Related material - an overview of relevant existing work, showing how yours fits into thisframework
• Body - a more formal overview, aimed at putting across the major contribution of the work (one orperhaps two of your ideas that are novel, significant and interesting)
• Technicalities - a more detailed look at the most crucial aspect you want to put across
• Conclusion - key results and some of the evidence supporting your claims
The IntroductionMost people will decide how much attention your talk warrants and how competent a researcher youare on the basis of your introduction alone.
Grab your audience - your introduction should raise an issue, present a puzzle or ask a question (andyour talk should then solve this issue, question or puzzle); this gets the attention of your audience andkeeps them on track with you as you proceed.
Start with a clear and concise definition of the problem you are addressing (it is amazing how manypeople take some time to do this, or never do). Follow this up immediately with something to get theaudience interested - how does this problem fit into the larger picture? why is it hard? what are itspractical applications? Having thus said what your are tackling and why, the next question in manyminds will be what is new in all this?
The audience is looking for something succinct and tangible to remember your paper by, and this mustbe given next - the precise contribution of your work to the discipline. Some other points you maychoose to cover in the introduction are definition of any special terminology; and a brief outline ofthe structure of your talk.
Related ResearchBefore presenting your work, describe related research and how yours compares with it. To makesure your audience understands the talk, you may have to cover background material if many donot have this knowledge. It is important to remember to set the scene even when your audience is a

Research Presentations
3
knowledgeable group working in your own area, such as when talking at a conference or workshop.Do not dive into detail or complex issues, as you will lose most of your audience who have not beenworking on this particular problem over many months or years, as you have. But remember that if youspend too much time on this you are much less likely to grab their interest in your own ideas when youeventually get around to them. Ask yourself whether each piece of background material you considerincluding is absolutely vital in order for them to understand the one key point you want to make. Ifnot, don't waste their time with it. If yes, make sure you put it across as simply and quickly as you can.
The BodyDescribe your key results here, working from high-level abstractions through to more complex details.Mention technical details if you wish, but do not delve into them as you will lose your audience anddetract from the main point(s) you are making. Take time to explain convincingly how you haveachieved what you promised in the introduction.
Keep your audience with you - repeat your outline at times, showing where you are in your talk; relateeach point to the issue/puzzle/question posed at the outset; consider asking the audience questions;break up difficult material; use the well-known technique of keeping people with you: tell them whatyou are going to tell them, then tell them, then tell them what you told them.
TechnicalitiesFollowing on from this overview of your contribution, give the interesting detail for one, or perhapstwo, key ideas. This helps the non-expert to understand what is involved behind the scenes, and givesthe expert something to think about and hopefully learn from.
The ConclusionHaving described your research, you can now make observations, present strengths and weaknesses,discuss experimental results, and mention questions, extensions, generalisations or alternatives thatyou believe warrant future study. Try to wrap up in such a way that both experts and non-experts areshown what they should take away from the talk. When you have finished and checked that there isn'tan undue amount of time remaining, state clearly that you are done by saying something like "Thankyou. Are there any questions?"
Knowing Your AudienceKnow your audience - what knowledge do they have in your subject area? Is their background largelymixed, or more or less uniform? Do they share your views? Do they share your assumptions?
If your audience has relatively little Computer Science knowledge, you will spend more time onyour introduction and background, and omit the technicalities altogether. That is, you will take moretime to describe the problem, where it occurs in practice, why it is hard to solve, current thinking,and the underlying concepts and terminology you will be referring to in your talk. If your audiencecomprises Computer Scientists, then the more they know about your field, the more you can shortenthe introduction and background, focus on the body and increase the section on technicalities. If youaddress experts in your field, devote most of your time to the body and technicalities, and take extracare throughout to convince them of the soundness and accuracy of your claims and your results.
Illustrating Ideas with ExamplesIt is well known that examples are vital, but choose those that illustrate why you have developed yoursolution/language/model/architecture/theory, not those that look most impressive or illustrate as manydetails as possible. It is no help to you if your examples are mind-boggling and leave you audiencewondering what the benefit of your research is. The main criterion to consider when choosing yourexamples, is do they accentuate the point you are trying to make. Do they bring home the practicaladvantages of your idea? Are they the examples that motivated your tackling the specific problem/
Research Presentations
4
task in the first place? Do they illustrate the single thing you wanted your audience to remember afteryour talk?
Mention Problems and ConcernsBe honest with your audience, otherwise you will have gone to a great deal of effort without gainingmuch. If you have concerns, voice them. If there are problems you have not yet solved, or don't knowhow to solve, mention them. After all, this is a research talk, and you are meant to challenge andstimulate thought in your audience. If you hide your concerns, you will not learn from the advice,experience, different perspectives and ideas of your audience; a rare and valuable opportunity will belost, possibly forever. And the fact that you are skirting the difficult issues will show - either directlyvisible as a reluctance to discuss certain aspects, or else leaving the overall impression of a poor talkthat missed out the interesting details. Talking about your problems takes courage, but if your worstfears turn out to be valid and your concerns truly require a change in research direction, then it is farbetter to find this out immediately and at your own initiative. More usually, you will find that youraudience finds a solution for you, or points you in a direction that will lead you there, and that theinterest generated by your paper stems mainly from precisely those problems you were reluctant tomention.
Preparing Slides for a Presentation
Limit the Text on SlidesOnce you have decided what your talk will cover, make sure that your slides support the talk, and nomore. Do not write all or most of what you will say on your slides. Use short points rather than wholesentences. Reading to the audience is very boring and frustrating, particularly as they read faster thanyou can speak. Slides are essentially cues/prompts for yourself, and notes for your audience of whatthey should be remembering. You should spend far longer discussing issues on a slide than it takes toread through that slide. Keep the amount of information on a slide to a minimum, and talk about this.
How Many Slides are Needed?Beware of preparing too many slides and rushing through them. With practice you will learn howmany slides you typically use per ten minutes of presentation (a rule of thumb is around 2 minutes perslide, but this is very much dependent on your personal style), and you will begin to naturally produceabout the right number of slides.
From time to time, a slide containing only the title of the next section gives the audience something tohang things onto as they hear them, and avoids the distraction of wondering where you are heading.
Usually it is advisable to make a few extra slides in case you finish your talk much too early (a littleearly is no problem, just stop after what you prepared). Many people also prepare extra slides forquestions they anticipate - e.g. graphs or tables of results, or diagrams showing system/solution partsin more detail.
Visually Appealing SlidesBe visual - after your talk outline and your statements of the main points you want to make, try to havea picture on most of your slides. Make the words on your slides readable - few words, large fonts.Enhance your slides with colour, but do so for a reason (to show emphasis, alternatives, timing, etc.)and avoid using such a variety that you resort to shades like yellow that are hard to see.
Do not show code (unless your talk is on a new language) or maths if you can avoid it. Use examples asmuch as possible, and make sure they are at the right level of detail. . It is true that "a picture is wortha thousand words", but diagrams must nonetheless be carefully explained (do not, e.g., say vaguelythat "our results look like this" or "here is an example using our model").

Research Presentations
5
Powerpoint vs Hand-Written SlidesPowerpoint slides has been the norm at conferences for some time, enhanced with photographs, videoor other media where the paper requires this. But if you are making a presentation in your owndepartment or to your own research group, think carefully about using hand-written transparenciesinstead. What you want is feedback on your ideas, not to impress or distract the audience with effects;and the simpler your slides the more they will focus where you want them to. If you feel uncomfortableabout "breaking the mould", sound out your supervisor or a colleague; you will find they are far morelikely to welcome this than to object.
It is quicker and easier to write your text and draw your examples manually. You can also add to themor change them during your talk. Using PowerPoint you will spend much time configuring the visualappearance and special effects - time that would be better spent on the content. You will be morereluctant to omit a slide (that you should not be wasting the audience's time on) for this very reason,and can also be tempted to include too much on a slide by using a small font (e.g. code, complexdiagrams and tables, too much text, etc.) Naturally you can still include transparencies made fromfigures you already have in convenient electronic format. Special PowerPoint effects are not vital -they essentially allow for emphasizing and timing display components, which is still possible withtransparencies through appropriate use of colour or overlays.
With hand-written slides, be sure to use permanent ink projector pens, and to replace the backing sheetswith ordinary paper that does not cling to the transparency. Add brief notes to these backing sheetswhere necessary to remind yourself of points you forgot to make when rehearsing, details that are hardto remember (like numbers or names), time checkpoints, and so on. If your personal preference, orthat of your department, is to use PowerPoint, at least consider this alternative seriously first.
Preparing for a PresentationTo present your research to an audience requires good planning and delivery. Part of the preparationfor a talk is thus concerned with polishing the delivery.
It is easier to present you own work if you already have experience delivering talks on other material.Practice public speaking by offering to present a paper you have read at a reading group session orresearch group meeting. If this is not normal practice in your department and there is no interest instarting such an initiative, offer to present a seminar on your literature review; this gives you practicein giving a talk without having to worry about the quality of the content.
Irrespective of the experience of the speaker, any presentation can go either more or less smoothlydepending on the amount of preparation put in - beforehand and on the day of the talk. This effort issketched in the two sections that followed.
Advance PreparationIf there is a tendency in your community to boast about how casually and quickly one's talk or slideswere produced, ignore this completely! It is absolutely vital to prepare a talk thoroughly beforehand.Take time to draft slides, obtain feedback, and improve them until you are satisfied with what theycover and how. Decide exactly what you are going to say, slide by slide as well as between slides,and rehearse this until you have the entire talk in your mind. Though the slides will be there to guideyou, a polished talk is always easier on the audience; while the confidence of knowing that you arewell-prepared will do wonders for your voice and delivery. Remember it is obvious to an audienceif a talk is not well-rehearsed, and this can lead to individuals being more aggressive and attackingthan they otherwise would have been.
Time yourself to make sure that you remain within the limit set. Have a few checkpoints e.g. half-time and three-quarter-time points so you can adjust your pace if necessary. Practice the start and theend especially well, as these have the major impact. Give a trial talk before an audience of friends andcolleagues first wherever possible, asking them to ask you hard questions.
Research Presentations
6
Try to use the same presentation method as others in the community, but if you must use differentequipment, then make sure you arrange this with the organizers in advance. Whatever format you areusing, take along backup copies of your slides in case of problems.
Preparation on the DayOn the day of the talk, do not dress inappropriately. If you are too formally or too casually dressedfor the occasion (depending whether it is an academic talk or a formal interview, respectively) thiswill not inspire confidence in you. Also avoid clothes that distract your audience because they arerevealing, or too colourful, or the like.
Arrive early at the venue and make sure that the equipment you need for your talk exists and worksas you expect, by physically trying it out well before it is time for your presentation. If your venuerequires that you use a microphone, watch how previous speakers use this (if any) and attach it to yourclothing with the help of the organizer or session chair. It is generally best to attach a microphoneto your collar or some other part of our clothing as near to your face as possible. This can be hardto do, and if it falls or is clumsily handled, the amplified noise can be very unpleasant, so find outhow to switch if off while you are attaching it. And if you are inclined to gesture while you talk, bemindful that you don't dislodge your microphone because of the noise and the loss of time, confidenceand concentration.
Delivering the Talk
How to Talk about your SlidesIn any presentation, try as best you can to speak naturally, as you would if conversing with a friendor two - your tone and pace vary, you make some simple gestures, you move around a little (but nottoo much), introduce some humour if you can, smile or laugh at times, use different body language,etc. The more you are able to relax, the more natural your delivery, and the easier you will be onyour audience. The best ways to reduce anxiety are to rehearse very thoroughly indeed (this cannot bestressed too strongly) and to gain experience by doing as many presentations as possible.
If you have prepared well, you will definitely avoid the two cardinal sins of public speaking - readingyour slides/notes, and over-running you time. Keep eye contact with your audience, being as inclusiveas possible. Looking at different individuals in different parts of the room from time to time is one wayto ensure you don't forget this. You should also regularly look at the organizer or session chairpersonduring the second half of your presentation, to detect any signals such as time running out. It is selfishand self-defeating to exceed your time limit, as the audience is unlikely to concentrate on the contentduring the extra time anyway.
Handling Nervous TensionThe individual who is not nervous when they start a public talk is extremely rare; even the mostwell-known and highly respected academics will acknowledge anxiety and trepidation. To calm yournerves, try some of the following techniques:
• In the 5 or 10 minutes preceding your talk, switch off from what is happening around you andinwardly rehearse your opening sentences. This ensures you will get off to a good start, whereuponyour confidence will grow as the talk progresses
• Before the talk, contract your stomach muscles while simultaneously breathing out hard; this relaxesyou and will improve your voice quality
• When you take to the podium or lectern, pause for a minute to look at your audience so as toaccustom yourself to them, find sympathetic or friendly faces, and mentally tell yourself that youwill do fine
Research Presentations
7
• If you feel yourself becoming tense during the talk - pause, take a deep breath and let it out slowly.Wait until it passes, perhaps taking a drink of water or clearing your throat if this is easier for you
• If the paper you are presenting has co-authors you trust, is sanctioned by your supervisor, or wasaccepted by reviewers, then the suitability of your paper is already established, so do not sufferneedless anxiety over the worthiness of your research
• No-one forms a bad impression of another's research because of the poor quality of a presentation;remind yourself there will be no lasting ill-effects even in the unlikely event of the presentationbeing a failure
Answering QuestionsWhile question time can be traumatic for the under-prepared, the diffident or the under-experienced,one should be appreciative of questions asked. It shows interest and knowledge on the part of thequestioner, and gives a good opening to chat to them afterwards, possibly learning from this andmaking valuable new contacts.
There are three main types of questions asked of presenters:
1. requesting information
2. attention seeking
3. malicious questioning
Requests for InformationMost questions are simply directed at finding out more information, in order to better understandwhat you have presented. If you are well prepared and sufficiently familiar with the work, these poseno problem and should be welcomed. Answer honestly and concisely. If you do not understand thequestion, say so. Once you do, repeat the question in your own words so that everyone can hear andinterpret the answer in the way you intend. If you are insecure about answering, and feel that a teammember in the audience would be better able to do so, you should nonetheless give your best responseand leave it up to your colleague to help you if they think it necessary. If you do not know the answer,say so directly, as you are unlikely to make up a good reply on the spur of the moment when you arealready under pressure. Say so confidently, and be careful not to fob off your predicament by saying"it is not known" rather than "I do not know", unless you have established this fact in your literaturesearch.
Attention SeekersSome questions are posed simply to draw attention to the questioner, so as to show off theirintelligence, knowledge, experience or imagination. Such a question is best dealt with by repeating itand then answering it in a way that compliments the questioner without being patronizing. While muchof this waste everyone's time, it is also true that the main benefit of a presentation is usually the insightgained from exactly this type of question, so have an open mind and treat each question seriously.
Malicious QuestioningMalicious questions attempt to ridicule the presenter and cast doubt on their work or its significance.This is hard for anyone to deal with, but remember that it happens to everyone at some time - soyou have the sympathy of others in the audience. Frequently the questioner is known for habituallyattacking speakers in this way and hence the criticism is viewed in this light (it might even be moreworrying if such a person does not bother to ask you such a question!) Sometimes such a questioner isnot even well versed in the topic, but is simply wanting to find out how you cope with pressure (e.g.in an interview situation). The best approach is to answer as politely and briefly as possible, and avoid
Research Presentations
8
long exchanges with this person, if necessary by suggesting that you discuss the issue further off-line.A one-to-one talk is likely to be much less hurtful and destructive, if indeed it takes place at all.
1
Chapter 18. The Masters/PhD Thesis
Table of ContentsThe Masters/PhD Thesis ................................................................................................ 1Steps in Obtaining a Thesis ............................................................................................ 1Choosing a Supervisor ................................................................................................... 2Supervision Style .......................................................................................................... 2Investigative Work ........................................................................................................ 2Changing Supervisor ..................................................................................................... 2Choosing a Thesis Topic ................................................................................................ 3Pitfalls to Avoid ........................................................................................................... 3The Thesis Proposal ...................................................................................................... 3Financial Aid ............................................................................................................... 4Writing the Thesis ........................................................................................................ 4Motivation ................................................................................................................... 4Motivation when Reading ............................................................................................... 4Some Final Tips to Help You Stay on Course .................................................................... 5
The Masters/PhD ThesisThe basic requirements of a Masters degree are to show that one has mastered research methods andtechniques, that one is familiar with the state of the art in a particular field, and that one is able toapply those research methods in creating, improving or analyzing state of the art systems. Originalityand significant contribution to knowledge are only required for PhD degrees, although most Masterstheses contain some aspects that are original. In many universities, particularly in South Africa, thedistinction between Masters and PhD theses has become blurred, as the standard of Masters thesesgrows higher.
Steps in Obtaining a ThesisThe following are the major steps involved in thesis work:
1. Select a suitable university and department
2. Choose a supervisor and research topic
3. Arranging funding for your studies
4. Read the literature and decide on a research question to tackle
5. Choose appropriate research methods and secondary goals, and produce a project plan
6. Write the thesis proposal
7. Conduct the research, writing up as you proceed and revising the project plan as needed
8. Produce progress reports, papers, presentations and other deliverables as and when required by theuniversity and funding bodies
9. At the completion of the research, complete and submit the thesis document for examination
10.If required by the university, undergo a thesis defence or other form of oral examination on the work
11.Where required, make corrections or extend the research as suggested by the examiners.

The Masters/PhD Thesis
2
Most of these activities have been described in previous sections. Those peculiar to thesis work arediscussed below.
Choosing a SupervisorWhen choosing a supervisor, consider their level of expertise, knowledge and research experiencein your problem area; their supervision style and their personality. Greater expertise on the part ofyour supervisor will not only improve your research productivity and quality, it will also help yourconfidence and general peace of mind. A supervisor should have some knowledge of the area beingresearched, be familiar with the research process, and have adequate skills to oversee, guide andencourage the student or junior.
Supervision StyleIn considering supervision style, ask yourself what type of contact you prefer (someone who keepsregular tabs on you at the one extreme, someone with a laissez faire attitude who has limited time forsupervision, or what between these two extremes suits you best), how much pressure you work bestwith, and whether you will be helped or hindered by any individual characteristics or methods of apotential supervisor (e.g. if he/she is known to require frequent presentation of research progress tolarge groups, etc.)
In choosing a supervisor you also need to know yourself, to know whether their supervision stylewill be beneficial for you. Do you prefer to work alone on in a group? Do you prefer the firm handand watchful eye of someone who oversees your work because you perform best under pressure, orvalue the freedom to work at your own pace under someone who respects your independence? Do youprefer a supervisor who continually challenges your ideas and extends you to the limit, or one witha gentler, supportive nature? Would you rather contribute to an established research project, or starta new, individual piece of work?
Investigative WorkThe ideal supervisor is an expert in the field that interests you and is actively engaged in goodresearch in that area, working with a good team of happy, well-motivated students and collaborators,globally known and respected for his/her ideas, with a personality that suits your own. Finding sucha person, or coming close to it, requires good research in its own right! Look at the research recordand thesis offerings of potential supervisors at a number of departments; meet the supervisors andtheir students, attend their research meetings and seminars, ask about supervision style, and find outgraduate throughput and dropout rates. Try to ask current thesis students how much their supervisorassisted with literature searches, finding a topic, solving problems, introducing them to others, and soforth. If you have an idea for a research question to tackle, write this up and ask for comments.
Changing SupervisorOnce you have chosen a supervisor and started your thesis, do not feel obligated to remain with thatsupervisor if you are unhappy with him or her. In particular, if you feel that person is hardly everavailable for consultation, shows no personal interest in the project, has inadequate knowledge, failsto give constructive criticism or treats you badly (being rude, negative, sexist, racist, exploitative, orharassing you), speak to them frankly and calmly about the problem, and if this fails to help then lookfor another supervisor.
It is best to heed warning signals of the above kind early on, when changing supervisor will have lessimpact on your progress. Be wary of a supervisor who gives you too much freedom in choosing yourtopic; such a person is likely to lack the background to help you adequately. Likewise, a supervisorwho cannot point you to some good papers with which to begin your literature search, is probably notqualified to help you on that specific topic. Finally, remember that students should also behave in a

The Masters/PhD Thesis
3
way that encourages a good working relationship with their supervisor - communicate well, followadvice, be honest, attend meetings, and work independently.
Choosing a Thesis TopicFinding a thesis topic is the first difficulty encountered by most students. A fairly easy way ofnarrowing down this problem is to list the potential supervisors and their research fields - eliminatinganyone whose supervision style or research area is not appealing. Some reading into the topics onthis list is then advisable, after which the best candidate field or fields should be selected. It will helpto find a topic within this field by writing down at this stage what one finds interesting and why -both as explicitly as possible. Supervisor and student can then work together until a specific researchquestion/task is decided upon.
The research question(s) you are addressing should:
• Indeed be unsolved, or solved only under certain assumptions
• Lend itself to good theoretical work or good empirical results (or both)
• Be significant and of interest to other researchers
• Not require more time than you have, or at least have a core that is manageable
If you choose a topic that is clearly defined, narrow and focused, you can start sooner and are lesslikely to go off at a tangent down a path that proves fruitless or uninteresting. It will also be easierfor you to plan and evaluate your research, and you will spend less time worrying about convincingexaminers that your work is worthy of the degree.
Pitfalls to AvoidBeware of taking risks when setting your research goal. If it is your own idea and you struggle toconvince your supervisor that it is suitable, be aware that you will probably struggle even more toconvince others in the field, including your examiners and reviewers of your papers. If your workconcerns something very different from what others in your department are interested in and activelyresearching, it will be harder to get feedback and help.
Do not choose a goal that is too ambitious. For some who are very enthusiastic and confident, this canbe very difficult - so heed carefully the advice of your supervisor if this is to cut down the task or findsomething less complex or risky. Remember that many papers you read are the work of large researchteams or the product of many years' effort, and of people with research experience far greater thanyour own. Furthermore, many authors have a knack of marketing their research very well, so that thereader has the impression of a much grander accomplishment than is indeed the case (bear this in mindwhen you read, and when you discuss papers with your supervisor, team members or reading group).It is better to look at recent dissertations passed by your institution to get an idea of what is expected.
The Thesis ProposalOnce you have decided your research question or goal, write up a thesis proposal -whether or not it isrequired by your department - and give it to your supervisor and others for comment. This will takeseveral months, as you need to familiarize yourself adequately with the problem/task, with existingresearch that is relevant to it, and with appropriate research methods (so that you can identify theseand explain how they will be applied). You must be able to define the problem or task clearly andcome up with a methodology and plan for tackling it within a reasonable time. The more detail youcan show, the better quality feedback you will receive; and remember to write for an audience whoare not involved in the same research field. Once your proposal is written, give a talk to present it tofellow students and staff - whether or not this is the normal practice in your department.
The Masters/PhD Thesis
4
Financial AidMake sure that you have enough funding to be able to devote sufficient time to your thesis withouthaving to worry about finance, or waste time with part-time work. If you have a reasonable lifestyleand find that you are struggling to survive on the funding you are receiving, speak to your supervisorand others in your department; usually arrangements can be made to help, and if it does require doingother work, this is likely to be more appropriate and suitable for your context, e.g. research or teachingassistant-ships. Do you financial planning in good time, so that when such RA and TA positions areoffered, you are among the applicants - these are unlikely to be vacated until a year's time (or perhapsa semester's time) in most institutions. Speak to graduate students and staff in your department, andin the Post-Graduate Administration section of your university, to make sure that you are aware ofall the funding opportunities in good time. If you can, try to earn money as a research assistant priorto commencing your thesis studies; this has the extra advantage of giving you valuable insight andexperience in the field and in research techniques, as well as a taste of the working style of potentialsupervisors.
Writing the ThesisDo not think of a thesis as comprising two main stages, research and dissertation writing, as thesemust proceed in parallel. Many ideas are incorrect or incompletely formulated before being tested,and writing them down first helps significantly to improve and clarify the ideas, saving a great dealof time when they are subsequently implemented or tested.
MotivationThe more motivated you are to do research, the higher your chance of success. As with all research,thesis work involves both exciting times and frustrating times. When progress seems too slow, or ideasfail, it becomes hard to continue working. This section offers some tips for staying motivated whenthe going gets tough.
Firstly, do not try to do your thesis research entirely by yourself. Do it with your supervisor - haveregular meetings, seek his/her advice and guidance, and check your progress (or lack of progress)with him/her. This will not only reduce the time spent, but also make the entire experience a muchhappier one.
If your degree is part-time, do not be tempted to take leave of absence from work at the beginning, eventhough the time spent choosing a research question or goal can be considerable. The best time to takeleave is when you are producing the final dissertation draft, as this is when you need to concentrateyour thin king and to maximize the number of hours spent daily on your thesis.
Motivation when ReadingMuch of one's research time is spent reading, particularly in the beginning. Most MSc students spendtheir first few months reading; PhD students typically take 6 - 12 months familiarizing themselveswith the field so that they can confidently find an open problem or novel approach to a task. At first,most students feel overwhelmed and despondent because of the amount of material to read and theslow rate at which they are able to assimilate documents. But you are not meant to read every relevantarticle; with practice you will learn how to distinguish those that are important - aim to read these,along with recent papers and papers that are highly relevant. And as your knowledge grows, so willthe rate at which you can read and understand other work.
If, during the course of your work, you find a paper that reports almost exactly what you are attempting,do not be too despondent. Read it carefully, along with others in the field such as a supervisor,colleague or collaborator. Contact the authors and talk to them (by email if necessary, but preferablyface to face). You may find that there are interesting differences, or that there are still alternatives or
The Masters/PhD Thesis
5
extensions for you to pursue. You can end up gaining a great deal from interaction with the author(s),who are clearly kindred souls, and if you are lucky it may even lead to collaboration in the future.
Some Final Tips to Help You Stay on Course• If you are hating what you are working on, do not be afraid to change your thesis topic or direction
to something of greater personal interest
• Focus on the skills you will learn, rather than the research outputs
• Incorporate in the project the gaining of some knowledge or experience of direct relevance to you
• Concentrate on the reward(s) that will follow the qualification of MSc/PhD, such as publication/s,travel, a new job, promotion, enhanced status, etc.
• Talk to someone sympathetic who can support and encourage you, such as a fellow student or afriend outside the department
• Do not expect too much of yourself (don't set unrealistic milestones or expect to work more hoursper day than you can reasonably manage)
• Concentrate on what has been achieved, rather than being negative about what has not been done
• Break down every hard task into small sub-tasks, even when considering what you plan to achieveeach day
• Look at your early notes and plans to see how much has already been learnt and how much progressyou have already made
• Remember that research is about breaking new ground, so problems and setbacks are to be expected- see them as confirmation that the task you are tackling is sufficiently hard to qualify as good thesismaterial

Figures
Why Use Figures
Figures (graphs, charts, and graphics) are an additional means of communicatinginformation about systems, algorithms, dynamics, and perhaps most importantly,data. Good figures make it easier and faster to communicate certain information,and can play a crucial role in the structure of a paper. This chapter will focuson highlighting some of most important areas to focus on when creating figures.
Revealing the Data
It may seem obvious, but the first and foremost objective of a figure is to showthe data. Figures have an amazing ability to quickly reveal information aboutdata that might otherwise be difficult to detect or understand. In fact, a graphiccan give far more precise insights than even statistics can in some cases. Considerthe four sets of data below:
Figure 1: Four sets of data.
1

The four sets of data shown in Figure 1 have some interesting properties. Foreach of them the following are true: - Sample size = 11 - Mean value for X= 9.0 - Mean value for Y = 7.5 - Equation of regression line: Y = 3+0.5X -standard error of estimate of slope = 0.118 - t = 4.24 - Sum of squares = 110.0 -Correlation coefficient = 0.82
As you can see, many of the statistical tools we usually rely on to give usinformation about a data set are telling us that each of these four data setsare identical. The data sets have the same number of elements, the same meanfor both the X and Y values, etc. After some statistical inquiry, we might betempted to suggest that these four sets of data are the same. However, oncethese four data sets are plotted as graphs (Figure 2), the differences betweenthem, and their important individual characteristics, are immediately obvious:
Figure 2: Scatter plots of the four data sets shown in Figure 1.
These four sets of data are known as Anscombe’s quartet, and are an excellentexample of the power that graphics have to reveal information about a data setthat might otherwise remain hidden.
2
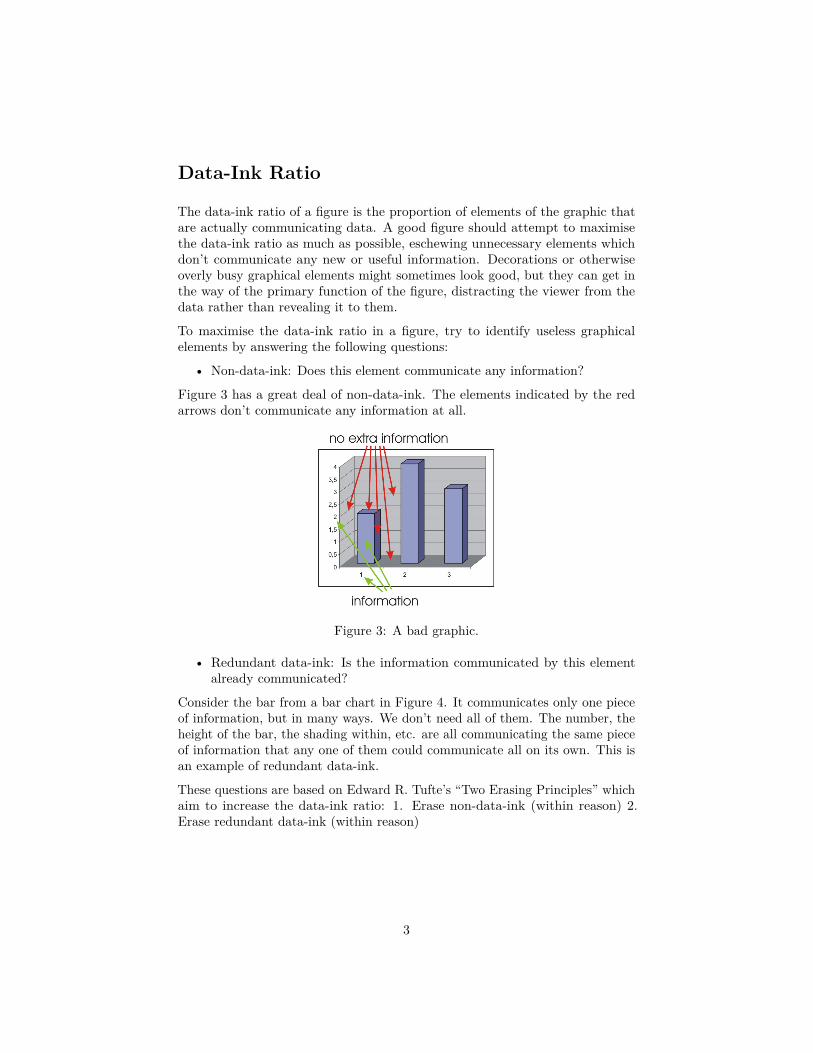
Data-Ink Ratio
The data-ink ratio of a figure is the proportion of elements of the graphic thatare actually communicating data. A good figure should attempt to maximisethe data-ink ratio as much as possible, eschewing unnecessary elements whichdon’t communicate any new or useful information. Decorations or otherwiseoverly busy graphical elements might sometimes look good, but they can get inthe way of the primary function of the figure, distracting the viewer from thedata rather than revealing it to them.
To maximise the data-ink ratio in a figure, try to identify useless graphicalelements by answering the following questions:
• Non-data-ink: Does this element communicate any information?
Figure 3 has a great deal of non-data-ink. The elements indicated by the redarrows don’t communicate any information at all.
Figure 3: A bad graphic.
• Redundant data-ink: Is the information communicated by this elementalready communicated?
Consider the bar from a bar chart in Figure 4. It communicates only one pieceof information, but in many ways. We don’t need all of them. The number, theheight of the bar, the shading within, etc. are all communicating the same pieceof information that any one of them could communicate all on its own. This isan example of redundant data-ink.
These questions are based on Edward R. Tufte’s “Two Erasing Principles” whichaim to increase the data-ink ratio: 1. Erase non-data-ink (within reason) 2.Erase redundant data-ink (within reason)
3

Figure 4: An example of redundancy.
Chart Junk
Non-data-ink is sometimes referred to as “chartjunk”. Some forms of chartjunkare so common that one might not even notice them. The erasing principlesabove will help identify unnecessary elements, but some very common examplesare highlighted in this section.
Vibrations
Many graphs and charts rely on various dense repeating patterns line parallellines to differentiate between elements. An example of this can be seen in Figure6. Due to the physiology of the human eye, lines like this sometimes appear to bemoving slightly or otherwise distorted (this is known as the moiré effect which ishighly exaggerated in Figure 5). This can make elements more eye-catching, butit can also be very distracting, not to mention that all that ink communicatesno data whatsoever.
Try to avoid using vibrating lines or other dense repeating patterns to differentiatebetween chart elements.
4

Figure 5: Moiré vibrations.
5
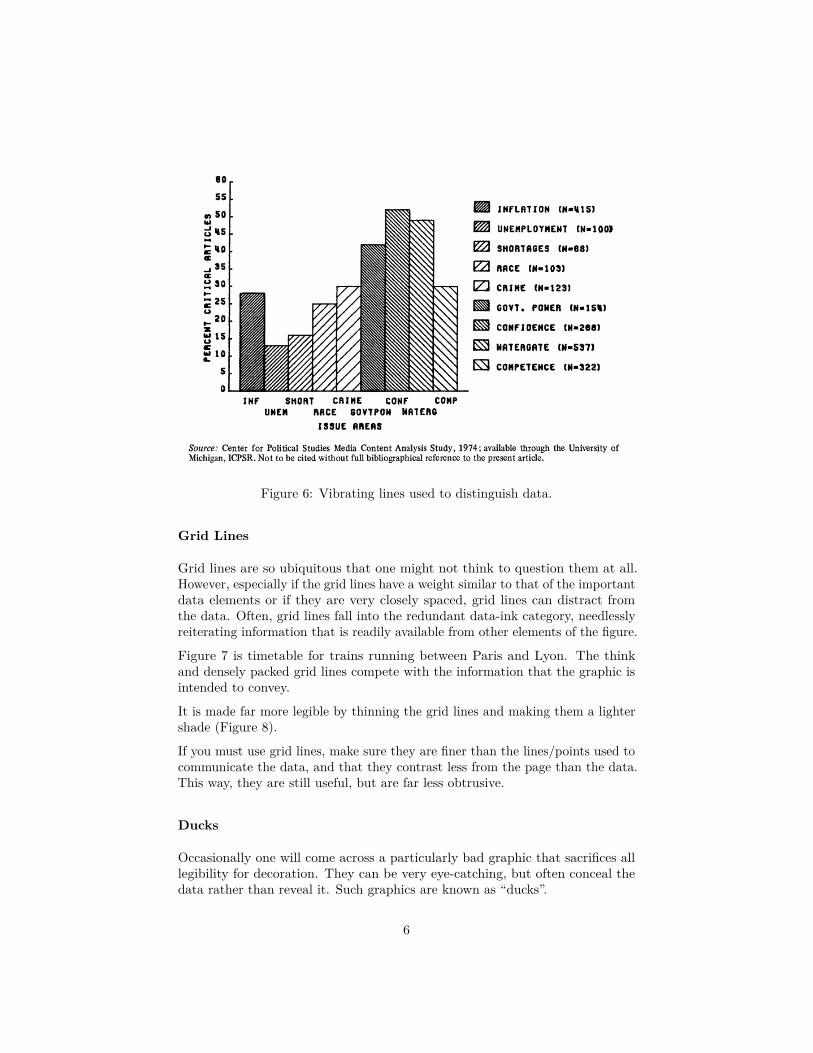
Figure 6: Vibrating lines used to distinguish data.
Grid Lines
Grid lines are so ubiquitous that one might not think to question them at all.However, especially if the grid lines have a weight similar to that of the importantdata elements or if they are very closely spaced, grid lines can distract fromthe data. Often, grid lines fall into the redundant data-ink category, needlesslyreiterating information that is readily available from other elements of the figure.
Figure 7 is timetable for trains running between Paris and Lyon. The thinkand densely packed grid lines compete with the information that the graphic isintended to convey.
It is made far more legible by thinning the grid lines and making them a lightershade (Figure 8).
If you must use grid lines, make sure they are finer than the lines/points used tocommunicate the data, and that they contrast less from the page than the data.This way, they are still useful, but are far less obtrusive.
Ducks
Occasionally one will come across a particularly bad graphic that sacrifices alllegibility for decoration. They can be very eye-catching, but often conceal thedata rather than reveal it. Such graphics are known as “ducks”.
6
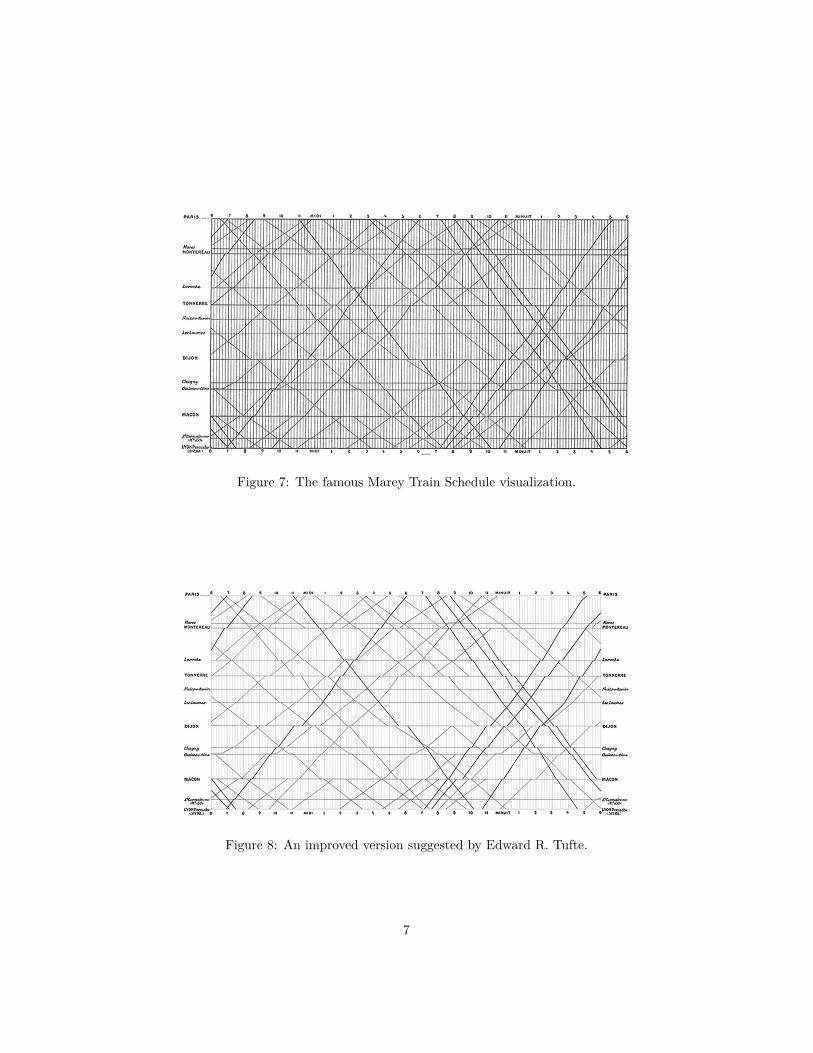
Figure 7: The famous Marey Train Schedule visualization.
Figure 8: An improved version suggested by Edward R. Tufte.
7

Figure 9 is regarded by some to be the worst figure ever to be printed:
While eye-catching, this graphic has many problems. All in all, it only communi-cates 5 data points - the proportion of enrolled students under the age of 25 from1972-1976. The colours and the fake 3D effect add no new information (theyare pure non-data-ink). The top half of the graph is actually just the inverse ofthe lower half (redundant data-ink), and the values of it are represented by theempty space below it, rather than the coloured part above it, the opposite ofthe lower part. Finally, the broken y-axis distorts the data to make it appearmore interesting than it actually is. Although very boring, Figure 10 is a muchbetter representation of exactly the same data:
Show the data, maximise the data-ink ratio, erase non-data-ink, erase redundantdata-ink, and you will avoid making a duck.
Data Distortion
By changing certain aspects of a figure, it is possible to distort the data ratherthan reveal it for what it actually is. Several such distortions are discussed inthis section.
Spurious Linear Regression
Earlier in this chapter we looked at Anscombe’s quartet and saw that differentsets of data can lead to the same line of regression. Lines of regression canbe very useful for communicating a general trend, and give your data somepredictive power. However, regression lines can be very sensitive to outliers,and must be used with care. Importantly, they must always be shown with thepoints that were used to generate them.
Three Dimensional Effects
3D effects are often used and almost always purely decorative. Their usage notonly diminishes the data-ink ratio of a graphic, but the perspective distortionneeded for the effect can distort the data too. Consider the pie charts shown inFigures 11 and 12:
In the 3D version (Figure 11), “Item C” appears to be about the same size (ifnot larger) than “Item A”. In the non-distorted 2D version (Figure 12), it is easyto see that Item A is actually much larger (more than twice as large in fact) thanItem C. Both the 3D effect and the lack of proper labelling distort this data.
8

Figure 9: A graphical duck.9
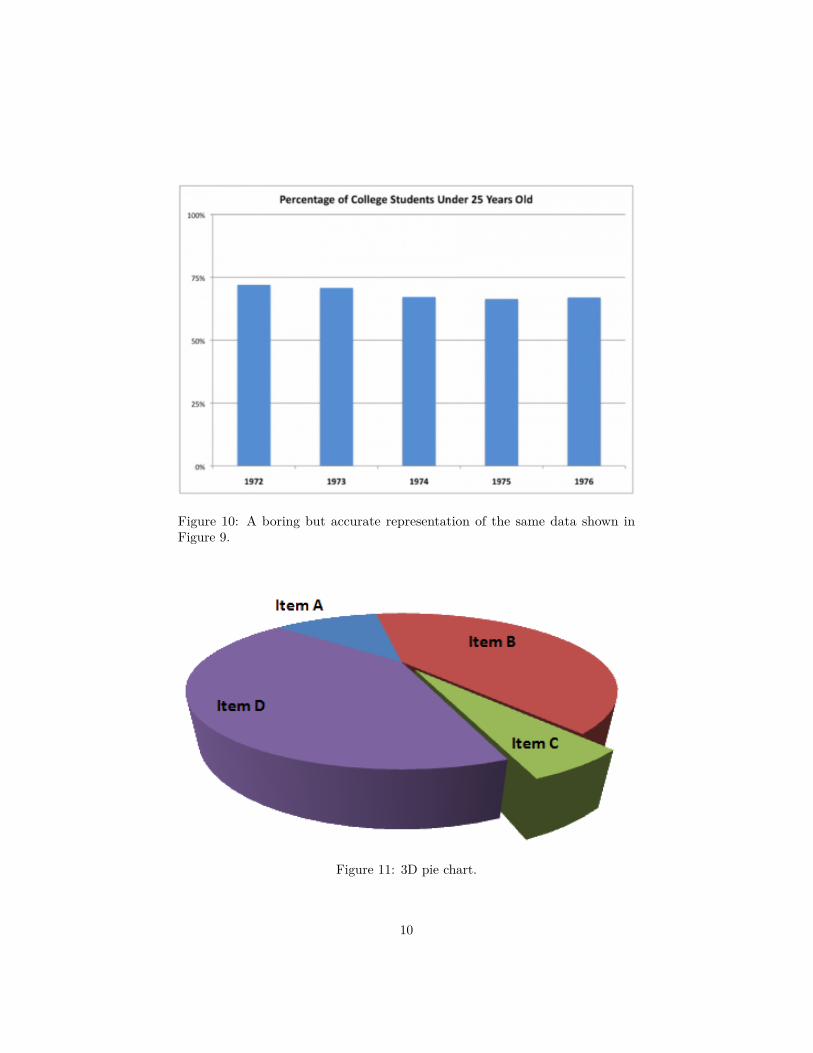
Figure 10: A boring but accurate representation of the same data shown inFigure 9.
Figure 11: 3D pie chart.
10
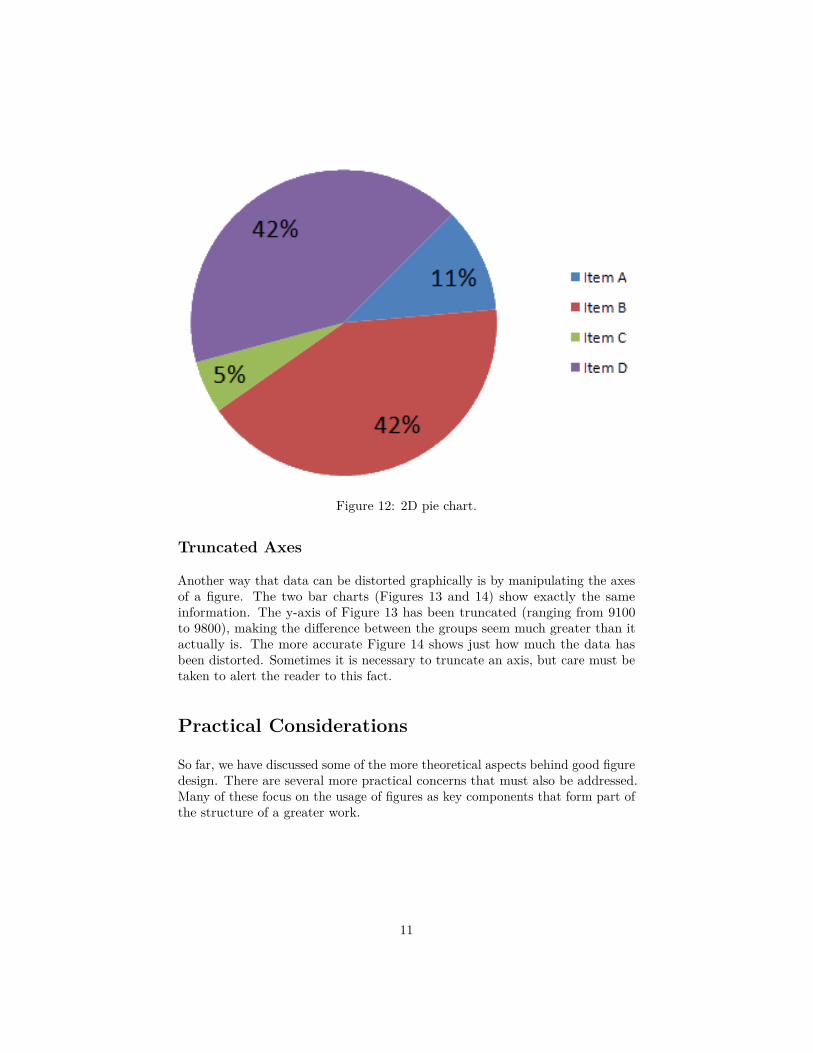
Figure 12: 2D pie chart.
Truncated Axes
Another way that data can be distorted graphically is by manipulating the axesof a figure. The two bar charts (Figures 13 and 14) show exactly the sameinformation. The y-axis of Figure 13 has been truncated (ranging from 9100to 9800), making the difference between the groups seem much greater than itactually is. The more accurate Figure 14 shows just how much the data hasbeen distorted. Sometimes it is necessary to truncate an axis, but care must betaken to alert the reader to this fact.
Practical Considerations
So far, we have discussed some of the more theoretical aspects behind good figuredesign. There are several more practical concerns that must also be addressed.Many of these focus on the usage of figures as key components that form part ofthe structure of a greater work.
11

Figure 13: Data distorted through truncation of the y-axis.
Figure 14: An accurate portrayal of the data.
12

Title
Every figure should have a title. The purpose of the title is to concisely informthe reader what the figure is meant to convey.
Earlier in the chapter, in the Ducks section, we looked at a particularly badfigure. The title was one of its issues. “Age Structure of College Enrolment”does not mean much, and certainly doesn’t capture what the presentation ofthe data is meant to reveal. The revised title, “Percentage of College StudentsUnder 25 Years Old”, is far better. It is less ambiguous, and describes preciselywhat the graph sets out to present.
Titles should be concise, but give enough information so that the reader knowsimmediately what the function of the figure is. A good rule of thumb to followis that the title should be of a form similar to: (Vertical axis quantity) vs.(Horizontal axis quantity) for (Experiment).
The title should be preceded by an identifier such as “Figure 1:. . . ” to facilitatereferences to the figure from the body of text. Depending on the format of thework, the title may be the first sentence of the Caption.
Caption
All figures should have a caption. The function of the caption is to give the readerall of the information they need to fully understand the figure, and summarizewhat it presents.
The caption should mention what exactly is being plotted in the figure (whichstatistics, or which data), the origin of the data, the context within the paper,and any auxiliary information required to understand the figure. If applicable,samples sizes and summary statistics should also be mentioned. Where necessary,the caption should contain citations to referenced work.
A good caption will allow a figure to stand “on its own”, without furtherexplanation in the body of the text. This is important because, for many readers,the first skim read through a paper will rely heavily on the figures to startbuilding an understanding of the entire paper.
Axes
We have already touched on the importance of axes as a part of how to accuratelyrepresent data. Axes should conform to the following:
• There should be (at least) an x-axis and a y-axis.• They must be labelled and the units used must be mentioned.• Scales should be provided on the axes and they should be labelled.• The choice of scale should not distort the data.
13

• Any breaks in the axes should be indicated.
Reference in text (structure)
All figures included in a paper should be referred to at least once in the body ofthe text. The purpose of the figure is to aid understanding of information thatis being presented, and the figure should be clearly linked to this information sothat it can be easily found if and when required by the reader.
14