chapter one: introduction - portsmouth research portal · chapter two: research methodology 15...
TRANSCRIPT

Chapter Two: Research Methodology
15
CHAPTER TWO
RESEARCH METHODOLOGY
2.0 Introduction
This chapter is to explain the chosen methods to obtain the primary data in order to achieve the
objectives of research. There are five sections in this chapter. The first section briefly describes
the concept of research design, followed by a discussion of the methods chosen in this
research. The second section outlines the seven main objectives of the research, and the five
hypotheses to achieve the predetermined objectives. The third section focuses on issues
related to methods of data collection and questionnaire development. The final section explains
the sampling procedures and techniques to obtain the primary data from the respondents.
2.1 Approaches to the Research Design
In order to choose the best research design for this study, there are two factors to consider.
These factors affected the selection of research design in terms of methods of data collection
and analysis. In addition, these factors highlighted the dilemmas faced in this study due to
differing types of respondents and the balance of qualitative and quantitative materials.
Chapter Three:
Background to Malaysia
Chapter Two Research Methodology
Chapter One:
Introduction
Chapter Four Community Involvement in Cultural Heritage
Management
Chapter Seven Discussion
Chapter Six Fieldwork Results
Chapter Eight: Conclusion and Recommendation
Chapter Five Cultural Heritage Management in Malaysia

Chapter Two: Research Methodology
16
2.1.1 Types of Respondents
With respect to the phenomenon of local community involvement in sustainable cultural
heritage management, it is essential to identify the potential respondents who are closely
connected with the local community in order to provide valuable input to this study. It was
appropriate to identify differences between the needs, desires, and perceptions of each
respondent towards the involvement process. Moreover, by considering the limited budget and
time scale available, it was necessary to choose the respondents that could provide insightful
knowledge to this study.
For this study, three groups of respondents were identified (local residents, stakeholders and
tourists) due to their strong connection with the attractions along Melaka heritage trail (see
Figure 2.1 and Table 2.1). Firstly, the local residents along Melaka heritage trail. The
population of the local community encompasses various types of residents in terms of socio-
demographic backgrounds such as mixed ethnic groups, religious belief, and culture and
heritage identities (see Section 3.4 in Chapter Three: Background to Malaysia). Secondly, key
stakeholders that played a major role in developing the Melaka heritage trail. These include the
local authorities from diverse group of departments such as tourism and the city council.
Finally, as the development of Melaka‟s heritage trail is considered a tourism product to
enhance tourists experience and satisfaction international and domestic tourists were chosen in
order to provide additional information regarding their perceptions towards the Melaka heritage
trail. The selection of respondents is pivotal, in order to adopt an appropriate research strategy
for this study. Hence, the research process, such as, data collection techniques, sample of
population size, questionnaire design and data analysis can be planned in advance.

Chapter Two: Research Methodology
17
Fig
ure
2.1
: A
ttra
ctio
ns
alo
ng
th
e M
elak
a H
erit
age
Tra
il S
ourc
e: 1
001
crea
tions
, 201
1

Chapter Two: Research Methodology
18
Table 2.1: Stakeholders along the Melaka Heritage Trail
10 major attractions along the
Melaka Heritage Trail
Stakeholders at each heritage trail
attraction
Residents at each heritage trail
attraction
1.Malacca Tourist Information Centre
Ministry of Culture, Arts And Tourism
Melaka Museum Corporation (PERZIM)
Melaka Historical City Council (MBMB)
Not residential area
2. Malacca River MBMB
River boat operator
Not residential area
3. Baba Nyonya Heritage Museum Small-scale business entrepreneur
Private property
Hang Jebat Street
Tun Tan Cheng Lock Road
Ethnic representative: Malay & Chinese
4. Cheng Hoon Teng Temple Small-scale business entrepreneur
Private property
Hang Jebat Road
Lekiu Road
Hang Kasturi Road
Ethnic representative: Chinese
5. Kampong Kling Mosque Small-scale business entrepreneur
Private property Melaka historical city council
Hang Jebat Road
Lekiu Road
Hang Kasturi Road
Ethnic representative: Malay
6. Sri Poyyatha Vinayagar Temple Small-scale business entrepreneur
Private property
Hang Jebat Road
Lekiu Road
Hang Kasturi Road
Ethnic representative: Indian
7. Christ Church PERZIM
MBMB
Not residential area
8. St. Paul‟s Historical Complex i. Stadhuys ii. St Paul‟s Church iii. Porta De Santiago
PERZIM
MBMB
Small-scale business entrepreneur
Not residential area
9. Malacca Sultanate Palace PERZIM
MBMB
Small-scale business entrepreneur
Not residential area
10. Proclamation of Independence Memorial
PERZIM
MBMB
Ministry of Culture, Arts And Tourism
Tourism Board and Promotion
Not residential area
Source: Author‟s fieldwork, (2011); MBMB, (2011); PERZIM, (2011)

Chapter Two: Research Methodology
19
2.1.2 The Qualitative or Quantitative Debate
Various schools of thought have continuously debated the pros and cons of qualitative and
quantitative research methods. This debate over research methods has served to advance the
validity of each approach, ranging from data collection to analysis. For example, qualitative
researchers argued that their method of research (i.e interviewing or observation) is
appropriate to allow the researcher to get closer to the data (i.e individual‟s perspective).
Meanwhile, researchers with quantitative method claim that their statistical or mathematical
findings provide more reliable results. In addition, with respect to the issues of research funding
and time consumed collection, many quantitative researchers have suggested that the
fieldwork survey is much easier and cheaper when dealing with large samples (i.e postal
questionnaire). Conversely, qualitative research requires small samples, flexible and its
purposive sampling. The differential dimensions of each approach are summarised in Table
2.2.
However, Andriotis (2000) argued that in terms of the usage of both methods in practice,
neither approach is superior or inferior. Besides, both approaches are valid and contribute to
social research, and over-reliance on any approach is inappropriate (Punch, 1998).

Chapter Two: Research Methodology
20
Table 2.2: Qualitative versus quantitative research
Comparison dimension
Qualitative research Quantitative research
Type of questions
Probing Limited probing
Sample size Small Large
Information per respondent
Much Varies
Administration Requires interviewer with special skills Fewer special skills required
Type of analysis Subjective, interpretive
Statistical, summarisation
Hardware Tape recorders, projection devices, video, pictures, discussion guides
Questionnaires, computers, printouts
Ability to replicate
Low
High
Training of the researcher
Psychology, sociology, social psychology, consumer behaviour, marketing, marketing research
Statistics, decision models, decision support systems, computer programming, marketing, marketing research
Type of research Exploratory
Descriptive or causal
Source: McDaniel and Gates (1993)
In the case of community participation studies, Israel, Eng, Schulz, Parker and Satcher (2005)
argued that both data collection and analysis for this topic have involved qualitative and
quantitative approaches. This is suggesting the mixing of both methods is not unusual to enrich
the research data. Meanwhile, in the field of tourism study, Ballantyne, Packer and Axelsen,
(2009) reviewed 12 journals from 1994 to 2004 (a total of 2868 articles) and found that 59% of
these articles used quantitative research, while only 19% took a qualitative approach. The
remaining 6% used a mixed method and 16% were review or theoretical articles.
According to Xiao and Smith (2006) the selection of qualitative or quantitative research is due
to the changing of study interest (tourism study) from industrial to social science perspectives
since 30 years ago. To date, the existing research disciplines (e.g. sociology, anthropology,
and psychology) are now interested in the subject of community participation in heritage and

Chapter Two: Research Methodology
21
tourism management by adopting mathematical and statistical analyses (quantitative
approach). Since, quantitative methods are widely been used especially for conducting
questionnaire surveys, this study has adopted this method and technique. In addition,
qualitative type questions were also adopted in this field. However, the analyses for qualitative
questions were not explored to the same depth as qualitative research. In fact, this data was
used as supporting information for quantitative data analyses and discussions.
2.2 The Research Process
This section will discuss in greater detail the sequential steps for the planning of the adopted
research process. In practice, there is no overall consensus about the stages to be followed
during research (Robson, 1993). Different models have been proposed by many authors (e.g.
Ryan, 1995; Schutt, 1996; Veal, 1997; Aaker, et al., 1998; Punch, 1998). This thesis has
proposed seven steps of research in terms of process:
1. Selection of research design and study area
2. Determination of research aim, objectives and hypotheses
3. Data collection techniques
4. Data collection process
5. Sampling design
6. Questionnaires design
7. Data analysis

Chapter Two: Research Methodology
22
2.2.1 Selection of Research Design and Study Area
The importance of this study (see Chapter One) and the formulation of research problems (see
Chapter Three and Four) have been discussed in previous chapters. This section is to reflect
on both justification and research problems, in order to determine the soundest research
strategy for this study. Furthermore, the above discussions (see Section 2.1) have influenced
the direction of this research towards the exploration of local community involvement in cultural
heritage management in Malaysia.
A case study approach has been chosen to mobilise this study to answer the research
questions and to achieve the research objectives as stated in Section 2.2.2. In general, the
Melaka World Heritage Site (WHS) was chosen as a case study area and the reason for
selecting Melaka WHS as an appropriate location for this research was due to the following
factors:
As the first city in Malaysia (combined with Georgetown WHS) that has been
nominated as WHS from UNESCO in July 2008, these cities have received great
attention from both Federal and State Governments especially on funding to conserve
and manage cultural heritage resources. However, there is little attempt by academic
scholars to examine the effectiveness and impacts of the practices of community
participation in cultural heritage management.
Since the nomination as a WHS, Melaka is now experience a growing profile as a
major tourist destination in Malaysia. Again, little attempt has been made to investigate
the sustainability between tourism development and cultural heritage management.

Chapter Two: Research Methodology
23
Since the government introduced a concept of an „open-market‟ scheme (see Section
5.4.1), to allow for foreign investment in Melaka to enrich the prospective market, it is
necessary to investigate whether the local community has received positive benefits or
negative implications from this initiative in terms of employment and local facilities.
The selection of heritage trail development as a dominant case study for this research is to
enable investigation of the local community involvement in heritage trail development. In
particular, the Melaka Heritage Trail was used as a direct application to investigate an in-depth
analysis of the Civic and Old Quarter areas impact of increased tourism on both community
and local business. This is because there are different elements that influence heritage trails
development. This trail provides intrinsic information on the management strategy to influence
distinctive groups of recipient parties (resident, local authority and tourist). The concept of
heritage trail development enables over to investigate through specific case studies the impact
and direct involvement of the local community in heritage trail development. It is unusual to find
recent research that investigates the relationship between community participation and the
functions of the trail as a tool for heritage management. For example, the trail has often
neglected as an effective mechanism to manage a place sustainably (Hugo, 1999), to enhance
the quality of user experience (Hayes and MacLeod, 2007; Reed et al., 2004; Shafer et al.,
2000) and to strengthen the local government‟s cultural policy (Hayes and MacLeod, 2008).
This can be argued that the selection of a heritage trail as a case study approach to investigate
local community involvement is an appropriate approach to enhance the existing body of
knowledge. In addition, the heritage trail development is the finest tourism development that
encompasses multiple roles and functions for different groups of people. For instance, the
Melaka heritage trail provides benefits for:

Chapter Two: Research Methodology
24
a) Residents:
Opportunity to present their cultural and tradition identity (see Section 3.4).
Receive benefits through tourism activity (i.e economic, social).
b) Tourists:
Increase user experience through „contact‟ with local community (i.e participate in
activity – such as traditional painting).
Ease for user in terms of orientation in an alien place help users find major heritage
attractions.
c) Local authorities:
A management tool to conserve the heritage assets.
A management tool to control tourist movement (i.e provide safety, avoid vandalism).
d) Central authority
As a tool to enable conservation of culture heritage resources in Malaysia
A framework to develop „culture routes‟ in Malaysia
However, no comprehensive study has been made to evaluate the effectiveness of this
development. There were little scientific evidence can be highlighted of the interrelationship
between three parties who have received benefits from heritage trail development in regard to
participation and partnership.

Chapter Two: Research Methodology
25
2.2.2 Determination of Research Aim, Objectives and Hypotheses
As been discussed in the earlier chapters (introductory and literature review), it is noted that
there is a lack of previous research to recognise the importance of community participation
towards managing the cultural heritage assets, particularly in Malaysia. Therefore, with respect
to the above argument, this study intends to achieve the following aim:
“to explore the local community involvement in heritage management via participation in
heritage trail development in order to promote the local culture and tradition identity”
In particular to this aim, the following research objectives were outlined as follows:
1. To determine levels of attachment among local community towards heritage.
2. To identify the benefits of involving local communities in heritage asset management.
3. To identify the threats to the local community‟s involvement in heritage assets'
management.
4. To evaluate the current institutional arrangement governing heritage asset
management in Malaysia.
5. To assess to what extent the local community is part of the institutional arrangement.
6. To explore the local communities current involvement opportunities in decision-making
in the management of heritage and tourism in Malaysia.
7. To examine the constitutional framework governing local community rights in decision
making.
In addition to support the following theories and models (see Chapter Four and Five), the
research‟s hypotheses are outlined as well:
1. Local community has low levels of attachment towards heritage.
2. There is no approach to encourage the local community to recognise their heritage
values.
3. Local community is unable to sustain long-term heritage management in Malaysia.
Chapter Two: Research Methodology
26
4. It is not feasible to adopt a „bottom-up‟ approach within the „top-down‟ management
system in Malaysia.
5. Local communities have limited access to be involved in decision-making in
management of heritage and tourism in Malaysia.
2.2.3 Data Collection Techniques
Two methods of data collection were utilised to obtain data from a variety of sources (see
Figure 2.2). The first method is the questionnaire survey, and the units of analysis are residents
and visitors. The questionnaire survey is basically the process of asking questions to people
who are believed to have the necessary information (Churchill, 1987). It is a technique
commonly used in studies that have individuals as the units of analysis. In this research, the
sample proportion was particularly to people‟s attitudes and perceptions; thus, specific
attributes or opinion was measured through a degree of quantification in the analysis process
(see Section 2.2.6). In contrast, for the writing of the case study, the research moved beyond
the research description design by adopting an explanatory design. This is to investigate the
relationship by providing answers to problems and hypothesis. The major purposes of causal
design are (Malhotra, 1996, p.97):
To understand which variables are the causes (independent variables) and which
variables are the effects (dependent variables) of a phenomenon.
To determine the natural relationship between the causal variables and the effect to be
predicted.
The second method of data collection is the interview survey, and the units of analysis are the
residents and local government personnel. The semi-structured interview with an open-ended
question enables the researcher to assess how the resident perceived the economic,

Chapter Two: Research Methodology
27
environmental and social impacts from heritage trail development. The application of interview
method was used to the local government personnel regarding the current practice of local
community involvement and heritage management. The results were compared with data (both
qualitative and quantitative) from residents to find any similarity or contradictive arguments.
Meanwhile, the interview survey with the residents was conducted with the same respondents
who were involved in the questionnaire survey who were willing to provide, or discuss
additional information as stated in the questionnaire‟s questions. In the nature of interview
technique, the advantages are to allow a greater depth and probing investigation about
particular topics (within the questionnaire question(s)). It provides information common-verbal
behaviour; enables spontaneity which is more appropriate for revealing information about
feelings and emotions (Pizam, 1994). Certainly, interviews were considered the best approach
to obtain information from a population that might experience difficulties in answering questions
related to evaluating the impacts of heritage trail development. However, as stated previously,
the volume of qualitative data from the local community via interview survey was conducted in
casual manner. This was due to several limitations, such as, time and financial restrictions,
where the survey methods for the other two groups of respondents (local government
personnel and visitors) needed to be completed within the same fieldwork time-frame. In
addition, as the researcher is familiar with Malaysian cultural, the public are suspicious about
answering survey material, as this could be a government strategy to raise income tax due to
undeclared income by the local people.

Chapter Two: Research Methodology
28
Figure 2.2: Methods for data collection techniques
2.2.4 Data Collection Process
In order to simplify the data collection process, there are three major phases of data collection
used to construct an investigation into local community involvement in cultural heritage
management. Each of these phases was constructed within both qualitative and quantitative
methods (see Figure 2.3).
Data Collection Techniques
Quantitative (Questionnaire Survey)
Visitors
Qualitative (Interview Survey)
Residents Residents Local Government Personnel

Chapter Two: Research Methodology
29
Figure 2.3: Data Collection Process
Data Collection Process
Quantitative
(Questionnaire Survey) Qualitative
(Interview Survey)
PHASE TWO Piloting tools for the measurement
Questionnaires – semi-structured interviews – participant observations
PHASE THREE Actual fieldwork research
Surveys – follow up semi-structured interviews
PHASE ONE Observations – administrative interviews – secondary materials (data)

Chapter Two: Research Methodology
30
Data Collection Process
Quantitative
(Questionnaire Survey) Qualitative
(Interview Survey)
PHASE TWO Piloting tools for the measurement
Questionnaires – semi-structured interviews – participant observations
PHASE THREE Actual fieldwork research
Surveys – follow up semi-structured interviews
PHASE ONE Observations – administrative interviews – secondary materials (data)
2.2.4.1 Phase One: Observations, Administrative Interviews, and Document Analysis
This is an initial phase in order to gain as much as possible from the information (formal or
informal) about the phenomenon of local community involvement, tourism development and
heritage management in the Melaka WHS. The concept of heritage trail development in Melaka
has been chosen as a case study approach. Therefore, any materials such as physical or
formal information (i.e. pamphlets, or brochures – see appendix 2.1) related to the Melaka
heritage trail were analysed in order to understand the trail characteristics and to identify
stakeholders along the heritage trail.
In addition, a virtual information (i.e. web-blogs, travel agency websites, email correspondence)
was also gathered especially from those who have visited and walked along the Melaka
Heritage Trail, in order to identify their previous experience from this visit. It is an advantage for
the researcher to understand to what extend the visitors perceived the experiences during their
visit to the city, whether positive or negative. Besides, this information was used as a guideline
to construct questionnaire questions or statements based on real experience from visitors.

Chapter Two: Research Methodology
31
Furthermore, email correspondences Malaysian researchers who have conducted any field
research were contacted to establish academic networking and to gain additional information to
strengthen the research justification and uphold the aim and objectives of this study (see
Section 2.2.2).
In addition to the importance of this phase, identification of the key players or stakeholders that
were involved, or have direct or indirect „connection‟ to the heritage trail development were
contacted to arrange pre-interview sessions with the researcher. Most of these pre interviews
were done over the phone and via emails. More importantly, this approach had a threefold
purpose. First, to meet research ethic requirement in terms of consent to conduct a survey, and
interviews were requested (formal and informal procedure via Melaka‟s authority and direct
communication with stakeholders) before undertaking actual fieldwork in Melaka WHS in April
2011. Second, the most valuable outcomes were the contact with community members
(stakeholders) for involvement in fieldwork surveys, which began through the technique of
„snowballing‟ (Valentine, 1997). Finally, to support the construction of questionnaire and
interview themes; the initial information gathered from these groups of people would be
essential in understanding the local community and heritage trail development in this city.

Chapter Two: Research Methodology
32
Data Collection Process
Quantitative
(Questionnaire Survey) Qualitative
(Interview Survey)
PHASE TWO Piloting tools for the measurement
Questionnaires – semi-structured interviews – participant observations
PHASE THREE Actual fieldwork research
Surveys – follow up semi-structured interviews
PHASE ONE Observations – administrative interviews – secondary materials (data)
2.2.4.2 Phase Two: Pilot Testing Questionnaire Survey, Interviews and Observations
The initial data collection in Phase 1 prompted the construction of questionnaire surveys (for
residents and visitors) and themes for semi structure interviews (for residents and local
government personnel). In the second phase, a fieldwork visit and site assessment for testing
the questionnaire (see Section 2.2.7), interviews and observation was conducted.
A) Process for Pilot Testing Survey
In terms of constructing the questionnaire design, this phase is essential to confirm the validity
and reliability of the conceptual contents in the questionnaire questions. Meanwhile, a pre semi
structure interview session with several stakeholders would allow the research to develop
additional topics in order to extend the context of discussion towards local community
participation during the actual fieldwork. Since the survey took place at the respondent‟s
workplace or residence, during the interview the researcher could observe and collect visual
information concerning the natural environment of the respondent, such as a direct observation

Chapter Two: Research Methodology
33
to identify possible biases, influences or inaccurate replies given by respondents. However, this
technique requires experiences from researchers in order to do the observation assessments.
In addition, this phase also allowed the researcher to find a best strategy to conduct a
questionnaire survey among the visitors. Therefore, a small experiment was conducted to
ensure the researcher had a similar experience to the visitors, while walking along the Melaka
Heritage Trail. Moreover, this exercise gave additional information that could improve the
questions regarding visitor‟s awareness and experience. Research assistants conducted this
experiment and in this case, they were known as a control group respondent. Ten research
assistants participated in this exercise, and everyone started to walk along the trail route from a
different starting point. This was to avoid any time-frame bias in terms of individual pace, or
avoiding „boring‟ attractions. Moreover, along with this practice, research assistants were
asked to record (written) their sense of enjoyment or attractions that made them interested in
staying „on‟ or „off‟ the trail a bit longer, for instance, observing the iron work by the local
resident (Figure 2.4).
Figure 2.4: Handmade kitchen utensils by local resident
Source: Author‟s fieldwork (2011)
Chapter Two: Research Methodology
34
The rationale of using this exercise while walking along the trail was to ensure the control group
„visitors‟ had the same experience as the normal visitor. Besides, the local community‟s daily
activities were observed by the researchers as well. The observations were kept as a written
diary, later it would be used to improve the questionnaire survey, as well as the development of
participant interview prompts.
B) Research Assistant for Fieldwork Survey
In order to speed up the fieldwork survey, research assistants were required. The researcher
established a „standard‟ requirement for those who wanted to take part in the research team.
This was to ensure the research assistant could work independently without full time monitoring
by the researcher. Therefore, the students (undergraduate and Postgraduate - mostly Master‟s
students) from the local university (Universiti Putra of Malaysia) were selected. This was
because the researcher was one of teaching staff in this institution. In particular, the students
must have at least completed the proposal for their final year dissertation. In addition, the
students were selected among those who have similar data collection techniques (i.e
questionnaire survey) in their project dissertation. The purpose of these characteristics was
twofold. First, the researcher intended to assist the final year students in getting exposed to
survey experiences. Second, the students would be competent and self-confident when dealing
with the public during their own survey, and in addition, would share some thoughts on how to
improve the survey technique and strategy. Furthermore, the student must be able to speak in
English and Malay to an acceptable standard. This is because, the survey for visitors involved
foreign internationals. Therefore, the ability to speak in English was essential as it‟s a standard
international language. As the Malaysian people are from multiple ethnic backgrounds, it was
an advantage to have a research team that were able to speak in another common language,
for instance, Chinese or Tamil (Indian accent language). As a result, 10 research assistants

Chapter Two: Research Methodology
35
were selected for the research team (Figure 2.5). However, before the research assistants
started actual field work, a brief about the research topic, aim and objectives was explained in
details to the research assistants. This was to ensure that the research teams fully understood
general points and scope of the research. Moreover, a mock survey was conducted by the
researcher in order to build self-confidence in the research team and to improve their survey
techniques and skills, especially on how to approach the visitors and encourage them to
participate in the survey. In addition, as an honorarium to the research assistant work and
voluntary engagement on this fieldwork survey, the researcher paid all accommodation
expenses and complementary meals (i.e breakfast, lunch and dinner) during the survey
process. In addition, each research assistant was provided with some cash for their basic
expenses during the survey.
Figure 2.5: Research Assistant in Fieldwork Survey 2011 Source: Author‟s fieldwork (2011)
NB: Two research assistants were not present during this photography

Chapter Two: Research Methodology
36
Data Collection Process
Quantitative
(Questionnaire Survey) Qualitative
(Interview Survey)
PHASE TWO Piloting tools for the measurement
Questionnaires – semi-structured interviews – participant observations
PHASE THREE Actual fieldwork research
Surveys – follow up semi-structured interviews
PHASE ONE Observations – administrative interviews – secondary materials (data)
2.2.4.3 Phase Three: Actual Fieldwork Survey and Follow-Up Interviews
Phase 3 was conducted after the major amendments of questionnaire contents were done. The
appointment with local government personnel for an interview was established as well. All the
surveys for both resident and visitor were held at the same time of day. As the time and cost
have become major challenges for this survey, the researcher assigned a research assistant to
facilitate the survey, especially for the visitor‟s survey.
A) Resident’s Surveys
The questionnaire and interview surveys for residents were conducted by the researcher. This
is because, other than conducting the questionnaire survey with the residents, the researcher
also needed to conduct a follow-up interview with the same respondents after the questionnaire
survey session. However, this interview session was optional for the respondent to participate
because not all respondents are willing to spend their time for both questionnaire survey and
interview in the same session. Besides, as noted in the Phase 1 and 2, the researcher had
established a pre-arranged interview with potential respondents among the local community in

Chapter Two: Research Methodology
37
this city. Therefore, the interview session with the resident, in fact, was determined before and
would be carried out during the actual fieldwork research (Figure 2.6).
Figure 2.6: Interview with mobile vendors (resident)
Source: Author‟s fieldwork (2011)
Another reason for the researcher to conduct the survey with residents by himself was there
were several residents who were not comfortable with paper based survey (see Section 2.2.3).
This is due to their concern that the information from these might be used against them in the
future. Therefore, as the researcher was the only person who understands this research, it was
necessary for the researcher to engage directly with the local community especially to deal with
cultural issues (i.e. resident suspicious about the transparency of the research).
B) Visitor’s Survey
The main aim of the visitor‟s survey was to determine the visitor‟s experience while walking
along the trail, hence the research assistants were placed at the 10 major attractions along the
Melaka Heritage Trail (see Figure 2.1). The determination of these 10 locations was based on
the signpost (interpretive signage) provided by the trail provider and information gathered from
Phase 1 and 2 (see Table 2.1). Each of these attractions were posted with at least two

Chapter Two: Research Methodology
38
research assistants. This technique is known as a „buddy system‟. The rationale of this
technique is to let the two individuals work together as a small team during the survey, so that
they are able to monitor and help each other if the respondent has difficulties to fill in the
questionnaire and wishes to further enquire about this research (Figure 2.7).
Figure 2.7: Research assistant conducting visitor survey
Source: Author‟s fieldwork (2011)
In addition, the sampling technique for the visitor survey was using a stratified random
sampling technique (see Section 2.2.5). There are several reasons why this sampling
technique is essential for this research. First, it is to achieve the calculated sample size in a
systematic way (see Section 2.2.6). Second, it is a scientific strategy to gain rich data from a
diverse range of respondents from different locations, time, and days (see Section 2.2.5.3).
Meanwhile, a random sample technique was applied for resident‟s respondents. It was a
straight forward technique because the respondents living in the case study area. In fact, the
residents who lived closely to the Melaka Heritage Trail were automatically part of the potential
pool of respondents.
The time frame for both types of surveys (residents and visitors) was conducted from 10am
until 7pm every day and at weekends. As a routine, during the lunch break, the research team
gathered at the „meeting point‟ with the researcher to report on progress and enquire into

Chapter Two: Research Methodology
39
further explanations from the researcher according to the respondent‟s response towards the
questionnaire, content, or the research topic. The survey resumed again at 2pm, and this
routine continued throughout the fieldwork.
2.2.5 Sampling Design
In most situations, researchers would like to study the whole population, but realistically, it was
impossible because it was extremely unrealistic, expensive and time consuming.
Consequently, it was normal to base research findings on a representative sample. The
objective of sampling is to make judgement about the population based on the information
obtained from the sample. A sample is a smaller set of elements drawn from a population and
is considered to be representative of that population under study (Chua, 2006). Although there
are no fixed rules in determining the size of a sample needed; the sample representatively
depends on two considerations. First, when the whole population is less homogenous. Second,
a large sample would be needed if the population is less heterogeneous (Cunanan and Cruz,
2008). In addition, if the sample size is not well presented, it would affect the overall
performance of the data sample. For instance, if the sample size is too small, one would
struggle with the data‟s validity to provide feasible answers to research questions. Meanwhile if
the sample size is too large, apparently time and resources could be wasted. Hence, an
appropriate sample size should be careful determined in designing the sampling stage of the
study.
As has been noted earlier, the mixed method was selected as part of the research design.
Hence, the selection of sampling design should be mixed as well. There are two types of
sampling design: probability sampling and non-probability sampling. For the probability
sampling, there is a sub-category under this sampling method. This sub-category indicates

Chapter Two: Research Methodology
40
systematic ways or techniques in which elements of the population have a chance to be
included in the sample. It is quite common for this sampling to involve „randomization'‟ as a
feature in selection of the sample. Generally, there are four types of probability sampling
techniques. There are: simple random sampling, stratified random sampling, systematic
random sampling, and cluster random sampling. Each of these sampling techniques have
differing approaches and complexity. In this research, the stratified random sampling and
simple random sampling have been used to gain the data required. Both techniques have been
chosen for a specific group of the respondents during the questionnaire survey. For the visitor‟s
respondent, the stratified random sampling was implemented but not for resident‟s respondent.
Further explanations of these selections are outlined in the following sections.
2.2.5.1 Sample Size
For determination of appropriate sample size for both groups of the respondent population,
there were three sample size formulas reviewed. These were based on work from Krejcie and
Morgan (1970), Cochran (1977), and Cohen (1988). Each of these authors have suggested a
variety of statistical features to determine the sample size, especially for survey methods
(Table 2.3).

Chapter Two: Research Methodology
41
Table 2.3: Characteristics of sample size estimations Authors Characteristics
Krejcie and Morgan (1970)
The authors have established the sample size formula according to the pre-determined target or accessible population (appendix 5.2).
Provide identical sample size. The researcher has full control of sample size by change the t-value based on population size (in this case if whole population less than 120).
Require population statistic to estimate sample size. There is no determination of statistical power and effect size. The authors have provided
the fix alpha value of .05 and a degree of accuracy of .05.
Cochran (1977)
The authors have established the sample size formula based on margin of error (appendix 5.3).
The author has established a formula by assuming the researcher need to accept an error item. For example, 5% margin error for categorical data and 3% margin error for continuous data. These errors are purposely determined as it was claimed that every measurement method could have an error. This is included the Type 1 error (α = .05).
A total population Statistics not essential to use this formula. Even so, it require pre-determine types of methods will be used (eg. continuous or categorical data).
Continuous data: experimental survey – with no distinct category label attached to specific data value. (i.e open-ended questionnaire)
Categorical data: scale type survey (i.e closed ended questionnaire)
Cohen (1988)
The sample size formula based on statistical power and effect size (appendix 5.4). Generally, this formula is appropriate for experimental research. For instance,
determining the effectiveness of two variables. The formula is varied according to the statistical analysis methods. For example: by
using independent sample t-test analysis – need to estimate effect size prior to research sampling method.
Comparison research: Pearson‟s correlation: determination of effect size based on previous studies in the same variable that being investigated.
Source: Othman, (2011); Chuan, (2006)
Apparently, each of these formulas suggests a different size of sample population. The
formulas suggested by Krejcie and Morgan (1970), Cochran (1977), and Cohen (1988) were
examined to determine appropriate sample size for residents and visitors. However, in this
study, a formula from Cohen (1988) was selected. In fact, other authors (e.g Johari, 2010;
Ahmad Puad, 2005; Poria, 2001; Zainab, 1997) have been using Cohen‟s formula especially in
the field of tourism and management.
It is evident that Cohen‟s formula is not only focused on the scale of the statistical test results
and ρ Value (as most researchers are). There are other factors that could influence the

Chapter Two: Research Methodology
42
statistical results such as the effect of population size and the power of interpreting statistical
data when at an advance level. In most research, significance testing was referred to as
confidence interval estimation (Cohen, 1992). Most researchers have failed to consider the
importance of the effect of size and statistical power in the preceding section. Considering all
these factors as suggested by Cohen (1988) would lead to a more meaningful result than
results that have been inferred from the observed p-value. Furthermore, since Cohen‟s (1988)
statistical power analysis was introduced, this analysis received little arguments or debates
amongst methodologies, and supported by the availability of ample resources for estimating
sample sizes in research designs using power analysis, this formula has achieved high
reliability for determining an appropriate sample size (Chuan, 2006). Therefore, a software
application called G*Power version 3.1.3 (Appendix 2.5) was used to formulate the sample size
calculation (Faul, Erdfelder, Buchner and Lang 2009). The result shows that the recommended
sample size for each survey is 305 respondents. Therefore, 710 respondents needed to be
collected for two groups of respondents.
2.2.5.2 Probability Sampling Technique
Since the large sample was required for both respondents groups, a simple random sampling
was chosen as appropriate for residents sample group. This is because the residents are in the
„control‟ area and are a well distributed population. Meanwhile, a stratified random sampling
technique was employed for the visitor‟s survey. It was deemed appropriate since this research
involved a large number of visitors and the numbers of visitors were changing over time. A
stratified random sample was obtained by dividing the sample group (number of visitors) into
non-overlapping groups, called strata(s). A specific number of samples was chosen to
represent each stratum. In this study, the strata were formed in a time frame feature in order to
ensure the samples (visitors) have high probability to be selected as a respondents. The
Chapter Two: Research Methodology
43
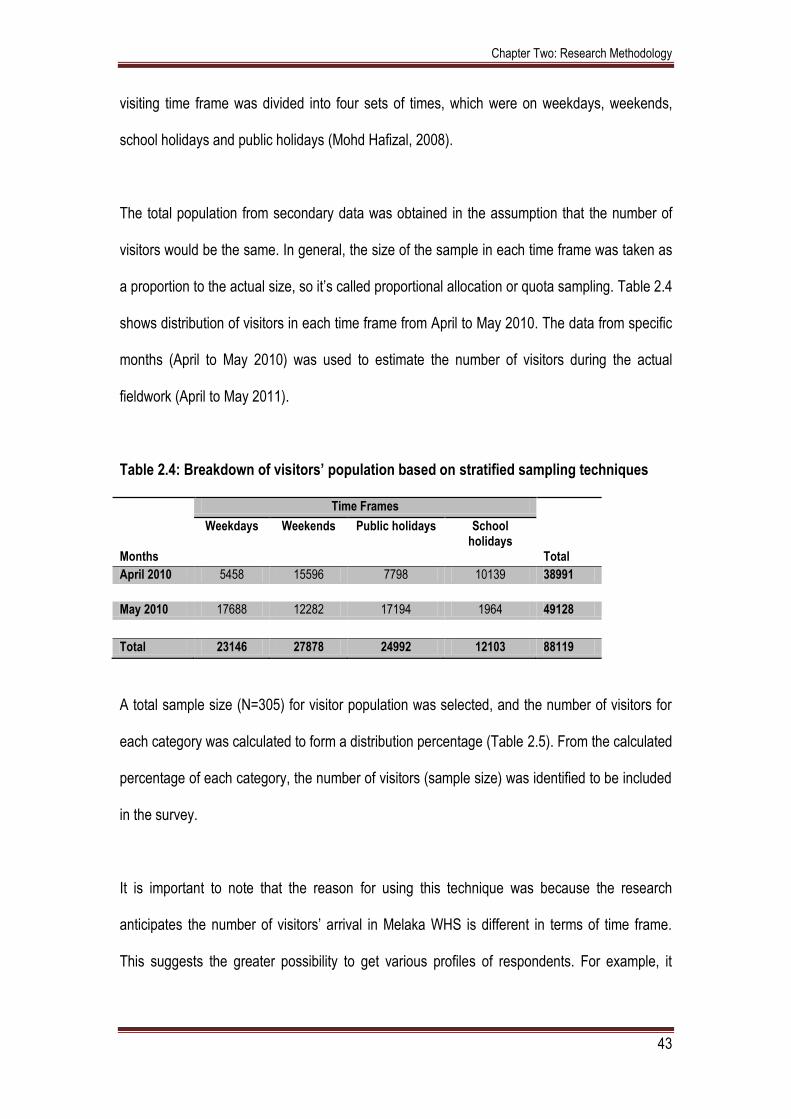
visiting time frame was divided into four sets of times, which were on weekdays, weekends,
school holidays and public holidays (Mohd Hafizal, 2008).
The total population from secondary data was obtained in the assumption that the number of
visitors would be the same. In general, the size of the sample in each time frame was taken as
a proportion to the actual size, so it‟s called proportional allocation or quota sampling. Table 2.4
shows distribution of visitors in each time frame from April to May 2010. The data from specific
months (April to May 2010) was used to estimate the number of visitors during the actual
fieldwork (April to May 2011).
Table 2.4: Breakdown of visitors’ population based on stratified sampling techniques Time Frames
Weekdays Weekends Public holidays School holidays
Months Total
April 2010 5458 15596 7798 10139 38991
May 2010 17688 12282 17194 1964 49128
Total 23146 27878 24992 12103 88119
A total sample size (N=305) for visitor population was selected, and the number of visitors for
each category was calculated to form a distribution percentage (Table 2.5). From the calculated
percentage of each category, the number of visitors (sample size) was identified to be included
in the survey.
It is important to note that the reason for using this technique was because the research
anticipates the number of visitors‟ arrival in Melaka WHS is different in terms of time frame.
This suggests the greater possibility to get various profiles of respondents. For example, it

Chapter Two: Research Methodology
44
would enrich the data sample in terms of visitor‟s motive, perceptions, attitudes, expectation of
the visit.
Table 2.5: Percentage for sampling technique based on specific time-frame
Time Frame Sample size breakdown (%)
Weekdays 23146 / 88119 x 100% = 26.3%
Weekends 27878 / 88119 x 100% = 31.6%
School Holidays 24992 / 88119 x 100% = 28.4%
Public Holidays 12103 / 88119 x 100% = 13.7%
According to the table above, the numbers of respondents for weekday‟s categories was 80
respondents (26.3%). For the weekend‟s categories, 96 respondents (31.6%) are needed to
represent the population and during the actual survey. The school holidays and public holidays
are a challenging part to be categorized during the survey because it involves weekdays and
weekends. Therefore, during the school holidays (87 respondents) and public holidays (42
respondents); the survey for respondents in the weekdays and weekends' category was
isolated to a whole week in order to fairly allocate the percentage of school holidays and public
holiday‟s to respondents.
2.2.5.3 Non Probability Sampling Technique
In this section, the data sample was obtained through interviews with residents and local
government personnel. Since the interviews involved a small group of respondents, there was
less complicated techniques to be used in order to disperse the data sample. Moreover, it is
common to assume that each selected respondent has a chance to be included as a
representative sample.

Chapter Two: Research Methodology
45
With regard to the research, main topic and general aim, the respondents (resident) were
chosen randomly within a sample of the population. Although this technique was known as the
most convenient and fastest way to obtain the information required; this technique is most likely
sufficient in representing an accurate result for a homogenous population (local community).
However, there is a concern that, in all probability it can create a bias in the results. This may
be influenced by distribution of the sample representatives. For instance, due to multicultural
residents within this society, each group of people (i.e ethnic group) may have different
opinions. Therefore, it is necessary to have at least a simple survey strategy in order to balance
the number surveyed among these groups.
Furthermore, a purposive sampling was used to obtain the data sample from local government
personnel. This technique was used because it is important to find a respondent
knowledgeable of the information desired. More importantly this is due to complex or technical
discussion such as government policy, laws and administration structures that need to be
understood by both researcher and respondents.
2.2.6 Questionnaires Design
The questionnaire design for this study encompasses two different sets of questionnaires. First,
the resident questionnaire was designed to obtain the primary research aim and objectives
regarding local community involvement in heritage management in Melaka World Heritage Site
(see Appendix 2.6). Second, the questionnaire for visitors was like the resident‟s questionnaire
in terms of layout and design but some of the content was quite different. For example, in the
demographic section, both respondents were solicited to fill in the requirement for gender, age,
education levels, employment status, and ethnic group. However, the visitor‟s questionnaire
was designed to perceive information about their awareness and perceptions towards the

Chapter Two: Research Methodology
46
Melaka heritage trail in terms of their experience while using the trail. This is to identify the
quality of experience that perceived by the visitor based on trail's infrastructure and the
engagement from local resident (see Appendix 2.7). Meanwhile the questionnaire for residents
emphasised their perceptions of the heritage trail towards social, economic and behavioural
attribute. This information will be evaluated in order to find out whether there is a relationship
between local community engagement and visitor expectation and satisfaction.
2.2.6.1 Resident Questionnaire
There are five main sections in this questionnaire:
A) Socio-demographic section
The first section consists of socio-demographic variables such as gender, residency status, age
groups, level of education, occupation and household income indicators. The information
regarding respondent demographic is essential as the research objective and hypothesis
outlined to determine if there is a relationship between residents demographic background and
place attachment towards heritage. Moreover, as the local community plays an important role
as part of the heritage elements, demographic characteristics are necessary to reveal if any
specific groups of people contribute differing views to the knowledge base of this research.
In general, gender is known to influence the residents‟ attitudes, perceptions, satisfaction and
behaviour (Dorwart, 2007; Jin, 2002; Poria; 2001). However, the gender variable should not be
treated as a single entity, but other independent variables (i.e. age, employment status,
education, etc.) are important in order to enrich the data towards significant findings. As such in
Malaysian culture, females now played an important role in supporting and increasing the
household‟s income. Moreover, in some states in Malaysia (for example, State of Kelantan),

Chapter Two: Research Methodology
47
women are more dominant in the work position than men. Although its sound embarrassing for
men, where the women has to work to support their family income has been seen acceptable in
Malaysian culture (FOA, 2011).
Residential status is essential to investigate as the Melaka‟s state government has introduced
an „open market‟ initiative to allow foreign investors to invest their business capital in to the city,
yet, this city has been flooded with non local born residents. Some of them already have their
own property within the city and the main motivation for their residency is tourism based
business. In order to reject or confirm which assumption, an investigation was undertaken to
determine whether there is a difference between local born residents and non local born
residents in regard to participation in heritage conservation and preservation in Melaka.
Besides, Besculides et al., (2002) suggests that social and economic factors could potentially
influence residents‟ perceptions and attitudes towards heritage management participation.
It is crucial to investigate the level of education among residents in order to find the correlation
with a local community involvement phenomenon (Spennemann, 2006; Tosun and Timothy,
2003; Besculides et al., 2002). Although the education level is difficult to measure due to its
connection with other dependent variables, such as age and employment status (Poria, 2001),
in the context of this research, education is measured against the common education system in
Malaysia. Meanwhile, as the resident‟s age and employment status has been noted to
contribute to the level of engagement in community participation (Poria, 2001), the influence of
this information is affected the residents‟ household income as well. However, respecting local
cultural traditions, the residents are not being asked directly about their income, but via a series
of polar questions (yes-no questions) designed and later estimated according to statistical
figures from secondary sources (i.e Malaysian Economic Planning Unit).
Chapter Two: Research Methodology
48
Due to the main city‟s unique character being surrounded with multiple ethnic groups and
religious belief, the characteristic of ethnic groups within this society is important to
comprehend. Moreover, as there are a variety of questions that can be asked to determine the
residents‟ style, additional information is required and considered important, such as marital
status and number of family members, to evaluate their social economic income.
B) Heritage Trail Awareness Section
The second section is related to the residents‟ awareness towards the Melaka Heritage Trail
development within Melaka‟s WHS zones. This section outlines the main concern regarding
local community participation in determining the heritage trail experience. Therefore, the
information regarding residents‟ awareness is required to determine whether the local
community has been involved during the initial stages of trail design and development.
Preliminary data gathered from observation work in Phase 3 has contributed to the valuable
information drawn on in formulating the heritage trail awareness questions, a series of
questions developed to investigate residents‟ knowledge in regard to heritage trail
characteristics. For instance, a respondent was asked if they are aware, or knowledgeable
about the background of the trail; such as when it was developed, why it was developed and
who are the key stakeholders that have designed and developed the trail. In particular, the
respondent is also asked if they know about the length of the trail, attractions along the trail,
and if any element of the trail route represents their cultural and culture identity as a whole.
C) Perception Section
Third section comprises residents‟ perceptions towards heritage trail development. The
construct of the perception's variable is designed according to three thematic concepts or

Chapter Two: Research Methodology
49
multiple item indicators. First, the perceptions are assessed through the impact of economic
benefits. The economic impact assessment investigates whether the trail development has
played a significant role or function to improve residents‟ economic income. Secondly, an
assessment of social impact investigates whether the trail design represents multi-cultural
identities. Finally, a series of questions determine whether conflicts have occurred since the
trail‟s development. For example, as noted in the previous chapter (see Chapter Four:
Community Involvement in Cultural Heritage Management) the existing local community
involvement would be investigate to understand resident reaction toward tourism.
D) Place Attachment Section
In the fourth section, the residents were solicited to rate their agreement towards place
attachment values. It is a key line of enquiry as to whether the local community has been
involved throughout the heritage management process. Hence, in order to examine if there is a
relationship between resident demographic profile and their engagement with local community
involvement, this section is designed to clarify whether the place attachment values have
influenced the local community involvement in heritage management by firsthand experience of
the heritage trail.
The scale used to measure place attachment was based on Williams and Rogenbuck‟s (1989)
initial attempt to measure place attachment. The scale was developed to conceptualised two
dimensions of place attachment attributes. These are place identity and place dependence
(Williams and Vaske, 2003; Williams, 2000; Korpela, 1989; Proshansky et al., 1983).
Apparently, these dimensions were designed to find out the connection between self and
physical environment. In this research, the place attachment attributes were adopted via three
sub-dimensions of conceptualisation namely: place identity, place affect and place dependence

Chapter Two: Research Methodology
50
(Kyle et al., 2005; Jorgensen & Stedman, 2001). There are categories such as, local
knowledge, emotional feelings, and behavioural reactions. Thus, the construct of place
attachment‟s attributes is based on three thematic concepts or multiple item indicators. First,
the residents‟ attachment is assessed through their knowledge about heritage elements or
assets in Melaka. Moreover, questionnaires need to determine whether residents are capable
of recognising individual characteristics of cultural heritage within the city, as this evidence
would indicate their attachment values as well. Secondly, the residents attachment is gauged
through emotional feelings; hence a series of statements relating to cultural and traditional
values associated with individual residential groups was outlined, to investigate if emotional
feelings were involved as part of the ethnic group‟s attachment values. Finally, a behavioural
intention concept is outlined to determine whether the residents‟ attachment involves any
particular intended action to represent their attachment to this place.
E) Local Community Involvement Section
In the final section, open-ended questions relating to the local community involvement were
outlined as a follow-up approach after the survey sessions with residents. The rationale of this
approach is to give a chance for residents to open up their thought in regard to their
involvement in heritage management within the city. Moreover, a series of follow-up questions
have been outlined by the researcher to ensure the discussion is within the topic range. The
questions are mainly to investigate the opportunities and limitations of local community
involvement in heritage management.

Chapter Two: Research Methodology
51
2.2.6.2 Visitor Questionnaire
There are three sections investigating the design of visitor questionnaire. These are:
A) Travel characteristics section
B) Trail Awareness Section
C) Perception Section
A) Travel Characteristics Section
This section has been designed to provide a visitation pattern among visitors. It is essential to
investigate whether visitation patterns are associated with visitors‟ perception towards the
heritage trail experience. In particular, this section investigates the visitation patterns by
measuring visitor‟s frequency of visits, purpose of visit, travel motivations, number of group
members, travel arrangement and type of accommodations. In consequence, it will profile the
visitor in order to determine differing types of visitation patterns and how these influence the
visitors‟ experience while using the heritage trail in this city.
B) Trail Awareness Section
This section is particularly designed to determine a specific group of visitor that has awareness
about the Melaka Heritage Trail. Awareness is known to be an essential component involved in
the creation of attitudes, perception and behaviour (Baker, et al., 1994; Kotler, 1994; McClellan,
1998; Toward & Kerr, 1994). As noted in the previous chapter (see Section 4.9), there are
several thematic heritage trails in this city. Hence, this section plays an importance role to
ensure the respondents are referring to the „official‟ heritage trail. Besides, investigating the
visitors‟ awareness of specific trails, visitors are required to indicate their favourite attractions
along a trail by rating (ascending sequence numbers) according to list names provided. There
are ten locations noted as major attractions along the Melaka heritage trail. For the purpose of

Chapter Two: Research Methodology
52
further analysis, this question is to determine the distribution of visitor preferences according to
their rating score. In addition, it can evaluate how the visitors experience this trail in terms of
their connection to specific places and how these have been rated in terms of major tourist
attractions.
C) Perception Section
This section is the backbone of this questionnaire. The construction of the questionnaire is
based for previous studies related to tourist‟s perception in tourism development at heritage
sites (Poria et al., 2009; Garrod et al., 2007; Kerstetter et al., 2001; McIntosh, 1999) and
sustainable tourism (Moscardo, 1996). Visitors are required to rate their agreement in the
perception statements according to three main concepts or multiple item indicators. These are:
knowledge gained, emotional involvement and behavioural intentions. These concepts are
related to the visitors‟ experience while using the Melaka Heritage Trail. Therefore, each
statement is specifically designed according to the character of the trail. In addition, some of
the statements are designed to triangulate the connection between visitors‟ trail experiences
and contact with residents while using the trail. This is important in terms of how they enjoy the
heritage elements and attractions along the trail, as contact with residents enhances the
visitor‟s experience as well. For example, a visitor may determine that they have enjoyed the
journey over the trail route through experiencing the local culture by trying some of the local
foods and beverages.
2.2.7 Data Analysis
Phase 4 consisted of synthesizing the data from the completed process in Phase 3. Data
obtained from the surveys is analysed using the Statistical Package for the Social Sciences
(SPSS for Windows version 18.0). Descriptive and inferential analyses such as frequencies

Chapter Two: Research Methodology
53
and percentages, cross-tabulations, t-tests, and ANOVA (F-ratio) were utilised. The levels of
probability in the t-tests and F-ratio of immediate significance at the p < .05 Level was chosen
as recommended by Hair et al. (2009) and Denscombe (2007). All these analyses were chosen
to compare independent variables (demographics profiles such as gender, age groups, ethnic
groups, etc.) and dependent variables (attitudes and perceptions).
In regard to the formulation of dependent variables, each attribute was designed to represent
several concepts or multiple questions (from the questionnaire). In order to construct a multiple
item question into a thematic research concept, the consistency of respondents‟ agreement
(based on Likert scale rating) was measured by using Statistical Package for the Social
Science (SPSS) software. The reliability of several questions agreement was constructed by
using the Cronbach‟s Alpha test (reliability analysis). The value was determined by examining
the multiple questions (internal consistency) that emerge from the designed concept. In
addition, in order to perform a reliability analysis, at least three items or questions need to be
combined (statistical calculation). The Cronbach‟s Alpha value (number) normally ranges
between 0 and 1. However, there is actually no lower limit value. The closer Cronbach‟s alpha
coefficient is to 1.0 the greater the internal consistency among the items or statements. George
and Mallery (2003) provide the following rules of thumb: “α > 0.9 = Excellent, α > 0.8 = Good, α
> 0.7 = Acceptable, α > 0.6 = Questionable, α > 0.5 = Poor, and α < 0.5 = Unacceptable”
(p.231).

Chapter Two: Research Methodology
54
2.3 Conclusion
This chapter described the overall approach to the research and presented the strategy behind
the research design, questionnaire development and sampling design. The research is
exploratory in nature, mainly utilising a descriptive research design in data collection and
analysis. Melaka World Heritage Site (WHS) was utilised as a case study, with specific focus
on Melaka Heritage Trail within Melaka WHS. The main aim of the research: to explore the
local community involvement in heritage management in Melaka World Heritage Site, Malaysia.
In particular, residents‟ attachment to the place was investigated, and evaluated against the
residents‟ perception and knowledge of the Melaka Heritage Trail, as a strategy to assess the
involvement of the local community as a whole. Moreover, further information from both local
government personnel and visitors was required to triangulate the findings associated to local
community involvement.
A set of hypotheses were set up based on the seven objectives of the study. The procedures
for analysing the hypotheses were based on the comparison on the rating of mean scores (t-
tests), and analysis of variance (ANOVA) which examines the means of subgroups in the local
communities. In the surveys, there were 305 usable questionnaires from both residents and
visitors. In the interviews with the local community, a total of 60 respondents from residents
within Melaka WHS Zones were involved; and eight officers from related local government
departments were interviewed.