chapter iii research methodology 3.1 research methodology
TRANSCRIPT
Apin Hidayat, 2013 The Use Of Songs In Teaching Students' Listening Ability
Universitas Pendidikan Indonesia | repository.upi.edu
CHAPTER III
RESEARCH METHODOLOGY
This chapter describes method used in this study to answers the two
questions previously stated in chapter one. The chapter covers research design,
instruments, hypothesis, population and sample, research procedures and data
analysis.
3.1 Research Methodology
This research was conducted based on quantitative method to conclude the
data. In doing so, this research used quasi experimental method since it was aimed
to investigate cause and effect relationship. Quasi experimental design is an
adaptation of true experimental design where one of the elements is missing.
Those elements could be manipulation, randomization or control group. This
quasi experimental design was used to anticipate those elements that could not be
fulfilled. Therefore, the researcher decided to use quasi experimental design to
find out the significance of using songs in improving the students’ listening
ability. While, experimental method applied to test the hypothesis served, for that
reason, this research takes two classes; the first class served as experiment class
and the second class served as control class. Later, the result of the research was
described by putting the description of the result data.
3.1.1 Research Design
The design of the research was quasi-experimental design, according to
Apin Hidayat, 2013 The Use Of Songs In Teaching Students' Listening Ability
Universitas Pendidikan Indonesia | repository.upi.edu
Henrichson (1997), a quasi-experimental has some sort of control and
experimental group, but the groups weren’t randomly selected. The group was
classes that have been built or naturally assembled before the research conducted.
The groups were given pre and posttest nonequivalent research design. Hatch and
Farhady (1982, p. 22) stated that the pretest-posttest nonequivalent-groups design
is often used in classroom experiments when experimental and control groups are
naturally assembled groups as intact classes which may be similar. For that
reason, this research involved two classes which are assigned as control and
experimental groups.
The formula is represented as follows:
Based on the design illustrated above, two classes were selected as
experimental and control groups. (G1) is experimental group which was given
treatment (X) and (G2) is control group which was not given treatment. Pretest
(T1) was conducted before the use of song as teaching strategy given to the
experimental class as the treatment, and then at the end of the treatment, posttest
was held to assess students’ listening skills.
3.1.2 Variables
There were two variables in this study. The first variable is dependent
variable and the second is independent variable. The dependent variable in this
study is the students’ listening skill. While, the use of songs as the teaching
Apin Hidayat, 2013 The Use Of Songs In Teaching Students' Listening Ability
Universitas Pendidikan Indonesia | repository.upi.edu
strategy was selected as independent variable and became the major variable to be
investigated.
3.2 Hypothesis
The study begins with null hypothesis (H0) where both classes; experimental
and control class are similar in listening ability.
H0: µexperimental = µcontrol
There is no difference between experimental class and control class in the
mean adjustment level. It means that the mean adjustment level of experimental
and control classes are not different. By using null hypothesis, every possibility of
the result of the study can be shown.
3.3 Population and Sample
The main criterion of the population and sample of this research is the
school where the students have been learning which covers listening. It helped the
researcher to use song in the experiment as the media of teaching listening.
Because of that, the students of a public Junior High School in Sumedang were
chosen as the sample of the research.
3.3.1 Population
The population of the study is the second grade students of a Junior High
School in Sumedang. They are chosen because they have been learning English
which covers listening.
Apin Hidayat, 2013 The Use Of Songs In Teaching Students' Listening Ability
Universitas Pendidikan Indonesia | repository.upi.edu
3.3.2 Sample
Since there were two classes conducted for this research, two classes were
chosen for this research by applying purposive sampling. The researcher chooses
the classes which exist before the research being conducted. There were control
class which is taken by 8-E and 8-F took part as experimental class. Sixty students
were involved in the study. Furthermore, both classes were tested by pre and
posttest. During the experiment, the experimental group was given several
treatments in period of six meetings.
3.4 Data Collection
3.4.1 Research Instruments
Before applying the first test instrument (listening test) to both classes, the
value of validity and readability were sought. In doing so, fifty items of multiple
choice items were tested to another class in order to gain questions items which
are valid and reliable.
The first instrument of the research is listening comprehension test which
aims to measure the students’ listening ability. As mentioned earlier, at the
beginning of the study, the listening test comprises fifty items of multiple choices.
After analyzing it validity, the listening test was narrowed into forty three multiple
choices item which was tested to both experimental and control group. This
listening comprehension test was given to both classes as pre and posttest. The
Apin Hidayat, 2013 The Use Of Songs In Teaching Students' Listening Ability
Universitas Pendidikan Indonesia | repository.upi.edu
purpose of pretest is to measure the students’ listening ability before the treatment,
and posttest is used to measure the students’ listening ability after the treatment
using songs.
The following is the syllabus of Junior High School in listening that were
taken as consideration in developing test items (see table 3.1)
Table 3.1
Syllabus of Second Grade of Junior High School
Aspect Competence Standard Basic Competence
Listening Understanding the meaning of simple
transactional and interpersonal
conversation to interact with their
surroundings
1. Responding expressions
of asking, giving and
refusing services.
2. Responding expressions
of asking, giving and
rejecting information.
3. Responding expressions
of asking, giving and
rejecting opinion.
4. Responding expressions
of asking, accepting and
rejecting offers.
Apin Hidayat, 2013 The Use Of Songs In Teaching Students' Listening Ability
Universitas Pendidikan Indonesia | repository.upi.edu
3.4.2 Questionnaires
In this research, the researcher used questionnaire in the form of rating
scales. Rating scales questionnaire is very useful for the researcher for its
effectiveness in building degree of sensitivity of response which will generate
numbers (Cohen et al. 2007, p. 325). A questionnaire used in this research was
basically used to gain information from the respondents.
The purpose of the researcher in using questionnaire is to know difficulties
faced by the students in listening comprehension using songs. This would also
help the writer in providing a suggestion and to support the result of this study.
3.5 Research Procedures
3.5.1 Organizing Teaching Procedure
The researcher was performed as the teacher in both of control and
experimental group. The researcher was conducted two steps; first, the researcher
prepares appropriate materials for teaching and learning process during the
treatment. Second, the researcher organizes teaching procedures in both of control
and experimental groups.
In the experimental group, the teaching materials and procedures were
highly related to the implementation of song as a strategy in teaching listening.
While in the control group, the combination of listening through songs, and
lecturing learning strategy were applied.
Apin Hidayat, 2013 The Use Of Songs In Teaching Students' Listening Ability
Universitas Pendidikan Indonesia | repository.upi.edu
Table 3.2
Research Schedule
No
Experimental Group Control Group
Date Material Date Material
1 25-7-2012 Pretest 25-7-2012 Pretest
2 30-8-2012 Song (Can’t
smile without
you & Hey soul
sister)
30-8-2012 Expressions of
asking and
giving services
3 2-8-2012 Song (Honey
honey & Skater
boy)
1-8-2012 Expressions of
refusing
services
4 3-8-2012 Song (Just the
way you are &
You’re
beautiful)
6-8-2012 Expressions of
asking and
giving
information
5 9-8-2012 Song (Gone too
soon & Your
guardian angel)
8-8-2012 Expressions of
rejecting
information
Apin Hidayat, 2013 The Use Of Songs In Teaching Students' Listening Ability
Universitas Pendidikan Indonesia | repository.upi.edu
6 13-8-2012 Song (So far
away & When I
see you)
13-8-2012 Expressions of
asking, giving
and rejecting
opinion
7 16-8-2012 Song (I wanna
be with you % I
walk beside
you)
15-8-2012 Expressions of
asking,
accepting and
rejecting
offers.
8 20-8-2012 Posttest 20-8-2012 Posttest
3.5.2 Administering Try-out Test
Before the instruments were applied in the research, the researcher was
administered try out test to investigate the validity and reliability of the
instrument. Try-out test consisted of fifty multiple choice questions related to the
simple transactional dialogue based on basic competence in syllabus. The test
materials were adopted from internet-based listening test available at www.esl-
lab.com. The try-out test was conducted in class VIII of Junior High School in
Sumedang before the experimental teaching began.
Apin Hidayat, 2013 The Use Of Songs In Teaching Students' Listening Ability
Universitas Pendidikan Indonesia | repository.upi.edu
3.5.2.1 Validity test
To analyze validity of the test, this research was used external validity
analysis by correlating the students’ score of listening test with students’
summative score of English which were taken from their mid-term report book.
To correlate them, the formula of Pearson Product Moment Correlation
Coefficient Values is used.
Where r is Pearson Product Moment Correlation Coefficient Values, N is
number of students who are analyzed, x is students’ listening score (first variable)
and y is students’ summative score (second variable). Afterwards, every item on
the instrument was also analyzed by using Pearson Product Moment Correlation
Coefficient Values gained by distributing the data to statistical program; Anates
v.4 to determine correlation index for every items. This analysis was conducted
through correlating every single item of instrument (x) with total score of
instrument (y). Next, the r is interpreted as follows:
Apin Hidayat, 2013 The Use Of Songs In Teaching Students' Listening Ability
Universitas Pendidikan Indonesia | repository.upi.edu
Table 3.3 Index of Validity Level
Coefficient Interval (r) Validity Level
0.800 – 1.000 Excellent (Ex)
0.600 – 0.799 Good (Gd)
0.400 – 0.599 Satisfying (St)
0.200 – 0.399 Poor (Pr)
0.000 – 0.199 Very Poor (Vp)
(Adopted from Riduwan 2004:110)
3.5.2.2 Reliability test
This research used KUDER RICHARDSON-20 (KR-20) method to analyze
reliability of instrument. The purpose of using this method is to gain a higher
reliability value, since the result of KR-20 tends to give a higher value than the
other methods such as KR-21, Anova Hoyt, and Alpha. (Arikunto 1999). Every
single right answer is valued 1 and every wrong answer is 0.
Apin Hidayat, 2013 The Use Of Songs In Teaching Students' Listening Ability
Universitas Pendidikan Indonesia | repository.upi.edu
KUDER RICHARDSON-20 (KR-20) formula:
r11 = Internal reliability coefficient for all items
K = sum of question item
P = proportion of subjects who answer right
q = proportion of subjects who answer wrong (q = 1 – p)
s2
= variance total
Afterward, the value of r11 is compared with index of Pearson Product
Moment Correlation Coefficient Values to see whether the value is reliable or not.
3.5.3 Treatments
Two first grade classes in Junior High School in Sumedang, VIII F as the
experimental group and VIII E as the control group, were selected as the subject
of the research. The experimental group was exposed to the song strategy in
listening while the control group was taught by using conventional technique in
teaching listening.
Apin Hidayat, 2013 The Use Of Songs In Teaching Students' Listening Ability
Universitas Pendidikan Indonesia | repository.upi.edu
3.5.4 The Result of the Test
Before using the instruments to the targeted respondents, the validity and
reliability of the instrument was sought. The result is shown as follows.
3.5.4.1 Validity and Reliability Instrument
The first step of the experiment is administering validity and reliability of
the tests. As the researcher mentioned earlier, this research used external validity
to seek correlation value. The test comprises of fifty question items which applied
to the respondents, students of a public junior high school in Sumedang, on July
23, 2012. From the calculation, the instrument is valid in level 0.01 which has
minimum value 0.393 with r = 0.790135953
The second step is instrument item validity; the instrument item was
analyzed using SPSS v.20. From the calculation it is shown that:
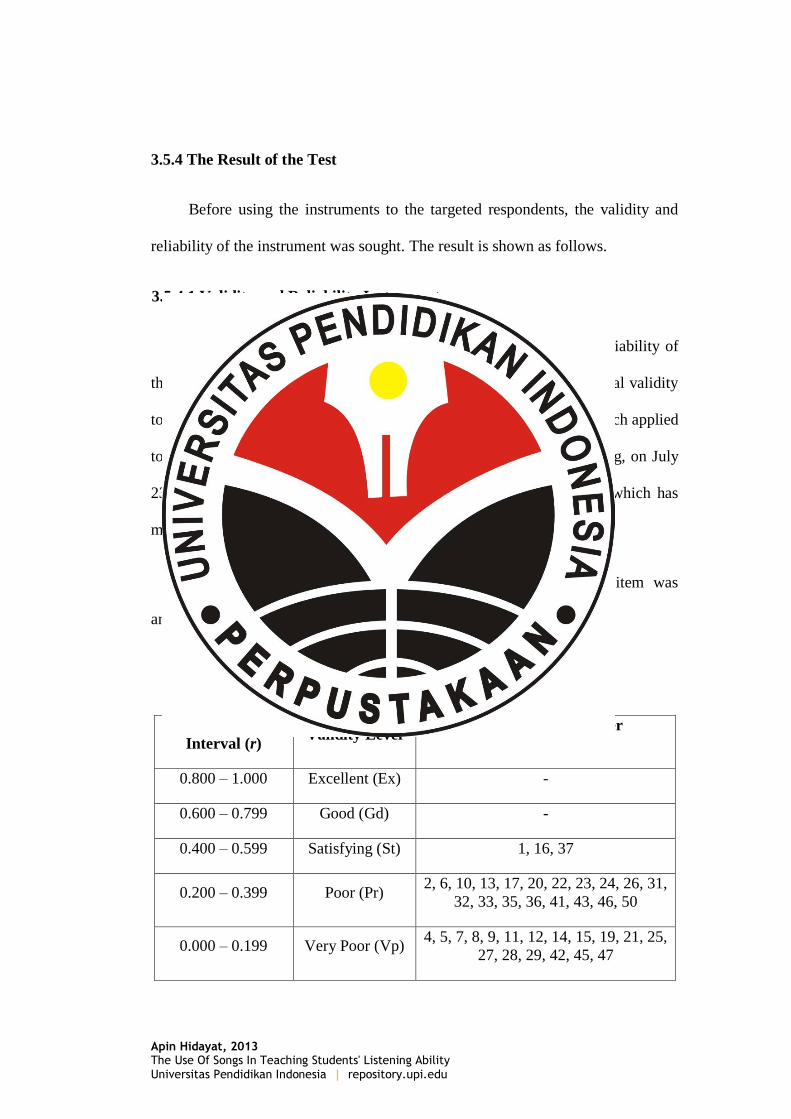
Table 3.4 Index of Validity for Question Items
Coefficient
Interval (r) Validity Level
Question Item number
0.800 – 1.000 Excellent (Ex) -
0.600 – 0.799 Good (Gd) -
0.400 – 0.599 Satisfying (St) 1, 16, 37
0.200 – 0.399 Poor (Pr) 2, 6, 10, 13, 17, 20, 22, 23, 24, 26, 31,
32, 33, 35, 36, 41, 43, 46, 50
0.000 – 0.199 Very Poor (Vp) 4, 5, 7, 8, 9, 11, 12, 14, 15, 19, 21, 25,
27, 28, 29, 42, 45, 47
Apin Hidayat, 2013 The Use Of Songs In Teaching Students' Listening Ability
Universitas Pendidikan Indonesia | repository.upi.edu
<0.00 – 0.000 Invalid 3, 34, 38, 39, 40, 48, 49.
(Adopted from Riduwan 2004: 11)
The calculation shows that from fifty question items of listening
comprehension tested, there are forty three items categorized as valid and seven
items categorized as invalid. So that forty three items of listening comprehension
test are taken as the instrument of this research.
Furthermore, every question item was analyzed using KR-20. From the
calculation, it is shown that the reliability value (r11) is 0.30423. This result is
reliable at level .001 which has minimum value 0.257. It can be concluded that the
selected question items which have higher validity and reliability than the
minimum value, is presumed can be used to measure students’ ability in listening.
3.5.5 Listening Test (Pretest and Posttest)
As the researcher mentioned earlier, 30 question items were taken as the
instrument to measure students’ ability in listening. The question items were taken
from three question items which are classified as satisfying items, nineteen
question items which are classified as poor items, and nine question items which
are classified as very poor items. Those question items can be seen on Appendix.
Then, the selected question items were given to the respondents as pre-test and
post-test.
The aims of pretest are to investigate the students’ initial ability and to the
equivalence between the groups. In doing so, the researcher used t-test formula,
Case II studies or independent sample test. In order to meet the requirement of t
Apin Hidayat, 2013 The Use Of Songs In Teaching Students' Listening Ability
Universitas Pendidikan Indonesia | repository.upi.edu
test formula, there are three conditions that must be done. In line with this
statement, Hatch & Farhady (1982, p. 114) states that there are three assumptions
underlying the t-test, among other: (1) The subject is allotted to one group in
experiment, (2) The variances’ scores are equal and normally distributed, and (3)
The scores on the independent variable are continuous. For that reason, the
researcher did the normality distribution and variance homogeneity test before
analyzing the data using t-test formula.
3.5.6 Normality of Distribution Test
In this study, the researcher used the SPSS 20 for windows to analyze the
normally distribution of the scores with the steps as follows:
1. Stating the hypothesis and setting the alpha level at 0.05 (two tailed test)
H0= the scores of the experimental and control group in pretest are not
normally distributed
2. Analyzing the normality distribution using Kolmogrov-Smirnov formula
in SPSS 20 for windows.
3. Comparing the Asymp Sig with the level of significance to test the
hypothesis.
If the Asymp Sig < level of significance (0.05), then the null hypothesis
accepted; the scores are not normally distributed. While, if the Asymp Sig > level
of significance (0.05), then the null hypothesis is rejected; the scores are normally
distributed.
Apin Hidayat, 2013 The Use Of Songs In Teaching Students' Listening Ability
Universitas Pendidikan Indonesia | repository.upi.edu
3.5.7 The Homogeneity of Variance Test
In analyzing the variance homogeneity of the scores, the researcher used the
Levene Test formula in SPSS 20 for window. The analyzing of variance
homogeneity follows the steps below:
1. Stating the hypothesis and setting the alpha level at 0.05
H0= the variance of the experimental and control group in pretest are not
homogenous
After the null hypothesis stated, then the research continued by analyzing
the variance homogeneity using Levene Test formula in SPSS 20 for
windows.
2. Comparing the probability with the level significance for testing the
hypothesis.
If the probability < level of significance (0.05), then the null hypothesis is
accepted; variance of the experimental and control group are not homogenous.
While, if the probability > the level of significance (0.05) the null hypothesis is
rejected; variance of the experimental and control group are homogenous.
3.5.8 The Calculation of t-test
After analyzing the normally distribution and the homogeneity of variance,
the next step of the research is the t-test calculation (The calculation were
performed in SPPS 20 for window), the calculation is as follow:
Apin Hidayat, 2013 The Use Of Songs In Teaching Students' Listening Ability
Universitas Pendidikan Indonesia | repository.upi.edu
1. The calculation started by stating the hypothesis and setting the alpha
level at 0.05 (two tailed test)
H0 = there is no significant difference between pretest and posttest scores in
experimental group
2. The second step is finding the t value
3. And the last step is done by comparing the probability with the level of
significance for testing the hypothesis. If the probability is more than or
equal to the level of significance, the null hypothesis is accepted; the two
groups are equivalent. While, if the probability is less than the level of
significance, the null hypothesis is rejected; there is significant difference
between pretest and posttest scores in experimental group.
3.5.9 Data Analysis on the Posttest
In calculating the posttest data, the researcher used the same steps as in
calculating the pretest data. The researcher used t-test formula, Case II studies or
independent sample test.
3.5.10 Data Analysis on the Experimental and the Control Group Scores
In analyzing the data, the researcher analyzed the pretest and posttest scores
of experimental and control group using the matched t-test to investigate whether
or not the difference of the pretest and posttest means of each groups is
significant. In doing so, the steps are as follows:
1. The first step is stating the hypothesis and setting the alpha level at 0.05
(two tailed test)

Apin Hidayat, 2013 The Use Of Songs In Teaching Students' Listening Ability
Universitas Pendidikan Indonesia | repository.upi.edu
H0 = there is no significant difference between the pretest and posttest scores
2. The second step is finding the t value
3. The last step is comparing the probability with the level of significance
for testing the hypothesis. If the probability is smaller than the level of
significance, the null hypothesis is accepted; there is no significant
difference between pretest and posttest scores. While, if the value of
probability is larger than or equal to the level of significance (0.05), then the
null hypothesis is rejected; there is a significant difference between pretest
and posttest scores. (The calculations were analyzed by SPSS 20 for
window).
The scores of pre- and post-tests for the experimental group were also being
analyzed to find out the level of listening comprehension mastery before and after
learning song strategy or before and after treatment. Computing the average of
each test was necessary to find out the mastery of listening comprehension. In
doing so, the average scores of each test were calculated, so the mastery of each
test will be known. The formula to compute average is as follows:
Where:
Mx = average x (before treatment)
Apin Hidayat, 2013 The Use Of Songs In Teaching Students' Listening Ability
Universitas Pendidikan Indonesia | repository.upi.edu
∑x = the sum of x scores (pretest)
N = the number subjects
And
Where:
My = average y (after treatment)
∑y = the sum of y scores (posttest)
N = the number subjects
After finding the average of each test, then the next step is interpreting
what it means. The interpretation of the average lead us to knowing to what extent
the mastery of listening comprehension before and after treatment will be. In line
with this, Arikunto (1999) classifies the range of scores with its probable class
performance. The classification is as the following:
Table 3.5
Classification of the Range of Score

Apin Hidayat, 2013 The Use Of Songs In Teaching Students' Listening Ability
Universitas Pendidikan Indonesia | repository.upi.edu
Test scores Probable Class
Performance
80 – 100
66 – 79
56 – 55
40 – 55
30 – 39
Good to excellent
Average to good
Relatively
Poor to average
Poor