research article computer-aided teaching system based on
TRANSCRIPT
Research ArticleComputer-Aided Teaching System Based on Data Mining
Yonghua Tang ,1 Qiang Fan,2 and Peng Liu 1
1LuXun Academy of Fine Arts, Dalian 116600, China2Criminal Investigation Police University of China, Shenyang 110035, China
Correspondence should be addressed to Peng Liu; [email protected]
Received 16 July 2021; Revised 9 September 2021; Accepted 21 September 2021; Published 11 October 2021
Academic Editor: Rajesh Kaluri
Copyright © 2021 Yonghua Tang et al. This is an open access article distributed under the Creative Commons Attribution License,which permits unrestricted use, distribution, and reproduction in any medium, provided the original work is properly cited.
The traditional teaching model cannot adapt to the teaching needs of the era of smart teaching. Based on this, this paper combinesdata mining technology to carry out teaching reforms, constructs a computer-aided system based on data mining, and constructsteaching system functions based on actual conditions. The constructed system can carry out multisubject teaching. Moreover, thispaper uses a data mining system to mine teaching resources and uses spectral clustering methods to integrate multiple teachingresources to improve the practicability of data mining algorithms. In addition, this paper combines digital technology to dealwith teaching resources. Finally, after building the system, this paper designs experiments to verify the performance of thesystem. From the research results, it can be seen that the system constructed in this paper has certain teaching and practicaleffects, and it can be applied to a larger teaching scope in subsequent research.
1. Introduction
With the continuous development and popularization ofinformation technology, comprehensive informatization hasbecome the inevitable development direction of this era. Thisis especially true in the field of education, and digital educa-tion makes teaching content more reliable and has a uniformstandard [1]. From the recording and broadcasting onlineschool in the late 1990s to the higher education resourcesharing platform, “Love Course,” which provides completevideo resources, to the “China University MOOC” onlineopen course class that integrates teaching, Q&A, testing,and homework teaching, to the “NetEase Cloud Classroom”that can realize real-time interactive online live teaching[2], modern education is closely related to the informationage, and building a teaching platform based on informationtechnology is the direction of reform of teaching informatiza-tion in major colleges and universities [3].
Teaching decisions are the process of analyzing, judging,exploring, and choosing teaching implementation plans inorder to achieve teaching objectives. Teaching is a controlleddynamic complex system, to achieve effective control of sys-
tem motion, requires timely confirmation of various ele-ments and its interaction relationships in the system, andmakes decisions according to the corresponding teachingprinciples. Data is an important basis for teaching decisions.The smart teaching platform provides data on the status ofthe learner but is currently only an evaluation method forstudents. In traditional teaching activities, students are oftencollected in the forms of students or exams due to the collec-tion and analysis of students’ data, and the teaching behaviorof teachers has a great impact.With today’s scientific and tech-nical assistance, the extraction of teaching data is no longer aproblem, but the use of teaching data is used in teaching eval-uation, teaching management, statistical attendance, etc., andthe teaching of teachers is not much. In summary, in the envi-ronment of education big data, how to help teachers give fullplay to the teaching process and how to use the data in thesmart teaching platform to optimize the teaching decisionsare the core issues of the research in education.
This paper applies data mining technology to computer-assisted teaching to build a data mining-based smart teach-ing system and improves the traditional teaching mode toimprove the teaching effect.
HindawiWireless Communications and Mobile ComputingVolume 2021, Article ID 3373535, 12 pageshttps://doi.org/10.1155/2021/3373535
2. Related Work
Regarding the characteristics and value of smart classrooms,literature [4] believed that mobile terminal-based interactioncan help improve children’s developmental learning andsocial skills. Literature [5] believed that with the help ofwireless smart devices, learners’ participation in classroomlearning can be improved. Literature [6] believed that theteaching terminal based on the smart classroom can clarifythe geographical location and learning progress of the stu-dents, determine the current teaching activities of students,recommend learning resources according to the needs of stu-dents, and support effective real-time collaboration andresource sharing between teachers and students, as well as stu-dents and students. Literature [7] believed that a smart class-room is a new type of classroom, and the fundamental goalis to cultivate students’ wisdom. The smart classroom focusesnot only on the knowledge level of the learner and the scoresobtained in the exam but also on stimulating the potential ofstudents and focusing on cultivating students’ wisdom. Litera-ture [8] believed that the cultivation of wisdom should existthroughout the entire classroom teaching process and useexperience and accumulated thinking experience to enhancewisdom so as to achieve the ultimate goal of using wisdomto solve problems. Literature [9] reshaped and upgraded theflipped classroom and proposed a breakthrough from aflipped classroom to a smart classroom in terms of resourcequality improvement and teaching method optimization.
As a probe into the teaching mode of the theoretical levelin a wisdom classroom, Literature [10] believes that learnerscan personalize and autonomously learn from their ownrhythm in wisdom class. Document [11] is a research onthe autonomous constructive processing and treatment oflearners in the smart classroom. Literature [12] believed thatwisdom learning is in a contextual environment, providingstudents with a wide range of learning resources for stu-dents, and promotes new learning paradigms of educationdevelopment. In order to achieve smart learning, literature[13] designed a smart learning system model includingcloud computing, learning analysis technology, and mixedreality, reflecting the three major characteristics in the pro-cess of education, interactive, personalized custom, andindependent control. Document [14] shows that on the basisof studying the intelligence learning connotation, the con-ceptual framework of wisdom learning is built, and four wis-dom learning models are designed. Literature [15] believedthat the technical characteristics of the wisdom class havedesigned a learning model based on the wisdom class, andthe application research of the learning model is designed.Literature [16] gave a “three-section ten-step” structuralmodel of the wisdom class through the comparison with tradi-tional classroom teaching processes. As a research on wisdomclassroom teaching practice, Literature [17] reshaped andupgraded the wisdom classroom learning environment fromhardware and software, thereby solving the failure of teachersand students in LMS (Learning Management Services). Docu-ment [18] shows that based on the ITLA (Integrated Teachingand Learning Assistance) system, it studied important factorsthat determine the effective development of the wisdom
class. Literature [19] is supported by the HiTeach Interac-tive System, compared to traditional classrooms and wisdomclassroom teaching, exploring the positive significance ofteaching in teaching. About wisdom classroom teaching eval-uation, Literature [20] shows the response to the teachingstrategy of the wisdom classroom teaching under the net-work learning space while presenting the teaching strategyof the teacher’s teaching behavior and the student’s learningbehavior for teaching evaluation.
3. Spectral Clustering-AidedTeaching Algorithm
Spectral clustering is a very popular research field in clusteranalysis. Its main idea is to obtain a graph cut through thefeature decomposition of the graph (Laplacian matrix). It isa clustering method based on a graph cut. This researchmainly introduces the spectral graph theory, the graph par-tition method, the spectral clustering algorithm of spectralclustering, and the problems existing in spectral clusteringat present.
We first give a set X = fx1, x2,⋯, xng, xi ∈ Rl, which con-tains n data points. We assume that each data sample isregarded as a vertex V in the graph, and the edge E betweenthe vertices is assigned a weight valueW according to the sim-ilarity between the samples so that an undirected weightedgraph G = ðV , EÞ based on the sample similarity is obtained.It can be defined with the following formula [21]:
wij = exp −d2 xi, xj� �
2δ2
!: ð1Þ
Among them, wij is the similarity value between points xiand xj, and dðxi, xjÞ is the Euclidean distance between pointsxi and xj, and δ is the scale parameter, which controls thespeed at which the similarity value wij decays with the Euclid-ean distance dðxi, xjÞ.
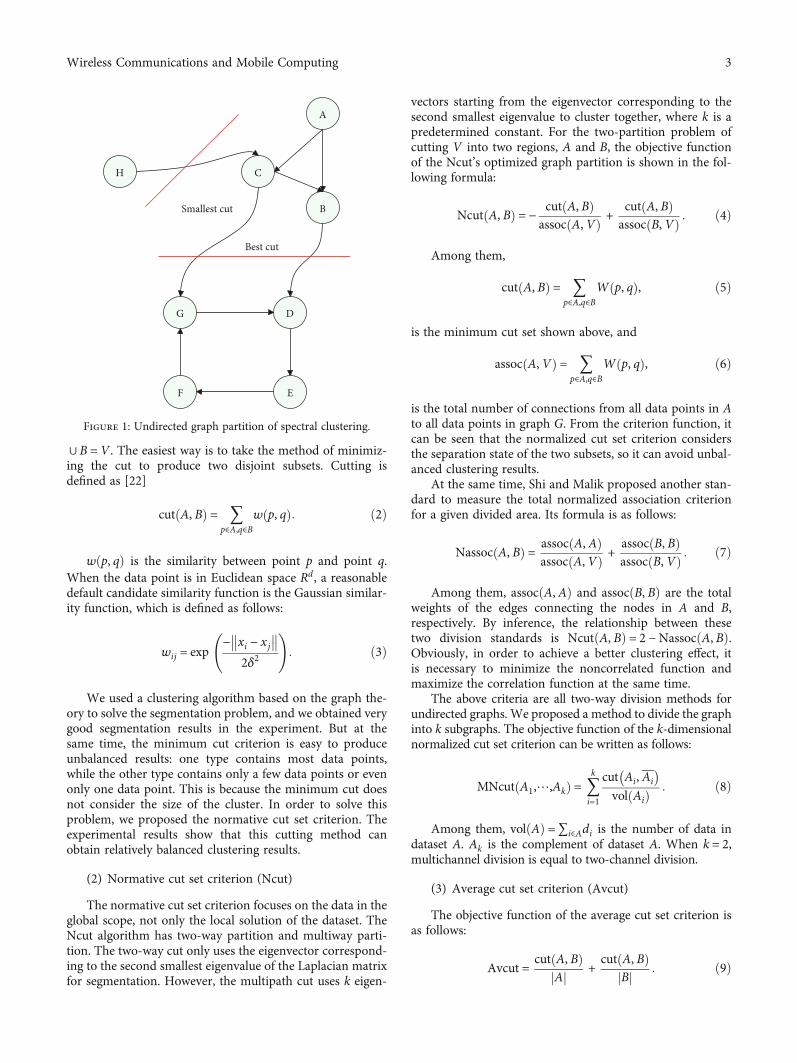
The clustering problem can be expressed as a cut prob-lem on the graph. The result of the cut is as far as possibleto minimize the similarity between the two subgraphs andmaximize the internal similarity. The quality of the cluster-ing results is directly related to the quality of the cut criteria.As shown in Figure 1, through a cut strategy, H can bedivided into one category, and all other points can bedivided into another category. Alternatively, another classifi-cation strategy can be used to classify H, A, B, and C intoone category and D, E, G, and F into another category. Obvi-ously, the second cut strategy can divide undirected graphsinto two more balanced categories. Common cut criteriainclude the minimum cut criterion, the normalized cut crite-rion, the ratio cut criterion, and the average cut criterion.
(1) Minimum cut set criterion
Now, we first consider the simplest case: two-way cut.The undirected weighted graph G is divided into two subsetsA and B that do not want to intersect, where A ∩ B =∅, A
2 Wireless Communications and Mobile Computing
∪ B =V . The easiest way is to take the method of minimiz-ing the cut to produce two disjoint subsets. Cutting isdefined as [22]
cut A, Bð Þ = 〠p∈A,q∈B
w p, qð Þ: ð2Þ
wðp, qÞ is the similarity between point p and point q.When the data point is in Euclidean space Rd , a reasonabledefault candidate similarity function is the Gaussian similar-ity function, which is defined as follows:
wij = exp− xi − xj�� ��2δ2
!: ð3Þ
We used a clustering algorithm based on the graph the-ory to solve the segmentation problem, and we obtained verygood segmentation results in the experiment. But at thesame time, the minimum cut criterion is easy to produceunbalanced results: one type contains most data points,while the other type contains only a few data points or evenonly one data point. This is because the minimum cut doesnot consider the size of the cluster. In order to solve thisproblem, we proposed the normative cut set criterion. Theexperimental results show that this cutting method canobtain relatively balanced clustering results.
(2) Normative cut set criterion (Ncut)
The normative cut set criterion focuses on the data in theglobal scope, not only the local solution of the dataset. TheNcut algorithm has two-way partition and multiway parti-tion. The two-way cut only uses the eigenvector correspond-ing to the second smallest eigenvalue of the Laplacian matrixfor segmentation. However, the multipath cut uses k eigen-
vectors starting from the eigenvector corresponding to thesecond smallest eigenvalue to cluster together, where k is apredetermined constant. For the two-partition problem ofcutting V into two regions, A and B, the objective functionof the Ncut’s optimized graph partition is shown in the fol-lowing formula:
Ncut A, Bð Þ = −cut A, Bð Þ
assoc A, Vð Þ +cut A, Bð Þassoc B, Vð Þ : ð4Þ
Among them,
cut A, Bð Þ = 〠p∈A,q∈B
W p, qð Þ, ð5Þ
is the minimum cut set shown above, and
assoc A,Vð Þ = 〠p∈A,q∈B
W p, qð Þ, ð6Þ
is the total number of connections from all data points in Ato all data points in graph G. From the criterion function, itcan be seen that the normalized cut set criterion considersthe separation state of the two subsets, so it can avoid unbal-anced clustering results.
At the same time, Shi and Malik proposed another stan-dard to measure the total normalized association criterionfor a given divided area. Its formula is as follows:
Nassoc A, Bð Þ = assoc A, Að Þassoc A,Vð Þ +
assoc B, Bð Þassoc B, Vð Þ : ð7Þ
Among them, assocðA, AÞ and assocðB, BÞ are the totalweights of the edges connecting the nodes in A and B,respectively. By inference, the relationship between thesetwo division standards is NcutðA, BÞ = 2 −NassocðA, BÞ.Obviously, in order to achieve a better clustering effect, itis necessary to minimize the noncorrelated function andmaximize the correlation function at the same time.
The above criteria are all two-way division methods forundirected graphs. We proposed a method to divide the graphinto k subgraphs. The objective function of the k-dimensionalnormalized cut set criterion can be written as follows:
MNcut A1,⋯,Akð Þ = 〠k
i=1
cut Ai, Ai
� �vol Aið Þ : ð8Þ
Among them, volðAÞ =∑i∈Adi is the number of data indataset A. Ak is the complement of dataset A. When k = 2,multichannel division is equal to two-channel division.
(3) Average cut set criterion (Avcut)
The objective function of the average cut set criterion isas follows:
Avcut = cut A, Bð ÞAj j + cut A, Bð Þ
Bj j : ð9Þ
H
A
B
C
D
EF
G
Smallest cut
Best cut
Figure 1: Undirected graph partition of spectral clustering.
3Wireless Communications and Mobile Computing
It can be seen from the formulas of the normative cut setcriterion and the average cut set criterion that these two for-mulas both express the relationship between the boundaryloss and the correlation of the divided regions in the undi-rected weighted graph G in the form of the sum of ratios.This shows that the objective function of the minimum scalecut set criterion and the normalized cut set criterion can becut more accurately. Their common disadvantage is that it iseasy to segment very small subgraphs containing only a fewpoints, and they are undersegmented. It can be seen from theexperimental results in the literature that the cut result of thenormative cut set criterion is better than that of the averagecut set criterion.
(4) Ratio cut set criterion (Rcut)
The formula of the ratio cut set criterion function is asfollows:
Rcut = cut A, Bð Þmin Aj j, Bj jð Þ : ð10Þ
Among them, ∣A ∣ and ∣B ∣ represent the number of ver-tices of subgraphs A and B, respectively.
The advantage of this criterion is that when minimizingthe criterion function, only the minimum similarity betweenclasses needs to be considered, which reduces the possibilityof oversegmentation, but the disadvantage is that the operat-ing efficiency is too low.
(5) Minimum-maximum cut set criterion (Mcut)
The min-max cut criterion maximizes assocðA, AÞ andassocðB, BÞ while minimizing cutðA, BÞ. The objective func-tion of this criterion is as follows:
Mcut = cut A, Bð Þassoc A, Að Þ + cut A, Bð Þ
assoc B, Bð Þ : ð11Þ
Among them, assocðA, AÞ and assocðB, BÞ are the totalweights of the edges connecting the nodes in A and B,respectively. By minimizing the criterion function, under-segmentation or only segmentation of smaller subgraphscontaining a few vertices can be avoided. Therefore, by min-imizing the minimum-maximum cut set criterion function,a more balanced cut set can be obtained, but the realizationspeed is relatively slow. Both the minimum-maximum cutset criterion and the normative cut set criterion can satisfythe clustering principle that the similarity within a class issmall, but the similarity between classes is large. The differ-ence is that when the overlap between classes is too large,the cut effect of the normative cut set criterion is not as goodas the minimum-maximum cut set criterion.
The adjacency matrix (denoted as W or A) is alsocalled the similarity matrix, and the Laplacian matrix(denoted as L) is a common representation of graphs. Thesimilarity matrix of the weighted graph uses real numbersto reflect the different relationships between the vertices.
The elements in this matrix can be expressed by the followingformula:
wij = exp −d2 xi, xj� �
2δ2
!, i ≠ j: ð12Þ
Among them, xi is the i-th sample point in the dataset,and dðxi, xjÞ is the distance between the sample point xiand the sample point xj. The distance can use any form ofdistance function, and the more commonly used is theEuclidean distance kxi − xjk. In the formula, δ is the nuclearradius, which is a parameter that needs to be given inadvance. In the clustering algorithm, the attenuation ratewij is constrained by the parameter δ, so a proper value ofδ must be given to improve the clustering accuracy of thealgorithm. The row vectors in wij represent the distributionof the dataset, and they are usually distributed on the hyper-sphere of the k-dimensional space. Researchers usually usedegrees to represent the distribution of the dataset aroundthe point, and the diagonal matrix composed of all the degreevalues as diagonal elements is the degree matrix, which isusually represented by D:
Dij = 〠n
i=1wij: ð13Þ
Among them, n is the number of sample points.The Laplacian matrix is L =D −W, where D is the
degree matrix and W is the similarity matrix. Most spectralclustering algorithms cut graphs based on the spectrum ofthe Laplacian matrix. Laplacian matrices can be divided intotwo types: nonnormalized Laplacian matrix L and normal-ized Laplacian matrix. The normalized Laplacian matrixincludes a symmetric form (denoted as Ls) and a randomwalk form (denoted as Lr).
There are many spectral clustering algorithms. The dif-ference lies in how to choose the object function and howto construct the affinity matrix of the graph, but the basicframework is the same.
Step 1. According to the given dataset, the algorithm con-structs a graph matrix, and there are different methods fordifferent situations.
Step 2. The algorithm solves the first k eigenvectors of thematrix and constructs the eigenspace Rk.
Typical spectral clustering algorithms such as the Shiand Marik algorithm; Kan R, Vempala S, and Vetta A algo-rithm; Ng, Jordan, and Weiss algorithm; link algorithm; andMarkov random walk algorithm have achieved the expectedapplication effect.
(1) SM algorithm
The normative cut set criterion is a very popular tech-nique in spectral clustering, and it has achieved good results
4 Wireless Communications and Mobile Computing
Cloud service system
Mobile terminal subsystem
......
Course recording and broadcastingsubsystem
Electronic file consulting system
Classroom response subsystem
Interactive presentation subsystem
Video conference subsystem
Wearable device subsystem
Ubiquitous technologysystem
Real-time recordingsystem
Augmented realitysystem
Smart classroom
Infrastructuresubsystem
Network awarenesssystem
Visual managementsystem
Physical space subsystem
Table and chair device subsystem
Power supply and distributionsubsystem
Ventilation and air conditioningsubsystem
Lighting subsystem
Network access subsystem
Central control subsystem
Monitoring subsystem
Radio frequency identificationsubsystem
Human body recognition subsystem
Figure 2: Smart classroom “I-SMART” model.
Technology
Student Group
ContentRule Division oflabor
Smart classroom
Student andtechnicalhuman-
computerinteraction
Teacher andtechnicalhuman-
computerinteraction
Studentsinteract with
learningcontent
Teachersinteract with
learningcontent
Figure 3: Interactive teaching model in a smart classroom environment.
5Wireless Communications and Mobile Computing

in the application of image segmentation. The normative cutset criterion can be described as follows:
min Ncut A, Bð Þ =min xT D −Wð ÞxxTDx
s:t: xTWe = xTDe = 0:
8><>:
ð14Þ
This is an NP-hard problem. Fortunately, the problemcan be solved by relaxing the discrete constraint of x. Weassume that x is a real value, the objective function can besolved by the Rayleigh quotient, and this problem can betransformed into the second smallest eigenvalue of the solv-ing formula ðD −WÞx = λDx. The SM algorithm can bedescribed as follows.
Smar
t tea
chin
g pl
atfo
rm
Teacher-student discussion
Student discussion
Sign in
Poll questionnaire
Rush to answer
Choosing
Score
Objective question
Subjective questions
......
Learning progress data
Course management
Class management
Course resources
Student data
Chapter quiz
Performance management
Teaching warning
Course information
Question bank
Figure 4: Data in the smart teaching platform.
High rate of positiveanswers and reliability
High rate of beinganswered correctly but
unreliable
The rate of positiveanswers is low and reliable
The rate of positive answers is lowand unreliable
Yio
CSi
Figure 5: Yio-CSi model.
6 Wireless Communications and Mobile Computing
High rate of positiveanswers and reliability
High rate of beinganswered correctly but
unreliable
The rate of positiveanswers is low and reliable
The rate of positive answers is lowand unreliable
Yjo
CPj
Figure 6: Yjo-CPj model.
Teacher beliefs
Internal factors
Teaching knowledge
Students know
External factor
Course objectives
Content knowledge
Teaching goal decision/teaching content decision
Adaptive teaching goals
Student behavior Learning status
Disc
ussio
n vo
lum
e
Num
ber o
f tas
ksco
mpl
eted
Vid
eo w
atch
time
Stud
ent s
tudy
repo
rt
Num
ber o
f visi
ts
Test
data
Teac
hing
man
agem
ent
Perfo
rman
cem
anag
emen
t
Teaching method decisionteaching management decision
Implement teaching Feedback
learningresult
Teachingeffect
Teaching planning stageInteractive teaching stageTeaching evaluation stage
Figure 7: Teaching decision model based on teaching data.
7Wireless Communications and Mobile Computing

Step 1. The algorithm first constructs the similarity matrixW ∈ RN×N and calculates the Laplacian matrix according tothe formula L =D −W.
Step 2. The algorithm calculates the first k-generated eigen-values λ1, λ2,⋯, λk and obtains the corresponding eigen-
vector v1, v2,⋯, vk according to the formulaðD −WÞx = λDx.
Step 3. The algorithm uses the eigenvectors calculated in thesecond step to construct a matrix Q ∈ RN×K .
Reduce the burden of teaching
Improve teaching efficiency
Direct teacher demand
Demand for students
Demand for the platform
Smooth communicationDetailed teaching process
FluencyReview assignment
......Convenience
Figure 8: Teacher-platform-student needs analysis.
Strategic level
Product goal
User goals
Improve teachingeffect
Improve learning effect
Completedexperiment
Improve teaching efficiency
Enhance learning interest
Reduce the difficulty of teaching
Master student status
Application knowledge
Easy to learn
Grasp knowledge
Complete the experiment report
Figure 9: The strategic layer of the smart teaching platform.
8 Wireless Communications and Mobile Computing

Step 4. The algorithm uses the second smallest eigenvalueand the corresponding Fiedler vector to find the cuttingpoint to cut the graph through the Fiedler vector so thatNcut is the smallest. In the Fiedler vector, the larger than thispoint is divided into one category, and the smaller than thispoint is divided into another category. The normalized adja-cency matrix defined by the algorithm is as follows:
N =D−1/2WD−1/2 : N i, jð Þ = W i, jð ÞffiffiffiffiffiffiffiffiffiffiffiffiffiffiffiffiffiffiffiffiffiffiffiffiD i, ið ÞD j, jð Þp : ð15Þ
Step 5. The algorithm uses the k-means algorithm to clusterthe matrix O into k categories C1, C2,⋯, Ck.
The computational complexity of solving the eigenvalueproblem of all eigenvectors is Oðn3Þ, where n is the numberof input sample sets.
(2) NJW algorithm
The above SM algorithm only uses Fiedler vectors, butthe NJW algorithm uses k feature vectors at the same time.Because when calculating the k-way partition, using morefeature vectors will achieve better results. The NJW algo-rithm can be described as follows:
Input: N data points fxigNx=1Output: cluster A1, A2,⋯, Ak, where Ai = fj ∣ rj ∈ cig
(3) Markov random walk algorithm
Step 1. The algorithm constructs the similarity matrix W ∈RN×N , the diagonal matrix D, and the Laplacian matrix L =D−1/2WD−1/2 through the formula wij = exp ð−d2ðxi, xjÞ/2δ2Þ, i ≠ j.
Step 2. The algorithm calculates the first k eigenvectors of theLaplacian matrix v1, v2,⋯, vk.
Step 3. The algorithm uses the eigenvector v1, v2,⋯, vk cal-culated in the second step to construct a matrix Q ∈ RN×K .
Step 4. The algorithm forms a normalized matrix M by nor-malizing the rows to norm 1, where mij = xij/
ffiffiffiffiffiffiffiffiffiffiffiffiffi∑kxik2
p.
Step 5. The algorithm makes ri ∈ RK a vector correspondingto the i-th row of the normalized matrix M.
Step 6. The algorithm uses typical clustering algorithms suchas the k-means algorithm to cluster the abovementionedmatrix into k classes. By repeatedly executing the NJW algo-rithm, the scale parameter δ, which measures the similaritybetween sample points, can be obtained, but this increasesthe time used by the algorithm.
Another point of view in spectral clustering is the Mar-kov random walk algorithm. It uses a probability model toobtain the spectrum method, and the random walk on thespectrum is considered to be a random jump from one nodeto another node. Spectral clustering can be understood aslooking for such a graph partitioning; that is, the randomwalk stays in the same class for a long time and rarely staysin another class. From this point of view, random walk andgraph partitioning have the same idea.
The random transition matrix P =D−1W can beobtained from the normalized similarity matrix W, so thesum of each row of the matrix is 1. Among them, Pij isthe probability from point vi to point vj. The Markov ran-dom walk algorithm is basically the same as the NJW algo-rithm. The Markov random walk algorithm has achievedgood results and can automatically determine the cluster-ing value.
In addition to the above SC algorithm, there are manyother SC algorithms. Perona and Freeman proposed the PFalgorithm. Scott et al. proposed the SLH algorithm, andWISS combined the SLH algorithm and the SM algorithmto propose a new algorithm. Ding et al. proposed a new divi-sion criterion Mcut. In addition, Meila et al. proposed a newspectral clustering algorithm called the MS algorithm underthe framework of the Markov random walk.
(1) The Choice of the Laplacian Matrix. In the spectral clus-tering algorithm, it is very important to construct the simi-larity graph matrix. After the number of data samples isgiven, the most commonly used formula for constructingsimilarity graphs and selecting the Laplacian matrix is as
Table 1: Statistical table of the evaluation of the mining effect ofteaching resources.
No.Resourcemining
No.Resourcemining
No.Resourcemining
1 92.9 21 91.4 41 84.1
2 77.4 22 90.6 42 77.7
3 82.6 23 81.0 43 91.2
4 89.6 24 84.1 44 79.3
5 83.8 25 78.4 45 92.1
6 91.6 26 90.1 46 91.4
7 82.1 27 81.3 47 87.8
8 83.7 28 83.3 48 79.0
9 90.5 29 92.6 49 78.3
10 92.6 30 83.8 50 92.0
11 90.2 31 84.0 51 84.1
12 88.3 32 92.8 52 90.5
13 91.5 33 81.1 53 92.4
14 89.5 34 90.2 54 78.5
15 86.7 35 92.1 55 77.1
16 92.7 36 80.0 56 81.3
17 80.1 37 85.8 57 88.1
18 92.6 38 82.1 58 88.9
19 90.0 39 85.2 59 81.6
20 87.2 40 82.9 60 91.6
9Wireless Communications and Mobile Computing
follows:
wij = exp− xi − xj�� ��2δ2
!: ð16Þ
In this paper, some commonly used Laplacian constructmethods have been collected, but how to select the Laplacianmatrix is uncertain.
(2) Selection of Parameters. The spectrum clustering isuncertain when constructing similar matrices, and the deter-mination of 8 is often necessary to obtain the uncertainty ofclustering results according to the experience of theresearcher and multiple attempts. So the choice of parame-ters is an important research direction.
(3) Determination of the Number of Clusters. The choice ofclustering directly affects the cluster results. Now, the cur-rent spectrum clustering research does not give a strategyfor the number of choices of clusters, which is also a moreimportant research direction in cluster research.
(4) Differential Problems with Uneven Distribution of DensityDistribution. The existing spectrum clustering method is stillunable to obtain a good clustering effect for the densitydistribution.
4. Computer-Aided Teaching System Based onData Mining
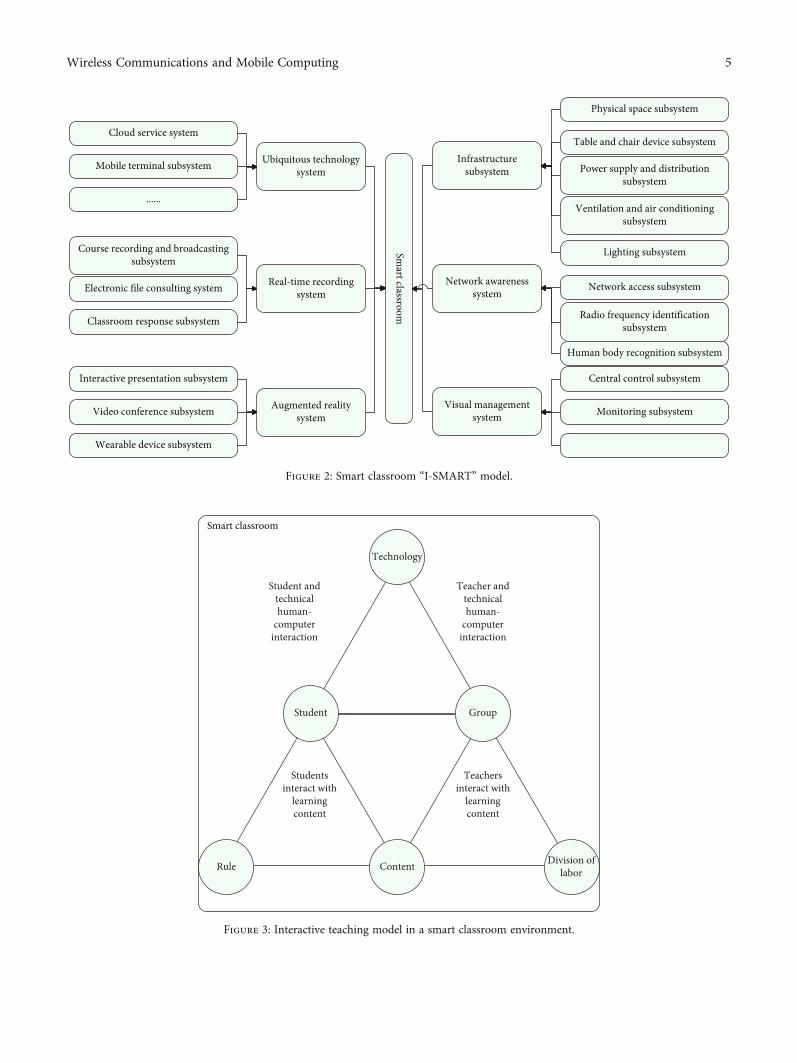
After the SMART conceptual model was put forward, thispaper designs the “I-SMART” model from the aspect ofhardware and software configuration, which provides frame-work support for the construction of smart classrooms(Figure 2).
Under the guidance of the activity theory, based on theabove analysis of teaching elements and types of teachinginteraction, an interactive teaching model in a smart class-room environment is proposed (Figure 3).
There are nine modules in the teaching platform: home-page, statistics, classroom activities, homework, examination,discussion, information, notification, and management. Userscan directly access teaching data. The various types of datathat can be read by the teacher after being automatically col-lected by the platform and analyzed by the model are summa-rized in Figure 4.
Through the correlation analysis of multiple factors in theS-P table, it can provide a clear direction for teaching decision-making. S-line tomography is used to analyze the types ofstudents. Using the Yio-CSi (Student Positive Answer Rate-Student Attention Coefficient) model (Figure 5), we can findthe students with the best and stable grades, the students withthe worst and stable grades, and the students with unstable
0
10
20
30
40
50
60
70
80
90
100
1 4 7 10 13 16 19 22 25 28 31 34 37 40 43 46 49 52 55 58Re
sour
ce m
inin
g
Number
Figure 10: Statistical diagram of the evaluation of the mining effect of teaching resources.
Table 2: Statistical table of the evaluation of the teaching effect.
No. Teaching effect No. Teaching effect No. Teaching effect
1 80.4 21 92.4 41 76.3
2 80.6 22 72.9 42 90.9
3 87.3 23 94.8 43 82.2
4 76.3 24 89.1 44 91.6
5 87.7 25 76.9 45 77.3
6 74.8 26 90.8 46 75.2
7 83.3 27 79.2 47 85.0
8 73.5 28 78.6 48 86.5
9 84.3 29 91.7 49 87.4
10 90.2 30 81.2 50 93.7
11 87.9 31 85.0 51 83.8
12 78.2 32 93.1 52 80.0
13 88.5 33 74.8 53 89.9
14 72.5 34 89.3 54 93.7
15 79.6 35 90.8 55 90.1
16 86.8 36 88.1 56 90.3
17 73.9 37 82.8 57 93.4
18 93.1 38 83.4 58 94.6
19 80.6 39 95.0 59 86.5
20 85.2 40 80.0 60 80.9
10 Wireless Communications and Mobile Computing
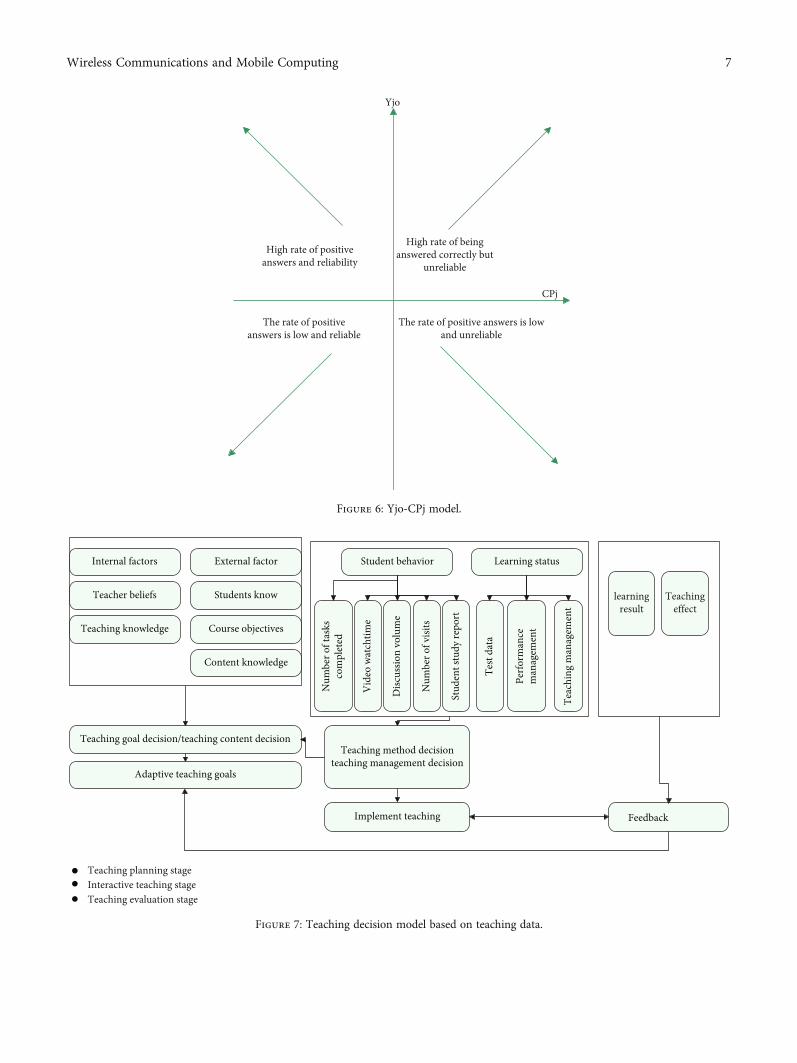
grades that cannot be found in the general statistical descrip-tion. Using the Yjo-CPj (Question Positive Answer Rate-Question Attention Coefficient) model (Figure 6), it is possi-ble to find knowledge points that students understand andare reliable, knowledge points that students seem to under-stand but are unreliable, knowledge points that are notunderstood by students, and knowledge points that are notunderstood but have accidental factors. Based on this, wemake scientific decisions on the selection and application ofteaching media.
This research is based on the smart teaching platformenvironment and attaches importance to the value of thedata captured by the platform in the process of monitoringstudent behavior and status. Therefore, it is considered toincorporate the data that can be used for decision-makinginto the decision model to form a teaching decision modelbased on the data of the smart teaching platform, as shownin Figure 7.
The users of the education platform are not only stu-dents but also teachers, so we have to think deeply aboutteachers’ needs for online education platforms. We can fur-ther analyze the teacher’s demand for the ergonomic exper-imental teaching platform in two aspects. Among them, oneis the demand between the platform and the teacher, and theother is the demand between the teacher and the student, asshown in Figure 8.
The strategic layer of the platform is shown in Figure 9.User goals refer to what kind of needs the users hope to meetthrough the product. The main users of the platform are stu-dents. For students, the most important goal of this platformis to help students improve their learning effects. On the onehand, it shows that students can learn and apply knowledgefaster through this platform, and on the other hand, it showsthat students can quickly learn how to use this platform, thatis, the ease of learning of the platform.
5. Performance Test of the Computer-AidedTeaching System Based on Data Mining
The above constructs a computer-aided teaching systembased on data mining. After constructing the system, the
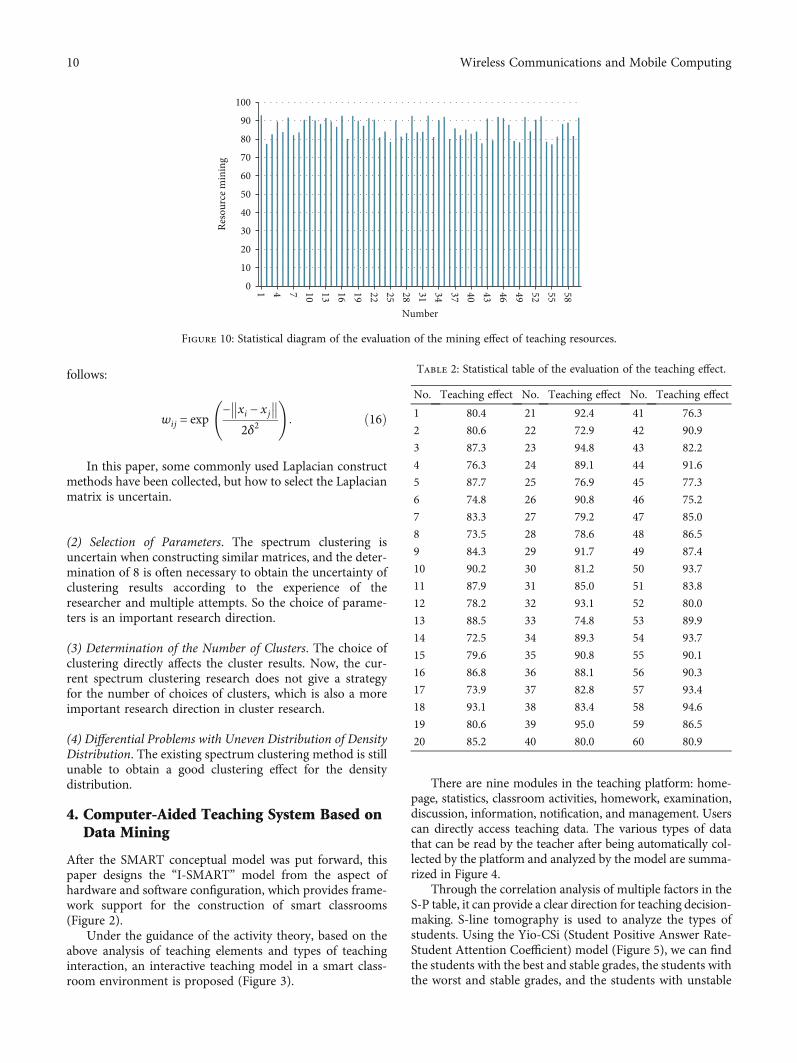
performance of the system is verified, and the system opera-tion performance and system teaching effect are mainlystudied. The research on its operating performance is mainlythe effect of teaching resource mining. This paper obtainseffective resources from the massive network teachingresources through the simulation system, tests multiple setsof statistical data, and evaluates the collected data throughexpert evaluation methods. The results are shown inTable 1 and Figure 10.
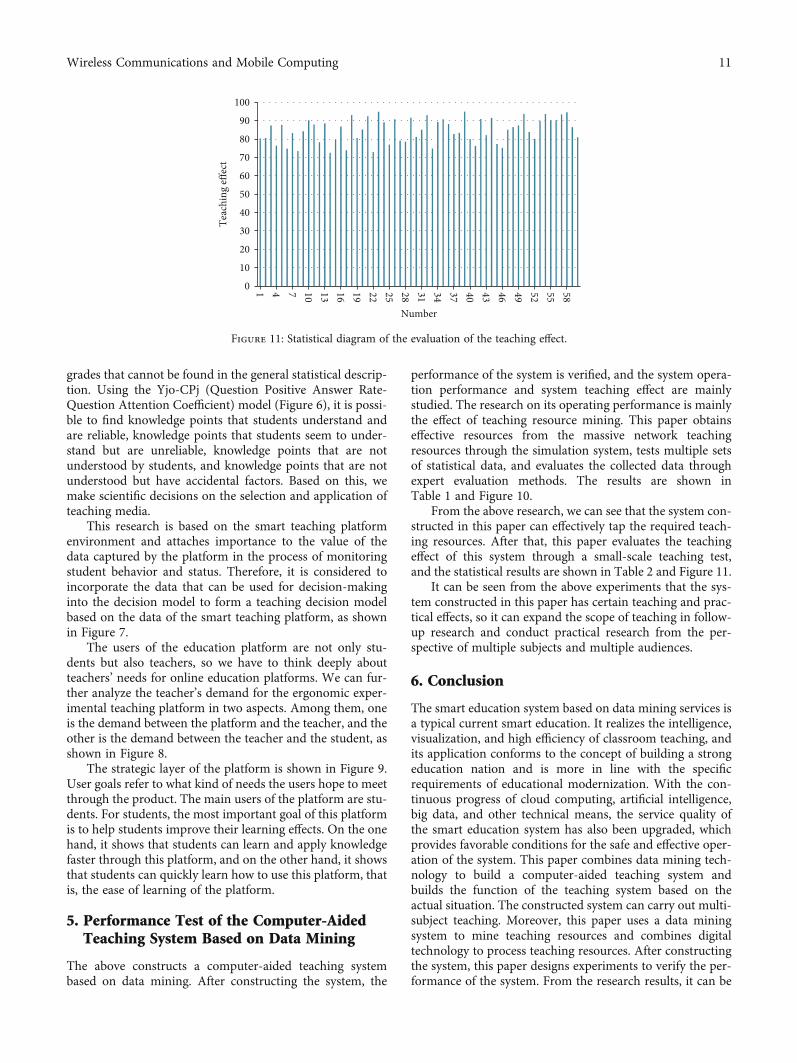
From the above research, we can see that the system con-structed in this paper can effectively tap the required teach-ing resources. After that, this paper evaluates the teachingeffect of this system through a small-scale teaching test,and the statistical results are shown in Table 2 and Figure 11.
It can be seen from the above experiments that the sys-tem constructed in this paper has certain teaching and prac-tical effects, so it can expand the scope of teaching in follow-up research and conduct practical research from the per-spective of multiple subjects and multiple audiences.
6. Conclusion
The smart education system based on data mining services isa typical current smart education. It realizes the intelligence,visualization, and high efficiency of classroom teaching, andits application conforms to the concept of building a strongeducation nation and is more in line with the specificrequirements of educational modernization. With the con-tinuous progress of cloud computing, artificial intelligence,big data, and other technical means, the service quality ofthe smart education system has also been upgraded, whichprovides favorable conditions for the safe and effective oper-ation of the system. This paper combines data mining tech-nology to build a computer-aided teaching system andbuilds the function of the teaching system based on theactual situation. The constructed system can carry out multi-subject teaching. Moreover, this paper uses a data miningsystem to mine teaching resources and combines digitaltechnology to process teaching resources. After constructingthe system, this paper designs experiments to verify the per-formance of the system. From the research results, it can be
0
10
20
30
40
50
60
70
80
90
100
1 4 7 10 13 16 19 22 25 28 31 34 37 40 43 46 49 52 55 58Te
achi
ng ef
fect
Number
Figure 11: Statistical diagram of the evaluation of the teaching effect.
11Wireless Communications and Mobile Computing
seen that the system constructed in this paper has certainteaching and practical effects.
Data Availability
The labeled datasets used to support the findings of thisstudy are available from the corresponding author uponrequest.
Conflicts of Interest
The authors declare no competing interests.
Acknowledgments
This study is sponsored by the following: (1) Researchand Practice of Mixed Teaching Mode of Criminal Tech-nology Courses Based on OBE Concept—take SpeechRecognition and Appraisal Course as an example (No. 5-31017501)—and (2) application research of IPv6-based videotransmission and control technology in teaching plat-form—Scientific research project (No. NGII20180124).
References
[1] R. Nunes Linhares, C. Mário Guimarães Alcântara, E. ÁvilaGonçalves, F. Ramos, and M. José Loureiro, “Teaching evalua-tion by teachers from Brazil and Portugal: a comparative anal-ysis,” American Journal of Educational Research, vol. 5, no. 5,pp. 546–551, 2017.
[2] N. Huang, “Analysis and design of university teaching evalua-tion system based on JSP platform,” International Journal ofEducation & Management Engineering, vol. 7, no. 3, pp. 43–50, 2017.
[3] J. A. Moreno-Murcia, Y. Silveira Torregrosa, and N. BelandoPedreño, “Questionnaire evaluating teaching competencies inthe university environment. Evaluation of teaching competen-cies in the university,”Naer Journal of New Approaches in Edu-cational Research, vol. 4, no. 1, pp. 54–61, 2015.
[4] S. Liu and P. Chen, “Research on fuzzy comprehensive evalu-ation in practice teaching assessment of computer majors,”International Journal of Modern Education & Computer Sci-ence, vol. 7, no. 11, pp. 12–19, 2015.
[5] L. Zhou, H. Li, and K. Sun, “Teaching performance evaluationby means of a hierarchical multifactorial evaluation modelbased on type-2 fuzzy sets,” Applied Intelligence, vol. 46,no. 1, pp. 34–44, 2017.
[6] J. Porozovs, L. Liepniece, and D. Voita, “Evaluation of theteaching methods used in secondary school biology lessons,”Journal of Pedagogy and Psychology “Signum Temporis”,vol. 7, no. 1, pp. 60–66, 2015.
[7] M. A. Oliveros, A. García, and B. Valdez, “Evaluation of ateaching sequence regarding science, technology and societyvalues in higher education,” Creative Education, vol. 6,no. 16, pp. 1768–1775, 2015.
[8] M. S. Cerón and F. M. del Sagrario Corte Cruz, “The evalua-tion of teaching: some consequences for Latin America,”Revista Mexicana De Investigacion Educativa, vol. 20, no. 67,pp. 1233–1253, 2015.
[9] L. Liu, J. Feng, Q. Pei et al., “Blockchain-enabled secure datasharing scheme in mobile-edge computing: an asynchronous
advantage actor–critic learning approach,” IEEE Internet ofThings Journal, vol. 8, no. 4, pp. 2342–2353, 2021.
[10] K. Angell, E. Tewell, and Long Island University, Brooklyn,“Teaching and un-teaching source evaluation: questioningauthority in information literacy instruction,” Communica-tions in Information Literacy, vol. 11, no. 1, pp. 95–121, 2017.
[11] M. Brkovic and P. Chiles, “‘Spector - the sustainability inspec-tor’: participatory teaching, learning and evaluation game forarchitects, architecture students and pupils,” Facta Universita-tis, vol. 14, no. 1, pp. 1–20, 2016.
[12] T. H. Reisenwitz, “Student evaluation of teaching: an investiga-tion of nonresponse bias in an online context,” Journal of Mar-keting Education, vol. 38, no. 4, pp. 139–144, 2015.
[13] Y. Jiang and Y.Wang, “Evaluation of teaching quality of publicphysical education in colleges based on the fuzzy evaluationtheory,” Journal of Computational and Theoretical Nanoence,vol. 13, no. 12, pp. 9848–9851, 2016.
[14] W. Shang, J. Chen, H. Bi, Y. C. Sui, Y. Chen, and H. Yu,“Impacts of COVID-19 pandemic on user behaviors and envi-ronmental benefits of bike sharing: a big-data analysis,”Applied Energy, vol. 285, article 116429, 2021.
[15] F. Garofalo, P. Mota-Moya, A. Munday, and S. Romy, “Totalextraperitoneal hernia repair: residency teaching programand outcome evaluation,” World Journal of Surgery, vol. 41,no. 1, pp. 100–105, 2017.
[16] G. Gong and S. Liu, “Consideration of evaluation of teaching atcolleges,” Open Journal of Social Sciences, vol. 4, no. 7, pp. 82–84, 2016.
[17] H. Zhao, “College physics teaching model design and evalua-tion research of students’ seriousness,” Open Cybernetics &Systemics Journal, vol. 9, no. 1, pp. 2017–2020, 2015.
[18] N. D. Tran, “Reconceptualisation of approaches to teachingevaluation in higher education, issues in educational research,”Issues in Educational Research, vol. 25, no. 1, pp. 50–61, 2015.
[19] P. Wu, S. P. Low, J. Y. Liu, J. Pienaar, and B. Xia, “Critical suc-cess factors in distance learning construction programs atCentral Queensland University: students’ perspective,” Journalof Professional Issues in Engineering Education and Practice,vol. 141, no. 1, article 05014003, 2015.
[20] E. A. Willis, A. N. Szabo-Reed, L. T. Ptomey et al., “Distancelearning strategies for weight management utilizing socialmedia: a comparison of phone conference call versus socialmedia platform. Rationale and design for a randomizedstudy,” Contemporary Clinical Trials, vol. 47, no. 6, pp. 282–288, 2016.
[21] H. J. Ye, D. C. Zhan, and Y. Jiang, “Fast generalization rates fordistance metric learning,” Machine Learning, vol. 108, no. 2,pp. 267–295, 2019.
[22] Y. Luo, Y. Wen, T. Liu, and D. Tao, “Transferring knowledgefragments for learning distance metric from a heterogeneousdomain,” IEEE Transactions on Pattern Analysis and MachineIntelligence, vol. 41, no. 4, pp. 1013–1026, 2019.
12 Wireless Communications and Mobile Computing