computer‐aided molecular pathology interpretation in ... article computer-aided molecular...
TRANSCRIPT
ORIGINAL ARTICLE
Computer-aided molecular pathology interpretation in exploring prospective markersfor oral submucous fibrosis progression
Anji Anura, MTech,1* Sailesh Conjeti, MTech,1,2 Raunak Kumar Das, PhD,1,3 Mousumi Pal, MDS,4 Ranjan Rashmi Paul, PhD,4 Swarnendu Bag, MTech,1
Ajoy Kumar Ray, PhD,5 Jyotirmoy Chatterjee, PhD1
1School of Medical Science and Technology, Indian Institute of Technology Kharagpur, Kharagpur, West Bengal, India, 2Chair for Computer Aided Medical Procedures andAugmented Reality, Fakul€at f€ur Informatik, Technische Universit€at M€unchen, Garching bei M€unchen, Germany, 3School of BioSciences and Technology & Centre for BiomaterialsScience and Technology, Vellore Institute of Technology, VIT University, Vellore, Tamil Nadu, India, 4Guru Nanak Institute of Dental Science and Research, Panihati, Kolkata, WestBengal, India, 5Electronics & Electrical Communication Engineering, Indian Institute of Technology Kharagpur, Kharagpur, West Bengal, India.
Accepted 16 December 2014
Published online 29 June 2015 in Wiley Online Library (wileyonlinelibrary.com). DOI 10.1002/hed.23962
ABSTRACT: Background. Evaluation of molecular pathology markersusing a computer-aided quantitative assessment framework would helpto assess the altered states of cellular proliferation, hypoxia, and neoan-giogenesis in oral submucous fibrosis and could improve diagnosticinterpretation in gauging its malignant potentiality.Methods. Immunohistochemical (IHC) expression of c-Myc, hypoxia-inducible factor-1-alpha (HIF-1a), vascular endothelial growth factor(VEGF), VEGFRII, and CD105 were evaluated in 58 biopsies of oral sub-mucous fibrosis using computer-aided quantification. After digital stainseparation of original chromogenic IHC images, quantification of the dia-minobenzidine (DAB) reaction pattern was performed based on intensityand extent of cytoplasmic, nuclear, and stromal expression.
Results. Assessment of molecular expression proposed that c-Myc andHIF-1a may be used as strong screening markers, VEGF for risk-stratification and VEGFRII and CD105 for prognosis of precancer into oralcancer.Conclusion. Our analysis indicated that the proposed method can help inestablishing IHC as an effective quantitative immunoassay for molecularpathology and alleviate diagnostic ambiguities in the clinical decisionprocess. VC 2015 Wiley Periodicals, Inc. Head Neck 38: 653–669, 2016
KEY WORDS: oral submucous fibrosis, molecular pathology, com-puter-aided quantitative immunohistochemistry, neoangiogenesis,hypoxia
INTRODUCTIONOral submucous fibrosis (OSF), a premalignant condition,manifests marked rigidity of oral mucosa with differentdegrees of inability to open the mouth (trismus). Histopa-thologically, progressive fibrosis in lamina propria alongwith features of avascularity, atrophic epithelium with/without dysplasia, and inflammation are noted in this oralpremalignancy.1 This pathosis is known for its etiologicalassociation with deleterious oral habits (viz. chewing ofareca nut, tobacco, and betel quid).2 It has a malignanttransformation rate of 7% to 13% into oral squamous cellcarcinoma (OSCC).2,3 In this regard, reports on the impactof prolonged exposures to arecoline, a secondary metabo-lite of areca nut, in altering collagen levels with resultantfibrosis of the oral subepithelial connective tissue2,4 arenoteworthy. However, early high precision diagnosis ofmalignant transformation potential of such precancer is yet
to be established in reducing mortality from OSCC.5 Inthis perspective evaluation, molecular pathology markersusing a computer-aided quantitative assessment frameworkcould play a significant role.6 Different degrees of epithe-lial dysplasia (noted in 7% to 12% of OSF), being a pre-dominantly decisive pathobiological happening7 inmalignant transformation of this oral premalignancy,7 maybecome more predictive in cancer risk assessment, if asso-ciated prime molecular expression are analyzed with higherprecision at the immunohistochemical (IHC) levels.6
Mucosal microenvironment accompanying fibrosis oftenresults in the development of a hypoxic condition,8,9 whichactivate and stabilize effects of hypoxia inducible factor(HIF), a key regulator of cellular response to hypoxia.10,11
Stabilization of the molecule in cancer has been reported toincrease tumor aggressiveness via promoting angiogenesisand metastatic potential.11,12 Hence, the report on upregula-tion of HIF-1a (inducible subunit of HIF with oxygen-dependent domain) in oral cancer13 and precancers couldbe contributory in assessing malignant transformationpotentiality of OSF. Furthermore, as vascular endothelialgrowth factor (VEGF; the central regulator of neoangiogen-esis, which is known to be induced by hypoxic condi-tions)14 in combination with its endothelial receptorVEGFRII play a pivotal role in the transition of hyperproli-ferative state of precancer to cancer,15–17 its high precision
*Corresponding author: A. Anura, School of Medical Science & Technology,Indian Institute of Technology, Kharagpur, West Bengal, India 721302.E-mail:[email protected]
Contract grant sponsor: School of Medical Science & Technology, IndianInstitute of Technology Kharagpur, West Bengal, India. Anji Anura acknowl-edges the Council of Scientific and Industrial Research (CSIR) for the award ofan individual senior research fellowship.
HEAD & NECK—DOI 10.1002/HED MAY 2016 653
expression analysis may help to predict precancer prognosisto cancer. Expression analysis of CD105 (endoglin), ahypoxia-induced tumor vasculature-specific angiogenic fac-tor,18,19 could be another important adjunct to understandthe malignant potentiality of OSF. In addition, analysis ofc-Myc, a known proto-oncogene with a crucial role as thetranscription factor in regulating cell growth and prolifera-tion,20 becomes highly relevant when studied in the contextof epithelial dysplasia21 and in combination with otherprometastatic attributes in assessing malignant potentialityof oral precancer into OSCC.22
In the context of automated assessment of progressionof OSF, the state-of-the-art majorly includes profiling ofconventional histology sections. The morphometry andtextural features of the basal membrane has been eval-uated to distinguish OSF from normal oral mucosa.23,24
Other works in this context include potential structuralmarkers, like thickness of the basement membrane,25 andtextural aspects of the whole epithelial layer26 for struc-tural profiling for assessment of dysplasia in OSF.Divulging from the epithelial aspects of premalignancy,the pathological changes with respect to shape morphom-etry of the subepithelial connective tissue cells has beeninvestigated.27 Although the quantitative image analysisof conventional histology section is a step toward accu-rate interpretation of disease diagnosis, it fails to provideinformation on molecular pathology.
The critical analysis of the protein level expressions of tar-get genes may be effective in bringing specificity in molecu-lar pathology. In examining such expressions, IHC practicesare well accepted having great value for differential diagno-sis and in assessing interventional and therapeutic inferencesassociated with cancer.28 However, qualitative analysis forlocalization and intensity of molecular expressions isaffected by methodological inconsistencies in the protocolfollowed for IHC. These are due to reaction bias (in speci-men fixation, tissue processing, and antigen retrieval anddetection systems) and interpretation bias (in selection ofantibody panels, sensitivity of the chosen panel, choice ofantibody types and clones, results, and literature interpreta-tion).28,29 Such biases affect the IHC potentiality as a quanti-tative assay technique.6,29 The generalized method ofquantifying the expressed protein in immunostained tissue issemiquantification techniques in which intensity is the focusof analysis.6 Based on the intensity of expression, the tissuesare categorized into null (-ve), low (11), moderate (21), andintense expressed (31) antigen conditions, which are knownas intensity scores.6,29 Nevertheless, these scoring techniquesprovide options to adopt computer-aided image analysis forIHC images as a solution for increased sensitivity andthroughput.30 Numerous open source image analysis soft-ware are available for quantitative IHC.31,32 In this work, wehave envisaged a quantitative microscopic image analysisframework that may present a highly reproducible, consist-ent, and unbiased platform for assessment of IHC images ofstudied target genes (viz. HIF-1a, VEGF, VEGFRII, CD105,and cMyc) by quantification of molecular information fromspatial and intensity dimensions to provide biologically rele-vant quantitative feature signatures in different states of theOSF.
The role of evaluating IHC markers for oncologic assess-ment using computer-aided techniques was discussed by
Choudhury et al33 who proposed the average thresholdingmethod for deciding an adaptive limit on expression posi-tivity for 2 immunogens, HIF-1a and VEGF. This measurewas derived incorporating both proportion of expressionand intensity of staining as component parameters. Thisscore is interpreted as the average expression of the immu-nogen per unit area. The evaluation of antibody intensitycytoplasmic and nuclear expressions by stain deconvolutionand assessing the average optical density of the immunogenstain was proposed by Varghese et al34 as a part of the IHC-Profiler software plug-in. However, in addition to intensityof expression, as discussed in these seminal works, theextent and the location of the expression of positivity areobserved to be important for differential assessment, asreported in Das et al35 and Bag et al.36 In the presentedwork, the value addition to investigating level of expressionpositivity, we also propose quantitative measures for 3 dif-ferent expression types (nuclear, cytoplasmic, and vascular)and assess the location of expression with respect to thebasement membrane. This work builds on the premiseestablished by Choudhury et al33 for the need for objective,observer-independent, and easier IHC assessment usingautomated image analysis and goes beyond to extend suchtechniques for further immunogens, like HIF-1a, CD105,VEGFRII, VEGF, etc. in a specific context of OSF progres-sion. Digital image analysis of immunostained tissue sec-tions involves extraction of a bias-free image channel mostcorrelated with the immunogen expression for evaluatingmean intensity of expression and fraction of tissue positiv-ity.37 Vrekoussis et al38 investigated use of channel-specifichistogram features of red, green, and blue (RGB)-colorchannels for evaluating staining reactivity and established itas a low-cost and efficient approach with low variability inassessment. This motivates the use of histogram-derivedintensity percentile features used for staining intensityassessment in this work. We also use automated-staindeconvolution techniques to evaluate immunogen reactivityand use diaminobenzidine (DAB)-specific brown channelfor assessment.
In the proposed image analysis framework, the imageprocessing algorithm considered stain separation of origi-nal chromogenic IHC images. In quantification of immu-noreaction products, the brown color diaminobenzidinewas separated from the hematoxylin counter-stain. Afterstain separation, biologically representative features char-acterizing distribution and intensity of molecular expres-sion were extracted from expression sites (viz. nuclear,cytoplasmic, or vascular) in this analysis. Further, statisti-cal evaluation of the extracted features resulted in charac-teristic feature trend signatures and feature subsets, whichbest represented each stage of the OSF. Finally, statisticalanalysis was performed for assessing the efficacy of theindicative molecules as potential molecular markers.
MATERIALS AND METHODS
Tissue collection
In the present study, 68 incision biopsies from buccalmucosa comprised of 58 study samples of OSF (con-firmed by expert oral oncopathologists after hematoxylin-eosin staining) and 10 samples of normal oral mucosawere collected from the distobuccal aspect of the third
ANURA ET AL.
654 HEAD & NECK—DOI 10.1002/HED MAY 2016
molar teeth. The excess amount of mucoperiosteal buccalflaps that has been left after transalveolar surgeries havebeen excised and used as normal. The samples were col-lected from Guru Nanak Institute of Dental Sciences andResearch (GNIDSR), Kolkata, India, with informed con-sent from patients and under the ethical clearance ofGNIDSR (ethical clearance number GNIDSR/IEC/07/16dated November 20, 2007) during a period of 2008 to2013. The procedures were performed in full accordancewith ethical principles and guidelines of Indian MedicalAssociation, including the World Medical Association, asper Helsinki declaration.
The considered case-subjects (average age of 34 yearsand grouped into 43 men [73.24%] and 25 women[36.76%]) manifested typical clinicopathological symp-toms of OSF and were associated with detrimental oralhabits, like smoking tobacco, chewing betel quid, arecanut, etc. Samples that were graded as OSF with dysplasiaconfirmed to at least 1 of the following features, such aspolymorphism, dyskeratosis, mitosis in suprabasal layer,or atypical mitosis. Samples exhibiting comorbidity alongwith OSF were excluded.
Tissue processing
The biopsy specimens were fixed in phosphate-bufferedformalin and embedded in paraffin. Six consecutive tissuesections with 4-mm thickness were mounted on poly-L-lysine (Cat. No. P8920; Sigma Aldrich, St Louis, MO)coated glass slides. The sections were baked, dewaxed,and rehydrated using graded alcohol for IHC studies. Thelist of primary antibodies used with immune reactivityspecification has been described in Table 1. Immunode-tection was performed with horseradish peroxidase conju-gated secondary antibody with chromogen 3, 30-DAB andcounterstained with Harris’ hematoxylin (Cat. No.AG2AF62372; Merck, Mumbai, India) using Super Sensi-tive Polymer-horseradish peroxidase IHC Detection Sys-tem kit (Cat. No. QD400-60K; BioGenex, Fremont, CA).
Image digitization and pathological grading
The immunostained tissue sections were visualizedusing a bright field inverted optical microscope (ZeissObserver.Z1; Carl Zeiss, Oberkochen, Germany) under203 plan-apochromatic objective (numerical aperture -0.8; pixel granularity: 0.31 mm, with final magnification3200) and the images were grabbed digitally by CCDcamera (AxioCam MRC; Carl Zeiss) at 1388 3 1040 pix-els. The images were shading corrected and white-balanced using the supporting software platform AxioVi-sion 4.7.2 (Carl Zeiss). In order to completely visualizethe epithelial thickness with requisite subepithelial area,adjoining fields of views with at least 30% overlap weregrabbed and stitched to form a larger panorama (main-taining image aspect ratio and dimensions) using Autos-titch Software Package available at http://cs.bath.ac.uk/brown/autostitch/autostitch.html.39
With the help of oral oncopathologists, the field of viewwas subdivided into biologically consonant regions of inter-est (ROI), which were then pooled into 3 mutually exclu-sive study groups: normal oral mucosa, oral submucousfibrosis without dysplasia (OSFWT), and oral submucousTA
BLE
1.De
taile
din
form
atio
non
prim
ary
antib
odie
san
dpr
oced
ure
used
fori
mm
unoh
isto
chem
istr
y.
Patie
nt#
Mol
ecul
eSo
urce
sCl
one
Antib
ody
spec
ifici
tyAn
tigen
retri
eval
Antib
ody
dilu
tion
Antib
ody
incu
batio
npe
riod
Expr
essi
onsi
te
1c-
Myc
Abca
mCa
mbr
idge
,En
glan
d(A
b320
72)
Y69
Rabb
itm
onoc
lona
l5
min
at65� C
;2cy
cle5
min
at98� C
;2cy
cle
1in
200
Over
nigh
tat4� C
Nucl
eus
2HI
F-1a
Abca
mCa
mbr
idge
,En
glan
d(A
b516
08)
EP12
15Y
Rabb
itm
onoc
lona
l5
min
at65� C
;2cy
cle5
min
at98� C
;2cy
cle
1in
200
Over
nigh
tat4� C
Cyto
plas
man
dnu
cleu
s3
VEGF
Biog
enex
Calif
orni
a(A
R483
-5R)
--Ra
bbit
poly
clon
al5
min
at65� C
;2cy
cle3
min
at98� C
;1cy
cle2
min
at98� C
;1cy
cle
Read
yto
use
Over
nigh
tat4� C
Cyto
plas
man
dEC
M
4VE
GFRI
IAb
cam
Cam
brid
ge,
Engl
and
(Ab7
9992
)--
Rabb
itpo
lycl
onal
5m
inat
65� C
;2cy
cle5
min
at98� C
;2cy
cle
1in
100
Over
nigh
tat4� C
Cell-
mem
bran
eof
endo
thel
ialc
ells
5CD
105
Biog
enex
Calif
orni
a(A
M44
1-5M
)4G
11M
ouse
mon
oclo
nal
5m
inat
65� C
;2cy
cle5
min
at98� C
;2cy
cle
Read
yto
use
Over
nigh
tat4� C
Cell-
mem
bran
eof
endo
thel
ialc
ells
Abbr
evia
tions
:HIF
-1a,
hypo
xia-
indu
cibl
efa
ctor
-1-a
lpha
;VEG
F,va
scul
aren
doth
elia
lgro
wth
fact
or;E
CM,e
xtra
cellu
larm
atrix
.
QUANTITATIVE MOLECULAR PATHOLOGY OF ORAL PRECANCER
HEAD & NECK—DOI 10.1002/HED MAY 2016 655
fibrosis with dysplasia (OSFWD). This demarcation wasmotivated by the observation that OSF was witnessed with/without dysplasia but both the conditions were often found
to co-occur in the same biopsy sample. For ease of selec-tion, a computer-aided freehand selection tool was used bythe experts to select the ROI with the basement membrane
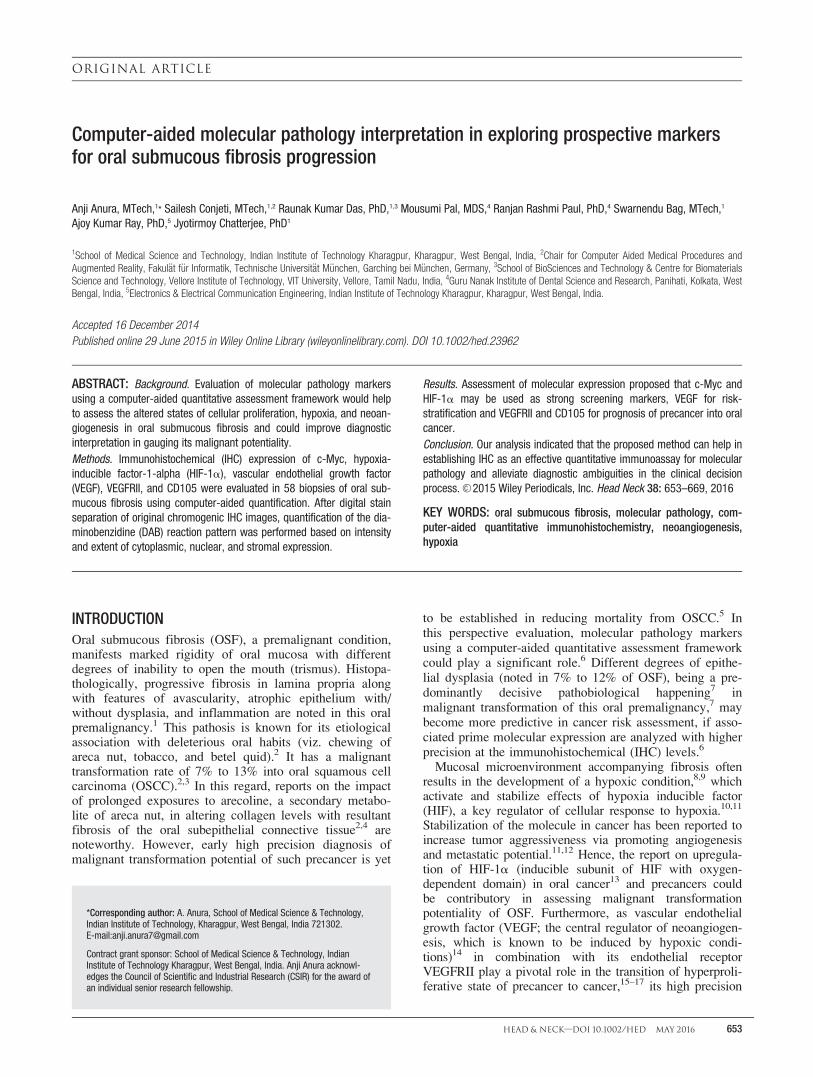
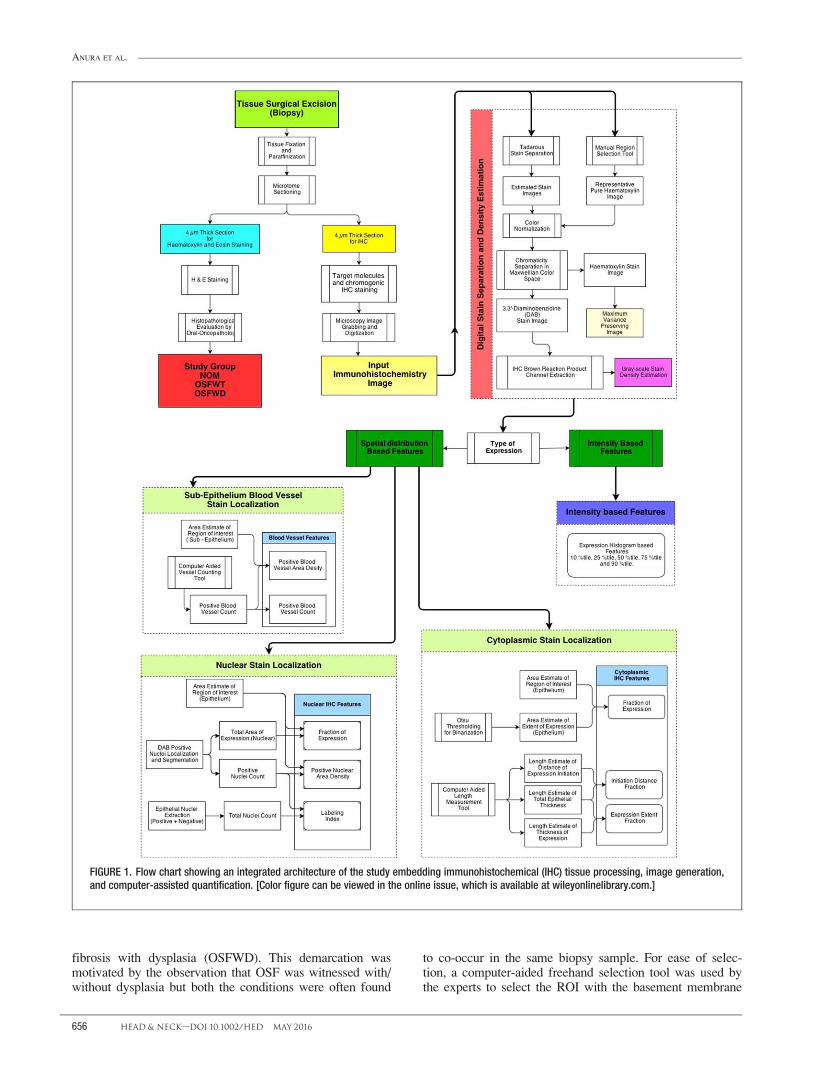
FIGURE 1. Flow chart showing an integrated architecture of the study embedding immunohistochemical (IHC) tissue processing, image generation,and computer-assisted quantification. [Color figure can be viewed in the online issue, which is available at wileyonlinelibrary.com.]
ANURA ET AL.
656 HEAD & NECK—DOI 10.1002/HED MAY 2016
of the epithelium forming the lower boundary and the stra-tum corneum forming the upper boundary.
Computer-aided quantification of immunohistochemicalimages
To acquire precise information on expression intensity andspatial distribution of HIF-1a, c-Myc, VEGF, VEGFRII, andCD105, IHC microphotographs were subjected to computer-assisted microscopic image analysis. The complete frame-work for IHC evaluation and quantification was graphicallyrepresented in Figure 1 and comprised of major subblocks(viz. stain separation and expression density estimation, nucleilocalization and segmentation, and feature extraction), whichare elucidated in the subsequent subsections.
Stain separation and expression density estimation
Diverging from the traditional course of qualitativeintensity/extent grading into a more objective assessmentof chromogenic IHC using digital image analysis requiresstain separation of the images into the components. Theflowchart in Figure 1 illustrates the procedural stepsinvolved in the proposed stain separation algorithm. Thisalgorithm was used to separate the immunostained imageIIHC into the component DAB stain image IDAB (isolatedbrown reaction product) and the counter hematoxylinimage IHtx (Eq. 1). We have used the digital stain separa-tion method proposed by Tadrous40 as this algorithm isfully automated and does not require any prior knowledge
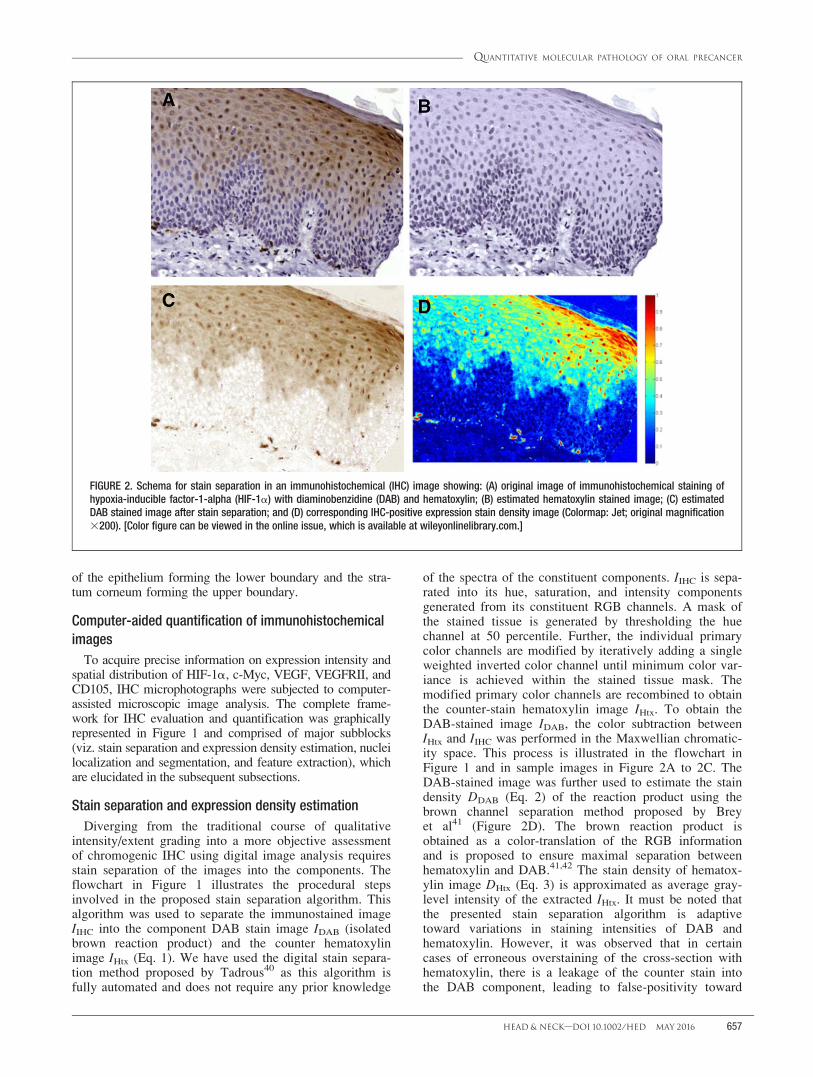
of the spectra of the constituent components. IIHC is sepa-rated into its hue, saturation, and intensity componentsgenerated from its constituent RGB channels. A mask ofthe stained tissue is generated by thresholding the huechannel at 50 percentile. Further, the individual primarycolor channels are modified by iteratively adding a singleweighted inverted color channel until minimum color var-iance is achieved within the stained tissue mask. Themodified primary color channels are recombined to obtainthe counter-stain hematoxylin image IHtx. To obtain theDAB-stained image IDAB, the color subtraction betweenIHtx and IIHC was performed in the Maxwellian chromatic-ity space. This process is illustrated in the flowchart inFigure 1 and in sample images in Figure 2A to 2C. TheDAB-stained image was further used to estimate the staindensity DDAB (Eq. 2) of the reaction product using thebrown channel separation method proposed by Breyet al41 (Figure 2D). The brown reaction product isobtained as a color-translation of the RGB informationand is proposed to ensure maximal separation betweenhematoxylin and DAB.41,42 The stain density of hematox-ylin image DHtx (Eq. 3) is approximated as average gray-level intensity of the extracted IHtx. It must be noted thatthe presented stain separation algorithm is adaptivetoward variations in staining intensities of DAB andhematoxylin. However, it was observed that in certaincases of erroneous overstaining of the cross-section withhematoxylin, there is a leakage of the counter stain intothe DAB component, leading to false-positivity toward
FIGURE 2. Schema for stain separation in an immunohistochemical (IHC) image showing: (A) original image of immunohistochemical staining ofhypoxia-inducible factor-1-alpha (HIF-1a) with diaminobenzidine (DAB) and hematoxylin; (B) estimated hematoxylin stained image; (C) estimatedDAB stained image after stain separation; and (D) corresponding IHC-positive expression stain density image (Colormap: Jet; original magnification3200). [Color figure can be viewed in the online issue, which is available at wileyonlinelibrary.com.]
QUANTITATIVE MOLECULAR PATHOLOGY OF ORAL PRECANCER
HEAD & NECK—DOI 10.1002/HED MAY 2016 657

the immunogen. Here, the IIHC, IHtx, and IDAB images areconstituted of 3 color image channels, namely RGB.
IIHC���������!Stain SeparationIDAB1IHtx: (1)
DDAB5BDAB20:33 RDAB1GDABð Þ; (2)
where IDAB5 RDAB;GDAB;BDABð Þ:
DHtx51
3RHtx1GHtx1BHtxð Þ; (3)
where IHtx5 RHtx;GHtx;BHtxð Þ:
Localization and segmentation of nuclei forimmunohistochemical quantification
In the proposed framework, for analyzing the IHCstains with nuclear expression (viz. c-Myc, HIF-1a),localization, and segmentation of immunostained positiveand negative nuclei in the epithelial ROI was required(Figure 3A). The positive nuclei Nu1ve were localizedusing the IHC reaction product stain density image DDAB
as estimated by stain separation. For segmenting all thenuclei in the ROI (Nuall), the extracted hematoxylin den-sity image DHtx is utilized.
In both DDAB and DHtx images, nuclei were observed asregional maxima with plateau-like intensity profiles (Figure3B). These regional maxima were detected and localizedusing the extended maxima transform.43,44 Nu1ve and Nuall
denote the binary images representing the segmented nucleiin DDAB and DHtx images, respectively. Because of limitedcontrast of the DHtx image, we perform contrast-stretchingusing a nonlinear intensity transformation derived fromKarhunen–Lo�uve Transform45 on the DHtx image (Eq. 4). Itmust be noted that the functionality of the image for effec-tive extraction of Nuall remains unaltered, whereas contrastenhancement. DHtx-enh representing the maximal variance-
preserving image was generated from the estimated coun-terstain hematoxylin image DHtx.
DHtx�����!KL
Transforn
DHtx-enh: (4)
The steps involved in extracting nuclei from a genericdensity image DI using a semiautomated approach forextended maxima transform are as follows. Let (x, y)denote a sample pixel location within the ROI and N(x, y)
denote the 8-connected neighborhood around the pixel(x, y).
1. Initialize minimum intensity threshold dt50th for expres-
sion nuclei as the Otsu gray-level threshold derived from
density image DI.
dt50th �������Otsu
Thresholding
DI: (5)
2. Apply H-Maxima transform on DI with a threshold of dtth
for the tth iteration to generate image HtDI. This sup-
presses all the maxima with depth below or equal to dtth.
This process is achieved by repeated gray-level morpho-
logical reconstruction operation R with mask m (circular
with radius of 1 pixel).
H tDI ������H-Maxima
Transforn
RmDI DI2dt
th
� �: (6)
3. The nuclei are localized as regional maxima on
HtDIimage. Let Nu* denote the binary image represent-
ing the nuclei segmented form density image DI follow-
ing regional maxima transform on HtDI.
Nu� x; yð Þ51; H t
DI x; yð Þ � H tDI x
0; y0� �
where x0; y0� �2 N x;yð Þ
0; Otherwise
((7)
FIGURE 3. Schema of segmentation and localization of c-Myc1 nuclei in selected region of interest in which (A) c-Myc immunohistochemical (IHC)image with selected region of interest, (B) c-Myc1 stain density images (Colormap: Jet); and (C) segmented and localized c-Myc1 nuclei in regionof interest (original magnification 3200). [Color figure can be viewed in the online issue, which is available at wileyonlinelibrary.com.]
ANURA ET AL.
658 HEAD & NECK—DOI 10.1002/HED MAY 2016
4. The nuclei image Nu is generated from Nu* after post-
processing, which involved removal of non-nuclear
components and partially overlap nuclei by area closing
and hole-filling. Overlapping nuclei were segregated
using an intensity-based marker controlled watershed
algorithm.46
5. At this stage, the segmented image is presented in corre-
lation with the IHC image for expert validation on the
performance of segmentation. Postmanual monitoring,
the segmentation thresholds for extended maxima were
altered using the following update rule with dthas the
threshold update weight. The steps 2 to 5 were itera-
tively repeated until visually optimal nuclei segmenta-
tion was achieved.
dt11th 5
dtth1dth;Oversegmentation
dtth2dth;Undersegmentation
((8)
The localization and segmentation of Nu1ve and Nuall isextracted from DDAB and DHtx-enh images respectively.Figure 3 shows a sample c-Myc image with its corre-sponding stain density image and positive nuclei localizedusing the developed localization and segmentationalgorithm.
Feature extraction for immunohistochemical quantitation
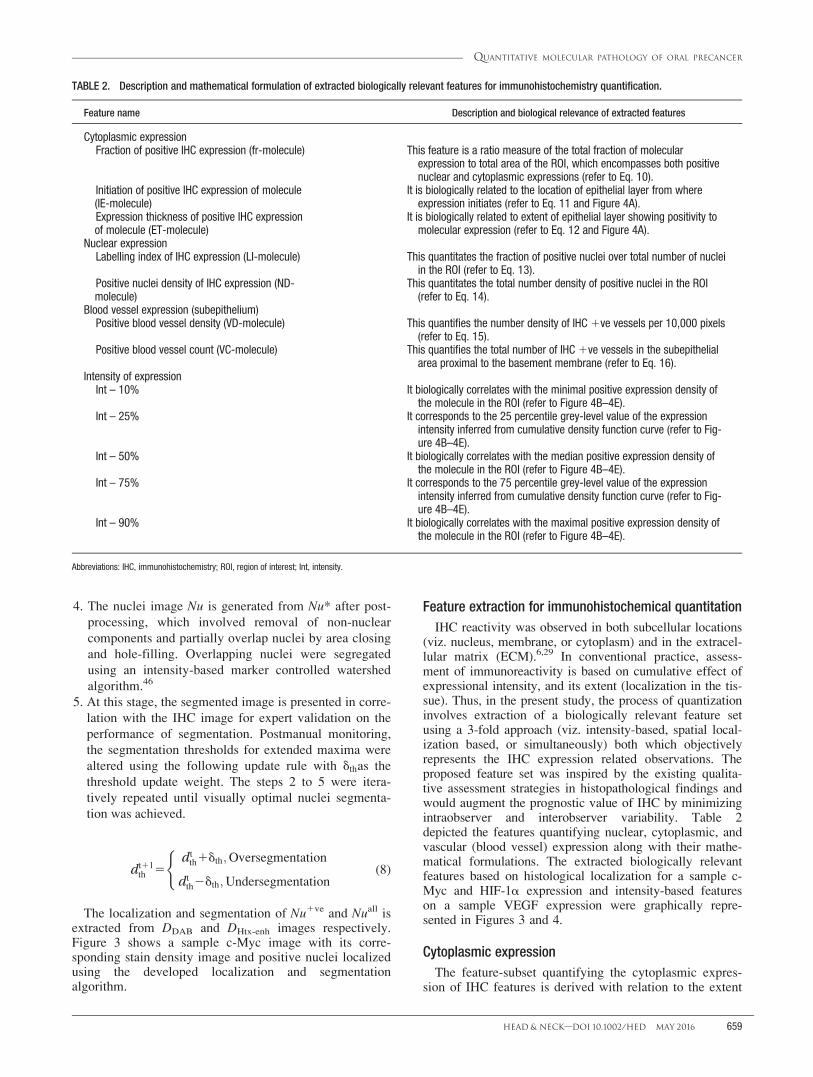
IHC reactivity was observed in both subcellular locations(viz. nucleus, membrane, or cytoplasm) and in the extracel-lular matrix (ECM).6,29 In conventional practice, assess-ment of immunoreactivity is based on cumulative effect ofexpressional intensity, and its extent (localization in the tis-sue). Thus, in the present study, the process of quantizationinvolves extraction of a biologically relevant feature setusing a 3-fold approach (viz. intensity-based, spatial local-ization based, or simultaneously) both which objectivelyrepresents the IHC expression related observations. Theproposed feature set was inspired by the existing qualita-tive assessment strategies in histopathological findings andwould augment the prognostic value of IHC by minimizingintraobserver and interobserver variability. Table 2depicted the features quantifying nuclear, cytoplasmic, andvascular (blood vessel) expression along with their mathe-matical formulations. The extracted biologically relevantfeatures based on histological localization for a sample c-Myc and HIF-1a expression and intensity-based featureson a sample VEGF expression were graphically repre-sented in Figures 3 and 4.
Cytoplasmic expression
The feature-subset quantifying the cytoplasmic expres-sion of IHC features is derived with relation to the extent
TABLE 2. Description and mathematical formulation of extracted biologically relevant features for immunohistochemistry quantification.
Feature name Description and biological relevance of extracted features
Cytoplasmic expressionFraction of positive IHC expression (fr-molecule) This feature is a ratio measure of the total fraction of molecular
expression to total area of the ROI, which encompasses both positivenuclear and cytoplasmic expressions (refer to Eq. 10).
Initiation of positive IHC expression of molecule(IE-molecule)
It is biologically related to the location of epithelial layer from whereexpression initiates (refer to Eq. 11 and Figure 4A).
Expression thickness of positive IHC expressionof molecule (ET-molecule)
It is biologically related to extent of epithelial layer showing positivity tomolecular expression (refer to Eq. 12 and Figure 4A).
Nuclear expressionLabelling index of IHC expression (LI-molecule) This quantitates the fraction of positive nuclei over total number of nuclei
in the ROI (refer to Eq. 13).Positive nuclei density of IHC expression (ND-molecule)
This quantitates the total number density of positive nuclei in the ROI(refer to Eq. 14).
Blood vessel expression (subepithelium)Positive blood vessel density (VD-molecule) This quantifies the number density of IHC 1ve vessels per 10,000 pixels
(refer to Eq. 15).Positive blood vessel count (VC-molecule) This quantifies the total number of IHC 1ve vessels in the subepithelial
area proximal to the basement membrane (refer to Eq. 16).Intensity of expression
Int – 10% It biologically correlates with the minimal positive expression density ofthe molecule in the ROI (refer to Figure 4B–4E).
Int – 25% It corresponds to the 25 percentile grey-level value of the expressionintensity inferred from cumulative density function curve (refer to Fig-ure 4B–4E).
Int – 50% It biologically correlates with the median positive expression density ofthe molecule in the ROI (refer to Figure 4B–4E).
Int – 75% It corresponds to the 75 percentile grey-level value of the expressionintensity inferred from cumulative density function curve (refer to Fig-ure 4B–4E).
Int – 90% It biologically correlates with the maximal positive expression density ofthe molecule in the ROI (refer to Figure 4B–4E).
Abbreviations: IHC, immunohistochemistry; ROI, region of interest; Int, intensity.
QUANTITATIVE MOLECULAR PATHOLOGY OF ORAL PRECANCER
HEAD & NECK—DOI 10.1002/HED MAY 2016 659
of positive expression. The threshold Th1veIHCis derived
image-specific using the clustering-based Otsu imagethresholding approach. The fraction of expression (fr-mol-ecule) feature is derived from DDAB image using the fol-lowing formulation (Eq. 10) and the biological relevancehas been explained in Table 2.
Th1veIHC �������Otsu
Thresholding
DDAB (9)
fr2molecule5Area of ROI DDAB � Th1ve
IHC
� �Area of ROI
(10)
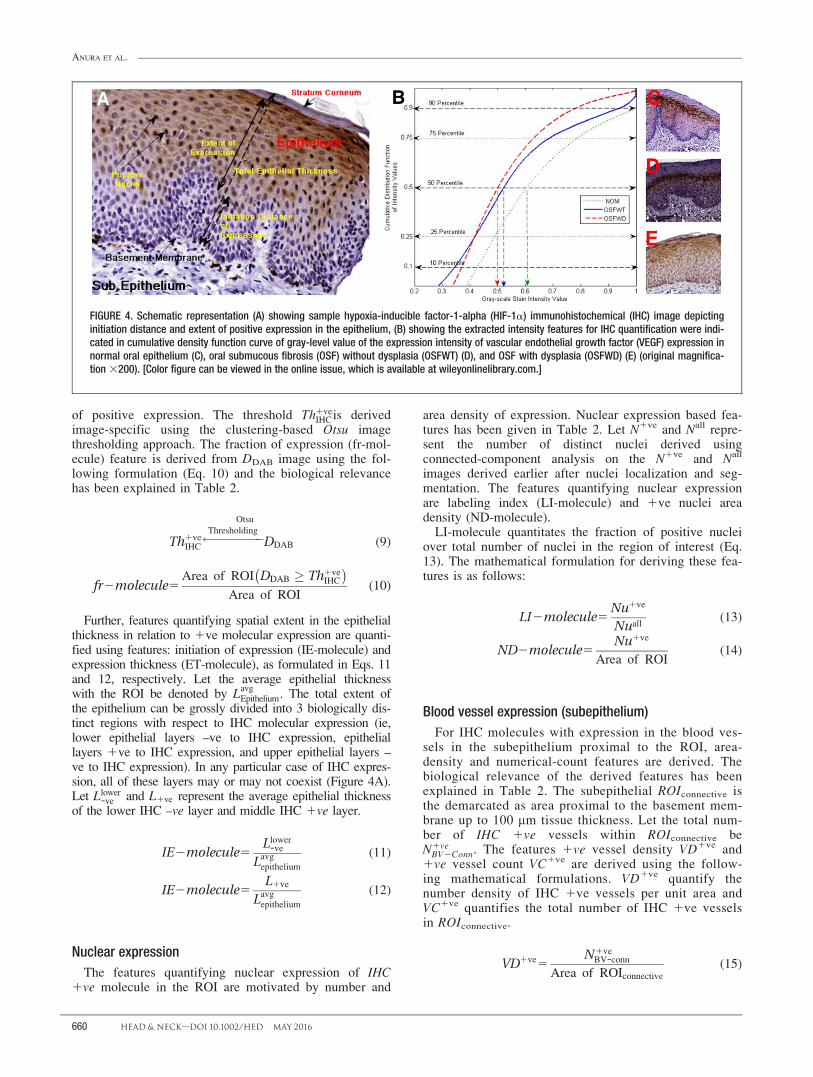
Further, features quantifying spatial extent in the epithelialthickness in relation to 1ve molecular expression are quanti-fied using features: initiation of expression (IE-molecule) andexpression thickness (ET-molecule), as formulated in Eqs. 11and 12, respectively. Let the average epithelial thicknesswith the ROI be denoted by Lavg
Epithelium. The total extent ofthe epithelium can be grossly divided into 3 biologically dis-tinct regions with respect to IHC molecular expression (ie,lower epithelial layers –ve to IHC expression, epitheliallayers 1ve to IHC expression, and upper epithelial layers –ve to IHC expression). In any particular case of IHC expres-sion, all of these layers may or may not coexist (Figure 4A).Let Llower
-ve and L1ve represent the average epithelial thicknessof the lower IHC –ve layer and middle IHC 1ve layer.
IE2molecule5Llower
-ve
Lavgepithelium
(11)
IE2molecule5L1ve
Lavgepithelium
(12)
Nuclear expression
The features quantifying nuclear expression of IHC1ve molecule in the ROI are motivated by number and
area density of expression. Nuclear expression based fea-tures has been given in Table 2. Let N1ve and Nall repre-sent the number of distinct nuclei derived usingconnected-component analysis on the N1ve and Nall
images derived earlier after nuclei localization and seg-mentation. The features quantifying nuclear expressionare labeling index (LI-molecule) and 1ve nuclei areadensity (ND-molecule).
LI-molecule quantitates the fraction of positive nucleiover total number of nuclei in the region of interest (Eq.13). The mathematical formulation for deriving these fea-tures is as follows:
LI2molecule5Nu1ve
Nuall(13)
ND2molecule5Nu1ve
Area of ROI(14)
Blood vessel expression (subepithelium)
For IHC molecules with expression in the blood ves-sels in the subepithelium proximal to the ROI, area-density and numerical-count features are derived. Thebiological relevance of the derived features has beenexplained in Table 2. The subepithelial ROIconnective isthe demarcated as area proximal to the basement mem-brane up to 100 mm tissue thickness. Let the total num-ber of IHC 1ve vessels within ROIconnective beN1ve
BV2Conn. The features 1ve vessel density VD1ve and1ve vessel count VC1ve are derived using the follow-ing mathematical formulations. VD1ve quantify thenumber density of IHC 1ve vessels per unit area andVC1ve quantifies the total number of IHC 1ve vesselsin ROIconnective.
VD1ve5N1ve
BV-conn
Area of ROIconnective
(15)
FIGURE 4. Schematic representation (A) showing sample hypoxia-inducible factor-1-alpha (HIF-1a) immunohistochemical (IHC) image depictinginitiation distance and extent of positive expression in the epithelium, (B) showing the extracted intensity features for IHC quantification were indi-cated in cumulative density function curve of gray-level value of the expression intensity of vascular endothelial growth factor (VEGF) expression innormal oral epithelium (C), oral submucous fibrosis (OSF) without dysplasia (OSFWT) (D), and OSF with dysplasia (OSFWD) (E) (original magnifica-tion 3200). [Color figure can be viewed in the online issue, which is available at wileyonlinelibrary.com.]
ANURA ET AL.
660 HEAD & NECK—DOI 10.1002/HED MAY 2016
VC1ve5N1veBV-conn (16)
Intensity of expression
For extraction of features descriptive of the intensity ofthe expression of the IHC stain in the ROI, we follow anexpression-histogram driven expression. Figure 4B repre-sents the cumulative density function curve of gray-levelvalue of the expression intensity of VEGF expression innormal oral mucosa, OSFWT, and OSFWD. The histo-gram of expression captures the global variation in theintensity level by associating the probability of expressionto each discredited intensity level. The histogram proba-bility PDAB was extracted on the density image PDAB
within the selected ROI (Eq. 17). Let HistDAB (i) repre-sent the histogram value for a 100-bin histogram at theintensity value (i). The range of intensity values (0–1) hasbeen discredited into 100 bins with a constant bin-widthof 0.01 units. The cumulative density function CDFDAB isextracted from PDAB using the following mathematicalformulation:
PDAB ið Þ5 HistDAB ið ÞX8j
HistDAB jð Þ(17)
CDFDAB jð Þ5Xi�j
i51
HistDABðiÞ (18)
A subset of features representative of the variance ofthe intensity profile is derived from CDFDAB as percen-tile measures. By definition, the feature Intx% isinferred from CDFDAB using the following relationship.For the present application, the extracted intensity fea-tures are Int10%, Int25%, Int50%, Int75%, and Int100%(Table 2).
Intx%5fijCDFDABðiÞ � 0:013xð Þ and
CDFDAB i21ð Þh 0:013xð Þg (19)
Statistical analysis for immunohistochemicalassessment
Before developing IHC quantification protocols andsubsequent assessment strategies based on them, a testfor statistical significance had to be performed on theproposed quantitative feature-set to gauge its potential toobjectify observations in a particular study group. Thus,a nonparametric Mann–Whitney U test was used toexamine the null hypothesis that both study groups havesimilar medial values and distributions against the alter-nate hypothesis that a particular study group has highervalues than the other. For the present work, the biologi-cally relevant groups considered were G1 5 normal oralmucosa versus OSFWT; G2 5 normal oral mucosa ver-sus OSFWD, and G3 5 OSFWT versus OSFWD. Theassociated directional trends (viz. increase 5 ",decrease 5 #, and no significant change 5 () ) werealso evaluated from the same test. Post-feature extractionand evaluation, the efficacy of each molecular markerwas evaluated using nonparametric multivariate analysisof variance.
RESULTS
Qualitative findings and supporting evidence for choiceof quantification strategy
In tissue, expression of a molecule has specific subcel-lular location (viz. nucleus, membrane, or cytoplasm) orECM, and also shows a unique distribution impressionin tissue, which changes significantly with disease mani-festation. Hence, extraction of a biologically relevantfeature for quantization of IHC expression of moleculeshas been performed based on detailed immunoreactivityprofiling of HIF-1a, c-MYC, VEGF, VEGFRII, andCD105.
Hypoxia-inducible factor-1-alpha
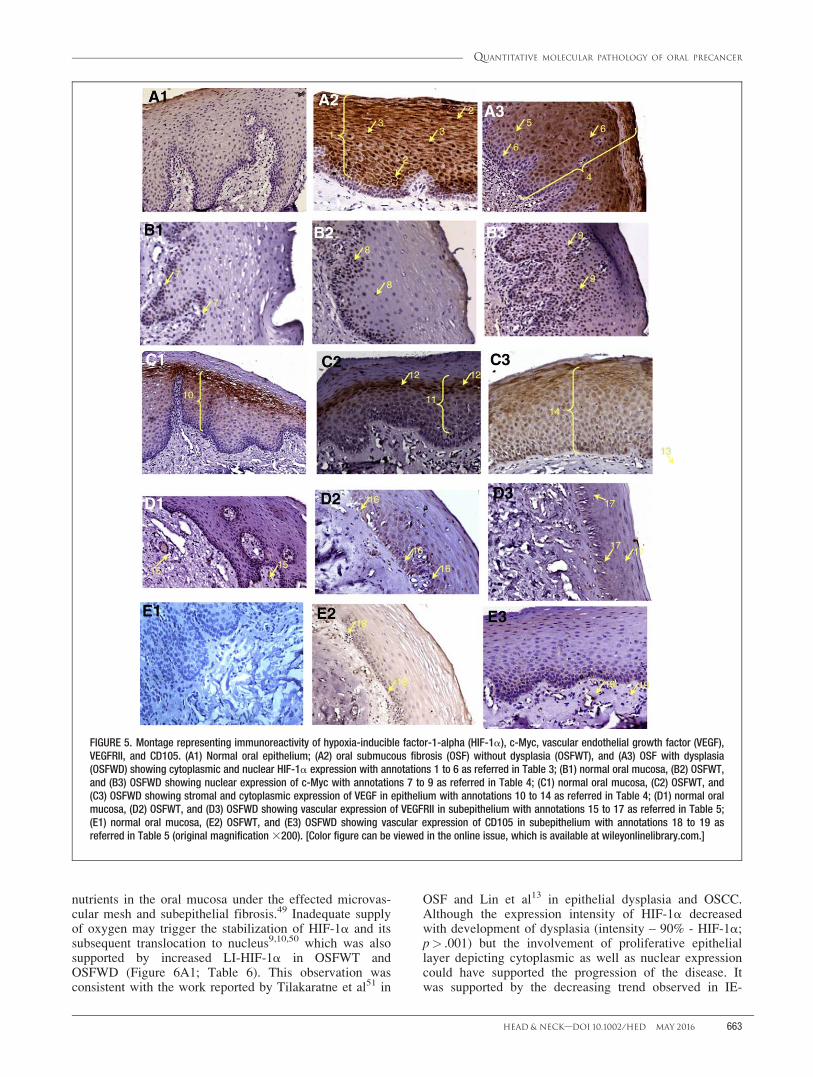
The major observations associated with HIF-1aexpression are given in Table 3 with IHC annotaion1–6
in Figure 5A1 to 5A3. As observed from Figure 5A1 to5A3 and Table 3. HIF-1a molecular expression is com-prised of both cytoplasmic and nuclear counterparts inaddition to intensity based signatures. Thus, the featuresubset pool selected for quantization of extent of cyto-plasmic expression included fr-HIF-1a, IE-HIF-1a, ET-HIF-1a, and LI-HIF-1a for nuclear expression, as givenin Table 2. The intensity of expression was quantifiedusing percentile-based scores derived from the expres-sion intensity cumulative distribution function (Table 2and Figure 4B).
c-Myc
The major observations associated with c-Myc expres-sion in the considered study groups are given in Table 4with IHC annotation (7–9) in Figure 5B1 to 5B3. Infer-ring from Figure 5B1 to 5B3 and Table 4, c-Myc immu-noreaction was predominantly nuclear and was bestcharacterized by the feature subset pool, including ND-c-Myc and fr-c-Myc, as given in Table 2. Differences inintensity of staining between normal oral mucosa andOSF conditions were characterized using the previouslydiscussed percentile-based scores discussed in Table 2and Figure 4B.
Vascular endothelial growth factor
The major observations associated with VEGF expres-sion in the study groups was tabulated in Table 4 withIHC annotations (10–14) in Figure 5C1 to 5C3. VEGFexpression mainly differed in extent and their localizationin different epithelial layers. This qualitative observationwas quantified by cytoplasmic expression features, includ-ing fr-VEGF, IE-VEGF, and ET-VEGF, as explained inTable 2. The intensity variation in expression density andtransitive diffused expression was characterized using thepreviously discussed percentile-based scores (Table 2 andFigure 4B).
Vascular endothelial growth factor receptor II
The major observations associated with VEGFRIIexpression is depicted in Table 5 with IHC annotations(15–17) in Figure 5D1 to 5D3. As the major differencesin VEGFRII expression are related to its density and
QUANTITATIVE MOLECULAR PATHOLOGY OF ORAL PRECANCER
HEAD & NECK—DOI 10.1002/HED MAY 2016 661
count in the subepithelium, the quantification featuresconsidered are VC-VEGFRII and VD-VEGFRII.
CD105
The major observations associated with CD105 expres-sion in study groups is given in Table 5 with IHC annota-tions (18–19) in Figure 5E1 to 5E3. The altered state ofCD105 expression is quantified using features like VC-CD105 and VD-CD105.
Statistical significance evaluation of feature trendsquantifying immunohistochemical
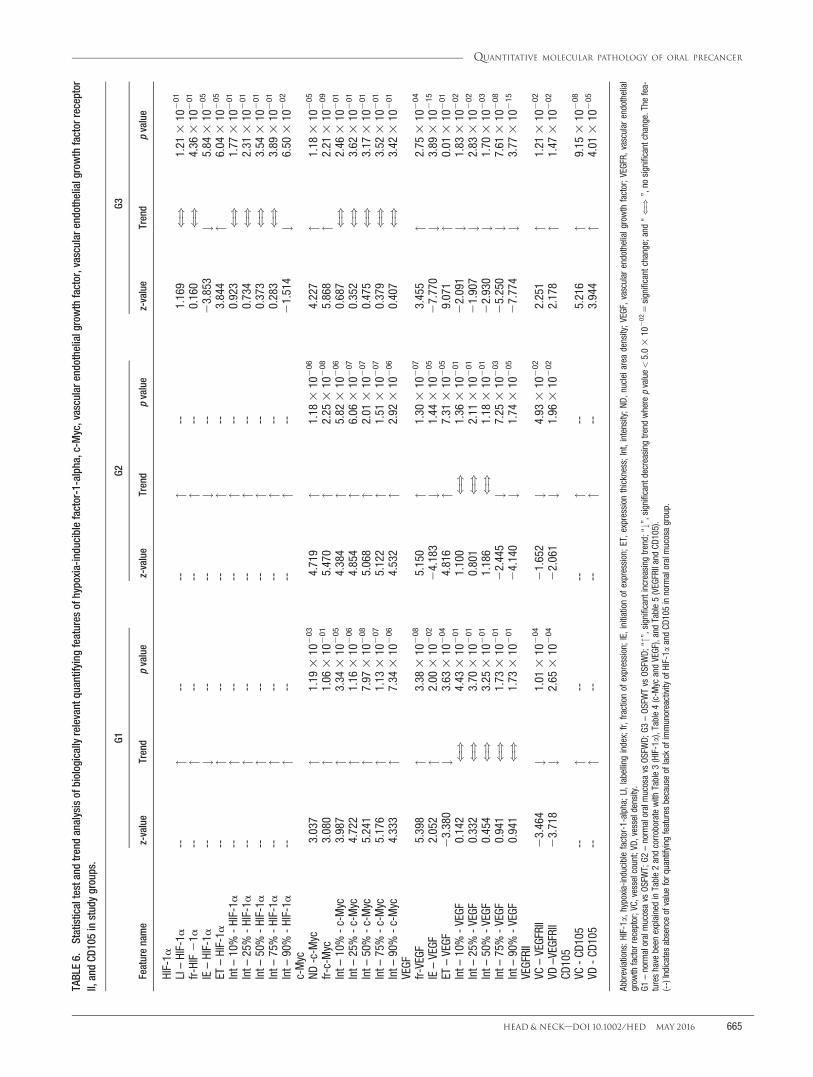
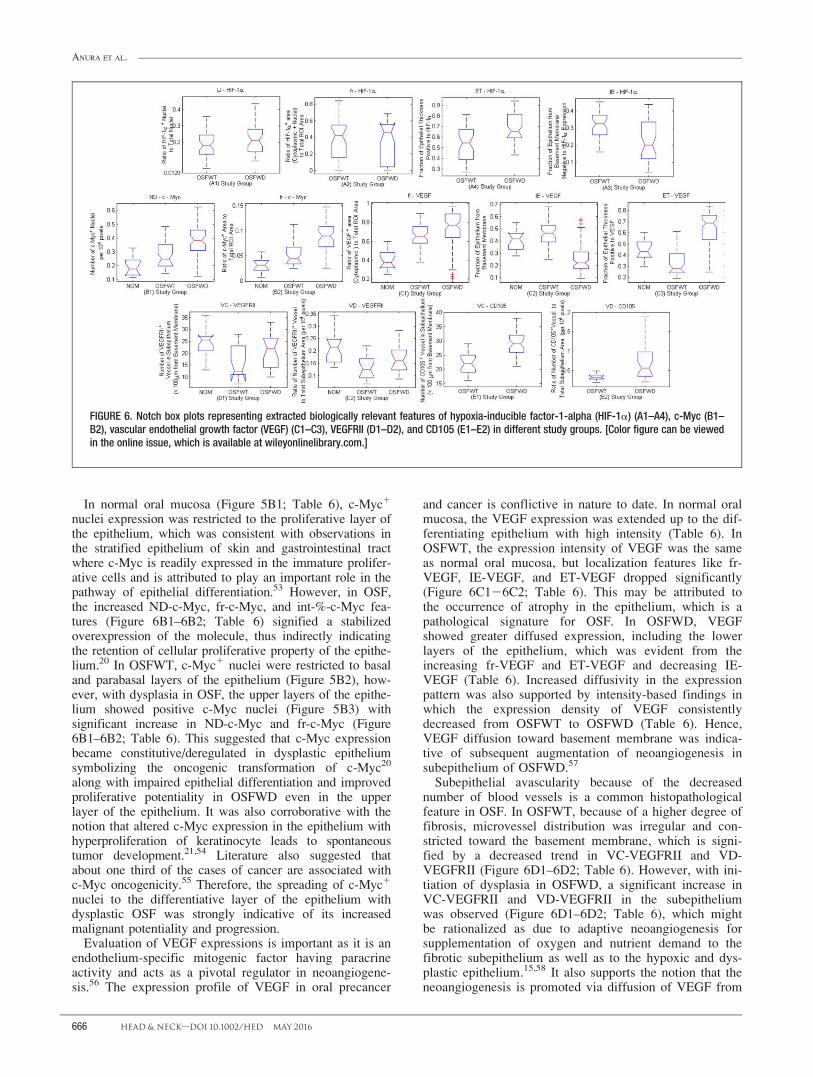
In case of HIF-1a immunoexpression, IE-HIF-1a andET-HIF-1a exhibited significant decreasing and increas-ing trends from OSFWT to OSFWD, respectively (Table6 and Figure 6A1–6A4). No significant differences wereobserved in the LI-HIF-1a and fr-HIF-1a features. Itmust be noted that, although normal oral mucosa showedlabile expression of HIF-1a, a significant change inexpression intensity varied in OSF conditions but theintensity pattern did not change significantly with pro-gression of OSFWT to OSFWD. On analyzing c-Mycexpression pattern, a statistically significant increasingtrend of ND-c-Myc and fr-c-Myc from normal oralmucosa to OSFWT to OSFWD was observed (Table 6and Figure 6B1–6B2). In evaluating VEGF features fromTable 6 and Figure 6C1 to 6C3, it was observed that fr-VEGF exhibited an increased trend from normal oralmucosa to OSFWT and further toward OSFWD. How-ever, features characterizing localization of VEGF expres-sion in the epithelium, like IE-VEGF, exhibited anincreasing trend from normal oral mucosa to OSFWT anda complementary decreasing trend from OSFWT toOSFWD. The supporting ET-VEGF exhibited the oppo-site trends as to IE-VEGF. The intensity-based findingsindicated that the expression density of VEGF consis-tently decreased from OSFWT to OSFWD. In case of
VEGFRII vascular expression (Table 6 and Figure 6D1–6D2), a decreasing trend was observed in VC-VEGFRIIand VD-VEGFRII comparing normal oral mucosa toOSFWT. These trends were reversed as disease pro-gresses into dysplasia (OSFWD). Further corroboratingwith trends in CD105 (Table 6 and Figure 6E1–6E2) weobserved an increasing trend of VC-CD105 and VD-CD105 features from OSFWT to OSFWD.
DISCUSSIONToward achieving greater diagnostic accuracy for
assessing progression of precancer, improved analysis ofmolecular signatures from IHC images is desired byoncopathologists and such diagnostic inferences can bereadily corroborated with histopathological gold standardalso.47 However, conventional manual scoring or semi-quantitative evaluation of IHC features are insufficient toexploit its potentiality as a true quantitative bioassay.6,48
Hence, computer-aided quantitative microscopic imageanalysis was30 adopted in this work toward accurate quan-tification of intensity and spatial attributes of immunore-activity for biologically correlated 5 target molecules viz.HIF-1a (an indicator of epithelial hypoxia), c-Myc,(proto-oncogene and epithelial cellular proliferationmarker), VEGF and VEGFRII (indicators of subepithelialneoangiogenesis), and CD105 (hypoxia-induced andtumorigenic vascular-specific marker) in the context ofdenoting the prospective markers of OSF conditions.
Interpretation and assessment of trends ofimmunohistochemical expression in oral submucousfibrosis
Increased HIF-1a expression in the epithelium, as indi-cated by significant increase in ET-HIF-1a (Figure 6A;Table 6) in OSFWT (Figure 5B) with comparison to nor-mal oral mucosa (Figure 5A) might be considered as anindicator for impairment in supply of oxygen and
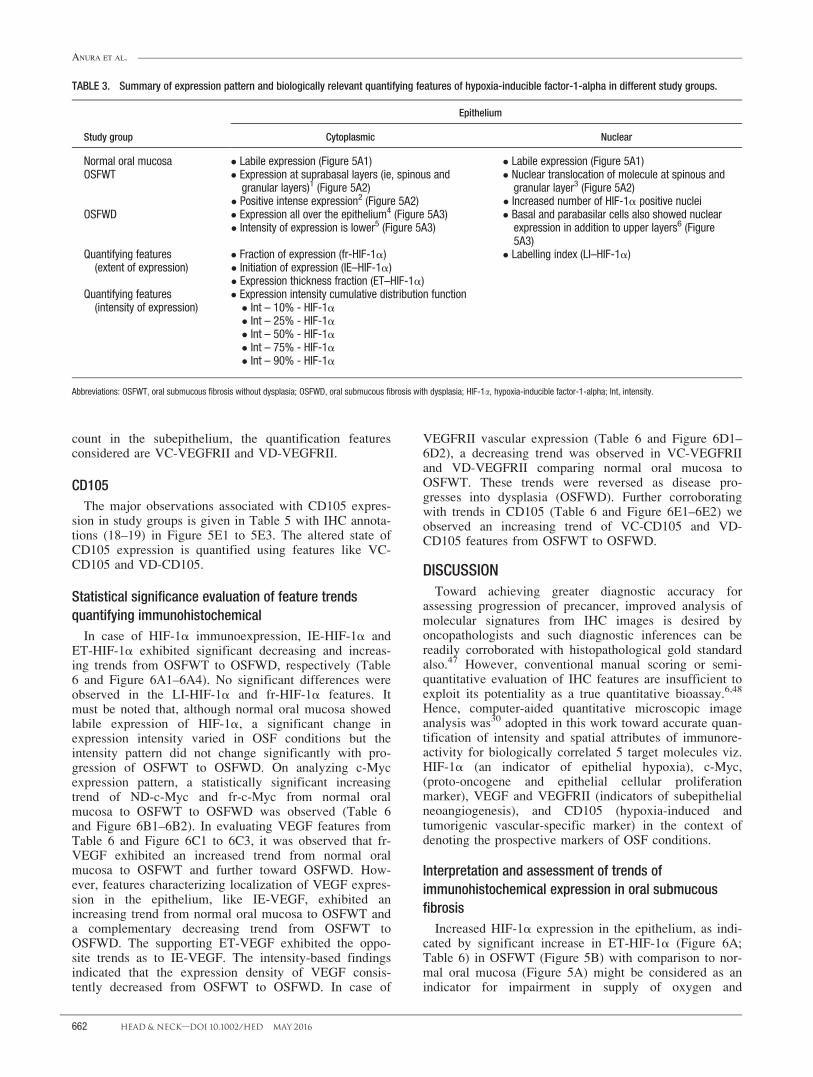
TABLE 3. Summary of expression pattern and biologically relevant quantifying features of hypoxia-inducible factor-1-alpha in different study groups.
Study group
Epithelium
Cytoplasmic Nuclear
Normal oral mucosa � Labile expression (Figure 5A1) � Labile expression (Figure 5A1)OSFWT � Expression at suprabasal layers (ie, spinous and
granular layers)1 (Figure 5A2)� Positive intense expression2 (Figure 5A2)
� Nuclear translocation of molecule at spinous andgranular layer3 (Figure 5A2)� Increased number of HIF-1a positive nuclei
OSFWD � Expression all over the epithelium4 (Figure 5A3)� Intensity of expression is lower5 (Figure 5A3)
� Basal and parabasilar cells also showed nuclearexpression in addition to upper layers6 (Figure5A3)
Quantifying features(extent of expression)
� Fraction of expression (fr-HIF-1a)� Initiation of expression (IE–HIF-1a)� Expression thickness fraction (ET–HIF-1a)
� Labelling index (LI–HIF-1a)
Quantifying features(intensity of expression)
� Expression intensity cumulative distribution function� Int – 10% - HIF-1a� Int – 25% - HIF-1a� Int – 50% - HIF-1a� Int – 75% - HIF-1a� Int – 90% - HIF-1a
Abbreviations: OSFWT, oral submucous fibrosis without dysplasia; OSFWD, oral submucous fibrosis with dysplasia; HIF-1a, hypoxia-inducible factor-1-alpha; Int, intensity.
ANURA ET AL.
662 HEAD & NECK—DOI 10.1002/HED MAY 2016
nutrients in the oral mucosa under the effected microvas-cular mesh and subepithelial fibrosis.49 Inadequate supplyof oxygen may trigger the stabilization of HIF-1a and itssubsequent translocation to nucleus9,10,50 which was alsosupported by increased LI-HIF-1a in OSFWT andOSFWD (Figure 6A1; Table 6). This observation wasconsistent with the work reported by Tilakaratne et al51 in
OSF and Lin et al13 in epithelial dysplasia and OSCC.Although the expression intensity of HIF-1a decreasedwith development of dysplasia (intensity – 90% - HIF-1a;p> .001) but the involvement of proliferative epitheliallayer depicting cytoplasmic as well as nuclear expressioncould have supported the progression of the disease. Itwas supported by the decreasing trend observed in IE-
FIGURE 5. Montage representing immunoreactivity of hypoxia-inducible factor-1-alpha (HIF-1a), c-Myc, vascular endothelial growth factor (VEGF),VEGFRII, and CD105. (A1) Normal oral epithelium; (A2) oral submucous fibrosis (OSF) without dysplasia (OSFWT), and (A3) OSF with dysplasia(OSFWD) showing cytoplasmic and nuclear HIF-1a expression with annotations 1 to 6 as referred in Table 3; (B1) normal oral mucosa, (B2) OSFWT,and (B3) OSFWD showing nuclear expression of c-Myc with annotations 7 to 9 as referred in Table 4; (C1) normal oral mucosa, (C2) OSFWT, and(C3) OSFWD showing stromal and cytoplasmic expression of VEGF in epithelium with annotations 10 to 14 as referred in Table 4; (D1) normal oralmucosa, (D2) OSFWT, and (D3) OSFWD showing vascular expression of VEGFRII in subepithelium with annotations 15 to 17 as referred in Table 5;(E1) normal oral mucosa, (E2) OSFWT, and (E3) OSFWD showing vascular expression of CD105 in subepithelium with annotations 18 to 19 asreferred in Table 5 (original magnification 3200). [Color figure can be viewed in the online issue, which is available at wileyonlinelibrary.com.]
QUANTITATIVE MOLECULAR PATHOLOGY OF ORAL PRECANCER
HEAD & NECK—DOI 10.1002/HED MAY 2016 663
HIF-1a and increasing trend of ET-HIF-1a (Figure6A3–6A4; Table 6). Further the increase in LI-HIF-1aand fr-HIF-1a (Figure 6A3–6A4; Table 6) suggestednuclear translocation of HIF-1a in OSFWD, which not
only indicated the augmented adaptation potentialityof oral dysplastic epithelium but also illustrated anincrease in its tumorigenic transformationpotentiality.52
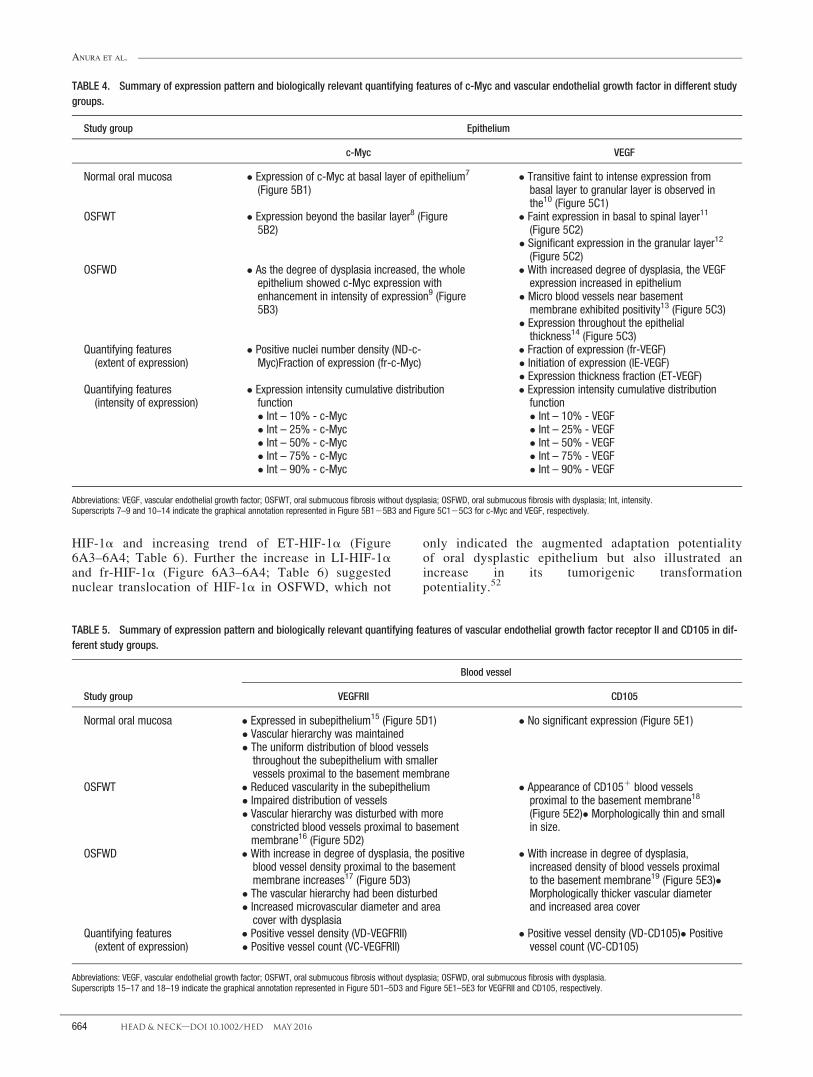
TABLE 4. Summary of expression pattern and biologically relevant quantifying features of c-Myc and vascular endothelial growth factor in different studygroups.
Study group Epithelium
c-Myc VEGF
Normal oral mucosa � Expression of c-Myc at basal layer of epithelium7
(Figure 5B1)� Transitive faint to intense expression from
basal layer to granular layer is observed inthe10 (Figure 5C1)
OSFWT � Expression beyond the basilar layer8 (Figure5B2)
� Faint expression in basal to spinal layer11
(Figure 5C2)� Significant expression in the granular layer12
(Figure 5C2)OSFWD � As the degree of dysplasia increased, the whole
epithelium showed c-Myc expression withenhancement in intensity of expression9 (Figure5B3)
� With increased degree of dysplasia, the VEGFexpression increased in epithelium� Micro blood vessels near basement
membrane exhibited positivity13 (Figure 5C3)� Expression throughout the epithelial
thickness14 (Figure 5C3)Quantifying features
(extent of expression)� Positive nuclei number density (ND-c-
Myc)Fraction of expression (fr-c-Myc)� Fraction of expression (fr-VEGF)� Initiation of expression (IE-VEGF)� Expression thickness fraction (ET-VEGF)
Quantifying features(intensity of expression)
� Expression intensity cumulative distributionfunction� Int – 10% - c-Myc� Int – 25% - c-Myc� Int – 50% - c-Myc� Int – 75% - c-Myc� Int – 90% - c-Myc
� Expression intensity cumulative distributionfunction� Int – 10% - VEGF� Int – 25% - VEGF� Int – 50% - VEGF� Int – 75% - VEGF� Int – 90% - VEGF
Abbreviations: VEGF, vascular endothelial growth factor; OSFWT, oral submucous fibrosis without dysplasia; OSFWD, oral submucous fibrosis with dysplasia; Int, intensity.Superscripts 7–9 and 10–14 indicate the graphical annotation represented in Figure 5B125B3 and Figure 5C125C3 for c-Myc and VEGF, respectively.
TABLE 5. Summary of expression pattern and biologically relevant quantifying features of vascular endothelial growth factor receptor II and CD105 in dif-ferent study groups.
Study group
Blood vessel
VEGFRII CD105
Normal oral mucosa � Expressed in subepithelium15 (Figure 5D1)� Vascular hierarchy was maintained� The uniform distribution of blood vessels
throughout the subepithelium with smallervessels proximal to the basement membrane
� No significant expression (Figure 5E1)
OSFWT � Reduced vascularity in the subepithelium� Impaired distribution of vessels� Vascular hierarchy was disturbed with more
constricted blood vessels proximal to basementmembrane16 (Figure 5D2)
� Appearance of CD1051 blood vesselsproximal to the basement membrane18
(Figure 5E2)� Morphologically thin and smallin size.
OSFWD � With increase in degree of dysplasia, the positiveblood vessel density proximal to the basementmembrane increases17 (Figure 5D3)� The vascular hierarchy had been disturbed� Increased microvascular diameter and area
cover with dysplasia
� With increase in degree of dysplasia,increased density of blood vessels proximalto the basement membrane19 (Figure 5E3)�Morphologically thicker vascular diameterand increased area cover
Quantifying features(extent of expression)
� Positive vessel density (VD-VEGFRII)� Positive vessel count (VC-VEGFRII)
� Positive vessel density (VD-CD105)� Positivevessel count (VC-CD105)
Abbreviations: VEGF, vascular endothelial growth factor; OSFWT, oral submucous fibrosis without dysplasia; OSFWD, oral submucous fibrosis with dysplasia.Superscripts 15–17 and 18–19 indicate the graphical annotation represented in Figure 5D1–5D3 and Figure 5E1–5E3 for VEGFRII and CD105, respectively.
ANURA ET AL.
664 HEAD & NECK—DOI 10.1002/HED MAY 2016
TABL
E6.
Stat
istic
alte
stan
dtr
end
anal
ysis
ofbi
olog
ical
lyre
leva
ntqu
antif
ying
feat
ures
ofhy
poxi
a-in
duci
ble
fact
or-1
-alp
ha,c
-Myc
,vas
cula
rend
othe
lialg
row
thfa
ctor
,vas
cula
rend
othe
lialg
row
thfa
ctor
rece
ptor
II,an
dCD
105
inst
udy
grou
ps.
G1G2
G3
Feat
ure
nam
ez-
valu
eTr
end
pva
lue
z-va
lue
Tren
dp
valu
ez-
valu
eTr
end
pva
lue
HIF-
1aLI
–HI
F-1a
--"
----
"--
1.16
9()
1.21
310
201
fr-HI
F2
1a--
"--
--"
--0.
160
()
4.36
310
201
IE–
HIF-
1a--
#--
--#
--2
3.85
3#
5.84
310
205
ET–
HIF-
1a--
"--
--"
--3.
844
"6.
043
102
05
Int–
10%
-HI
F-1a
--"
----
"--
0.92
3()
1.77
310
201
Int–
25%
-HI
F-1a
--"
----
"--
0.73
4()
2.31
310
201
Int–
50%
-HI
F-1a
--"
----
"--
0.37
3()
3.54
310
201
Int–
75%
-HI
F-1a
--"
----
"--
0.28
3()
3.89
310
201
Int–
90%
-HI
F-1a
--"
----
"--
21.
514
#6.
503
102
02
c-M
ycND
-c-M
yc3.
037
"1.
193
102
034.
719
"1.
183
102
064.
227
"1.
183
102
05
fr-c-
Myc
3.08
0"
1.06
310
201
5.47
0"
2.25
310
208
5.86
8"
2.21
310
209
Int–
10%
-c-
Myc
3.98
7"
3.34
310
205
4.38
4"
5.82
310
206
0.68
7()
2.46
310
201
Int–
25%
-c-
Myc
4.72
2"
1.16
310
206
4.85
4"
6.06
310
207
0.35
2()
3.62
310
201
Int–
50%
-c-
Myc
5.24
1"
7.97
310
208
5.06
8"
2.01
310
207
0.47
5()
3.17
310
201
Int–
75%
-c-
Myc
5.17
6"
1.13
310
207
5.12
2"
1.51
310
207
0.37
9()
3.52
310
201
Int–
90%
-c-
Myc
4.33
3"
7.34
310
206
4.53
2"
2.92
310
206
0.40
7()
3.42
310
201
VEGF
fr-VE
GF5.
398
"3.
383
102
085.
150
"1.
303
102
073.
455
"2.
753
102
04
IE–
VEGF
2.05
2"
2.00
310
202
24.
183
#1.
443
102
052
7.77
0#
3.89
310
215
ET–
VEGF
23.
380
#3.
633
102
044.
816
"7.
313
102
059.
071
"0.
013
102
01
Int–
10%
-VE
GF0.
142
()
4.43
310
201
1.10
0()
1.36
310
201
22.
091
#1.
833
102
02
Int–
25%
-VE
GF0.
332
()
3.70
310
201
0.80
1()
2.11
310
201
21.
907
#2.
833
102
02
Int–
50%
-VE
GF0.
454
()
3.25
310
201
1.18
6()
1.18
310
201
22.
930
#1.
703
102
03
Int–
75%
-VE
GF0.
941
()
1.73
310
201
22.
445
#7.
253
102
032
5.25
0#
7.61
310
208
Int–
90%
-VE
GF0.
941
()
1.73
310
201
24.
140
#1.
743
102
052
7.77
4#
3.77
310
215
VEGF
RII
VC–
VEGF
RII
23.
464
#1.
013
102
042
1.65
2#
4.93
310
202
2.25
1"
1.21
310
202
VD–V
EGFR
II2
3.71
8#
2.65
310
204
22.
061
#1.
963
102
022.
178
"1.
473
102
02
CD10
5VC
-CD
105
--"
----
"--
5.21
6"
9.15
310
208
VD-
CD10
5--
"--
--"
--3.
944
"4.
013
102
05
Abbr
evia
tions
:HIF
-1a,
hypo
xia-
indu
cibl
efa
ctor
-1-a
lpha
;LI,
labe
lling
inde
x;fr,
fract
ion
ofex
pres
sion
;IE,
initi
atio
nof
expr
essi
on;E
T,ex
pres
sion
thic
knes
s;In
t,in
tens
ity;N
D,nu
clei
area
dens
ity;V
EGF,
vasc
ular
endo
thel
ialg
row
thfa
ctor
;VEG
FR,v
ascu
lar
endo
thel
ial
grow
thfa
ctor
rece
ptor
;VC,
vess
elco
unt;
VD,v
esse
lden
sity
.G1
–no
rmal
oral
muc
osa
vsOS
FWT;
G2–
norm
alor
alm
ucos
avs
OSFW
D;G3
–OS
FWT
vsOS
FWD;
“"”,
sign
ifica
ntin
crea
sing
trend
;“#”
,sig
nific
antd
ecre
asin
gtre
ndw
here
pva
lue<
5.0
310
202
5si
gnifi
cant
chan
ge;a
nd“()
”,no
sign
ifica
ntch
ange
.The
fea-
ture
sha
vebe
enex
plai
ned
inTa
ble
2an
dco
rrob
orat
ew
ithTa
ble
3(H
IF-1
a),T
able
4(c
-Myc
and
VEGF
),an
dTa
ble
5(V
EGFR
IIan
dCD
105)
.(-
-)In
dica
tes
abse
nce
ofva
lue
forq
uant
ifyin
gfe
atur
esbe
caus
eof
lack
ofim
mun
orea
ctiv
ityof
HIF-
1aan
dCD
105
inno
rmal
oral
muc
osa
grou
p.
QUANTITATIVE MOLECULAR PATHOLOGY OF ORAL PRECANCER
HEAD & NECK—DOI 10.1002/HED MAY 2016 665
In normal oral mucosa (Figure 5B1; Table 6), c-Myc1
nuclei expression was restricted to the proliferative layer ofthe epithelium, which was consistent with observations inthe stratified epithelium of skin and gastrointestinal tractwhere c-Myc is readily expressed in the immature prolifer-ative cells and is attributed to play an important role in thepathway of epithelial differentiation.53 However, in OSF,the increased ND-c-Myc, fr-c-Myc, and int-%-c-Myc fea-tures (Figure 6B1–6B2; Table 6) signified a stabilizedoverexpression of the molecule, thus indirectly indicatingthe retention of cellular proliferative property of the epithe-lium.20 In OSFWT, c-Myc1 nuclei were restricted to basaland parabasal layers of the epithelium (Figure 5B2), how-ever, with dysplasia in OSF, the upper layers of the epithe-lium showed positive c-Myc nuclei (Figure 5B3) withsignificant increase in ND-c-Myc and fr-c-Myc (Figure6B1–6B2; Table 6). This suggested that c-Myc expressionbecame constitutive/deregulated in dysplastic epitheliumsymbolizing the oncogenic transformation of c-Myc20
along with impaired epithelial differentiation and improvedproliferative potentiality in OSFWD even in the upperlayer of the epithelium. It was also corroborative with thenotion that altered c-Myc expression in the epithelium withhyperproliferation of keratinocyte leads to spontaneoustumor development.21,54 Literature also suggested thatabout one third of the cases of cancer are associated withc-Myc oncogenicity.55 Therefore, the spreading of c-Myc1
nuclei to the differentiative layer of the epithelium withdysplastic OSF was strongly indicative of its increasedmalignant potentiality and progression.
Evaluation of VEGF expressions is important as it is anendothelium-specific mitogenic factor having paracrineactivity and acts as a pivotal regulator in neoangiogene-sis.56 The expression profile of VEGF in oral precancer
and cancer is conflictive in nature to date. In normal oralmucosa, the VEGF expression was extended up to the dif-ferentiating epithelium with high intensity (Table 6). InOSFWT, the expression intensity of VEGF was the sameas normal oral mucosa, but localization features like fr-VEGF, IE-VEGF, and ET-VEGF dropped significantly(Figure 6C126C2; Table 6). This may be attributed tothe occurrence of atrophy in the epithelium, which is apathological signature for OSF. In OSFWD, VEGFshowed greater diffused expression, including the lowerlayers of the epithelium, which was evident from theincreasing fr-VEGF and ET-VEGF and decreasing IE-VEGF (Table 6). Increased diffusivity in the expressionpattern was also supported by intensity-based findings inwhich the expression density of VEGF consistentlydecreased from OSFWT to OSFWD (Table 6). Hence,VEGF diffusion toward basement membrane was indica-tive of subsequent augmentation of neoangiogenesis insubepithelium of OSFWD.57
Subepithelial avascularity because of the decreasednumber of blood vessels is a common histopathologicalfeature in OSF. In OSFWT, because of a higher degree offibrosis, microvessel distribution was irregular and con-stricted toward the basement membrane, which is signi-fied by a decreased trend in VC-VEGFRII and VD-VEGFRII (Figure 6D1–6D2; Table 6). However, with ini-tiation of dysplasia in OSFWD, a significant increase inVC-VEGFRII and VD-VEGFRII in the subepitheliumwas observed (Figure 6D1–6D2; Table 6), which mightbe rationalized as due to adaptive neoangiogenesis forsupplementation of oxygen and nutrient demand to thefibrotic subepithelium as well as to the hypoxic and dys-plastic epithelium.15,58 It also supports the notion that theneoangiogenesis is promoted via diffusion of VEGF from
FIGURE 6. Notch box plots representing extracted biologically relevant features of hypoxia-inducible factor-1-alpha (HIF-1a) (A1–A4), c-Myc (B1–B2), vascular endothelial growth factor (VEGF) (C1–C3), VEGFRII (D1–D2), and CD105 (E1–E2) in different study groups. [Color figure can be viewedin the online issue, which is available at wileyonlinelibrary.com.]
ANURA ET AL.
666 HEAD & NECK—DOI 10.1002/HED MAY 2016
dysplastic epithelium toward the subepithelium and tohelp in epithelial cancerization.17,57 Similarly, CD1051
blood vessels showed an increasing trend in terms of bothVC-CD105 and VD-CD105 for OSFWT and OSFWD(Figure 6E1–6E2; Table 6). This may imply developmentof tumorigenic and abnormally differentiating microvas-culature in the subepithelium indicating its proclivitytoward potential malignant transformation tocarcinoma.17,58
Statistical evaluation of efficacy of molecular markersfor oral submucous fibrosis prognosis and riskstratification
An ideal molecular marker must have a strong biologi-cal premise and a significant change in the related diseaseclass59 and its relative identification should be procedur-ally quick, consistent, economical, and easily quantifiablein tissue samples.59 In this work, the chosen biologicalmolecules were observed to be associated with OSFpathogenesis and closely related to its malignant potential.Thus, to characterize the molecular expression profile, a3-fold approach (viz. intensity-based, spatial localization-based, or simultaneously both) was adopted. It is hypothe-sized that the spatial localization would act as value addi-tion to an intensity-based scoring system and effectively
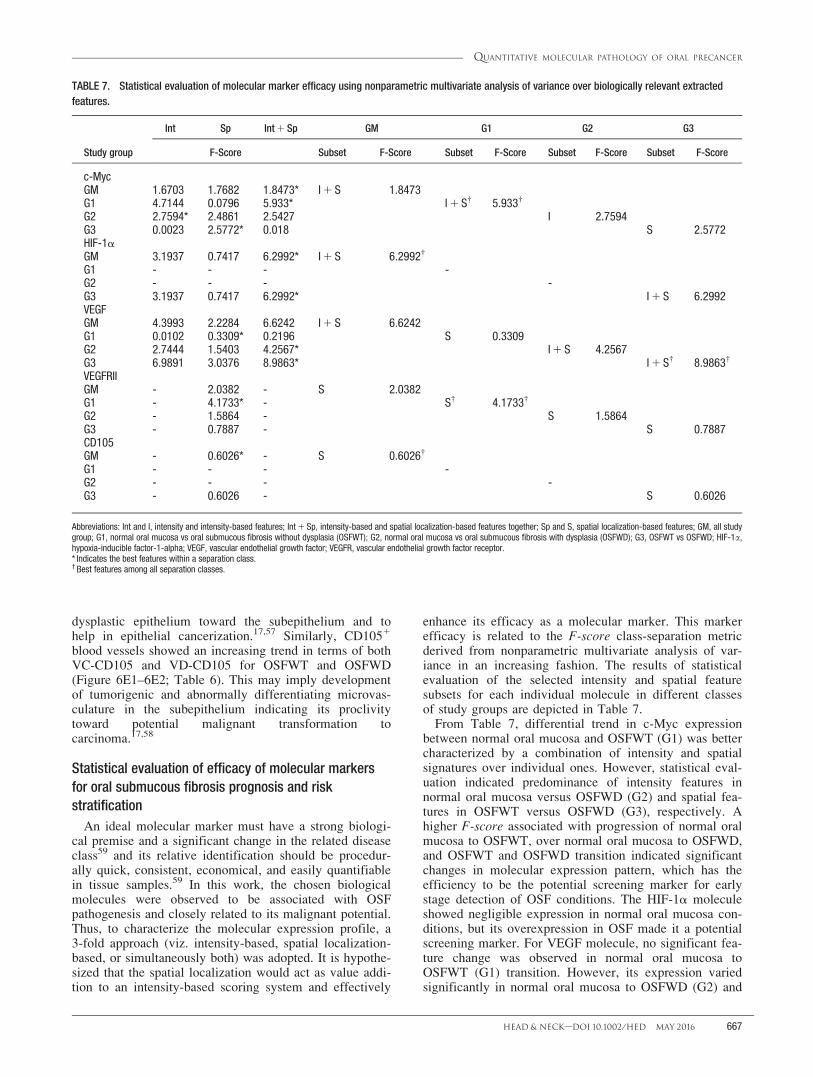
enhance its efficacy as a molecular marker. This markerefficacy is related to the F-score class-separation metricderived from nonparametric multivariate analysis of var-iance in an increasing fashion. The results of statisticalevaluation of the selected intensity and spatial featuresubsets for each individual molecule in different classesof study groups are depicted in Table 7.
From Table 7, differential trend in c-Myc expressionbetween normal oral mucosa and OSFWT (G1) was bettercharacterized by a combination of intensity and spatialsignatures over individual ones. However, statistical eval-uation indicated predominance of intensity features innormal oral mucosa versus OSFWD (G2) and spatial fea-tures in OSFWT versus OSFWD (G3), respectively. Ahigher F-score associated with progression of normal oralmucosa to OSFWT, over normal oral mucosa to OSFWD,and OSFWT and OSFWD transition indicated significantchanges in molecular expression pattern, which has theefficiency to be the potential screening marker for earlystage detection of OSF conditions. The HIF-1a moleculeshowed negligible expression in normal oral mucosa con-ditions, but its overexpression in OSF made it a potentialscreening marker. For VEGF molecule, no significant fea-ture change was observed in normal oral mucosa toOSFWT (G1) transition. However, its expression variedsignificantly in normal oral mucosa to OSFWD (G2) and
TABLE 7. Statistical evaluation of molecular marker efficacy using nonparametric multivariate analysis of variance over biologically relevant extractedfeatures.
Study group
Int Sp Int 1 Sp GM G1 G2 G3
F-Score Subset F-Score Subset F-Score Subset F-Score Subset F-Score
c-MycGM 1.6703 1.7682 1.8473* I 1 S 1.8473G1 4.7144 0.0796 5.933* I 1 S† 5.933†
G2 2.7594* 2.4861 2.5427 I 2.7594G3 0.0023 2.5772* 0.018 S 2.5772HIF-1aGM 3.1937 0.7417 6.2992* I 1 S 6.2992†
G1 - - - -G2 - - - -G3 3.1937 0.7417 6.2992* I 1 S 6.2992VEGFGM 4.3993 2.2284 6.6242 I 1 S 6.6242G1 0.0102 0.3309* 0.2196 S 0.3309G2 2.7444 1.5403 4.2567* I 1 S 4.2567G3 6.9891 3.0376 8.9863* I 1 S† 8.9863†
VEGFRIIGM - 2.0382 - S 2.0382G1 - 4.1733* - S† 4.1733†
G2 - 1.5864 - S 1.5864G3 - 0.7887 - S 0.7887CD105GM - 0.6026* - S 0.6026†
G1 - - - -G2 - - - -G3 - 0.6026 - S 0.6026
Abbreviations: Int and I, intensity and intensity-based features; Int 1 Sp, intensity-based and spatial localization-based features together; Sp and S, spatial localization-based features; GM, all studygroup; G1, normal oral mucosa vs oral submucous fibrosis without dysplasia (OSFWT); G2, normal oral mucosa vs oral submucous fibrosis with dysplasia (OSFWD); G3, OSFWT vs OSFWD; HIF-1a,hypoxia-inducible factor-1-alpha; VEGF, vascular endothelial growth factor; VEGFR, vascular endothelial growth factor receptor.* Indicates the best features within a separation class.† Best features among all separation classes.
QUANTITATIVE MOLECULAR PATHOLOGY OF ORAL PRECANCER
HEAD & NECK—DOI 10.1002/HED MAY 2016 667
OSFWT and OSFWD (G3) progression in both the fea-ture subsets, indicating its potential as a risk stratificationmolecular marker. It can help to estimate the likelymalignant transformation of OSF condition in relation toassociated neoangiogenesis. For evaluating the changes invascularity at the subepithelium during disease progres-sion, spatial localization of VEGFRII and CD105 expres-sion in endothelium had been considered. VEGFRII had asignificant class separation value in normal oral mucosaversus OSFWT (G1). Comparison of VEGFRII andCD105 expression in OSFWT versus OSFWD (G3) indi-cated higher class discrimination potential of VEGFRIIover CD105. However, it must be noted that presence ofCD105 expression can act as a strong indicator of vascu-lar aggressiveness in OSF, thus indicating it as a potentialprognostic marker. Further, considering all study groupstogether for c-Myc, HIF-1a, and VEGF molecules, it wasobserved that spatial features consistently augment con-ventional intensity-based scoring system by improvingtheir class separability (higher F-score) and thus enhancetheir efficacy as molecular markers.
In summary, the present work explored strategies forquantitative assessment of IHC attributes related to theexpressions of regulatory molecules associated with cellu-lar proliferation (c-Myc), hypoxia (HIF-1a), and angio-genesis (VEGF, VEGFRII, and CD105) in the context ofelucidating malignant potentiality of OSF. Among thestudied molecules, c-Myc and HIF-1a could haveemerged as potential screening markers, whereas VEGFcould be identified for risk stratification. Moreover, VEG-FRII and CD105 can be proposed to be suited as prognos-tic markers of OSF. In opening, this adopted imageanalysis approach provided a high-throughput platformfor quantifying chromogenic IHC through generating bio-logically relevant signatures based on localization andintensity of molecular expressions. Further, the incorpo-rated stain separation before feature extraction could haveenabled researchers to quantify the expression density ofthe target molecules without influence of backgroundcontribution from counter-stain. Essentially, the outcomeof this image analysis framework could be corroborativewith the available image analysis software for quantitativeIHC31 but incorporation of both intensity and spatial fea-tures in the present approach made it more robust inreducing intraobserver and interobserver variability.
AcknowledgmentThe authors thank the staff members of Laboratory ofMultimodal Imaging and Computing for Theranostics,SMST, for their help.
REFERENCES1. Pindborg JJ. Oral submucous fibrosis: a review. Ann Acad Med Singapore
1989;18:603–607.
2. Gupta MK, Mhaske S, Ragavendra R, Imtiyaz. Oral submucous fibrosis –current concepts in etiopathogenesis. People’s J Sci Res 2008;1:39–44.
3. Yoithapprabhunath T, Maheswaran T, Dineshshankar J, Anusushanth A,Sindhuja P, Sitra G. Pathogenesis and therapeutic intervention of oral sub-mucous fibrosis. J Pharm Bioallied Sci 2013;5(Suppl 1):S85–S88.
4. Tilakaratne WM, Klinikowski MF, Saku T, Peters TJ, Warnakulasuriya S.Oral submucous fibrosis: review on aetiology and pathogenesis. OralOncol 2006;42:561–568.
5. Warnakulasuriya S, Johnson NW, van der Waal I. Nomenclature and classi-fication of potentially malignant disorders of the oral mucosa. J OralPathol Med 2007;36:575–580.
6. Walker RA. Quantification of immunohistochemistry--issues concerningmethods, utility and semiquantitative assessment I. Histopathology 2006;49:406–410.
7. Bouquot JE, Speight PM, Farthing PM. Epithelial dysplasia of the oralmucosa--diagnostic problems and prognostic features. Curr Diagn Pathol2006;12:11–21.
8. Higgins DF, Kimura K, Iwano M, Haase VH. Hypoxia-inducible factor sig-naling in the development of tissue fibrosis. Cell Cycle 2008;7:1128–1132.
9. Greer SN, Metcalf JL, Wang Y, Ohh M. The updated biology of hypoxia-inducible factor. EMBO J 2012;31:2448–2460.
10. Weidemann A, Johnson RS. Biology of HIF-1alpha. Cell Death Differ2008;15:621–627.
11. Yoo YG, Hayashi M, Christensen J, Huang LE. An essential role of theHIF-1alpha-c-Myc axis in malignant progression. Ann N Y Acad Sci 2009;1177:198–204.
12. Pugh CW, Ratcliffe PJ. Regulation of angiogenesis by hypoxia: role of theHIF system. Nat Med 2003;9:677–684.
13. Lin PY, Yu CH, Wang JT, et al. Expression of hypoxia-inducible factor-1alpha is significantly associated with the progression and prognosis of oralsquamous cell carcinomas in Taiwan. J Oral Pathol Med 2008;37:18–25.
14. Bates DO. Vascular endothelial growth factors and vascular permeability.Cardiovasc Res 2010;87:262–271.
15. Menakuru SR, Brown NJ, Staton CA, Reed MW. Angiogenesis in pre-malignant conditions. Br J Cancer 2008;99:1961–1966.
16. Cheng SJ, Lee JJ, Kok SH, et al. Expression of vascular endothelial growthfactor is significantly associated with progression and prognosis of oralsquamous cell carcinomas in Taiwan. J Formos Med Assoc 2011;110:50–57.
17. Gandolfo M, Keszler A, Lanfranchi H, Itoiz ME. Increased subepithelialvascularization and VEGF expression reveal potentially malignant changesin human oral mucosa lesions. Oral Surg Oral Med Oral Pathol OralRadiol Endod 2011;111:486–493.
18. Fonsatti E, Altomonte M, Nicotra MR, Natali PG, Maio M. Endoglin(CD105): a powerful therapeutic target on tumor-associated angiogeneticblood vessels. Oncogene 2003;22:6557–6563.
19. Tokunaga O, Minhajat R, Mori D. Tumor angiogenesis in cancers: expres-sion of CD105 marker. In: Hayat MA, editor. Methods of Cancer Diagno-sis, Therapy, and Prognosis. Netherlands, UK: Springer Netherlands; 2010.pp 41–50.
20. Pelengaris S, Khan M, Evan G. c-MYC: more than just a matter of life anddeath. Nat Rev Cancer 2002;2:764–776.
21. Miliani de Marval PL, Macias E, Rounbehler R, et al. Lack of cyclin-dependent kinase 4 inhibits c-myc tumorigenic activities in epithelial tis-sues. Mol Cell Biol 2004;24:7538–7547.
22. Papakosta V, Vairaktaris E, Vylliotis A, et al. The co-expression of c-mycand p53 increases and reaches a plateau early in oral oncogenesis. Anti-cancer Res 2006;26:2957–2962.
23. Muthu Rama Krishnan M, Chakraborty C, Paul RR, Ray AK. Hybrid seg-mentation, characterization and classification of basal cell nuclei from his-topathological images of normal oral mucosa and oral submucous fibrosis.Expert Syst Appl 2012;39:1062–1077.
24. Abu Eid RF, Landini G. Oral epithelial dysplasia: can quantifiable morpho-logical features help in the grading dilemma? Presented at the Luxembourg2006 meeting as an abstract.
25. Muthu Rama Krishnan M, Venkatraghavan V, Chakraborty C. Knowledgebased segmentation, quantitative characterization and classification ofbasement membrane from oral histopathological images. J Med ImagingHealth Inform 2011;1:107–115.
26. Muthu Rama Krishnan M, Shah P, Pal M, et al. Structural markers for nor-mal oral mucosa and oral sub-mucous fibrosis. Micron 2010;41:312–320.
27. Muthu Rama Krishnan M, Chakraborty C, Paul RR, Ray AK. Quantitativeanalysis of sub-epithelial connective tissue cell population of oral submu-cous fibrosis using support vector machine. J Med Imaging Health Inform2011;1:4–12.
28. Yaziji H, Barry T. Diagnostic immunohistochemistry: what can go wrong?Adv Anat Pathol 2006;13:238–246.
29. Meijer GA, van Diest PJ, Brugghe J, Baak JPA. Quantitative immunohisto-chemistry of estrogen and progesterone receptor positivity in ovariantumors: a rapid and reliable stereological approach. In: Bartlett JMS, editor.Ovarian cancer methods and protocols. Totowa, NJ: Humana Press; 2000.pp 535–544.
30. Taylor CR, Levenson RM. Quantification of immunohistochemistry--issues concerning methods, utility and semiquantitative assessment II. His-topathology 2006;49:411–424.
31. Tuominen V, Ruotoistenm€aki S, Viitanen A, Jumppanen M, Isola J. Immu-noRatio: a publicly available web application for quantitative image analy-sis of estrogen receptor (ER), progesterone receptor (PR), and Ki-67.Breast Cancer Res 2010;12:R56.
32. Chatterjee S, Malhotra R, Varghese F, et al. Quantitative immunohisto-chemical analysis reveals association between sodium iodide symporterand estrogen receptor expression in breast cancer. PLoS One 2013;8:e54055.
33. Choudhury KR, Yagle KJ, Swanson PE, Krohn KA, Rajendran JG. Arobust automated measure of average antibody staining in immunohisto-chemistry images. J Histochem Cytochem 2010;58:95–107.
ANURA ET AL.
668 HEAD & NECK—DOI 10.1002/HED MAY 2016
34. Varghese F, Bukhari AB, Malhotra R, De A. IHC profiler: an open sourceplugin for the quantitative evaluation and automated scoring of immuno-histochemistry images of human tissue samples. PLoS One 2014;9:e96801.
35. Das RK, Pal M, Barui A, et al. Assessment of malignant potential of oralsubmucous fibrosis through evaluation of p63, E-cadherin and CD105expression. J Clin Pathol 2010;63:894–899.
36. Bag S, Conjeti S, Das RK, et al. Computational analysis of p63(1) nucleidistribution pattern by graph theoretic approach in an oral pre-cancer (sub-mucous fibrosis). J Pathol Inform 2013;4:35.
37. Pham NA, Morrison A, Schwock J, et al. Quantitative image analysis ofimmunohistochemical stains using a CMYK color model. Diagn Pathol2007;2:8.
38. Vrekoussis T, Chaniotis V, Navrozoglou I, et al. Image analysis of breastcancer immunohistochemistry-stained sections using ImageJ: an RGB-based model. Anticancer Res 2009;29:4995–4998.
39. Brown M, Lowe DG. Automatic panoramic image stitching using invariantfeatures. Int J Comput Vis 2007;74:59–73.
40. Tadrous PJ. Digital stain separation for histological images. J Microsc2010;240:164–172.
41. Brey EM, Lalani Z, Johnston C, et al. Automated selection of DAB-labeledtissue for immunohistochemical quantification. J Histochem Cytochem2003;51:575–584.
42. Ruifrok A. Quantification of immunohistochemical staining by color trans-lation and automated thresholding. Anal Quant Cytol Histol 1997;19:107–113.
43. Gonzalez RC, Woods RE. Digital image processing. Boston, MA: Addi-son–Wesley Longman Publishing Co., Inc.; 2001. p 793.
44. Soille P. Filtering. In: Morphological Image Analysis. Heidelberg, Berlin:Springer Berlin; 2004. pp 241–265.
45. Kurashov VN, Musatenko YS. Approximate Karhunen–Loeve transformfor image processing. Proc SPIE 1996. pp 73–82.
46. Koyuncu CF, Arslan S, Durmaz I, Cetin–Atalay R, Gunduz–Demir C.Smart markers for watershed-based cell segmentation. PLoS One 2012;7:e48664.
47. Spitz DJ, David O, Gattuso P, Haber MH. Special Diagnostic Techniquesin Surgical Pathology. Differential Diagnosis in Surgical Pathology secondedition. Philadelphia, PA: W.B. Saunders; 2010. pp 1–38.
48. Ruifrok AC, Johnston DA. Quantification of histochemical staining bycolor deconvolution. Anal Quant Cytol Histol 2001;23:291–299.
49. Squier CA, Kremer MJ. Biology of oral mucosa and esophagus. J NatlCancer Inst Monogr 2001;29:7–15.
50. Higgins DF, Kimura K, Bernhardt WM, et al. Hypoxia promotes fibrogene-sis in vivo via HIF-1 stimulation of epithelial-to-mesenchymal transition.J Clin Invest 2007;117:3810–3820.
51. Tilakaratne WM, Iqbal Z, Teh MT, et al. Upregulation of HIF-1alpha inmalignant transformation of oral submucous fibrosis. J Oral Pathol Med2008;37:372–377.
52. Semenza GL. Hypoxia-inducible factors in physiology and medicine. Cell2012;148:399–408.
53. Meyer N, Penn LZ. Reflecting on 25 years with MYC. Nat Rev Cancer2008;8:976–990.
54. Knies–Bamforth UE, Fox SB, Poulsom R, Evan GI, Harris AL. c-Mycinteracts with hypoxia to induce angiogenesis in vivo by a vascularendothelial growth factor-dependent mechanism. Cancer Res 2004;64:6563–6570.
55. Amente S, Lania L, Majello B. Epigenetic reprogramming of Myc targetgenes. Am J Cancer Res 2011;1:413–418.
56. Roskoski R Jr. Vascular endothelial growth factor (VEGF) signaling intumor progression. Crit Rev Oncol Hematol 2007;62:179–213.
57. Chen TT, Luque A, Lee S, Anderson SM, Segura T, Iruela–Arispe ML.Anchorage of VEGF to the extracellular matrix conveys differential signal-ing responses to endothelial cells. J Cell Biol 2010;188:595–609.
58. Astekar M, Joshi A, Ramesh G, Metgud R. Expression of vascular endothe-lial growth factor and microvessel density in oral tumorigenesis. J OralMaxillofac Pathol 2012;16:22–26.
59. Madu CO, Lu Y. Novel diagnostic biomarkers for prostate cancer.J Cancer 2010;1:150–177.
QUANTITATIVE MOLECULAR PATHOLOGY OF ORAL PRECANCER
HEAD & NECK—DOI 10.1002/HED MAY 2016 669