boris bernhardt, phd structural mri analysis · structural mri analysis boris bernhardt, phd ......
TRANSCRIPT

Structural MRI analysisBoris Bernhardt, PhD
NeuroImaging of Epilepsy Lab

structural MRI
T1-weighted MRI

methods
Surface-based analysisMRI volumetry Covariance mapping

applications
Individual differences Brain organizationBrain disorders

MRI volumetryidea: trace structure in 3D and count number of voxels

volumetry ‘pipeline’
input segmentread and become expert

alternative volumetry ‘pipeline’
input segmentautomatic segmentation approaches
Kim et al. (2011) MedImaAnal
Chupin et al. (2009) NeuroImage
Coupe et al. (2010) MICCAI

Head
Body
Tail
T1-weighted MRI
T2-weighted MRI Label
Subiculum Cornu Ammonis 1-3 CA4-Dentate Gyrus
Kulaga-Yoskovitz and Bernasconi
subfield volumetry
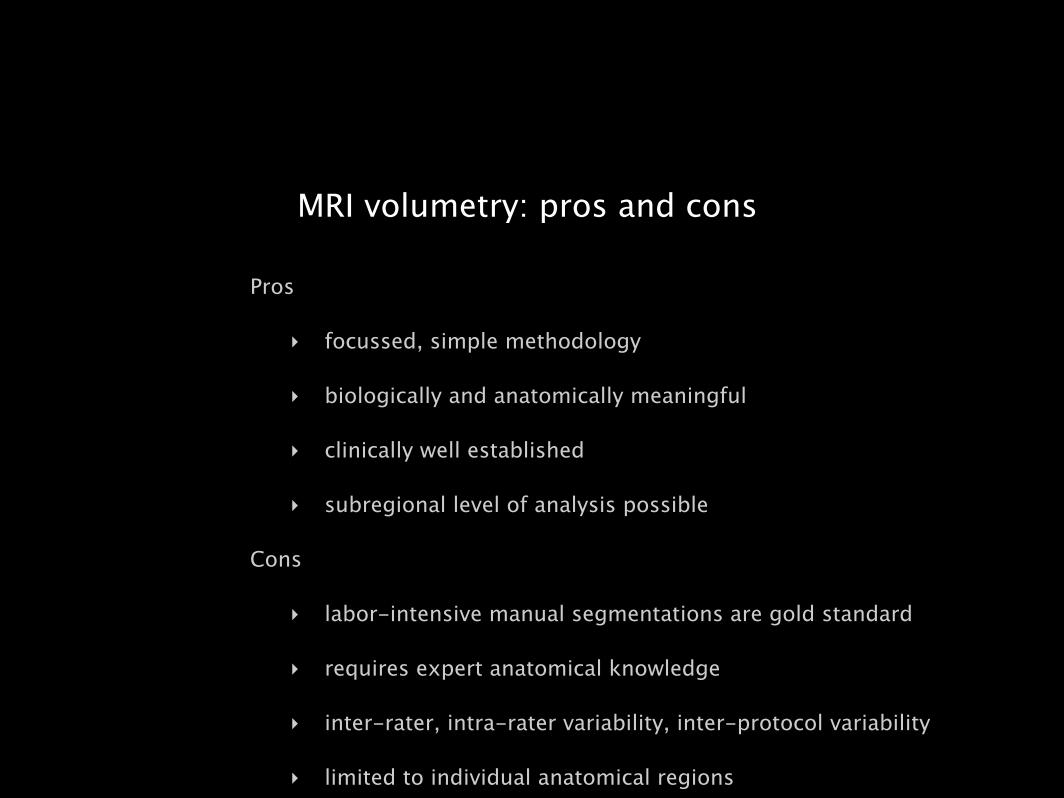
Pros
‣ focussed, simple methodology
‣ biologically and anatomically meaningful
‣ clinically well established
‣ subregional level of analysis possible
Cons
‣ labor-intensive manual segmentations are gold standard
‣ requires expert anatomical knowledge
‣ inter-rater, intra-rater variability, inter-protocol variability
‣ limited to individual anatomical regions
MRI volumetry: pros and cons

Measuring cortical thickness on MRIidea: identify GM/WM and GM/CSF, measure their distance

MRI-based cortical thickness measurements

some processing...
CIVET
OMM: March 17
MacDonald et al. (2000) NeuroImage
Kim et al. (2005) NeuroImage

WM surface

GM surface

measurement of cortical thickness

20 mm
surfreg
subject template
surface-based processing
Chung et al. (2003) NeuroImageRobbins et al. (2004) MedImaAnalysis
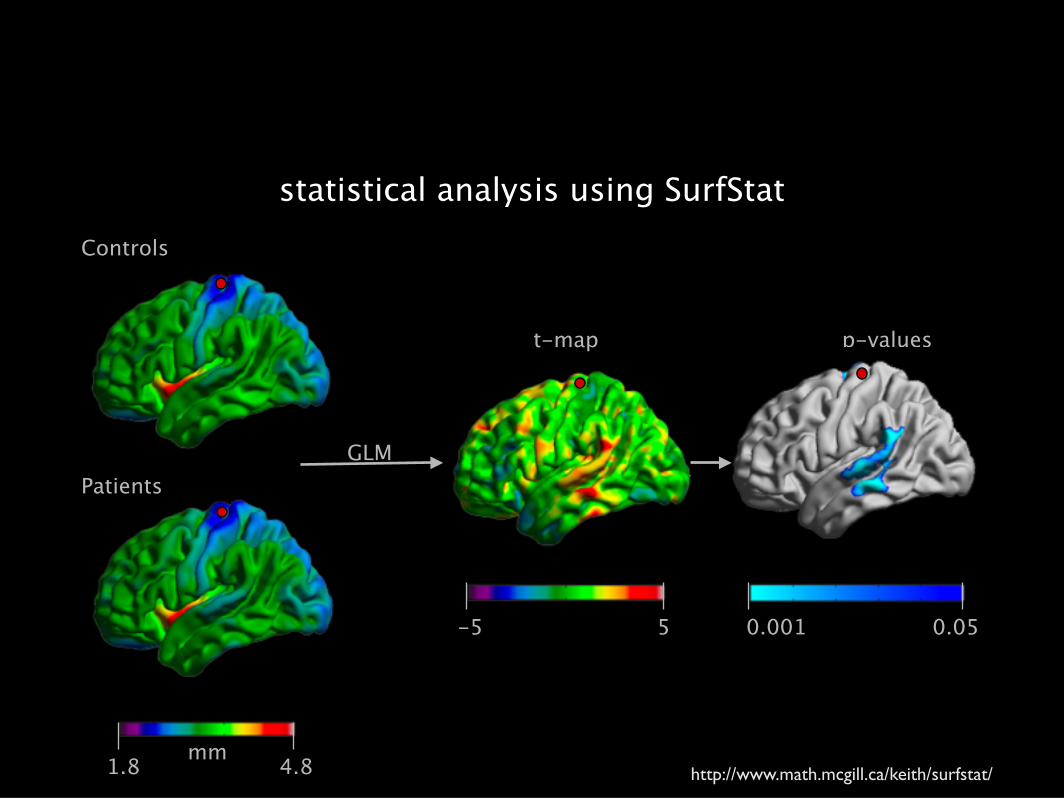
statistical analysis using SurfStatControls
Patients
t-map p-values
mm
-5 5 0.001 0.05
1.8 4.8
GLM
http://www.math.mcgill.ca/keith/surfstat/

Pros
‣ automated, continuous, whole-cortex
‣ processing and measurement respect cortical topology
‣ direct, biologically meaningful, mm-measure
‣ surface-registration may increase sensitivity
Cons
‣ heavy post-processing (4-25 hours/case)
‣ dependent on classification
‣ manual corrections often necessary
‣ limited to (neo)cortex
cortical thickness: pros and cons

Surface-based analysis of subcortical shapeidea: take advantage of surface-based framework to assess subregional changes

[mm]
SPHARM-PDMdisplacement from subject to templateAlignment along long axisSPHARM-PDM
Styner, Gerig et al. (2006), Kim et al. (2008)http://pages.stat.wisc.edu/~mchung/research/amygdala/

Methods: surface-based statistical analysis
disp = 1 + GROUP + ε
disp = 1 + AGE + ε
Group 1 Group 2
http://www.math.mcgill.ca/keith/surfstat/
statistical analysis with SurfStat
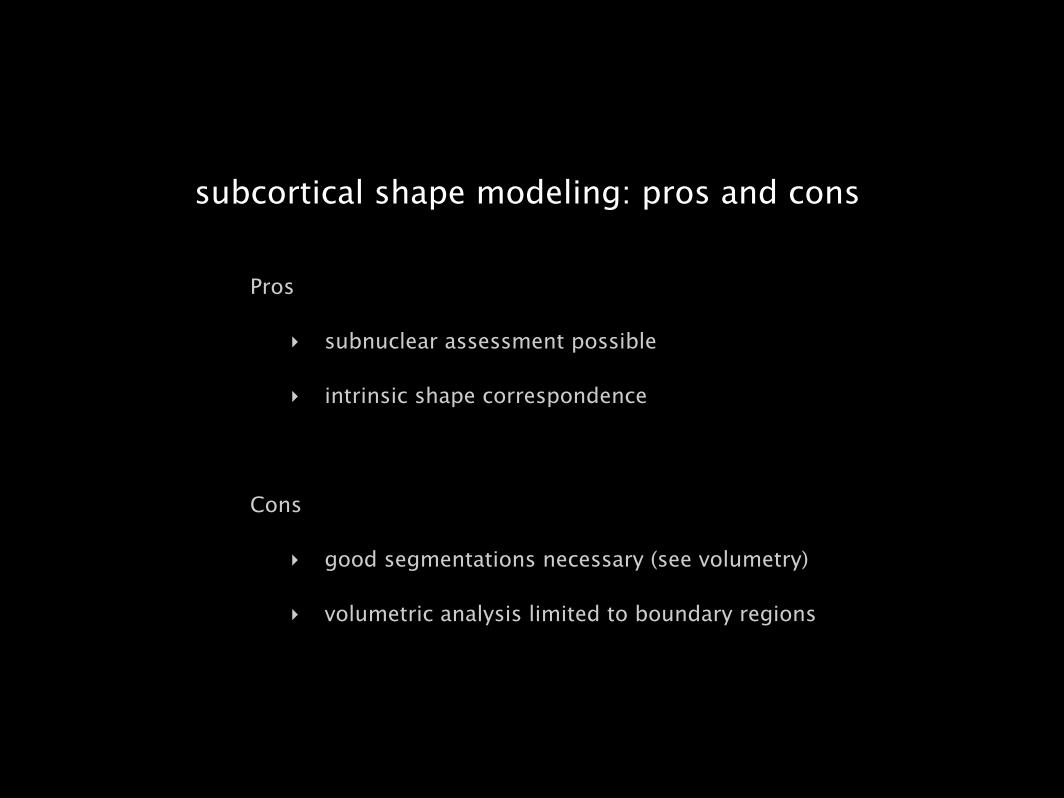
Pros
‣ subnuclear assessment possible
‣ intrinsic shape correspondence
Cons
‣ good segmentations necessary (see volumetry)
‣ volumetric analysis limited to boundary regions
subcortical shape modeling: pros and cons

Structural covariance analysis
Bernhardt, Klimecki, Leiberg, Singer (2013) Cerebral Cortex
Covariance modulation by differences in self-reported empathy
Structural covariance network mappingidea: connections = structural correlations between regions across subjects

structural covariance network mapping
Lerch et al. (2006) NeuroImageAlexander-Bloch et al. (2013) Nat Rev Neurosci

Network construction
Bernhardt et al. (2011) CerCor
covariance network construction

Clustering coefficient (C)
graph-theoretical network metrics
Characteristic path length (C)
L = high L = lowC = low C = high
3 1
2
4
2 1
2
1
Watts and Strogatz (1998) NatureBullmore and Sporns (2009) Nat Rev Neurosci

random
network topology
regular lattice networksmall-world regime
↓LP ↓CP ↓LP ↑CP ↑LP ↑CPWatts and Strogatz (1998) Nature
Bullmore and Sporns (2009) Nat Rev Neurosci

correspondence to other MRI networks
positive correlation negative correlation
Gong, He, Chen, Evans (2010) NIMG Alexander-Bloch, Bullmore, Giedd (2013) JNeurosci

Pros
‣ relatively straightforward modeling
‣ seeding from within grey matter regions
‣ T1w-MRI less artifacts than epi-MRIs, higher resolution
Cons
‣ no direct correspondence with anatomical connections
‣ however: process-based interpretation (e.g., maturation)
‣ restricted to group-level analysis (but see, Tijms et al. 2011)
‣ reviewers often request relatively large samples
structural covariance analysis: pros and cons

applications
Individual differences Brain organizationBrain disorders

Structural covariance analysis
Bernhardt, Klimecki, Leiberg, Singer (2013) Cerebral Cortex
Covariance modulation by differences in self-reported empathy
Structural substrates of individual differences in cognitive functioning

‣ assessed brain correlates of cognitive and affective processes
‣ task-based
‣ using functional MRI
‣ localization of function
‣ individual differences in cognitive skills
‣ however:
‣ the biological basis of such differences incompletely understood
‣ structural MRI has been underused to study cognition
‣ off-task thought (aka mind-wandering) less frequently studied
cognitive neuroscience
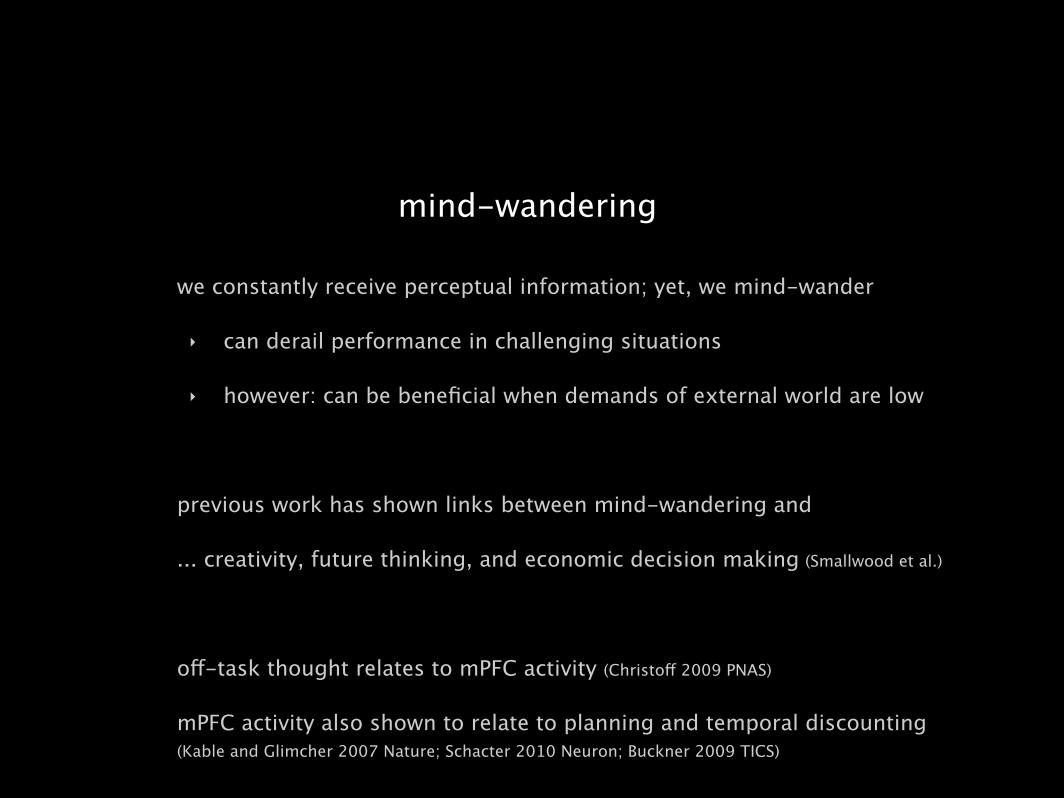
mind-wandering
we constantly receive perceptual information; yet, we mind-wander
‣ can derail performance in challenging situations
‣ however: can be beneficial when demands of external world are low
previous work has shown links between mind-wandering and
... creativity, future thinking, and economic decision making (Smallwood et al.)
off-task thought relates to mPFC activity (Christoff 2009 PNAS)
mPFC activity also shown to relate to planning and temporal discounting (Kable and Glimcher 2007 Nature; Schacter 2010 Neuron; Buckner 2009 TICS)

methods
to assess possibly adaptive mind-wandering
‣ task-unrelated thought during easy task (CRT) compared to hard task (WM)
‣ measure discounting as marker of patient decision-making
structural substrates of individual differences in tut and discounting
37 healthy controls; behavioral analysis; correlation with cortical thickness

mind-wandering and temporal discounting
Bernhardt, Smallwood, et al. (2014) NIMG
n=37
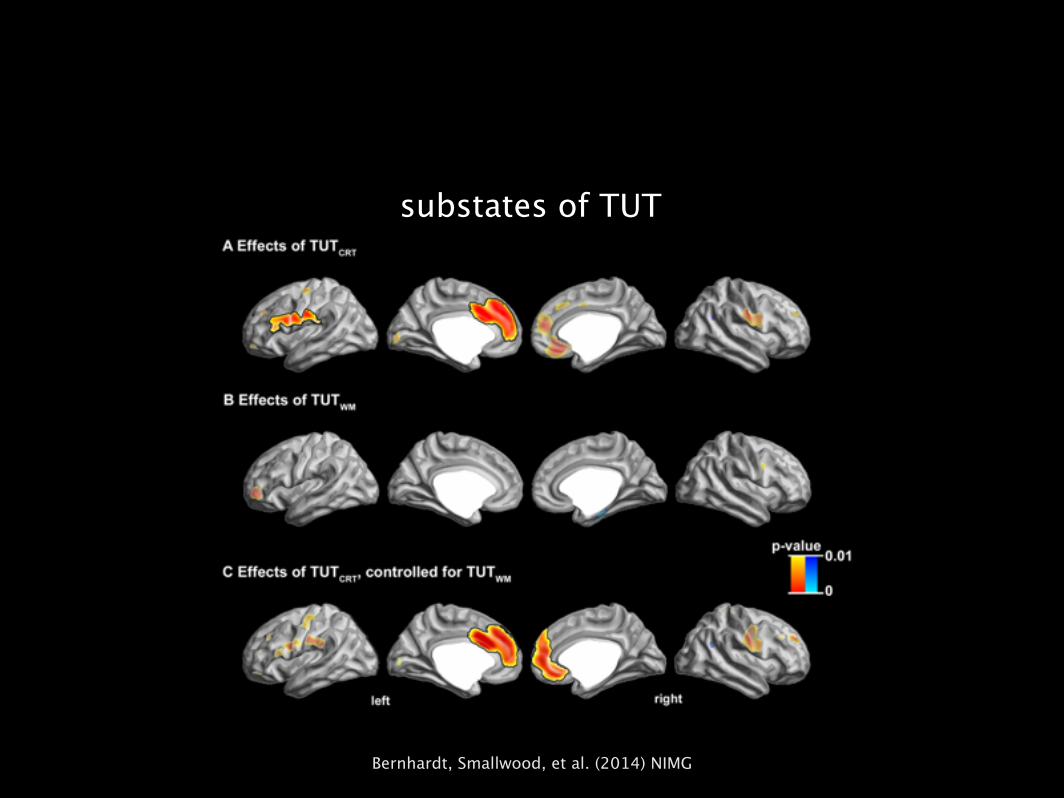
substates of TUT
Bernhardt, Smallwood, et al. (2014) NIMG
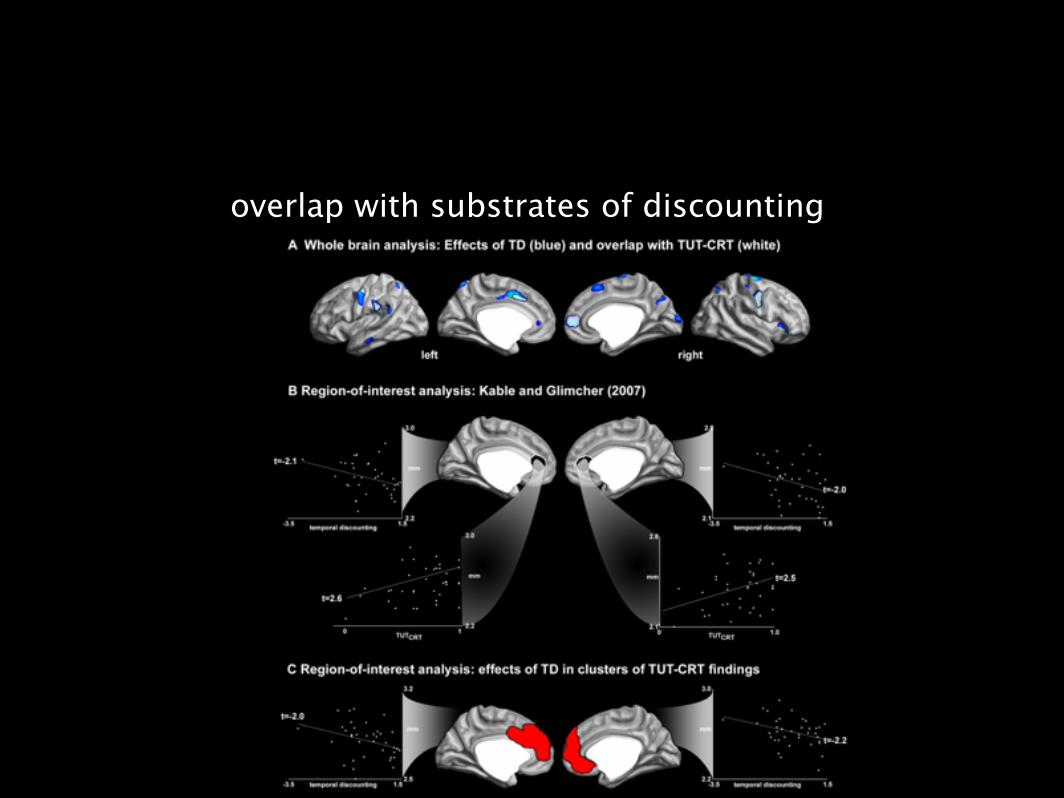
overlap with substrates of discounting

conclusion
substrates of ability to adaptively decouple from here and now
‣ mind-wandering during easy but not hard task
‣ patient economic decision making
overlap in mPFC/ACC
‣ confirm functional MRI showing role of these regions in decoupled thought
‣ role in control / evaluation of information from memory
‣ self-projection (Buckner and Caroll 2009 TICS)
‣ mPFC/ACC strongly interconnected with mesiotemporal memory systems

Structural covariance analysis
Bernhardt, Klimecki, Leiberg, Singer (2013) Cerebral Cortex
Covariance modulation by differences in self-reported empathy
Structural MRI analyses in temporal lobe epilepsy

‣ temporal lobe epilepsy (TLE) most common drug-resistant epilepsy in adults
‣ seizures originate in TL, pathology often shows mesiotemporal sclerosis (MTS)
‣ hippocampal atrophy on MRI marker of MTS, lateralizes focus in 70%
‣ HA diagnosis: better chances of seizure-free surgical outcome
‣ long-term seizure-freedom in 50-80% of patients
‣ outcome prediction challenging
‣ outcome likely relates to brain damage outside mesiotemporal lobe
TLE
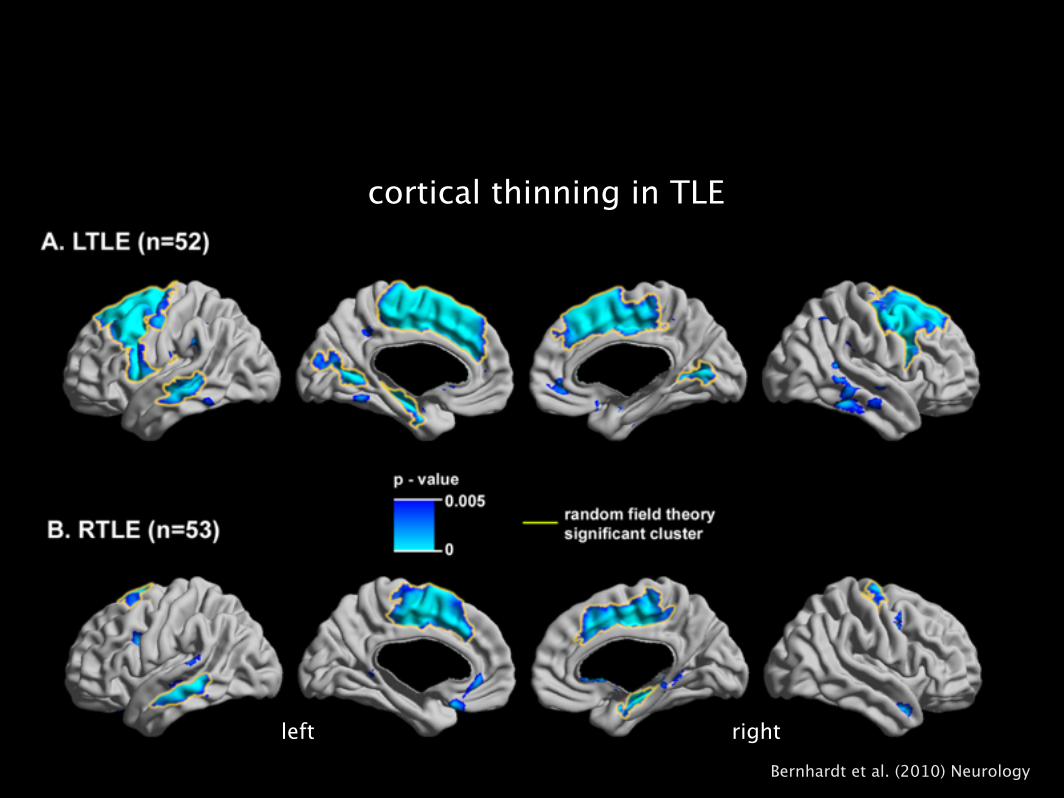
cortical thinning in TLE
left rightBernhardt et al. (2010) Neurology

left right
influence of hippocampal atrophy
left rightBernhardt et al. (2010) Neurology

‣ cortical thinning in fronto-central and lateral temporal neocortex
‣ seen across the spectrum of TLE
‣ seen at 1.5T, 3T, with CLASP and FreeSurfer (McDonald 2008 Epilepsia; Mueller 2010 NIMG)
‣ consistent with pathological examination (Blanc 2011 Epilepsia)
‣ widespread pathology indicative of system-level network alterations
‣ motivation for graph theoretical network analysis
interim conclusion 1

Network construction
Bernhardt et al. (2011) CerCor
addressing system pathology in TLE
n=63 LTLE, 59 RTLE, 47 controls

network regularization in TLEA Clustering coefficient (C)
B Path length (P)
Bernhardt et al. (2011) CerCor
3 1
2
4
2 1
2
1
highlow
lowhigh

A Clustering coefficient (C)
B Path length (P)
50 SF versus 40 NSF
relationship to outcome
Bernhardt et al. (2011) CerCor
3 1
2
4
2 1
2
1
highlow
lowhigh

interim conclusion 2
TLE system disorder
‣ cortico-cortical network regularization (↑P, ↑C)
‣ degree of network pathology relates to outcome
↑P
‣ likely indicative of disruptions in cortico-cortical connections(Concha 2005 Annals Neurology; Focke 2008 NIMG)
‣ may relate to cognitive impairments in TLE
↑C
‣ increased pathological coupling in affected subnetworks
‣ possibly indicative of shared sensitivity to insults

...unpublished stuff not shown

overall summary
structural MRI permits
‣ mapping substrates individual differences
‣ brain network analysis
‣ assessing brain pathology and biomarker discovery
complimentary tools can be used for meaningful analysis
‣ MRI volumetry
‣ surface-based methods
‣ structural MRI covariance analysis
overall summary

merci!Neda and Andrea Bernasconi
Hosung Kim
Seok-Jun Hong
Jessie Kulaga-Yoskovitch
Benoit Caldairou
Min Liu
Luis Concha
Dewi Schrader
Alan Evans
Jason Lerch
Yong He
John Chen
Sebastian Dery
Tania Singer
Jonathan Smallwood
Sofie Valk
Nikolaus Steinbeis
Daniel Margulies
Giorgia Silani
Geoffrey Bird
Uta Frith
Jeanne Timmins Costello Fellowship (MNI)
Savoy Foundation
DAAD
Studienstiftung
CIHR